Chesnara HALF YEAR RESULTS 2019 - 29 August 2019 - Chesnara plc
←
→
Page content transcription
If your browser does not render page correctly, please read the page content below

HALF YEAR RESULTS
                          2019
                          29 August 2019

                          Chesnara

 Dividend track record continues

2004 2005 2006 2007 2008 2009 2010 2011 2012 2013 2014 2015 2016 2017 2018 2019
                                                                         (interim)
AGENDA

    OVERVIEW - John Deane, Chief Executive
          –     Strategic delivery
          –     2019 half year financial highlights
          –     2019 half year operational & strategic highlights

    BUSINESS REVIEW - John Deane, Chief Executive
          –     UK
          –     Sweden
          –     Netherlands
          –     Acquire life & pensions businesses
    FINANCIAL REVIEW - David Rimmington, Group Finance Director
          –     Measuring our performance
          –     IFRS pre-tax profit & IFRS total comprehensive income
          –     Symmetric adjustment
          –     Cash generation
          –     Solvency II
          –     Sensitivities
          –     Value movement in 2019
          –     Value growth
    CONCLUSION & OUTLOOK - John Deane, Chief Executive
          –     Future priorities
    QUESTIONS

    APPENDICES
          –     Historical data - headline results
          –     Historical data - dividend history

CHESNARA | 2019 HALF YEAR RESULTS PRESENTATION                          1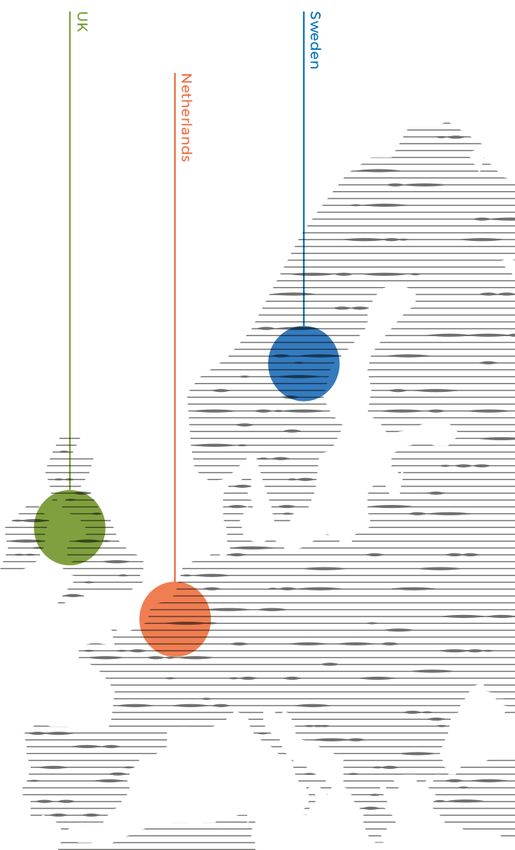
John Deane
            Chief Executive Officer

            OVERVIEW

CHESNARA | 2019 HALF YEAR RESULTS PRESENTATION   2
OVERVIEW – STRATEGIC DELIVERY
During the first half of 2019 we delivered good growth in Economic Value. The closing
Economic Value of £645.1m is 3% higher than at the end of 2018, after payment of the 2018
final dividend of £20.2m, despite the negative impact of a weakening Swedish krona.
Falls in interest rates, a recovering equity market and the impact, in Sweden and the UK, of
the symmetric adjustment (see slide 17 for further details) , required under Solvency II rules, created
generally adverse conditions for cash generation. However, our strong cash balance at
group along with the half year performance supports the increase of our interim dividend.
MAXIMISE VALUE FROM ACQUIRE LIFE AND PENSION ENHANCE VALUE THROUGH
01 02 03
EXISTING BUSINESS BUSINESSES NEW BUSINESS
Economic value earnings of We have continued to see New business profits of £3.8m.
£47.1m represent over 300% activity in our target markets.
coverage of the historical
annualised dividend.
CHESNARA CULTURE AND VALUES
– We are well capitalised at both group and subsidiary level under SII, with group solvency of 155%
– We continue to focus on delivering good customer outcomes
– Continuing to apply the Chesnara governance and risk culture practices
– Ongoing constructive relationships with UK, Swedish, Dutch and Luxembourg regulators
Shareholder return: 3% interim dividend growth
Interim dividend increased by 3% to 7.43p per share (2018: 7.21p interim and 13.46p final).
CHESNARA | 2019 HALF YEAR RESULTS PRESENTATION 3OVERVIEW – 2019 HALF YEAR FINANCIAL HIGHLIGHTS
IFRS SOLVENCY
IFRS PRE-TAX PROFIT £66.6M GROUP SOLVENCY 155%
SIX MONTHS ENDED 30 JUNE 2018 £26.5M 31 DECEMBER 2018 158%
Movement in the period largely arises within the Scildon business which has large IFRS We are well capitalised at both group and subsidiary level under Solvency II.
profits due to asset movements which are not offset by reserves movements.
IFRS TOTAL COMPREHENSIVE
INCOME £51.0M
SIX MONTHS ENDED 30 JUNE 2018 £14.9M
The 2019 result includes a foreign exchange loss of £3.5m (2018: loss of £6.9m).
ECONOMIC VALUE CASH GENERATION
ECONOMIC VALUE £645.1M GROUP CASH GENERATION £13.4M
31 DECEMBER 2018 £626.1M SIX MONTHS ENDED 30 JUNE 2018 £48.6M
Movement in the period is stated after dividend distributions of £20.2m and includes a The 2019 result includes a cash strain of £13.1m from the “symmetric adjustment”
foreign exchange loss of £7.9m. impact. The prior year comparison benefitted from £20m of net releases from the with-
profits fund.
ECONOMIC VALUE EARNINGS £47.1M DIVISIONAL CASH GENERATION £2.4M
SIX MONTHS ENDED 30 JUNE 2018 £13.6M SIX MONTHS ENDED 30 JUNE 2018 £53.1M
The impact of equity growth and interest rate reductions on Own Funds
and SCR resulted in cash utilization in our European divisions while the
UK business continued to deliver solid cash generation. In Sweden and
the UK we saw a material negative symmetric adjustment impact
broadly offsetting a corresponding gain in 2018.
CHESNARA | 2019 HALF YEAR RESULTS PRESENTATION 4OVERVIEW – 2019 HALF YEAR OPERATIONAL & STRATEGIC HIGHLIGHTS
DIVIDEND NEW BUSINESS PROFIT
INTERIM DIVIDEND INCREASE
3% NEW BUSINESS PROFIT £3.8M
2018 3% SIX MONTHS ENDED 30 JUNE 2018 £5.3M
Interim dividend increased by 3% to 7.43p per share (2018: 7.21p interim
and 13.46p final).
ECONOMIC BACKDROP 17 IFRS 17
EQUITY MARKET GROWTH, FALLING GROUP-WIDE IFRS 17 PROGRAMME IS
INTEREST RATES, WEAKENING SWEDISH PROGRESSING TO PLAN
KRONA Following completion of the impact assessment and implementation
plan in 2018, considerable progress has been made on the application
of the technical aspects of the standard.
Rising equity markets and narrowing bond spreads since the turn of the
year have supported significant investment returns and economic earnings.
However, the economic conditions, including further downward pressure on
interest rates, have been less beneficial for cash generation. A weakening
of the krona against sterling has led to foreign exchange retranslation
losses.
CHESNARA | 2019 HALF YEAR RESULTS PRESENTATION 5John Deane
Chief Executive Officer
BUSINESS REVIEW
CHESNARA | 2019 HALF YEAR RESULTS PRESENTATION 6BUSINESS REVIEW ● UK
The UK has continued to progress its objectives in line with plans. The customer strategy
implementation plan is nearly complete and the division remains focused on good governance of the
business. Management will continue to focus on these areas, coupled with identifying and delivering
capital management initiatives and supporting the group in relation to any UK-based acquisitions.
INITIATIVES & PROGRESS IN 2019 FUTURE PRIORITIES KPIs
CAPITAL AND • EcV earnings of £25.2m. • Conclude the review of the operating model Underlying value growth
VALUE • Cash generation of £16.2m, continuing to support the to deliver the investment management of Reported Value £m
MANAGEMENT dividend strategy. our unit linked policyholder funds. Cumulative Dividends
MAXIMISE VALUE FROM EXISTING BUSINESS
60.5
• Progress has been made in reviewing the operating • Continue to ensure that we are managing 30.5 92.5 151.5
model used to deliver the investment management of the cost base efficiently.
our unit linked policyholder funds.
• Focus on wider initiatives to optimise the
balance between value growth and surplus 232.2 239.6 255.5 214.7 180.9
capital availability. 2015 2016 2017 2018 Jun-19
CUSTOMER • Customer strategy implementation is nearing • Complete the customer strategy Policyholder performance
OUTCOMES completion. implementation programme and embed CA Pension Managed
into business as usual routines. CWA Balanced Managed
• Our customer tracing process has continued Pension
successfully. • Continue the cycle of reuniting customers S&P Managed Pension
• Following the completion of the programme we expect with their policies where we have lost Benchmark - ABI Mixed
Inv 40%-85% shares
to have enhanced processes and procedures in place contact.
that continue to deliver fair customer outcomes.
• We closely monitor regulatory developments to ensure 3.8% 3.9% 2.4% 3.5% 6.4% 6.3% 8.4% 4.5%
we continue to treat our customers fairly. 12 months ended 30 Jun 2019 12 months ended 30 Jun 2018
GOVERNANCE • Progressed the IFRS 17 “Insurance contracts” • Continue with the delivery of the IFRS17 Solvency surplus and ratio 145%
implementation. programme. 130%
17.9
• The operational resilience review programme over • Progress the operational resilience 47.0
29.1
critical business services has continued. programme.
Dec-18 Surplus 30 Jun 19
• Ongoing positive engagement with all regulators. generation surplus
CHESNARA | 2019 HALF YEAR RESULTS PRESENTATION 7BUSINESS REVIEW ● UK
REGULATORY UPDATE: FURTHER INSIGHTS AND CHESNARA CONTEXT
ISSUE POSITION 29 MARCH 2019 POSITION 29 AUGUST 2019
BREXIT Other than the fact that BREXIT could impact the The position remains unchanged and we maintain our
investment markets to which our results are sensitive, we open dialogue with all our regulators.
consider that our operating model is relatively unaffected
by BREXIT.
We do not trade across borders nor do we share resource
between our European businesses.
Each division operates to autonomous local regulatory
frameworks and we believe we have the flexibility to
change our regulatory structure if BREXIT results in an
inefficient regulatory structure of the organisation.
CUSTOMER We are on target with our project to developing our The programme remains on track.
COMMUNICATIONS documentation and communications to meet the new
forward looking standards set out in the final guidance New requirements which differ from those required under
issued by the FCA in November 2016. the legacy review from the Retirements Outcomes Review
are on target to be delivered by the regulatory deadline of
1 November 2019.
Our customer tracing process has continued in order to
ensure that we have the most up-to-date contact
information for our customers and reunite them with their
policies. 80% of our ‘Reunite’ mailing campaign has been
delivered and on target to complete by the end of the
year.
Further phased enhancements to the CA website are
complete.
CHESNARA | 2018 HALF YEAR RESULTS PRESENTATION 8BUSINESS REVIEW ● SWEDEN
Movestic has continued to focus on delivering its strategic initiatives, including its front and back office
IT streamlining plans. These are anticipated to bring cost efficiencies and improvements in broker and
policyholder experience. From a financial perspective, Movestic has delivered growth in the period
despite the headwinds arising from a very competitive market and the impact of updating processes to
ensure compliance with changes in regulations.
INITIATIVES & PROGRESS IN 2019 FUTURE PRIORITIES KPIs
CAPITAL AND • EcV earnings of £13.9m. • Continue the journey of digitising and Growth in assets under management
£bn
VALUE
2.7 0.3 3.1
• Cash utilisation of £5.8m. automating processes, with a view to 2.1 2.4
2.7 0.1
MANAGEMENT • Assets under management have grown by 15%,
improving both efficiency and control.
supported by positive net client cash flows. • Continue to develop more digitised and
MAXIMISE VALUE FROM EXISTING BUSINESS
individualised customer proposition 2015 2016 2017 2018 Net client Investment Jun-19
• Movestic continue to deliver meaningful process and experience.
cashflow growth
and product enhancements required to ensure their Economic Value
proposition focuses on changing customer and • Provide a predictable and sustainable
broker needs and to generate the efficiencies dividend to Chesnara. Cumulative Dividends
Reported Value 8.1
2.7
required to address the challenge of reducing fees • Continue to develop the operating and 5.4
and ongoing regulatory change. product proposition plans to reflect the
fast changing market environment and
consumer servicing preferences.
177.9 213.3 232.6 220.1 231.4
2015 2016 2017 2018 Jun-19
CUSTOMER • Policyholder average investment return of 11.7% (H1 • Continue to develop new solutions Broker assessment rating (0-5)
OUTCOMES 2018: 3.5%). and tools to support the brokers’
• Policy transfers process has been updated to ensure value-enhancing customer
full compliance with new regulations. proposition.
• A new customer offering has been launched with our
new funds, Avancera. 3.7 3.8 3.7 3.8
• Digital processes with improved functionality have 2015 2016 2017 2018
been delivered.
GOVERNANCE • New claims handling system and digital invoicing • Deliver IFRS 17 implementation plans. Solvency surplus and ratio
software implemented. 174% 161%
• Processes refined to comply with the insurance (1.6 )
distribution directive.
• IFRS 17 work is in line with plan. 85.2 83.6
• Initiated project to simplify corporate structure. 31 Dec 18 Surplus 30 Jun 19
surplus generation surplus
CHESNARA | 2019 HALF YEAR RESULTS PRESENTATION 9BUSINESS REVIEW ● SWEDEN
Movestic has had a positive 2019, with continued focus on writing new business within our target range
creating value within the group.
INITIATIVES & PROGRESS IN 2019 FUTURE PRIORITIES KPIs
ENHANCE VALUE THROUGH NEW BUSINESS
PROFITABLE • Operating within target market share range of between 6% • Continue to focus on writing new business Occupational pension market share %
NEW and 10%. within our target range.
BUSINESS • Overall new business profits have reduced compared with • Ongoing digitalisation of processes to
the prior year, largely as a result of lower transfers in, improve broker and customer experience.
coupled with pressure on investment fee rebates. • Focus on increasing brand awareness
• Business transferred in increased in Q2 compared to Q1.
8.3 7.6 6.6
2016 2017 2018
New business profit
£m
6.1 11.2 10.8 8.5 2.3
2015 2016 2017 2018 6 months to
30 Jun 2019
CHESNARA | 2019 HALF YEAR RESULTS PRESENTATION 10BUSINESS REVIEW ● NETHERLANDS
2019 has seen dividends payments from both Scildon and Waard and key actions are being taken to
strengthen the position of the Scildon new business operation whilst maintaining its market share. A
small portfolio of policies has been acquired and will be transferred into Waard during the second half
of 2019. Financial results have been impacted by market movements through interest and spread
movements with a significant IFRS profit and EcV earnings reported but reductions in Scildon solvency
and cash generation.
INITIATIVES & PROGRESS IN 2019 FUTURE PRIORITIES KPIs
CAPITAL AND • Acquisition of a small book of policies to be • Active management of capital to facilitate Underlying value growth (Scildon)
VALUE transferred into Waard upon completion. continued dividends from both divisions.
£m
MANAGEMENT • Restructure of the Scildon business giving a lower • Continuation of the Scildon improvement plan
Reported Value
cost base and supporting product alignment and which will strengthen future cash generation Cumulative Dividends
MAXIMISE VALUE FROM EXISTING BUSINESS
strategic flexibility. and value growth.
37.6 37.6
• Combined dividends of £8.4m. • Review asset mix to optimise capital
• Waard and Scildon ended the period with healthy efficiency. 59.9 65.1
solvency ratios of 649% and 194%. Scildon remains • Implementation of new management buffers
well capitalised but has gone below its current of 85% from 1 January 2020 and 75% from 1
internal management solvency target of 200%. January 2021.
Actions are being considered to increase this. • Transfer the Scildon staff pension scheme
• Scildon EcV gain of £6.5m and a Waard £1.6m profit. from a defined benefit to a defined 243.4 226.0 223.0 170.6 172.2
• Cash of £5.7m has been utilised. contribution scheme.
2015 2016 2017 2018 Jun-19
• Continued work on aligning some functions between
the two Dutch businesses.
CUSTOMER • Scildon launched a digitised new business app. • Continuing to enhance and develop existing Client satisfaction rating (Scildon)
OUTCOMES • Scildon continues to be rated highly by brokers. processes, customer experiences and the
• The annual performance research for consumers underlying infrastructure.
shows high scores. • Engage with brokers to support the
development of our processes in conjunction
with their requirements. 7.5 7.4 7.6 7.7
• Regular customer assessment with the
2015 2016 2017 2018
outcome used to improve service quality.
GOVERNANCE • The IFRS 17 project continues for both businesses. • Continuous improvement of the control Solvency surplus and ratio
203% 194%
• Further strengthening of the governance framework environment and the governance and risk (0.3)
Scildon 81.5 81.2
through appointments to the Supervisory Boards and management framework.
changes in the Scildon management structure. • Continue to deliver IFRS 17 implementation 31 Dec 18 Surplus 30 Jun 19
surplus generation surplus
plans.
624% 1.7 649%
Waard 40.6 42.3
31 Dec 18 Surplus 30 Jun 19
surplus generation surplus
CHESNARA | 2019 HALF YEAR RESULTS PRESENTATION 11BUSINESS REVIEW ● NETHERLANDS
Development of the Scildon new business offering is a focus of the improvement plan, the aim is to
deliver meaningful value growth from a realistic market share.
INITIATIVES & PROGRESS IN 2019 FUTURE PRIORITIES KPIs
ENHANCE VALUE THROUGH NEW BUSINESS
PROFITABLE • Scildon generated half year new business profits of £1.5m, • Management actions, including a focus on Term assurance market share %
NEW compared to £0.6m in 2018. costs and product mix, are ongoing in order
• The number of policies continues to increase and is up by
BUSINESS to generate a more commercially
2.4% compared to the 2018 year end. meaningful level of new business profits.
• Market shared for the core protection business is within
the 5-10% target range but we have further work to do to
strengthen the proposition and reduce costs.
6.6 5.9 7.3 7.6
2015 2016 2017 2018
New business profit
£m
0.1 2.0 1.9 1.7 1.5
2015 2016 2017 2018 6 months
to 30 Jun
2019
CHESNARA | 2019 HALF YEAR RESULTS PRESENTATION 12BUSINESS REVIEW ● ACQUIRE LIFE & PENSION BUSINESSES
Well considered and appropriately priced acquisitions maintain the effectiveness of the operating
model, create a source of value enhancement and sustain the cash generation potential of the group.
HOW WE DELIVER OUR ACQUISITION STRATEGY
– Identify potential deals through an effective network of advisers and industry – The financial benefits are viewed in the context of the impact the deal will have
associates, utilising both group and divisional management expertise as on the enlarged group’s risk profile.
appropriate. – Transaction risk is minimised through stringent risk-based due diligence
– We primarily focus on acquisitions in the UK and Netherlands, although procedures and the senior management team’s acquisition experience and
consider other territories should the opportunity arise. positive track record.
– We assess deals applying well established criteria which consider the impact – We fund deals with a combination of debt, equity or cash depending on the size
on cash generation and Economic Value under best estimate and stressed and cash flows of each opportunity.
scenarios.
– We work cooperatively with regulators.
HOW WE ASSESS DEALS
Cash generation – Collectively our future acquisitions must be suitably cash generative to continue to fund the Chesnara dividend strategy.
– Acquisitions are required to have a positive impact on the Economic Value per share under best estimate and certain
Value enhancement
more adverse scenarios.
Customer outcomes – Acquisitions must ensure we protect, or ideally enhance, customer interests.
– Acquisitions should normally align with the group’s documented risk appetite. If a deal is deemed to sit outside our risk
! Risk appetite
appetite the financial returns must be suitably compelling
ACQUISITION OUTLOOK
– We have witnessed an increase in activity in the territories in which Chesnara – We continue to assess opportunities within Western Europe that are outside of
currently operates and those that Chesnara doesn't exist. This increase has Chesnara’s current territories.
coincided with, what we perceive to be, a rise in seller’s valuations and prices – The environment in which European life insurance companies operate
paid for potential targets. continues to increase in complexity. We believe this will potentially drive
– In the UK, we have seen a continued gradual increase in closed book market further consolidation.
activity. – Our financial foundations are strong and we have an established and stringent
– Regarding the Netherlands, we have also seen a gradual increase in market acquisition assessment model which is regularly reassessed.
activity which we are well positioned to take advantage of.
CHESNARA | 2019 HALF YEAR RESULTS PRESENTATION 13David Rimmington
Group Finance Director
FINANCIAL REVIEW
CHESNARA | 2019 HALF YEAR RESULTS PRESENTATION 14FINANCIAL REVIEW – MEASURING OUR PERFORMANCE
FINANCIAL
ADDITIONAL METRICS
Throughout the Half Year Report, we STATEMENTS
use measures to assess and report I
how well we have performed. IFRS profits
R
Capital requirements
Solvency SCR plus
The range of measures is broad and capital management
includes many measures that are requirement buffer
not based on IFRS.
The financial analysis of a life and Solvency II valuation P R
pensions business also needs to IFRS net assets
(own funds) I B
Solvency
recognise the importance of Percentage Absolute
Solvency II figures, the basis of STAKEHOLDER
regulatory solvency. FOCUS:
Policyholders P
In addition the measures aim to Investors I
assess performance from the Regulators R I
Economic Value
I
Cash generation
perspective of all stakeholders. Business partners B B
Balance
Key performance Earnings Group Divisional
sheet
indicators
SOLVENCY ECONOMIC VALUE CASH GENERATION
Solvency is a fundamental financial measure which is of Economic Value (EcV) is deemed to be a more Cash generation is a measure of how much distributable
paramount importance to investors and policyholders. It meaningful measure of the long term value of the group surplus has been generated in the period, which supports
represents the relationship between the value of the and it generally approximates to Embedded Value the ability of the group to pay its dividends. It is driven by
business as measured on a Solvency II basis and the reporting, which was used before the introduction of SII. the change in solvency surplus, taking into account
capital the business is required to hold - the Solvency In essence, the IFRS balance sheet is not generally board-approved capital management policies.
Capital Requirement (SCR). Solvency can be reported as deemed to represent a fair commercial value of our
.
an absolute surplus value or as a ratio. business as it does not fully recognise the impact of future
profit expectations of long term policies.
Solvency gives policyholders comfort regarding the
security of their provider. This is also the case for EcV is derived from Solvency II Own Funds and
investors together with giving them a sense of the level of recognises the impact of future profit expectations from
potential surplus available to invest in the business or existing business.
distribute as dividends (subject to other considerations
and approvals).
CHESNARA | 2019 HALF YEAR RESULTS PRESENTATION 15FINANCIAL REVIEW – IFRS PRE-TAX PROFIT & TOTAL COMPREHENSIVE INCOME
Strong results in Scildon and the UK drive substantial profits for the period as a result of improved investment market
conditions. The other operating businesses have all generated positive contributions. Significant operating profits of
£23.4m have also been delivered in the period.
Headlines Group IFRS pre-tax profit Analysis of IFRS TCI (£m)
(£m)
– Group IFRS pre-tax profit of £66.6m (HY 2018: £26.5m). 66.6
– Operating profit of £23.4m (HY 2018: £27.3m) demonstrates the
51.6
strength and stability of the underlying business.
– Economic profit of £43.2m (HY 2018: loss of £0.8m).
– TCI of £51.0m allowing for the forex loss of £3.5m (HY 2018:
26.5
profit of £14.9m). 27.3 0.0 23.4 43.2 0.2
(4.7) (6.9)
Stable core (CA & Waard) (0.8)
(12.3)
(3.5)
– Stable underlying core earnings from Waard in line with
30 June 2018 30 June 2019
expectations of the run-off book profile.
Operating Economic Tax Forex Other comp income
– CA has reported strong results for the 2019 half year period, 30 Jun 17 30 Jun 18 30 Jun 19
which are marginally behind the same period in 2018.
Group IFRS pre-tax profit – split by division - £m
Variable element (Scildon) 40 36.4
– Scildon has delivered a strong result predominantly due to 35
27.6
favourable market movements in the company’s bond portfolio. 30 25.8
23.1
This arises from the fact that Scildon measures the majority of its 25 20.7
20
insurance contract liabilities using historical rates of interest, as is
15
customary in the Netherlands. This can lead to increased volatility
10 7.1 7.0 6.5
in IFRS profits by virtue of the assets that back the liabilities being 4.6 3.5
5 2.3 2.0
reported on a fair value basis. 0.0 0.0
0
Growth business (Movestic) -5 (2.8)
(4.9) (5.6)
-10
– Movestic continues to contribute positively to the overall group (8.6)
-15
IFRS result and has out performed against the same period in 30 Jun 17 30 Jun 18 30 Jun 19
2018. Higher transfer related fees, positive claims performance CA Movestic Waard Scildon Group & Consol adj Business combination
and reduced operating costs were the main drivers.
Group costs and consolidation adjustments
– This includes holding company expenses, foreign exchange movements on our euro denominated loan and consolidation adjustments.
CHESNARA | 2019 HALF YEAR RESULTS PRESENTATION 16FINANCIAL REVIEW – SYMMETRIC ADJUSTMENT
The group cash generation result of £13.4m includes a cash strain of £13.1m as a result of the symmetric adjustment
impact.
What is the symmetric adjustment?
The Solvency II capital requirement calculation includes an adjusting factor that reduces or increases the level of the equity capital required depending on historical
market conditions. Following periods of market growth, the factor tends to increase the level of capital required and conversely, in falling markets the capital
requirement becomes less onerous. The adjustment is applied to the equity stress base percentage each reporting period. The rationale for the adjustment is to
reduce the impact in a downwards market and reflect that if equities have already suffered a material fall, then a further 1-in-200 year fall would be less than in the
typical position.
How might the SA impact results in the future
The symmetric adjustment can create a swing in the SCR value each period up to an adjustment of +/- 10%. If you are one of the extremities of that range, then
subsequent movement is more likely in one direction. For example if the adjustment is at +9%, the maximum swing in the adjustment is +1% or -19%.
Who sets the symmetric adjustment?
The adjustment is set by the European Insurance and Occupational Pensions Authority (EIOPA). The adjustment is provided each month and is calculated on a
rolling three year basis. The adjustment tends towards zero in a period of normal equity market movements but as it is calculated using a rolling average, a period of
minimal movement can still see a shift in the adjustment. This information is publicly available on the EIOPA website (https://eiopa.europa.eu/regulation-
supervision/insurance/solvency-ii-technical-information/symmetric-adjustment-of-the-equity-capital-charge)
+10% (c£20m) 6 monthly movement
Symmetric adjustment per quarter
01/03/17, 01/09/17,
1.36% 2.40% 01/12/17,
01/06/17, 01/09/18,
1.90% 0.14%
Symmetric 0.90% SCR
adjustment impact
01/06/18,
01/03/18,
-0.11%
01/12/16, -0.88% 01/06/19,
-1.44% -1.72%
01/03/19,
01/12/18, -2.20%
-6.34%
-10% +c£20m
CHESNARA | 2019 HALF YEAR RESULTS PRESENTATION 17FINANCIAL REVIEW – CASH GENERATION
Cash generation has been slightly muted compared to the same period in 2018. The main contributing factor is the
capital requirement impact of the growth in equity markets*.
– The cash value includes the net non-recurring benefit of a
£0.8m (2018 HY: £20.9m) capital extraction from the UK
Cash generation (pre exceptional items) £m
restricted with profit funds. Excluding this, underlying
group cash generation for HY 2018 was £21.8m
compared to £5.5m for HY 2019.
Exceptional item
– UK remains the primary source of divisional cash.
– Waard continues to supply stable but modest cash.
Total cash generation for the period
– Scildon has reported a loss of £7.4m as a result of an
increased capital requirement. This is primarily due to 30 Jun 19 30 Jun 18 - 10 20 30 40 50 60
economic factors, in particular spread risk capital, driven
by rising bond values. This also includes an adverse
Cash generation Dividend payments
impact of £8.3m due to increases in lapse risk capital. 60.0 Cash generation - historical profile Other group activities
(£m) (£m) Netherlands - Scildon
– Movestic reported cash utilisation of £8.0m with growth in Netherlands - Waard
50.0 30 Jun 2018 31 Dec 2018 30 Jun 2019
own funds being more than offset by increasing capital Total = 13.6 Sweden
requirements. Own Funds have benefitted from growth in UK
assets under management, and hence growth in future 40.0 11.1
fee income, driven by rising equity markets. This growth
1.7
was partially offset by a strengthening of assumptions 30.0
relating to transfers and fund rebates. However, the
16.2 15.6
asset growth has demanded a high level of capital to be
20.0
held within the business. Alongside this, SEK
depreciation against sterling resulted in an exchange loss (8.0)
of £2.2m. 10.0
(7.4)
– Chesnara plc has £95.7m of cash and other highly liquid
0.0
balances at 30 June 2019. Post dividend, Chesnara PLC
Dividends*
will have c£84.6m of cash balances which is more than Jun 2019 Cash generation Dividends*
sufficient to fund the remaining 2019 debt repayments of Exceptional items
* Estimate of 50% of the full year dividend based on
£7.7m and to support potential acquisition activity. Cash generation (underlying) 2018 levels.
Cash generation HY 2019*: Solvency II equity risk capital requirement rules include a concept called the symmetric adjustment, which requires proportionately more equity risk
capital to be held in rising markets, which subsequently unwinds over time. It is estimated that the symmetric adjustment movement in the period has supressed cash generation by
some £13.1m, and mainly impacted the UK and Swedish divisions.
CHESNARA | 2019 HALF YEAR RESULTS PRESENTATION 18FINANCIAL REVIEW – SOLVENCY II
We are well capitalised at both a group and subsidiary level. We have applied the volatility adjustment in Scildon for the
first time in this period, but have not used any other elements of the long term guarantee package.
GROUP SOLVENCY SURPLUS GENERATION GROUP SOLVENCY POSITION
£m
2.3 11.1
17.9 1.6 1.7 0.3 3.5 £m
155% 158%
208.3
203.0
170
168
38
35
588 553
380 350
Divisional movement - £17.7m 30 Jun 2019 31 Dec 2018
Group surplus CA Movestic Waard Scildon Chesnara / consol Exchange rates Dividends Group surplus
31 Dec 2018 adj 30 Jun 2019
Own Funds (post Div) SCR
Buffer Surplus
INSIGHT DIVISIONAL SOLVENCY
The below highlights key points in the year to date.
Surplus: The solvency position of the group has reduced slightly from 158% to 155%. The group now has £170m Jun 2019 Dec 2018
of distributable surplus over and above the internal capital management policy, compared to £168m at the end of
2018. Business Post-Div Post-Div
Dividends: The closing solvency position is stated after deducting the £11.1m proposed interim dividend (31
December 2018: £20.2m). CA 145% 130%
Own funds: Own funds have increased by £35.6m, before the impact of the interim dividend (£11.1m). This
growth is driven by positive investment returns so far this year for Movestic and CA, particularly following Movestic 161% 174%
significant gains in equity markets. In addition, £7.9m capital was transferred from the with-profits funds within
the UK division. A decrease in spreads has also increased the value of Scildon’s bond holdings. Waard 649% 624%
SCR: The SCR has risen by £30.2m so far this year. The key movements underlying this are increases in equity
risk capital due to the impact of positive equity returns, and unwinding of the symmetric adjustment, in the Scildon 194% 203%
group’s unit linked funds.
CHESNARA | 2019 HALF YEAR RESULTS PRESENTATION 19FINANCIAL REVIEW – SENSITIVITIES
The table provides some insight into the immediate and longer term impact of certain sensitivities that the group is
exposed to, covering solvency, cash generation and economic value
Solvency surplus Cash generation ECV
EcV tends to take the “full force” of adverse conditions 1
1
whereas cash generation is often protected in the short Sensitivity scenario Immediate impact 5 year impact Immediate impact
term and to a certain extent in the longer term due to
compensating impacts on our required capital.
20% Sterling appreciation 2
A material Sterling appreciation reduces the value of
surplus in our overseas divisions, and hence has an 25% equity fall
2 immediate impact on group cash generation. It also
reduces the value of projected Own Funds growth in our 25% equity rise
overseas divisions and also reduces the value of overseas 3
investments in CA. 10% equity fall
The short term solvency is relatively insensitive to equity
10% equity rise
movements because the SCR tends to move to hedge the
3
movement in own funds. The EcV impacts are more
1% interest rate rise 4
intuitive given the link between fund values and cash
flows.
50bps credit spread rise
An interest rate rise is generally positive across the group.
4 5
CA, Movestic and Scildon all contribute significantly 25bps swap rate fall
towards the total group cash generation project.
10 % mass lapse
There is only a small immediate impact on surplus as the
5 reduction in own funds is negated by a reduction in SCR. 10% expense rise + 1% 6
However with fewer policies EcV is impacted as there is inflation rise
less potential for future profits.
10% mortality increase 7
The expense sensitivity hits the solvency position
6 immediately as the increase in future expenses and
inflation is capitalised into the balance sheet.
The sensitivity has an adverse impact on surplus and cash BASIS OF PREPARATION ON REPORTING: £0m to £15m
7 Although it is not a precise exercise, the general aim is that the £15m to £30m
generation, particularly for Scildon due to their term
sensitivities modelled are deemed to be broadly similar (with the
Impacts
products. £30m to £50m
exception that the 10% equity movements are naturally more likely
to arise) in terms of likelihood. Whilst the sensitivities provide a
useful guide, in practice, how our results react to changing £50m to £90m
conditions is complex and the exact level of impact can vary due to
the interactions of events and the starting position. £90m to £140m
CHESNARA | 2019 HALF YEAR RESULTS PRESENTATION KEY + ve - ve 20FINANCIAL REVIEW – VALUE MOVEMENT IN 2019
The group’s EcV earnings of £47.1m in the period are largely driven by operating profits. Economic earnings have
contributed more than in the prior period as a consequence of an upturn in market conditions since the start of the year,
primarily equity market returns and the narrowing of bond spreads.
The EcV earnings in the period of £47.1m comprises the
following elements: £m
Jun 2019 Jun 2018
£m £m 47.1 ( 20.2 )
(7.9) 645.1
Operating (loss)/earnings (17.8) 9.6
626.1
Material other operating items (9.5) -
Economic earnings 85.3 6.6
Other non operating variances (0.1) (0.3)
Risk margin movement (3.0) (0.5)
Tax (7.8) (1.8)
EcV earnings 47.1 13.6
EcV has increased from £626.1m at Dec 2018 to
£645.1m at June 2019. The growth in EcV during the 2018 Group EcV EcV earnings Dividends Forex Jun 2019 Group EcV
period includes the impact of the 2018 year end dividend
payment of £20.2m and foreign exchange losses arising
on re-translating Dutch and Swedish divisions of £7.9m.
Because Economic Value is derived from Solvency II, we
expect EcV profits to align relatively closely to
movements to Solvency II “Own Funds”.
What is Economic Value?
– Own funds are deemed to underestimate the commercial value of Chesnara due to:
– Contract boundaries
– Excessive risk margin
– Ring-fenced funds restrictions
– We have therefore adjusted our SII valuations for these items to create “Economic Value”
– Economic Value does not include any value for the companies capability to write new business or complete acquisitions in the future.
CHESNARA | 2019 HALF YEAR RESULTS PRESENTATION 21FINANCIAL REVIEW – VALUE GROWTH
COMPANY HISTORY WHAT WE HAVE DONE Value Growth £m
2004 6 723
Chesnara is born. EEV of £126m. SUCCESSFUL ACQUISITIONS, 626 645
603
INCLUDING LGN.
2005
455
3
417
First acquisition. CWA adds £30m of 355 376
295 311
EEV. 263
TERRITORIES 189 187 183
176
2009 126
Our deals demonstrate flexibility
Chesnara moves into Europe acquiring and creativity where appropriate:
Movestic in Sweden. Group EEV now - Tactical “bolt-on” deals to more 2004 2005 2006 2007 2008 2009 2010 2011 2012 2013 2014 2015 2016 2017 2018 HY
2019
£263m. transformative deals
2010 - Open minded regarding deal size
- Willingness to find value beyond the
S&P acquired. Group AuM over £4bn. UK
- Flexible and efficient deal funding
2013 solutions OUTCOME
- Capability to find expedient solutions
Direct Line’s life assurance acquired end to de-risk where required
of 2014. Group EEV now above £400m.
We are not willing to compromise
2015 on quality, value or risk. All deals
Expansion into the Netherlands. Waard have: Value growth is achieved through
Group acquired. - been at a competitive discount to
value a combination of efficient
2016 - satisfied our dual financial management of the existing
requirements of generating medium
Building on our entry to the Dutch market,
we announce the acquisition of LGN.
term cash and enhancing long term policies, acquisitions and writing
value
profitable new business. The
2017 - been within Chesnara’s risk appetite
- been subject to appropriate due growth includes c£148m of new
Completion of Legal & General
Nederland acquisition, renamed Scildon,
diligence
- been either neutral or positive in equity since 2004 but is net of
at a 32% discount to its EcV of £202.5m. terms of customer outcomes £318m of cumulative dividend
- supported Chesnara’s position as an
income stock payments.
CHESNARA | 2019 HALF YEAR RESULTS PRESENTATION 22John Deane
Chief Executive Officer
CONCLUSION & OUTLOOK
CHESNARA | 2019 HALF YEAR RESULTS PRESENTATION 23CONCLUSION & OUTLOOK – FUTURE PRIORITIES
MAXIMISE VALUE FROM ACQUIRE LIFE AND PENSION ENHANCE VALUE THROUGH
01 EXISTING BUSINESS 02 BUSINESSES 03 NEW BUSINESS
• Solvency II in action – focus on • Continue to review market • Continue our work introducing
capital management opportunities. opportunities as they arise in our improvements to the business
• Continue to seek efficiencies that target territories. processes and products in the
benefit our customers and • Maintaining our price and process Netherlands.
shareholders. disciplines. • Further develop our digital
• Continue the implementation of • Solvency II – use of capital marketing to reflect consumer
changes resulting from the final • Impact of IFRS 17 on potential and broker changing habits.
guidance from the Legacy Review. targets. • Greater use of digitalisation to
• Focus on efficiency and expenses • Further develop our capability to provide enhanced value to
and the efficiency enhancements undertake portfolio as well as customers and brokers, in
for Scildon. company transfers by reassurance particular on transfer business in
• Continue the digitisation of our or Part VII transfers. Sweden.
Swedish business. • Ensure our abilities to undertake
• Share resources across the group transfers of data from sellers
where appropriate. systems is well understood in the
market.
CHESNARA CULTURE AND VALUES
• Deliver value to our customers through our continued focus on:
• Customer service levels
• Investment performance
• Maintaining financial stability
Delivery on core strategic objectives drives shareholder value.
CHESNARA | 2019 HALF YEAR RESULTS PRESENTATION 24QUESTIONS CHESNARA | 2019 HALF YEAR RESULTS PRESENTATION 25
APPENDICES

CHESNARA | 2019 HALF YEAR RESULTS PRESENTATION   26
APPENDICES: HISTORICAL DATA - HEADLINE RESULTS

                                                                                Jun-19 Dec-18 Dec-17 Dec-16 Dec-15 Dec-14 Dec-13 Dec-12

       IFRS profit £m (pre-tax and exceptionals)                                    66.6        27.0       89.6       40.7        42.8        28.8        57.8       24.5

       EcV / EEV profit / (loss) £m (after tax and
                           1
                                                                                     47.1    (60.9)       139.5        72.5       57.5        44.2        82.7       31.2
       exceptionals)

       EcV / EEV Shareholder equity £m 1                                           645.1      626.1       723.1      602.6      453.4        417.2      376.4        311.1

       Solvency II ratio (UK)                                                      145%       130%        130%        128%       135%          n/a         n/a       n/a

       Solvency II ratio (Sweden)                                                   161%      174%        153%       140%        154%          n/a         n/a       n/a

       Solvency II ratio (Netherlands - Waard)                                    649%        624%       483%         712%      597%           n/a         n/a       n/a

       Solvency II ratio (Netherlands - Scildon)                                   194%       203%        231%          n/a         n/a        n/a         n/a       n/a

       Solvency II ratio (Group) 2                                                 155%       158%        146%        158%       146%          n/a         n/a       n/a

       1
           From the 1st January 2016 we have moved from reporting on an embedded value basis to an economic value basis.
       2
           December 2016 Group solvency includes the impact of the capital raise and associated costs for the acquisition of LGN, removing this the ratio is 144%.

CHESNARA | 2019 HALF YEAR RESULTS PRESENTATION                                                                                                                               27
APPENDICES: HISTORICAL DATA - DIVIDEND HISTORY
Dividend History (pence per share)
20.67
20.07
19.49
18.94 13.46
18.40 13.07
17.88 12.69
17.35 12.33
16.85 11.98
16.40 11.63
15.55 15.95 11.25
15.10 10.90
10.60
10.30
10.05
13.10 9.85
12.45
11.85 8.05
7.55
7.10
7.21 7.43
6.80 7.00
6.25 6.42 6.61
5.80 5.95 6.10
5.50 5.65
4.90 5.05 5.25
4.75
2004 2005 2006 2007 2008 2009 2010 2011 2012 2013 2014 2015 2016 2017 2018 2019
(interim)
Interim dividend (paid October) Final dividend (paid May of the following year)
CHESNARA | 2019 HALF YEAR RESULTS PRESENTATION 28Disclaimer
This presentation has been issued by Chesnara plc (“Chesnara” or the “Company”) and is being made
only to and directed at: (a) persons who have professional experience in matters relating to investments
falling within Article 19 of the Financial Services and Markets Act 2000 (Financial Promotion) Order 2005
(the “FPO”); or (b) high net worth entities, and other persons to whom it may otherwise lawfully be
communicated, falling within Article 49 of the FPO (all such persons together being referred to as
“relevant persons”); or (c) any other person to whom this promotion may lawfully be directed. Any
person who is not a relevant person should not act or rely on this presentation or any of its contents.
This presentation is supplied for information only and may not be reproduced or redistributed. This
presentation is not and should not be construed as an offer to sell or the solicitation of an offer to
purchase or subscribe for any investment nor shall it form the basis of or be relied upon in connection
with, or act as any inducement to enter into, any contract or commitment whatsoever.
This presentation may contain forward-looking statements with respect to certain of the plans and
current expectations relating to future financial condition, business performance and results of
Chesnara. By their nature, all forward-looking statements involve risk and uncertainty because they
relate to future events and circumstances that are beyond the control of Chesnara including, amongst
other things, UK domestic, Swedish domestic, Dutch domestic and global economic and business
conditions, market-related risks such as fluctuations in interest rates, inflation, deflation, the impact of
competition, changes in customer preferences, delays in implementing proposals, the timing, impact
and other uncertainties of future acquisitions or other combinations within relevant industries, the
policies and actions of regulatory authorities, the impact of tax or other legislation and other
regulations in the jurisdictions in which Chesnara and its subsidiaries operate. As a result, Chesnara’s
actual future condition, business performance and results may differ materially from the plans, goals
and expectations expressed or implied in these forward-looking statements.
Chesnara undertakes no obligation to update the forward-looking statements contained in this
presentation or any other forward-looking statements the Company may make.
CHESNARA | 2019 HALF YEAR RESULTS PRESENTATION 29You can also read