2018 Full-Year Results Presentation - Global Ports Investments PLC - 28 March 2019
←
→
Page content transcription
If your browser does not render page correctly, please read the page content below
Global Ports Investments PLC

2018 Full-Year Results
Presentation

28 March 2019

                                                                                                                                             1
                      Definitions for terms marked in this presentation with capital letters are provided in the Appendices at pages 28-29
DISCLAIMER
Information contained in this presentation concerning Global Ports Investments PLC, a company organised and existing under the laws of Cyprus (the “Company”, and together with its
subsidiaries and joint ventures, “Global Ports” or the “Group”), is for general information purposes only. The opinions presented herein are based on general information gathered at the
time of writing and are subject to change without notice. The Company relies on information obtained from sources believed to be reliable but does not guarantee its accuracy or
completeness.
These materials may contain forward-looking statements regarding future events or the future financial performance of the Group. You can identify forward looking statements by terms
such as “expect”, “believe”, “estimate”, “anticipate”, “intend”, “will”, “could”, “may”, or “might”, the negative of such terms or other similar expressions. These forward-looking statements
include matters that are not historical facts and statements regarding the Company’s and its shareholders’ intentions, beliefs or current expectations concerning, among other things, the
Group’s results of operations, financial condition, liquidity, prospects, growth, strategies, and the industry in which the Company operates. By their nature, forward-looking statements
involve risks and uncertainties, because they relate to events and depend on circumstances that may or may not occur in the future.
The Company cautions you that forward-looking statements are not guarantees of future performance and that the Group’s actual results of operations, financial condition, liquidity,
prospects, growth, strategies and the development of the industry in which the Company operates may differ materially from those described in or suggested by the forward-looking
statements contained in these materials. In addition, even if the Company’s results of operations, financial condition, liquidity, prospects, growth, strategies and the development of the
industry in which the Company operates are consistent with the forward-looking statements contained in these materials, those results or developments may not be indicative of results
or developments in future periods.
The Company does not intend to update these statements to reflect events and circumstances occurring after the date hereof or to reflect the occurrence of unanticipated events. Many
factors could cause the actual results to differ materially from those contained in forward-looking statements of the Company, including, among others, general economic conditions, the
competitive environment, risks associated with operating in Russia, market change in the Russian transportation industry or particularly in the ports operation segment, as well as many
other risks specifically related to the Company and its operations.
This document does not constitute or form part of any advertisement of securities, any offer or invitation to sell or issue or any solicitation of any offer to purchase or subscribe for, any
securities of the Company or the Group in any jurisdiction, nor shall it or any part of it nor the fact of its presentation, communication or distribution form the basis of, or be relied on in
connection with any contract or investment decision.
These written materials are not an offer of securities for sale in the United States. Securities may not be offered or sold in the United States absent registration or an exemption from
registration under the U.S. Securities act of 1933, as amended. Any public offer or distribution of securities to be made in the United States will be made in accordance with a
prospectus that may be obtained from the issuer or selling security holder and that will contain detailed information about the company and management, as well as financial
statements. The Company has not registered and does not intend to register any portion of any offering in the United States or conduct a public offering of any securities in the United
States.
This presentation is only addressed to and directed at persons in member states of the European Economic Area who are "qualified investors" within the meaning of Article 2(1)(e) of
the Prospectus Directive (Directive 2003/71/EC) ("Qualified Investors"). In addition, in the United Kingdom, this presentation is being distributed only to, and is directed only at, (i)
Qualified Investors who have professional experience in matters relating to investments who fall within Article 19(5) of the Financial Services and Markets Act 2000 (Financial
Promotion) Order 2005, as amended (the "Order") and Qualified Investors falling within Article 49(2)(a) to (d) of the Order, and(ii) Qualified Investors to whom it may otherwise lawfully
be communicated (all such persons together being referred to as "relevant persons"). This presentation must not be acted on or relied on (i) in the United Kingdom, by persons who are
not relevant persons, and (ii) in any member state of the European Economic Area other than the United Kingdom, by persons who are not Qualified Investors. Any investment or
investment activity to which this presentation relates is available only to (i) in the United Kingdom, relevant persons, and (ii) in any member state of the European Economic Area other
than the United Kingdom, Qualified Investors, and will be engaged in only with such persons.
This document is not an offer or an invitation to make offers or advertisement of securities in the Russian Federation, and it is not an offer to sell, purchase, exchange or transfer to or
for the benefit of any person resident, incorporated, established or having their usual residence in the Russian Federation, or to any person located within the territory of the Russian
Federation, or an invitation to or for the benefit of any such person to make offers to sell, purchase, exchange or transfer any securities.
This presentation is not directed to, or intended for distribution or use by, any person or entity that is a citizen or resident or located in any locality, state, country or other jurisdiction
where its distribution, publication, availability or use would be contrary to law or regulation or which would require any registration or licensing within such jurisdiction.
The distribution of this presentation in other jurisdictions may be restricted by law and persons into whose possession this presentation comes should inform themselves about, and
observe, any such restrictions.
No reliance may be placed for any purpose whatsoever on the information contained in this document or on assumptions made as to its completeness. No representation or warranty,
express or implied, is given by the Company, its subsidiaries or any of their respective advisers, officers, employees or agents, as to the accuracy of the information or opinions or for
any loss howsoever arising, directly or indirectly, from any use of this presentation or its contents.
                                                                                                                                                                                                    2
                                            Definitions for terms marked in this presentation with capital letters are provided in the Appendices at pages 28-29
REFERENCE TO ACCOUNTS AND OPERATIONAL
INFORMATION
Unless stated otherwise all financial information in this presentation is extracted from the Consolidated Financial Statements of the Company for the
twelve months period ended 31 December 2018 which are prepared in accordance with International Financial Reporting Standards adopted by the
European Union (“IFRS”) and the requirements of the Cyprus Companies Law, Cap.113.

The Global Ports Group’s Consolidated Financial Statements of the Company for the twelve months period ended 31 December 2018 is available at
the Global Ports Group’s corporate website (www.globalports.com).

The financial information is presented in US dollars, which is also the functional currency of the Company and certain other entities in the Group. The
functional currency of the Group’s operating companies for the periods under review was (a) for the Russian Ports segment, the Russian rouble, (b)
for the Oil Products Terminal segment and for the Finnish Ports segment, the Euro.

In this presentation the Group has used certain non-IFRS financial information as supplemental measures of the Group’s operating performance.
Such information is marked in this presentation with an asterisk {*}.

Information (including non-IFRS financial measures) requiring additional explanation or defining is marked with initial capital letters and the
explanations or definitions are provided at the end of this presentation.

Rounding adjustments have been made in calculating some of the financial and operational information included in this presentation. As a result,
numerical figures shown as totals in some tables may not be exact arithmetic aggregations of the figures that precede them.

Market share data has been calculated using the information published by the Association of Sea Commercial Ports (“ASOP”), www.morport.com
and Drewry Financial Research Services Ltd (“Drewry”).

                                                                                                                                                          3
                                  Definitions for terms marked in this presentation with capital letters are provided in the Appendices at pages 28-29
SUPERIOR TERMINAL PORTFOLIO IN KEY GATEWAYS
Highlights                                                                                                 Key operating and financial(3) metrics
                                                                                                                                                                                Unit               2018
        The #1 container terminal operator in Russia(1)
                                                                                                             No. of marine container terminals(2)                                  #                 7
         ⚫ 74% revenues from container handling, the rest from
              coal, metal, fertilisers, ro-ro cargoes and other                                              Consolidated Marine Container                                    mlnTEU              1.4/2.4
                                                                                                             Throughput/Capacity(4)
              services
                                                                                                             Consolidated Marine Bulk Throughput                               mln ton              3.1
        Strong presence in both key container gateways into and
                                                                                                             Revenue                                                          mln USD              343.6
        out of Russia: Baltic and Far Eastern basins
                                                                                                             Adjusted EBITDA                                                  mln USD             217.3*
         ⚫ 6 marine container terminals in the Baltic basin
              and 1 in Far East basin                                                                        Adjusted EBITDA margin                                               %                63.2*

         ⚫ Over 320 ha of terminal land (57% in freehold), close                                             Free Cash Flow                                                   mln USD             133.6*
              to 5 km of quay line in key gateways

        Moderate maintenance CAPEX requirements and strong
        cash flow generation
        GDRs listed on the Main Market of the London Stock
        Exchange, free float of 20.5%(5)
            Core strategic shareholders APM Terminals and Delo
            Group (each with 30.75% of total share capital) provide
                                                                                                                     Baltic Basin
            international and domestic expertise
            Adherence to best-in-class corporate governance                                                          FINLAND              RUSSIA
                                                                                                                         MLT Kotka
                                                                                                              MLT Helsinki     Moby Dik Petrolesport
            Board of Directors with strong track record and deep                                                   GULF OF FINLAND
                                                                                                                                         First Container
                                                                                                           BALTIC SEA
            understanding of the industry                                                                                         Ust-Luga
                                                                                                                                            Terminal
                                                                                                                        ESTONIA   Container
                                                                                                                                  Terminal

                                                                                                                   51% of Russia’s container                                       30% of Russia’s
                                                                                                                   traffic                                                         container traffic
(1)   Based on FY2018 throughput (Source: ASOP)
(2)   On a 100% basis
(3)   On a consolidated basis
(4)   Company estimates based on annual potential yard throughput capacity. To maximise the efficiency of its operations, the Group may choose to flex headcount, working hours and used equipment at its
      terminals. As a result, current actual capacity may differ from the published numbers.
(5)   Percentage of total share capital                                                                                                                                                                     4
                                                  Definitions for terms marked in this presentation with capital letters are provided in the Appendices at pages 28-29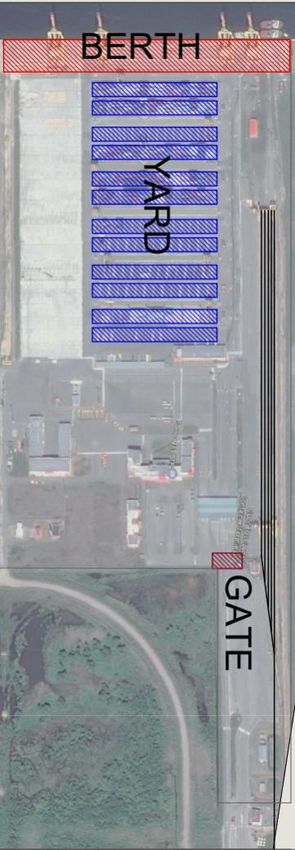
REGAINING FORWARD MOMENTUM

                                                  Container market +10%, laden export +14% (+76% over last five years)(1)
     Outperformance vs
    recovering container                          GPI outperformed the market with container volumes up 12%
    market, strong growth                         Consolidated Marine Bulk Throughput up 15.9%, 4x growth in 4 years
           in bulk
                                                  New coal handling project at ULCT successfully launched

      Revenue growth                              Revenue grew to USD 343.6 million (+4%) driven by growth in both Consolidated Container and
     supported by non-                            Non-Container revenue
     container revenues                           Consolidated Non-container Revenue grew 16.8% reaching 26% of total Group revenue

                                                  FY 2018 Adjusted EBITDA up 7.8%*
                                                  Total Operating Cash Costs decreased 2.0% (+5.8 % if adjusted for FX) despite double digit
      Strict cost control,                        growth in container and bulk volumes
      margin expansion
                                                  Adjusted EBITDA Margin* increased to 63.2%* vs. 61.0%* in 2017 resulting from strong volume
                                                  growth combined with strict cost discipline

                                                  Free Cash Flow of USD 133.6 million*
     Healthy cash flow
        generation,                               Net Debt decreased by a further USD 47.1 million* in 2H18 resulting in a total decrease of
   deleveraging remains                           USD 85.6 million* over last 12 months
          priority                                Leverage decreased by 0.7x to 3.6x* Net Debt/ Adjusted EBITDA during 2018

(1) Source: company estimates based on market data by ASOP

                                                                                                                                                                  5
                                           Definitions for terms marked in this presentation with capital letters are provided in the Appendices at pages 28-29
CONTAINER MARKET RECOVERY, IMPROVING UTILISATION
Solid growth in Russian container market(1) Russian container market dynamics
● Market grew 10% in 2018 with Baltic basin growth mln TEU
accelerating to 12% supported by the route’s cost
advantages and increased vessel capacity
4.9 5.2 5.1 4.9
● Laden imports grew 8%, driven by continuous market 4.5 4.4
3.7 3.8 3.8
recovery and consumer confidence 3.5
3.0
● Dec18 monthly volumes are at the highest level since 2.0
2.4 2.4
1.5
Jun14 0.9 1.1
0.5 0.7
Capacity utilisation currently strong: above 70%(2)
Growth has continued in 2019 with market up 8.4% in
00
'03
'04
'05
'06
'07
'08
'11
'12
'13
'14
'15
'18
'01
'02
'09
'10
'16
'17
January-February ‘19 Source: ASOP
Containerisation in Russia remains low Russian container market growth
TEUs per 1000 capita, 2018 mln TEU
10%
4.9 2017 2018
4.4
11%
131 133 138
13%
104
2.2 2%
2.0
1.5
35 1.3
0.8 0.8
Russia World Turkey Europe North America Total market Saint-Petersburg area Far East Black Sea
Source: Drewry; some 2018 numbers estimated Source: Company estimates based on market data by ASOP
(1) Based on FY 2018 market data by ASOP
(2) Company estimates throughput based on ASOP. Capacity estimated on companies websites (www.port-bronka.ru, www.deloports.ru, www.terminalspb.ru, www.nmtp.info and other public available sources).
Yard capacity for Group used for calculations.
6
Definitions for terms marked in this presentation with capital letters are provided in the Appendices at pages 28-29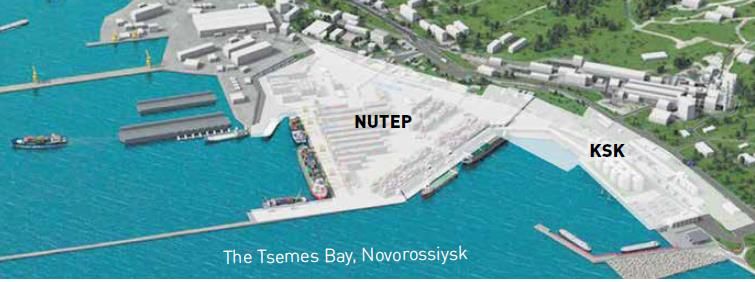
LADEN EXPORT GROWTH TREND CONTINUES
       Over the last five years the structure of the container market has significantly changed
       ● Laden export containers have increased 76%(1)
       ● More than 80%(1) of the imported containers are exported full, versus 40%(1) five years ago
       ● Import of over 100,000 TEU p.a. of empty boxes, representing 5.2%(1) of total imports

Laden export growth is a sustained trend over the last five years                                                                              Laden export
mln TEU                                                                                                                                       mln TEU
                                                                                                                                                                     76%

                                                                                                                                                                                1.35

                                                                                                                                                              0.76
                                            -0.3                0.1
                          0.6
                                                                                   -0.8                                                                       2013              2018
                                                                                                                                               Source: ASOP

        5.2
                                                                                                                              -6%              Share of laden boxes
                                                                                                       0.1

                                                                                                                           4.9                   XX    - Laden export/total export ratio in Saint-
                                                                                                                                                       Petersburg area(2)

                                                                                                                                                                                0.8x

                                                                                                                                                              0.4x

      2013              Laden              Laden              Empty               Empty            Cabotage               2018                                2013              2018
Source: ASOP            Export             Import             Import              Export          and Transit                                  Source: ASOP

(1)   Company estimates based on market data by ASOP
(2)   Saint-Petersburg and Ust-Luga

                                                                                                                                                                                                     7
                                           Definitions for terms marked in this presentation with capital letters are provided in the Appendices at pages 28-29
LADEN EXPORT GROWTH BENEFITS STRONG PLAYERS
                        Continuous containerisation                                                                            Stabilized Ruble
                                                                 Growth of containerised export
                 Increased demand from global market                                                          Government initiative to support export

                                                             Key implications for the market

Supports full import             Builds resilience to                       Improves capacity                         Protects revenue per                Drives need for value-
     growth                        market bumps                                utiilisations                                  TEU                            added-services

                                                                                                                      Higher tariffs for laden
                                Export volumes
                                                                           Average dwell time for                     export container vs.
                                sustained by
Reduces shipping line                                                      laden box is much                          empty                               Russian exporters will
                                international demand
network costs                                                              longer than for empty                                                          demand additional and
                                                                                                                      More additional
                                Exporters benefit from                                                                                                    more efficient supply-
Increased cost                                                             Laden export                               services: stuffing and
                                further economy-of-                                                                                                       chain-management
competitiveness for                                                        containers require                         unstuffing, organisation
                                scale, efficiencies and                                                                                                   solutions
import goods                                                               more terminal yard-                        of block train
                                technological
                                                                           space                                      operations at terminals
                                improvements
                                                                                                                      etc

                                         Laden export growth benefits high-end and well-equipped terminals

 Heavier export boxes drives capacity injections by the shipping lines, who demand improved and consistent operational performance from container
 terminals
 More complex business solutions, involving multiple parties (forwarder, cargo owner, rail operator, shipping lines etc.)
 Export requires high railway infrastructure/capacity, and large well-equipped storage areas
 Increased demand for stuffing, re-handling and warehouse capacity

                                                                                                                                                                              8
                                   Definitions for terms marked in this presentation with capital letters are provided in the Appendices at pages 28-29
OUTPERFORMING THE CONTAINER MARKET
                                                                                                                                                     Consolidated Marine Container
                                 GPI delivered container volume growth of 12% compared to 10% market                                                 Throughput,
                                 growth(1)                                                                                                           mln TEUs
   Ahead of the                                                                                                                                                          12%
     market                      GPI handles almost every second laden export container in NW and FE of
                                 Russia(1)
                                                                                                                                                                               1.4
                                                                                                                                                                  1.2

                                  FCT, PLP and ULCT are the only Russian ports of calls for Maersk's world                                                        2017         2018
   Expanding                      largest ice class container vessels due to unique portfolio of services
  the customer                    Unified Client Service center across all GPI terminals: fast and easy-to-
      value                       access direct customer service
   proposition
                                  PLP introduced new IT solution for terminal operating system improving level
                                  of service and efficiency of operations

                                                                                                                                                     Estimated capacity of GPI
                                                                                                                                                     terminals
                                   Strong growth in laden export along with relocation of equipment, staff                                                          Yard         Berth and
                                   optimisation led to change in estimated yard capacity of terminals                                                             capacity      gate capacity
      Growing
     utilisation                                                                                                                                       PLP          350               1 000

         rate                      Yard capacity may be efficiently and relatively quickly restored in line with                                       FCT          915               1 250
                                   market demand through planned maintenance and equipment upgrades                                                    VSC          650               650

                                                                                                                                                       ULCT         440               440

(1) Company estimates based on market data by ASOP

                                                                                                                                                                                                9
                                           Definitions for terms marked in this presentation with capital letters are provided in the Appendices at pages 28-29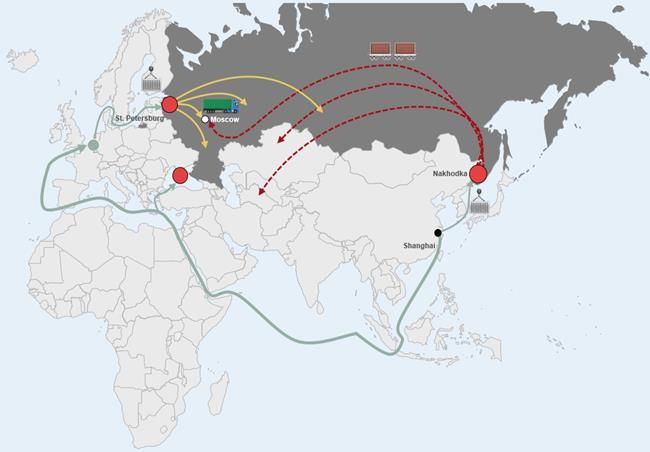
STRONG GROWTH IN BULK CONTINUES
                                                                                                                     Consolidated Marine Bulk Throughput, mln tonnes
 Bulk throughput grew 4 times in 4 years, driven by:
 ● Expansion of coal handling capacity at VSC, coal handling launched at ULCT
                                                                                                                                                                    3.1
 ● Strong growth in metal and timber handling at PLP                                                                                                         2.7
                                                                                                                                                      2.2
 ● Detailed plans are in place to manage the environmental and health & safety                                               0.8         1.3
   risks posed by the introduction of coal-handling operations
                                                                                                                            2014        2015          2016   2017   2018
 Consolidated Non-Container Revenue increased from 16% of total revenue in
 2014 to 26% in 2018                                                                                                 Share of Consolidated Non-Container Revenue in
                                                                                                                     total revenue, %
 New coal handling facility launched in ULCT in December 2018
                                                                                                                                                                    26%
 ● Excellent rail connectivity and capability to support up to 1.0 million tons of coal                                                                      23%
                                                                                                                                                      19%
   shipments per year                                                                                                       16%          16%

 Growth in group asset utilisation
                                                                                                                            2014        2015          2016   2017   2018

                                                                                                                                                                           10
                               Definitions for terms marked in this presentation with capital letters are provided in the Appendices at pages 28-29
STRONG FINANCIAL PERFORMANCE
Revenue
17% growth in Consolidated Non-Container USD mln 4%
Revenue, largely driven by bulk cargoes
344
Consolidated Container Revenue(3) up 0.8%. 10.1%
reduction in revenue by TEU(1) is compensated by
Strong growth 331 -3.3 2.1 14.3
12% growth* in container volume
in revenue
● Only low single digit percentage of the reduction
was attributable to change in tariffs; remainder is
largely attributable to lower share of imports and
customer mix 2017 Deconsolidation Container Non-Container 2018
of LT revenue revenue
Total Operating Total Operating Cash
Cash Costs, mln Costs adjusted for FX(2),
USD mln USD
Operating Total Operating Cash Cost in USD decreased by 2% USD mln USD mln
-2% 5.8%
leverage and
FX adjusted Total Operating Cash Cost(2)* grew by
focus on cost
efficiency just 5.8% despite strong growth in container and 129* 126* 129* 136*
bulk volumes
2017 2018 2017 2018
2018 Adjusted EBITDA increased by 7.8% Adjusted EBITDA and Adjusted EBITDA margin
USD mln
Margin 8%
expansion, Adjusted EBITDA margin expanded 224bp to
growth in 63.2%* compared to 61.0%* in 2017 driven by 61%* 63%*
Adjusted strong volume growth along with strict cost
EBITDA discipline 202* 217*
2017 2018
(1) On consolidated basis
(2) Management estimate, calculated as if effective USD/RUB exchange rate in 2018 was the same as in 2017. The average exchange rate of the Russian rouble weakened against the US dollar by 7.8% in
2018 compared to 2017.
(3) Adjusted for the deconsolidation of LT 11
Definitions for terms marked in this presentation with capital letters are provided in the Appendices at pages 28-29RAPID DELEVERAGE
Net Debt reduced by c. USD 86 million* in 2018, Debt maturity profile as of 31.12.2018
● Net Debt reduced by c. USD 570 million* since NCC USD mln
acquisition at the end of 2013
As of 31 December 2018: 314*
● Net Debt / Adjusted EBITDA of 3.6x*, down 0.7x* since
(1)
31.12.2017
144*
● Share of public debt is approximately 99%, share of fixed
92 21* 72* 8*
rate borrowings is 100%
Cash & 2019 2020 2021 2022-2023 2024
● Weighted average interest rate of debt portfolio c. 8.5% Equivalents
as of
Average
31.12.2018
Accelerated deleveraging in line with long term strategy
● Proceeds from LT sale directed for further deleveraging(1)
Debt portfolio profile by currency
● Bilateral loan prepaid ahead of schedule in 2H18
2017 2018
1%
26%
RUB
USD
74%
99%
Source: Company data
(1) Total consideration of 1.9 billion Russian rubles, see press release as of 16.08.2017
12
Definitions for terms marked in this presentation with capital letters are provided in the Appendices at pages 28-29INDUSTRY OUTLOOK AND STRATEGIC FOCUS
Export co-driving container market growth, directly supporting continuous growth of container capacity
Industry outlook into Russian terminals
and future
Russian trade maintains pace for improved containerisation
opportunities
Improved terminal capacity utilisation, while driving demand from development of business
Drive efficiencies and improvements in our customers’ experiences
GPI’s priorities Grow and expand the portfolio of value-added-services
Continue solid cost control measures and asset optimization within our group
Well-invested terminals enable moderate maintenance CAPEX
Continued focus
Opportunistic approach to attractive smaller scale bulk projects, whereby optimising group asset
on FCF and
utilisation
deleveraging
Use strong free cash flow for further deleveraging
13
Definitions for terms marked in this presentation with capital letters are provided in the Appendices at pages 28-29APPENDIX #1
Global Ports Group
14STRONG POSITIONS IN KEY BASINS
Baltic Basin
FINLAND RUSSIA
MLT Kotka
MLT Helsinki Moby Dik Petrolesport
GULF OF FINLAND
BALTIC SEA First Container Far East Basin
Terminal
Ust-Luga
ESTONIA Container RUSSIA
Terminal St. Petersburg Moscow
Vostochnaya
51% of Russia’s container CHINA Stevedoring Company
traffic
Black Sea Basin SEA OF
16% of Russia’s Nakhodka JAPAN
container traffic
30% of Russia’s
container traffic
Shanghai
Baltic Basin Far East Basin
Key entry gateway to Russia Supplying Russian Far East, CIS
countries (Kazakhstan, Tajikistan,
Excellent maritime access to key Uzbekistan) as well as central
consumption areas St. Petersburg Russia (including Moscow)
and Moscow
The fastest route to ship cargoes
The cheapest route to deliver cargo from China to Moscow: up to 15-
from China to European part of 20 days faster than via the Baltic
Russia(1) Basin (1)
Source: Based on FY 2018 market data by ASOP
(1) Company estimate based on public sources
15
Definitions for terms marked in this presentation with capital letters are provided in the Appendices at pages 28-29EXCELLENT CONTAINER AND MULTIPURPOSE TERMINALS
IN KEY GATEWAYS
Baltic Sea Basin Far East Basin
51% of Russian market FY 2018 throughput 30% of Russian market FY 2018 throughput
PLP FCT
• Capacity: 350 ths. TEU • Capacity: 915 ths. TEU Vladivostok
Moby Dik Finland
• Capacity: 275 ths. TEU Russia
St. Petersburg VSC
Finnish transit Region
Okhotsk • Capacity: 650 ths. TEU
Sea
Other terminals
VMTP
China
• Capacity: 300 ths. TEU Russia
• Capacity: 650 ths. TEU
Estonia
Baltic Sea
Moscow
Baltic countries’ transit Black Sea Basin
16% of Russian market FY 2018 throughput
Latvia
Bronka Russia
• Capacity: 500 ths. TEU
Novorossiysk
NCSP
Lithuania
CT St-Petersburg • Capacity: 440 ths. TEU
Black
Sea
Kaliningrad • Capacity: 750 ths. TEU
Region
Turkey
BSC and Kaliningrad SCP Ust-Luga NUTEP
• Capacity: 540 ths. TEU • Capacity: 440 ths. TEU • Capacity: 400 ths. TEU
Company estimates based on market data by ASOP, companies websites (www.port-bronka.ru, www.deloports.ru, www.terminalspb.ru, www.nmtp.info and other public available sources).
Note: Yard capacity of Global Ports terminals is given on the slide. Berth and gate capacity remains unchanged: PLP – 1 000 ths TEU, VSC – 650 ths TEU, FCT – 1 250 ths TEU, ULCT – 440 ths TEU, Moby Dik
– 400 ths TEU. To maximise the efficiency of its operations, the Group may choose to flex headcount, working hours and used equipment at its terminals. As a result, current actual capacity may differ from the
published numbers. 16
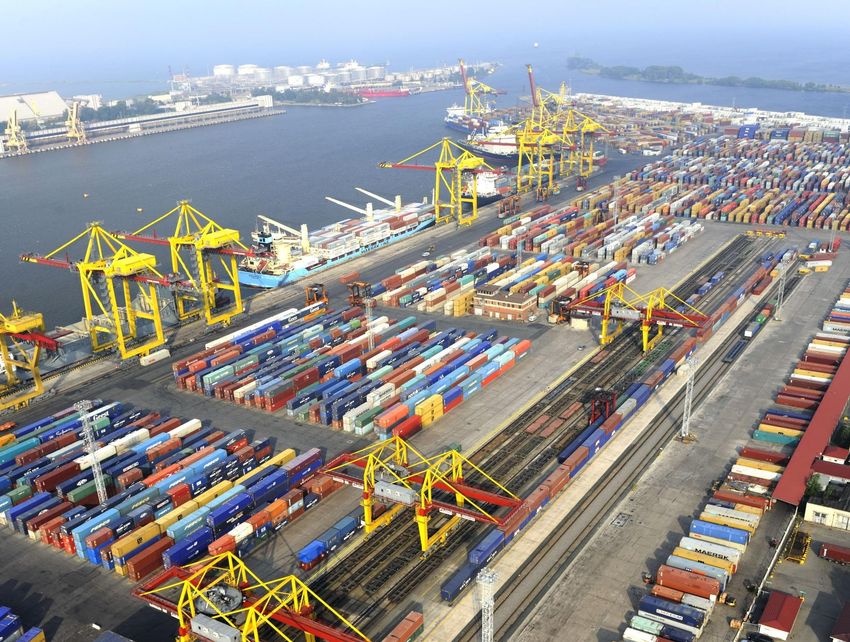
Definitions for terms marked in this presentation with capital letters are provided in the Appendices at pages 28-29EXCELLENT ASSET BASE
Terminals area Infrastructure Equipment
Vast land area Best in class hinterland Large fleet of equipment
connections
323 ha of land, equivalent to
more that 450 football fields
24 Quays
4.9 km of quay
13.5 m - max depth of access channel 21 km of internal railway tracks
7 065 plugs Direct access to Western Hight Speed
Diameter in Saint-Peterburg
25 Ship to shore container cranes (STS)
Access to Trans-Siberian railway at
VSC 54 rubber tyred gantry cranes (RTG)
17
Definitions for terms marked in this presentation with capital letters are provided in the Appendices at pages 28-29CAPACITY OF CONTAINER TERMINALS
• The capacity of a container terminal can be defined as the maximum traffic it can handle in a given scenario.
• There are three key “bottlenecks” defining throughput capacity of a container terminal
1 - Berth capacity 3 - Gate capacity
• Number of berths • Number of lanes
• Berth occupancy • Gate processing time Turn-around time
• Length of standard vessel • Hinterland connectivity
• Berth equipment and crane management
2 - Yard capacity
• Number of ground slots
• Stacking height
• Average dwell per type, and number of equipment
1 - Berth capacity 2 - Yard capacity 3 - Gate capacity
Cost of construction High Low High
Time of construction Long Medium Long
Barriers to entry High Low once there is berth and gate High
18
Definitions for terms marked in this presentation with capital letters are provided in the Appendices at pages 28-29PARTNERSHIP OF APM TERMINALS AND DELO: UNMATCHED
COMBINATION ON RUSSIAN MARKET
Rationale of the partnership: joining forces of leading international and regional players
Realised full opportunities of the Russian container market – one of the few sizable and undercontainerised markets in the world
Combination of global expertise and local knowledge to strengthen the value proposition for clients
Benefits for Global Ports
⚫ Access to world best practices in terminal operation; very strong safety culture, offer joint solutions and develop new
services
⚫ Access to APM Terminals’ scale: framework agreements with the main suppliers, management development programs, etc.
⚫ Access to Delo Group’ deep local knowledge
Global Ports ownership structure(1)
APM Terminals is a leading international Delo Group is one of the largest private
20.50% container terminal operating company transportation and ports logistics holding
30.75% headquartered in The Hague, Netherlands companies in Russia
9% ⚫ 74 ports, 117 inland service locations; ⚫ Two port terminals and five inland
employs c.22,000 people terminals; employs a workforce of over
9% 30.75% 2,000 people
⚫ Revenue of USD 4.1bn and EBITDA of
USD 0.7bn in FY2017 ⚫ Revenue of USD 91.1 million and
⚫ A.P. Møller - Mærsk A/S rated by S&P
EBITDA of USD 67.6 mln in 1H2018(2)
LLC Management Company "Delo" and Moody’s: BBB/Baa3 respectively ⚫ DeloPorts rated by S&P and Fitch:
APM Terminals B.V. (3) B+/BB- respectively
Ilibrinio Establishment Limited
(3)
Polozio Enterprises Limited
Free Float
(1) As of March 2019
(2) Converted from Russian Rubles at 1H2018 average USD/RUB exchange rate (59.5 RUB per USD)
(3) Ilibrinio Establishment Limited and Polozio Enterprises Limited (former owners of NCC Group) each own 9% of the share capital of Global Ports.
19
Definitions for terms marked in this presentation with capital letters are provided in the Appendices at pages 28-29DELO GROUP – ONE OF THE LARGEST PRIVATE TRANSPORTATION
AND LOGISTICS HOLDING COMPANIES IN RUSSIA (1)
Overview Main operating and financial indicators for DeloPorts
Unit 1H2018
Key assets of Delo Group (established in 1993) include:
● Marine container and grain terminals in the port of No. of marine terminals # 2
Novorossiysk (Black Sea basin) and a service company
Container throughput/capacity kTEU 186/400
operating agency, bunkering and tugboat services – all
consolidated under DeloPorts Grain throughput/capacity mln ton 2.4/4.5
● Intermodal operator Ruscon, owner of trucks, platforms,
Revenue(2) mln USD 91.1
inland terminals, customs and storage facilities
EBITDA(2) mln USD 67.6
IFRS Financial statements for DeloPorts published since
2012, local bonds listed on MOEX EBITDA Margin % 74.2
DeloPorts rated by S&P and Fitch: B+/BB- respectively Net debt/EBITDA(2) x 2.2
DeloPorts rated by Expert RA on ruA level
Delo Group’ owners are much aligned with the Group’s Key assets of DeloPorts: NUTEP and KSK
current strategy and governance structure and highly value
the potential of cooperation with Global Ports Group.
On 12 April 2018 Delo Group has acceded to the shareholder
agreement with APM Terminals B.V. and TIHL has been
released from its obligations under such agreement
(1) Source: www.delo-group.ru
(2) Converted from Russian Rubles at 1H2018 average USD/RUB exchange rate (59,5 RUB per USD)
20
Definitions for terms marked in this presentation with capital letters are provided in the Appendices at pages 28-29APM Terminals - member of A.P. Moller-Maersk A/S
Overview Main operating and financial indicators for APM Terminals
Unit 2017
APM Terminals operates a global terminal network of 22,000
No. of marine terminals # 74
professionals with 74 operating port facilities and 117 Inland
Services operations in 58 countries around the globe
Number countries present # 58
Containers handled in 2017: 39.7 million TEUs(1)
Container throughput mlnTEU 39.7
Revenue(1) mln USD 4 138
EBITDA(1) mln USD 705
EBITDA Margin % 17
Diversified Global Portfolio
Diversified Global Portfolio
Number of terminals
23
19
16
15
Source: www.apmterminals.com
(1) weighted by equity share
21
Definitions for terms marked in this presentation with capital letters are provided in the Appendices at pages 28-29APPENDIX #2
Selected operational and
financial information
22SELECTED OPERATIONAL INFORMATION FOR 2018(1)
FY17 FY18 FY17 FY18
Gross throughput Gross throughput
Russian Ports segment Finnish Ports segment
Containerised cargo (thousand TEUs)
FCT 554 617 Containerised cargo (thousand TEUs) 116 107
PLP 206 246
VSC 371 419
Moby Dik 168 82 Oil Products Terminal segment
ULCT 74 69
Oil products Gross Throughput
Total Russian Ports segment 1 373 1 433 2.1 2.1
(million tonnes)
Non-containerised cargo
Ro-ro (thousand units) 23.9 20.3
Cars (thousand units) 95.4 121.1
Bulk cargo (thousand tonnes) 2 731 3 162
(1) Data is on a 100% basis. Source: Management accounts
(2) Total throughput of Russian Ports excludes the throughput of Yanino which in 2017 and 2018 was 116 thousand TEUs and 123 thousand TEUs respectively and the throughput of LT which in 2017 and 2018
was 172 thousand TEUs and 119 thousand TEUs respectively
23
Definitions for terms marked in this presentation with capital letters are provided in the Appendices at pages 28-29SELECTED OPERATIONAL INFORMATION (CONTINUED)
2018 2018
Capacity(1) (end of the period)
Russian Ports segment Finnish Ports segment
Russian Marine Container Terminal Capacity
Annual container handling capacity
(Thousand TEUs)
PLP 350 MLT Kotka 270
VSC 650 MLT Helsinki 150
Moby Dik 275 Total 420
FCT 915
ULCT 440
Total Global Ports 2 630
Yanino, inland container terminal
Annual container handling capacity
200
(Thousand TEUs)
Annual general cargo capacity (Thousand tonnes) 400 Oil Products Terminal Segment
Storage Capacity (in thousand cbm) 1 052
(1) Yard capacity of Global Ports terminals is given on the slide. Berth and gate capacity remains following: PLP – 1 000 ths TEU, VSC – 650 ths TEU, FCT – 1 250 ths TEU, ULCT – 440 ths TEU, Moby Dik –
400 ths TEU. To maximise the efficiency of its operations, the Group may choose to flex headcount, working hours and used equipment at its terminals. As a result, current actual capacity may differ from the
published numbers 24
Definitions for terms marked in this presentation with capital letters are provided in the Appendices at pages 28-29GLOBAL PORTS CONSOLIDATED INCOME STATEMENT
Summary Income Statement
USD million 2017 2018
Revenue 330.5 343.6
Cost of sales (148.5) (136.0)
Gross profit 182.0 207.6
Administrative, selling and marketing expenses (42.7) (38.9)
Share of profit/(loss) of joint ventures (73.3) (12.4)
Other gains/(losses) - net (71.3) (24.6)
Operating profit/(loss) (5.3) 131.6
Finance income/(costs) - net (18.8) (185.3)
Profit/(loss) before income tax (24.1) (53.6)
Income tax expense (28.8) (4.7)
Profit/(loss) for the period (52.9) (58.3)
Profit/(loss) attributable to:
Owners of the Company (53.0) (59.3)
Non-controlling interest 0.0 1.0
Adjusted EBITDA* 201.6 217.3
Adjusted EBITDA Margin* 61.0% 63.2%
Source: Global Ports consolidated financial statements
25
Definitions for terms marked in this presentation with capital letters are provided in the Appendices at pages 28-29GLOBAL PORTS CONSOLIDATED BALANCE SHEET
Summary Balance Sheet
USD million 31-Dec-17 31-Dec-18
PP&E (incl. prepayments) 561.7 468.5
Intangible assets 690.9 565.2
Derivative financial instruments (non-current assets) 58.8 -
Other non-current assets 117.0 100.2
Cash and equivalents 130.4 91.6
Derivative financial instruments (current assets) 19.5 -
Other current assets 77.2 62.8
Total assets 1 655.6 1 288.3
Equity attributable to the owners of the Company 361.1 231.8
Minority interest 16.1 14.2
LT borrowings 1 005.7 850.8
Other non-current liabilities 173.2 130.4
ST borrowings 69.1 21.2
Other current liabilities 30.4 39.9
Total equity and liabilities 1 655.6 1 288.3
Source: Global Ports consolidated financial statements
26
Definitions for terms marked in this presentation with capital letters are provided in the Appendices at pages 28-29GLOBAL PORTS CONSOLIDATED CASH FLOW STATEMENT
Summary Cash Flow Statement
USD million 2017 2018
Cash generated from operations 196.7 208.0
Dividends received from joint ventures 10.8 1.7
Tax paid (33.5) (35.4)
Net cash from operating activities 173.9 174.3
Cash flow from investing activities
Purchases of intangible assets (1.8) (2.6)
Purchases of property, plant and equipment (28.0) (40.8)
Proceeds from sale of property, plant and equipment 0.3 0.5
Loans granted to related parties (7.5) (1.4)
Loans repayments received 1.2 0.3
Disposal of subsidiary 28.8
Interest received 1.3 1.6
Net cash used in investing activities (34.6) (13.5)
Cash flow from financing activities
Net cash outflows from borrowings and financial leases (60.3) (154.9)
Interest paid and Proceeds from derivative financial instruments (68.8) (41.3)
Net cash from/(used) in financing activities (129.1) (196.2)
Net increase/(decrease) in cash and cash equivalents 10.2 (35.4)
Cash and cash equivalents at beginning of the period 119.3 130.4
Exchange gains/(losses) on cash and cash equivalents 1.0 (3.5)
Cash and cash equivalents at end of the period 130.4 91.6
Source: Global Ports consolidated financial statements
27
Definitions for terms marked in this presentation with capital letters are provided in the Appendices at pages 28-29DEFINITIONS
Adjusted EBITDA (a non-IFRS financial measure) for Global Ports Group is defined as profit for the period before income tax expense, finance income/(costs)—net, depreciation of property, plant
and equipment, amortisation of intangible assets, share of profit/(loss) of joint ventures accounted for using the equity method, other gains/(losses)—net and impairment of goodwill and property,
plant and equipment and intangible assets;
Adjusted EBITDA Margin (a non-IFRS financial measure) is calculated as Adjusted EBITDA divided by revenue, expressed as a percentage;
ASOP is “Association of Sea Commercial Ports” (www.morport.com);
Baltic Sea Basin is the geographic region of northwest Russia, Estonia and Finland surrounding the Gulf of Finland on the eastern Baltic Sea, including St. Petersburg, Tallinn, Helsinki and Kotka;
Cash Administrative, Selling and Marketing expenses (a non-IFRS financial measure) is defined as administrative, selling and marketing expenses, adjusted for depreciation and impairment of
property, plant and equipment, amortisation of intangible assets;
Cash Costs of Sales (a non-IFRS financial measure) is defined as cost of sales, adjusted for depreciation and impairment of property, plant and equipment, amortisation and impairment of
intangible assets;
CD Holding group consists of Yanino Logistics Park (an inland terminal in the vicinity of St. Petersburg), CD Holding and some other entities. The results of CD Holding group are accounted in the
Global Ports’ financial information using the equity method of accounting;
Consolidated Container Revenue is defined as revenue generated from containerised cargo services;
Consolidated Inland Container Throughput is defined as combined container throughput by consolidated inland terminals: LT;
Consolidated Inland Bulk Throughput is defined as combined bulk throughput by consolidated inland terminals: LT;
Consolidated Marine Container Throughput is defined as combined marine container throughput by consolidated marine terminals: PLP, VSC, FCT and ULCT;
Consolidated Marine Bulk Throughput is defined as combined marine bulk by consolidated terminals: PLP, VSC, FCT and ULCT;
Consolidated Non-Container Revenue is defined as a difference between total revenue and Consolidated Container Revenue;
Container Throughput in the Russian Federation Ports is defined as total container throughput of the ports located in the Russian Federation, excluding half of cabotage cargo volumes.
Respective information is sourced from ASOP (“Association of Sea Commercial Ports”, www.morport.com);
Far East Basin is the geographic region of southeast Russia, surrounding the Peter the Great Gulf, including Vladivostok and the Nakhodka Gulf, including Nakhodka on the Sea of Japan;
First Container Terminal (FCT) is located in the St. Petersburg harbour, Russia’s primary gateway for container cargo. The Global Ports Group owns a 100% effective ownership interest in FCT.
The results of FCT are fully consolidated;
Free Cash Flow (a non-IFRS financial measure) is calculated as Net cash from operating activities less Purchases of PPE;
Functional Currency is defined as the currency of the primary economic environment in which the entity operates. The functional currency of the Company and certain other entities in the Global
Ports Group is US dollars. The functional currency of the Global Ports Group’s operating companies for the years under review was (a) for the Russian Ports segment, the Russian Rouble and (b)
for the Oil Products Terminal segment, and for the Finnish Ports segment, the Euro;
Logistika Terminal (LT) is an inland container terminal providing a comprehensive range of container freight station and dry port services at one location. The terminal is located to the side of the
St. Petersburg - Moscow road, approximately 17 kilometers from FCT and operates in the Shushary industrial cluster. In September 2018 the Group completed the previously announced sale of its
holding in JSC «Logistika-Terminal», one of the Group’s two inland terminals, to PJSC TransContainer for a consideration of 1.9 billion Russian roubles See Group’s release dated 16 August 2017;
28
Definitions for terms marked in this presentation with capital letters are provided in the Appendices at pages 28-29DEFINITIONS
MLT group consists of Moby Dik (a terminal in the vicinity of St-Petersburg) and Multi-Link Terminals Oy (terminal operator in Vuosaari (near Helsinki, Finland) and Kotka, Finland). The results of
MLT group are accounted for in the Global Ports’ financial information using the equity method of accounting (proportionate share of net profit shown below EBITDA);
Moby Dik (MD) is located in Kronshtadt on the St. Petersburg ring road, approximately 30 kilometers from St. Petersburg, at the entry point of the St. Petersburg channel. It is the only container
terminal in Kronstadt. The Global Ports Group owns a 75% effective ownership interest in MD, Container Finance LTD currently has a 25% effective ownership interest. The results of MD are
accounted for in the Global Ports’ financial information using the equity method of accounting (proportionate share of net profit shown below EBITDA);
Net Debt (a non-IFRS financial measure) is defined as the sum of current borrowings, non-current borrowings and derivative financial instruments less cash and cash equivalents and bank deposits
with maturity over 90 days;
Petrolesport (PLP) is located in the St. Petersburg harbour, Russia’s primary gateway for container cargo. The Group owns a 100% effective ownership interest in PLP. The results of PLP are fully
consolidated;
Ro-Ro, roll on-roll off is cargo that can be driven into the belly of a ship rather than lifted aboard. Includes cars, buses, trucks and other vehicle
TEU is defined as twenty-foot equivalent unit, which is the standard container used worldwide as the uniform measure of container capacity; a TEU is 20 feet (6.06 metres) long and eight feet (2.44
metres) wide and tall;
Total Debt (a non-IFRS financial measure) is defined as a sum of current borrowings, non-current borrowings and derivative financial instruments;
Total Operating Cash Costs (a non-IFRS financial measure) is defined as Global Ports Group’s cost of sales, administrative, selling and marketing expenses, less depreciation and impairment of
property, plant and equipment, less amortisation and impairment of intangible assets;
Ust Luga Container Terminal (ULCT) is located in the large multi-purpose Ust-Luga port cluster on the Baltic Sea, approximately 100 kilometers westwards from St. Petersburg city ring road. ULCT
began operations in December 2011. The Global Ports Group owns a 80% effective ownership interest in ULCT, Eurogate, the international container terminal operator, currently has a 20% effective
ownership interest. The results of ULCT are fully consolidated;
Vopak E.O.S. includes AS V.E.O.S. and various other entities (including an intermediate holding) that own and manage an oil products terminal in Muuga port near Tallinn, Estonia. The Group owns
a 50% effective ownership interest in Vopak E.O.S. The remaining 50% ownership interest is held by Royal Vopak. The results of Vopak E.O.S. are consolidated in the Global Ports’ financial
information using the equity method of accounting (proportionate share of net profit shown below EBITDA);
Vostochnaya Stevedoring Company (VSC) is located in the deep-water port of Vostochny near Nakhodka on the Russian Pacific coast, approximately eight kilometers from the Nakhodka-
Vostochnaya railway station, which is connected to the Trans-Siberian Railway. The Group owns a 100% effective ownership interest in VSC. The results of VSC are fully consolidated;
Weighted average effective interest rate is the average of interest rates weighted by the share of each loan in the total debt portfolio;
Yanino Logistics Park (YLP) is the first terminal in the Group’s inland terminal business and is one of only a few multi-purpose container logistics complexes in Russia providing a comprehensive
range of container and logistics services at one location. It is located approximately 70 kilometers from the Moby Dik terminal in Kronstadt and approximately 50 kilometres from PLP. The Global
Ports Group owns a 75% effective ownership interest in YLP, Container Finance LTD currently has a 25% effective ownership interest. The results of YLP are accounted for in the Global Ports’
financial information using the equity method of accounting.
29
Definitions for terms marked in this presentation with capital letters are provided in the Appendices at pages 28-29INVESTOR
RELATIONS
Mikhail Grigoriev
Phone: +357 25 313 475
Mob: +7 (916) 991 73 96
Tatiana Khansuvarova
Phone: +357 25 313 475
Mob: +7 (921) 904 60 88
E-mail: ir@globalports.com
Web: www.globalports.com
Definitions for terms marked in this presentation with capital letters are provided in the Appendices at pages 26-27
30
30You can also read