THIRD QUARTER 2020 EARNINGS - MGM RESORTS INTERNATIONAL - OCTOBER 29, 2020
←
→
Page content transcription
If your browser does not render page correctly, please read the page content below
MGM RESORTS INTERNATIONAL
THIRD QUARTER 2020 EARNINGS

       OCTOBER 29, 2020
        MGM RESORTS INTERNATIONAL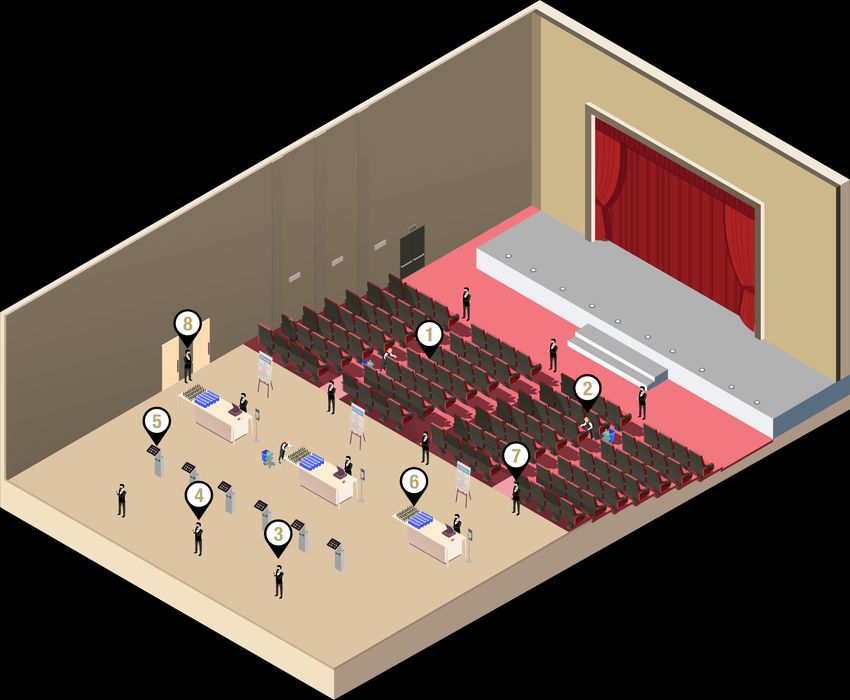
F O R WA R D - L O O K I N G S T A T E M E N T S
Statements in this presentation that are not historical facts are forward-looking statements, within the meaning of the Private Securities Litigation Reform Act of 1995 and involve risks and/or uncertainties, including
those described in the Company's public filings with the Securities and Exchange Commission. The Company has based forward-looking statements on management’s current expectations and assumptions and
not on historical facts. Examples of these statements include, but are not limited to, the Company’s expectations regarding its financial outlook (including expectations regarding its liquidity position, long term cost
savings and the performance at re-opened properties), the continued impact of the COVID-19 pandemic on the Company’s operations, and any benefits the Company expects to achieve from its strategic plans,
including its including the development of an integrated resort in Japan and positioning BetMGM as a leader in sports betting and iGaming (including BetMGM’s expected growth in new and existing jurisdictions
and projected market share, net revenues and the Company’s share of profits and losses). These forward-looking statements involve a number of risks and uncertainties. Among the important factors that could
cause actual results to differ materially from those indicated in such forward-looking statements include the continued impact of the COVID-19 pandemic, effects of economic and other conditions in the markets in
which the Company operates and competition with other destination travel locations throughout the United States and the world, the design, timing and costs of expansion projects, risks relating to international
operations, permits, licenses, financings, approvals and other contingencies in connection with growth in new or existing jurisdictions and additional risks and uncertainties described in the Company’s Form 10-K,
Form 10-Q and Form 8-K reports (including all amendments to those reports). In providing forward-looking statements, the Company is not undertaking any duty or obligation to update these statements publicly as
a result of new information, future events or otherwise, except as required by law. If the Company updates one or more forward-looking statements, no inference should be drawn that it will make additional
updates with respect to those other forward-looking statements.

                                                                                  MARKET AND INDUSTRY DATA
This presentation also contains estimates and information concerning the Company’s industry that are based on industry publications, reports and peer company public filings. This information involves a number
of assumptions and limitations and you are cautioned not to rely on or give undue weight to this information. The Company has not independently verified the accuracy or completeness of the data contained in
these industry publications, reports or filings. The industry in which we operate is subject to a high degree of uncertainty and risk due to a variety of factors, including those described in the “Risk Factors” section of
the Company’s public filings with the SEC. Third party logos and brands included in this presentation are the property of their respective owners and are included for informational purposes only.

                                         NOTE REGARDING PRESENTATION OF NON -GAAP FINANCIAL MEASURES
This presentation includes certain “non-GAAP financial measures” as defined in Regulation G under the Securities Exchange Act of 1934, as amended, including, among others, Adjusted EBITDAR, Table Games
Hold Adjusted Las Vegas Strip Resorts Adjusted Property EBITDAR, and Adjusted EPS. Schedules that reconcile the non-GAAP financial measures to the most directly comparable financial measures calculated
and presented in accordance with Generally Accepted Accounting Principles in the United States are included herein or in the Company’s earnings releases that have been furnished with the SEC and are available
on our website at www.mgmresorts.com.

  MGM RESORTS INTERNATIONAL                                                                                                                                                                                                     2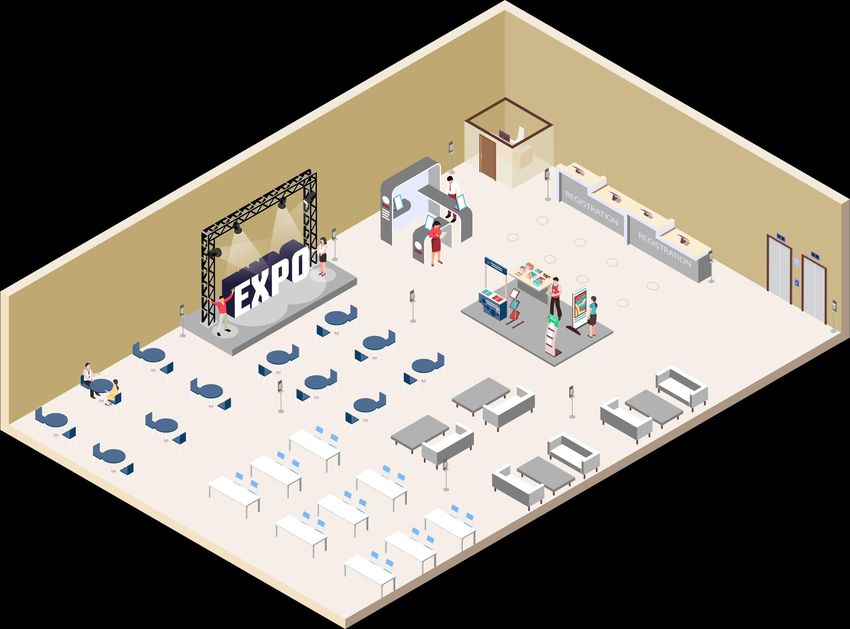
•   3Q 2020 HIGHLIGHTS

            •   BETMGM
 TABLE OF
CONTENTS    •   3Q 2020 FINANCIAL RESULTS

            •   SUPPLEMENTAL

                                            3
KEY 3Q 2020 TAKEAWAYS
 U.S. properties now all open
 • Health & safety remains our top priority
 • Improvement in U.S. domestic results compared with the second quarter
 • Strong U.S. regional performance, primarily driven by record results at MGM National Harbor, MGM Northfield Park and Gold Strike Tunica
 • Las Vegas market improving; believe that the city will recover to prior levels of business and tourist demand over time

 Strong operating model and liquidity position to help weather the crisis
 • Maintaining aggressive focus on costs to closely match demand levels
 • Continue to expect to permanently reduce approximately $450 million in property and corporate expenses, when demand returns to 2019 levels
 • Strong liquidity position with $7.8 billion1 of consolidated liquidity, or $4.5 billion2 excluding MGM China and MGM Growth Properties (“MGP”)
    – Adjusting for the $750 million senior notes issued in October, MGM Resorts consolidated liquidity position of $8.5 billion, or $5.2 billion excluding MGM
      China and MGM Growth Properties (“MGP”)

 Macau taking steps toward recovery
 • Limited market activity in 3Q 2020 due to logistical bottlenecks (visa process, nucleic acid testing requirements), but seeing gradual improvements in
   October
 • Continue to believe in the long-term success of Macau

 Fundamental long-term business outlook and growth opportunities remain unchanged
 • Sports betting and iGaming: BetMGM gaining market share momentum to become a leader in sports betting and iGaming
 • Japan: Remain excited about the Company’s partnership with ORIX to develop a leading international integrated resort serving key Asian markets

MGM RESORTS INTERNATIONAL               1   Cash and equivalents of $4.59 billion as of September 30, 2020, adjusted for $3.17 billion collectively available under MGM Resorts, MGM China, MGP’s revolving credit facilities
                                                                                                                                                                                                                                4
                                        2   Cash and equivalents of $3.54 billion as of September 30, 2020, adjusted for $922 million available under MGM Resorts’ revolving credit facility
3Q 2020 FINANCIAL HIGHLIGHTS
   ($ in U.S. millions, except per share information)

                                                              3Q19      3Q20     $ Change    % Change

   Consolidated Net Revenue                                  $3,314    $1,126     ($2,188)      (66%)

        Las Vegas Strip Resorts                              $1,507      $481     ($1,026)      (68%)

        Regional Operations                                    $935      $557       ($378)      (40%)

        MGM China                                              $738       $47       ($691)      (94%)

   Net Income (Loss) Attributable to MGM Resorts              ($37)    ($535)       ($498)        NM

   Diluted Earnings (Loss) Per Share                         ($0.08)   ($1.08)     ($1.00)        NM

   Adjusted EPS                                               $0.31    ($1.08)     ($1.39)        NM

   Consolidated Adjusted EBITDAR                                        ($49)

    Las Vegas Strip Resorts Adjusted Property EBITDAR          $441       $15       ($426)      (97%)

         Table Games Hold Adjusted Las Vegas Strip Resorts
                                                               $438       $21       ($417)      (95%)
         Adjusted Property EBITDAR

    Regional Operations Adjusted Property EBITDAR              $269      $146       ($123)      (46%)

    MGM China Adjusted Property EBITDAR                        $184     ($96)       ($280)        NM

    CityCenter Adjusted EBITDA                                 $109       $25        ($84)      (77%)

MGM RESORTS INTERNATIONAL                                                                               5
SEQUENTIAL IMPROVEMENT ACROSS THE PORTFOLIO

        ($ in U.S. millions)                                            Actual                                  Hold Adjusted

                                                                            3Q20 vs. 2Q20 Change                      3Q20 vs. 2Q20 Change
        Net Revenue                         2Q20            3Q20                                     2Q20     3Q20
                                                                                  $            %                         $           %

        Las Vegas Strip Resorts              $151            $481             +$331           219%   $142     $489     +$347       245%

        Regional Operations                  $89             $557             +$468           524%

        MGM China                            $33              $47              +$14           41%     $32     $54      +$22         70%

                                                                            3Q20 vs. 2Q20 Change                      3Q20 vs. 2Q20 Change
        Adjusted Property EBITDAR           2Q20            3Q20                                     2Q20     3Q20
                                                                                  $            %                         $           %

        Las Vegas Strip Resorts            ($104)             $15             +$120           NM     ($112)   $21      +$134        NM

        Regional Operations                ($112)            $146             +$258           NM

        MGM China                          ($116)            ($96)             +$20           17%    ($118)   ($93)    +$25         21%

MGM RESORTS INTERNATIONAL         Note: Calculations may not match exactly, due to rounding
                                                                                                                                             6
OUR LIQUIDITY POSITION REMAINS STRONG

                       As of September 30, 2020, the Company’s domestic operations had $4.5 billion of liquidity

                                                                 MGM Resorts                                                 MGM Resorts
          ($ in U.S. millions)                        (Ex. MGM China and MGP)               MGM China                 MGP    Consolidated
          Cash and Equivalents                                               $3,543                 $396              $655         $4,594
          Revolver Availability                                                $922                 $996          $1,250           $3,168
             Total Liquidity                                                $4,465                $1,392          $1,905           $7,762

   • MGM Resorts (consolidated) had $7.8 billion of liquidity as of September 30, 2020

   • In October 2020, MGM Resorts raised an additional $750 million of 4.75% senior notes due 2028, further strengthening MGM
     Resorts’ (consolidated) liquidity to $8.5 billion
     ➢ Adjusting for the recent $750 million notes, the Company’s domestic operations had $5.2 billion of liquidity

   • The Company currently has $700 million remaining under its agreement with MGP to redeem operating partnership units held
     by MGM Resorts for cash through February 2022

MGM RESORTS INTERNATIONAL                                                                                                                   7
SOLID DEBT PROFILE

     As of September 30, 2020, the Company’s domestic operations had $5.3 billion of debt, with no domestic maturities until 2022

      MGM RESORTS (EXCLUDING MGM CHINA AND MGP) – DEBT MATURITY PROFILE                                                CONSOLIDATED DEBT OVERVIEW
  $ in millions
                                                                                                                    ($ in U.S. millions)                    Debt
         Revolving Credit Facility Outstandings      Senior Notes   New $750 million notes issued in October 2020
                                                                                                                    MGM Resorts (Ex. MGM China and MGP)    $5,301

                                                                                                                    MGM China                              $2,654
          NO                                                        $1,425
                                                                                                                    MGP                                    $3,550
       MATURITIES
                                             $1,250                                                                    MGM Resorts Consolidated           $11,505
       UNTIL 2022               $1,000
                                                                                              $675         $750
                                                                    $550         $400

     2020          2021         2022          2023        2024      2025         2026        2027         2028

  • MGM Resorts (consolidated) had $11.5 billion of principal amount of debt as of September 30, 2020

  • Adjusting for the Company’s recent $750 million senior notes due in 2028 (closed in October 2020):
       ➢ MGM Resorts (consolidated) principal amount of debt was $12.3 billion
       ➢ MGM Resorts domestic operations principal amount of debt was $6.1 billion

  • MGM Resorts and MGM China have, under their respective credit facilities, waivers of financial maintenance covenants through
    1Q 2021 and 4Q 2021, respectively
MGM RESORTS INTERNATIONAL                                                                                                                                           8
ALL U.S. PROPERTIES NOW OPEN
              U.S. REOPENING DATES1
                                                                   • As of September 30, 2020, all MGM Resorts properties have reopened under local
                                        % of
  LAS VEGAS                  Date                                    COVID-19 guidelines
                                      3Q Open
  Bellagio                  6/4/20     100%
  MGM Grand                 6/4/20        100%                     • Operations strategy continues to prioritize:
  New York New York         6/4/20        100%                       ➢ Health and safety
  Excalibur                 6/11/20       100%                       ➢ Minimizing cash burn and maximizing portfolio-wide profit
  Luxor                     6/25/20       100%                       ➢ Cost control: Managing variable labor to closely match demand
  Mandalay Bay              7/1/20        100%
  ARIA                      7/1/20        100%                     • The Company provided benefits to its furloughed employees through September
  Vdara                     7/16/20       84%                        30, 2020 and negotiated union benefit contributions, which impacted the quarter:
  Mirage                    8/27/20       38%                        ➢ Las Vegas Strip: $20.7 million
  Park MGM                  9/30/20        1%                        ➢ Regional: $4.2 million
  REGIONAL                   Date
                                        % of                         ➢ CityCenter: $2.4 million (the Company’s 50% share)
                                      3Q Open                        ➢ Corporate: $1.5 million
  Gold Strike Tunica, MS    5/25/20       100%
  Beau Rivage, MS           6/1/20        100%
                                                                   • We continue to believe:
  MGM Northfield Park, OH   6/20/20       100%
  MGM National Harbor, MD   6/29/20       100%
                                                                     ➢ Regionals will lead the recovery in the U.S.
  MGM Springfield, MA       7/13/20       87%
                                                                     ➢ While our Las Vegas Strip properties remain more heavily impacted in the near
                                                                       term, the city will recover to prior levels of business and tourist demand over
  Borgata, NJ               7/26/20       73%
                                                                       time
  MGM Grand Detroit, MI     8/7/20        60%
  Empire City, NY           9/21/20       11%

MGM RESORTS INTERNATIONAL             1   Indicates opening dates to the general public
                                                                                                                                                         9
DEMONSTRATING OPERATING MODEL STRENGTH

 MGM 2020 savings include initiatives launched at the end of 2019 that began yielding tangible results prior to the COVID-19 crisis

    Since the beginning of the COVID-19 crisis, the Company has fundamentally re-evaluated how it operates, with a focus on
                               permanently eliminating redundancies and low profitability initiatives

                                                                                                                                                     Annualized
                               ($ in U.S. millions)
                                                                                                                                                      Run-rate1

                               MGM 2020                                                                                                                        $160
                               Corporate expense (gross)2                                                                                                      $180
                               Fixed labor                                                                                                                      $25
                               Operations streamlining                                                                                                          $85

                               Annualized domestic cost reductions                                                                                             $450

MGM RESORTS INTERNATIONAL        1   Annual run-rate savings relative to 2019 actuals
                                                                                                                                                                      10
                                 2   Represents gross corporate expense savings, a large portion of which gets allocated to property-level operating results
CONTINUED STRONG REGIONAL PERFORMANCE
U.S. REGIONAL YEAR-OVER-YEAR PERFORMANCE FOR PROPERTIES OPEN DURING ENTIRE 3Q 2020
(BEAU RIVAGE, GOLD STRIKE TUNICA, MGM NORTHFIELD PARK, MGM NATIONAL HARBOR)
Net Adjusted Property Adjusted Property
Revenues EBITDAR EBITDAR Margin
-15% +7% +768 bps
3Q 2019 3Q 2020 3Q 2019 3Q 2020
3Q 2019 3Q 2020
• Gold Strike Tunica, MGM Northfield Park, and MGM National Harbor achieved all-time record quarterly Adjusted Property EBITDARs
• MGM Springfield achieved a record third quarter Adjusted Property EBITDAR despite being open a partial quarter
• Our integrated resort regional properties, Beau Rivage and Borgata, continued to ramp in the quarter as Beau expanded its charter program
and as Borgata adapted to NJ’s COVID-19 protocols
• MGM Grand Detroit delivered solid results despite local capacity restrictions at 15%
MGM RESORTS INTERNATIONAL 11THE LAS VEGAS STRIP MARKET IS IMPROVING
LAS VEGAS STRIP PERFORMANCE
3Q 2020 vs. 2Q 2020
($ in U.S. millions)
ACTUAL HOLD ADJUSTED
Net Revenues Adjusted Property EBITDAR Net Revenues Adjusted Property EBITDAR
+$331 +$120 +$347 +$134
$15 $21
$481 ($104) $489 ($112)
$151 $142
2Q 2020 3Q 2020 2Q 2020 3Q 2020 2Q 2020 3Q 2020 2Q 2020 3Q 2020
• Solid demand on the weekends with hotel occupancy at 60%, by design, as the Company continued to maintain occupancy caps for appropriate
social distancing and quality guest experience
• The recent expansion of NV’s mass gathering limitation to 250 people opens the door to restarting meetings and live entertainment. However, we
continue to believe that meaningful recovery will require the return of large-scale conventions and entertainment as well as significant air travel
• Lack of group business and live entertainment continued to impact the marketplace. Despite success in leveraging our casino database, mid-week
occupancy remained challenged at 38% in the third quarter
MGM RESORTS INTERNATIONAL Note: Calculations may not match exactly, due to rounding
12CONVENE WITH CONFIDENCE: MEETINGS & EVENTS
Convene with Confidence is a comprehensive set of protocols designed specifically for bringing meetings and entertainment safely
back to Las Vegas. We have worked closely with health experts and local public officials to detail every aspect of an attendee
experience for these important events.
PROTOCOLS FOR MEETINGS & EVENTS
1. PLANNING
Virtual site inspections and pre-planning services available. This includes careful planning of event, meal
and break times to safely optimize guest movement throughout the meeting space.
2. MGM HEALTH PASS
MGM Resorts is bringing together cutting-edge Health Pass technology from CLEAR, innovative COVID-
19 testing with CUE Health, and expert health providers from Impact Health with the goal of creating
safer environments and ecosystems across MGM venues. This is an optional offering.
3. ARRIVAL
We always recommend advance registration but when not possible, where registration desk queuing is
needed, required scheduling and distancing will be clearly indicated.
4. CLEANING AND DISINFECTING
High touch points will be cleaned and disinfected regularly; single-use amenities will be disposed of
daily. Hand sanitizer will be available in high traffic areas.
5. PHYSICAL DISTANCING
Our facility capacities have been adjusted to meet physical distancing requirements and will evolve as
needed. Signage will be placed to remind guests of physical distancing standards, floor clings to mark
entrances and exits. Transparent barriers will be used where physical distancing is challenging.
6. DINING EXPERIENCE AND BREAK REFRESH
Varied styles of meal service will be offered. Servers and chef attendants will serve guests.
MGM RESORTS INTERNATIONAL Please refer to Supplemental section for more information 13CONVENE WITH CONFIDENCE: LIVE ENTERTAINMENT
Convene with Confidence is a comprehensive set of protocols designed specifically for bringing meetings and entertainment safely
back to Las Vegas. We have worked closely with health experts and local public officials to detail every aspect of an attendee
experience for these important events.
PROTOCOLS FOR LIVE ENTERTAINMENT
1. VENUE LAYOUT
Seating capacities have been modified to allow for appropriate physical distancing between parties. Signage and
floor clings will be placed to remind attendees of physical distancing standards.
2. CLEANING AND DISINFECTING
Regular cleaning of venues, backstage areas and restrooms before, between and after shows including high-
touch points such as door handles, railings and arm rests. MGM’s HVAC systems have been programmed to
circulate up to 100% outside fresh air and supply up to 12 air exchanges per hour.
3. PROTECTIVE EQUIPMENT
All individuals will be required to wear masks, hand sanitizer will be readily available throughout the venue and
gloves will be provided to staff when necessary.
4. ENTRY
Prior to entering our venues, all individuals must respond to health screening questions and may have their
temperatures checked. Entry will be staggered with ushers to assist with physical distancing where appropriate.
Exact protocols are subject to local regulations.
5. TICKETING
Adoption of digital tickets where available and contactless scanning of digital tickets.
6. CONCESSIONS
Mobile order and pay for food and beverage items with designated pick up locations where available.
7. EXITING
Exiting venues will be controlled by ushers who will assist with maintaining physical distancing requirements.
6. RESTROOMS
Limit number of guests permitted to enter a venue restroom to avoid overcrowding.
MGM RESORTS INTERNATIONAL 14
Please refer to Supplemental section for more informationCREATING SAFER ENVIRONMENTS & ECOSYSTEMS
WITH MGM HEALTH PASS
MGM Resorts is bringing together cutting-edge Health Pass technology from CLEAR, innovative COVID-19 testing with CUE Health, and
expert health providers from Impact Health with the goal of creating safer environments and ecosystems across MGM venues.1
Optional multi-layered health screening
with CLEAR’s health pass: a touchless MGM is deploying a rapid, portable, Additionally, MGM is working in
product that links verified identity with molecular, point-of-care COVID-19 test conjunction with Impact Health, a
COVID-19 health insights, including: with our partner CUE Health. leading provider of healthcare
• real-time health questionnaire, services for high-profile and high-
• COVID-19 test results, and Point of care device collects and tests volume events, for on-site testing
• temperature checks. samples on-site, producing accurate capabilities.
results in approximately 20 minutes.
MGM RESORTS INTERNATIONAL 1 This is an optional offering. 15ENTERTAINMENT RETURNS TO LAS VEGAS NOVEMBER 6
Fantasy @ Luxor Jabbawockeez @ MGM Grand
Carrot Top @ Luxor
Brad Garrett’s Comedy Club
The Australian Bee Gees @ Excalibur @ MGM Grand David Copperfield @ MGM Grand Thunder From Down Under @ Excalibur
MGM RESORTS INTERNATIONAL 16
Shows will be held with a maximum audience of 250 guests, physically distanced at 6 feet between parties and a minimum of 25 feet from on-stage performersMACAU UPDATE
JULY 6 JULY 15 AUGUST 26 SEPTEMBER 23 OCTOBER 1-7
Macau residents exempted Visitors crossing borders Guangdong province The rest of mainland China October Golden Week
from quarantine when between Macau and resumes issuance of resumes tourist visas to Macau. visitation down 86% year
entering Zhuhai may also Guangdong Province no tourist visas to Macau Visitors are still required to over year;
visit the nine GBA cities longer need to undergo present valid proof of a Continued gradual
the 14-day quarantine negative nucleic acid test to improvements in October
enter
• Limited market activity in 3Q 2020, resulting in market-wide GGR declining 93% year over year (though a sequential improvement
from 2Q’s 96% year over year decline).
• While logistical headwinds (visa issuance process, nucleic acid testing requirements) continue to impact visitation levels, the
market has been steadily improving, indicating a gradual recovery pace
➢ Steady increase in volumes across all segments since the second week of October
➢ Encouraged that month to date in October, MGM China has crossed property EBITDAR break-even levels
• Continue to believe in the long-term success of Macau
➢ Evidenced by continued investment in future development projects to strengthen MGM China’s position in the premium mass
segment, including the development of the MGM Cotai South Tower suites
MGM RESORTS INTERNATIONAL 17• 3Q 2020 HIGHLIGHTS
• BETMGM
TABLE OF
CONTENTS • 3Q 2020 FINANCIAL RESULTS
• SUPPLEMENTAL
18SIGNIFICANT OPPORTUNITY IN THE GROWING
U.S. MARKET
SPORTS MARKET ASSUMPTIONS
$20.3 38 States
224.3 million adults
BILLION Spend per adult ~$60
Expected market size ~$13.5 billion
BY 2025
Sports $13.5 billion
iGaming $6.8 billion
IGAMING MARKET ASSUMPTIONS
13 States
61.6 million adults
Spend per adult ~$110
BETMGM’S EXPECTED
15% - 20% MARKET SHARE
Expected market size ~$6.8 billion
MGM RESORTS INTERNATIONAL Note: Market sizes based on expected GGR in the states currently expected to have legislated for sports and/or igaming by 2025
Source: BetMGM and Morgan Stanley estimates 19POSITIONING BETMGM AS A LONG-TERM LEADER
IN U.S. SPORTS BETTING AND IGAMING
• Market access secured in 20 states1, live in 8 states with the expectation to be live in 11 states by year end 2020
• BetMGM is now a Top 3 operator2 in every market where it is live and revenues are publicly reported,
with 18% collective market share in September 20203:
➢ iGaming: #1 in the most mature and competitive iGaming market in the U.S. (NJ)4
➢ Online sports betting: Doubled market share since January 2020
➢ Retail sports betting: Significant presence with estimated leading share in MS and MI
• Increased 2020 net revenue target to $150-160 million (up from original $130+ million)
• Building an effective customer acquisition model through proven omni-channel strategy, MGM Resorts’ 34+
million M life Rewards database, and strategic relationships to drive high value customers at lower cost
1 Market access includes states where certain legislative modifications are required and states in which the Company is seeking direct licensure
In markets that BetMGM is live in markets that are publicly reported; Also based on Eilers & Krejcik Gaming estimates
MGM RESORTS INTERNATIONAL
2
3 Based on BetMGM revenues as a percentage of state reported sports betting and iGaming revenues
4 Excludes Pala; Based on Eilers & Krejcik Gaming estimates
20STRATEGIC MARKET ACCESS ENABLES DAY 1 LAUNCH
AS MORE STATES GO LIVE
To date, BetMGM has secured market access in 20 states1 and is live in eight states,
with the expectation of being live in 11 states by year end 2020
ME
WA
VT Live States Retail Sports Online Sports Online Casino Online Poker
NH MA
MT ND
OR
MN NY Oregon ✓
ID RI
WI MI
SD CT Nevada ✓ ✓
WY PA NJ
IA DE
NE OH MD Colorado On hold ✓
NV IL IN
WV VA D.C.
UT KY
Mississippi ✓
CA CO
KS MO
NC
Indiana ✓
TN
SC
OK AR Michigan ✓ End 2020 End 2020 End 2020
AZ NM
MS GA
AL
West Virginia ✓ ✓ ✓
TX LA New Jersey ✓ ✓ ✓ ✓
FL
2020 Launch Retail Sports Online Sports Online Casino Online Poker
New Mexico ✓
Live Tennessee ✓
Launching in 2020
Market Access Secured1 Pennsylvania ✓ ✓
MGM RESORTS INTERNATIONAL Market access includes states where certain legislative modifications are required and states in which the Company is seeking direct licensure
1
21BETMGM HAS INCREASED SHARE IN KEY U.S. MARKETS
TO BECOME A TOP #3 OPERATOR 1
Market Market YTD September
YTD2Q20 Share 3Q20 Share Market Share
Position1 Position1 Position1
17.9% #1 20.3% #1 #1
IGAMING
NJ Consistently the #1 brand in NJ iGaming, with
MARKET SHARE1 WV ramping
WV N/A N/A 23.8% #2 #2
NV 4.6% Unknown 1.7% Unknown Unknown Significant growth in online sports betting
despite competition
NJ 5.7% #5 9.2% #3 #3
ONLINE SPORTS
4.3% #3 12.5% #3 #3
Strong retail sports betting driven by premier
WV
MARKET SHARE1 MGM Resorts and partner destinations
IN 2.4% #4 11.0% #3 #3
CONFIDENT IN REPLICATING SUCCESS AS
CO 9.4% #3* 12.3% #3* #3*
BETMGM LAUNCHES IN ADDITIONAL STATES
NV 27.7% Unknown 14.9% Unknown Unknown
NJ 3.6% #3 17.0% #3 #3
RETAIL SPORTS
1
MARKET SHARE MS 19.3% #1/#2** 35.2% #1/#2** #1/#2**
MI 80.2% #1 47.7% #1 #1
1 In markets that BetMGM is live and are publicly reported
MGM RESORTS INTERNATIONAL Note: Market share is estimated based on BetMGM revenues as a percentage of state reported sports betting and iGaming revenues
22
* Based on Eilers & Krejcik Gaming estimates. Market does not report by operator
** Based on BetMGM assumptionsDRIVING MOMENTUM IN ONLINE SPORTS BETTING
BetMGM has nearly doubled its online sports betting market share1 since January 2020
8.7%
8.5% 8.5%
5.6%
4.5%
Jan-20 Jun-20 Jul-20 Aug-20 Sep-20
BetMGM Online Sports Betting Market Share
MGM RESORTS INTERNATIONAL 1 In markets that BetMGM is live and are publicly reported; Estimated based on BetMGM revenues as a percentage of state reported sports betting revenues
23DRIVING HIGHER VALUE CUSTOMERS THROUGH AN
UNMATCHED OMNI-CHANNEL STRATEGY
4
1
GUEST CHECKOUT &
RETURN TO HOME GUEST BOOKING
• MLIFE INTEGRATED WITH BETMGM APP
• STATE-SPECIFIC PROMO OFFERS FOR
STATE
BETMGM SIGN-UP WITH HOME STATE • MGM RESORTS AND ALL PROPERTY
• RETURN VISIT RETENTION WEBSITE INCLUSIONS
COMMUNICATIONS • DIRECT MARKETING POD INCLUSIONS
3 2
GUEST GUEST ARRIVAL TO
ON-PROPERTY MGM RESORTS
• PROPERTY SIGNAGE
EXPERIENCE PROPERTY
• IN-VENUE ACTIVATION (SPORTSBOOKS)
• BRAND AMBASSADORS PROMOTING
BETMGM SIGN-UPS
• VIP HOST INTERACTIONS
• MARQUEE SCREEN EXPOSURE
• SPORTSBAR VENUE COLLATERAL • PRE-ARRIVAL EMAIL
• IN-ROOM TV COMMERCIAL
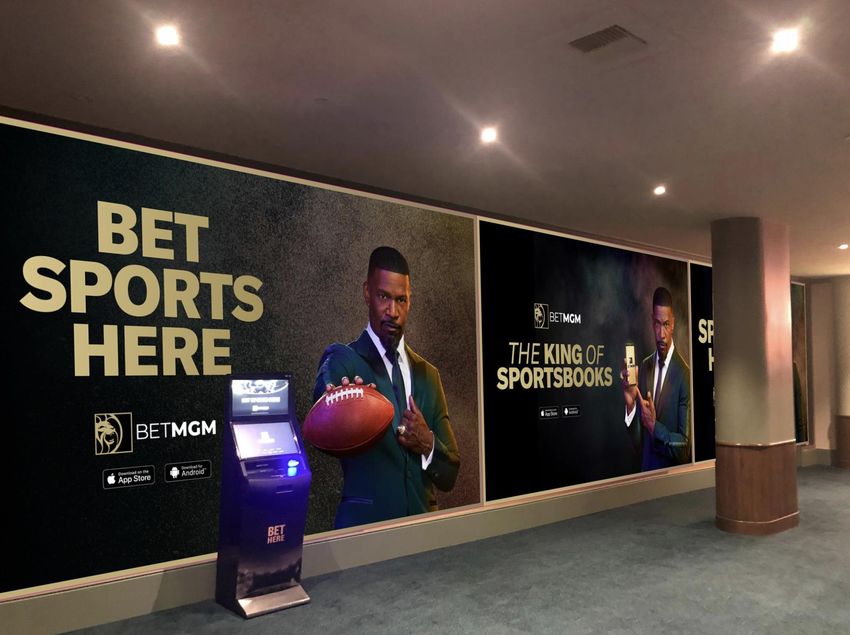
MGM RESORTS INTERNATIONAL • WI-FI POD INCLUSION 24ON-PROPERTY BRANDING & ACTIVATIONS MGM RESORTS INTERNATIONAL 25
BETMGM BRANDING AT LUXOR

 MGM RESORTS INTERNATIONAL   26
NEW YAHOO! FEATURES RELEASED MID-OCTOBER

                                                         DIRECT ACCESS TO BETMGM               ENHANCED FEATURES
                                                   Streamlined registration and onboarding   Player prop odds added
                                                  experience between the Yahoo Sports app1    to Yahoo Fantasy app2

         YAHOO SPORTS

        ~50 million
 MONTHLY AVERAGE USERS IN U.S.

         YAHOO FANTASY

        >15 billion
MINUTES OF USER TIME EVERY YEAR

                             1   Available in states where BetMGM is live except NV
MGM RESORTS INTERNATIONAL    2   Available in states where permitted by regulators                                    27
KEY PILLARS POSITION BETMGM FOR SUCCESS
BetMGM’s four key strategic pillars position it to become an industry leader with an efficient financial model
KEY STRATEGIC PILLARS RECENT SUCCESSES
• Prime MGM Resorts assets in key states • Access to 20 markets secured
• Additional access secured via other partners • Operational in 8 markets
MARKET ACCESS • Proprietary platform enables entering markets through B2C • Expect to be operational in 11 by year end 2020
and B2B partnerships • Ongoing access discussions in further states
• Proprietary retail and online platform, including advanced
• Significantly customized for the U.S. market
trading, marketing, CRM and BI tools
TECHNOLOGY & • Flexibility to respond to different conditions
• Leading gaming product - proprietary content in gaming
supporting NJ performance
PRODUCT • Available at lower costs vs. competitors given that GVC owns
• Single app launch
complete technology stack
• BetMGM brand in all active states
BRANDS & • Continue strengthening BetMGM’s position as a sports brand
MARKETING • PartyPoker re-launched as national U.S. poker brand
• Integration of M life Rewards status and tier credit earning
capabilities (Phase 1)
PLAYER • Integration with Yahoo Sports!
• Key strategic relationships in place
ACQUISITION • Omni-channel campaigns launched to drive customer
acquisition at a lower cost
MGM RESORTS INTERNATIONAL 28• 3Q 2020 HIGHLIGHTS
• BETMGM
TABLE OF
CONTENTS • 3Q 2020 FINANCIAL RESULTS
• SUPPLEMENTAL
29FINANCIAL CONSIDERATIONS
• Health and Safety / Benefits
➢ Health and Safety – Domestic Operating Expenses
– 3Q 2020: $20 million1
– 4Q 2020: Expect to incur ~$20 million1, primarily related to labor, PPE, and other supplies
➢ Benefits
– 3Q 2020: The Company provided benefits to its furloughed employees through September 30, 2020 and negotiated union benefit
contributions which resulted in ~$29 million in expenses, primarily in Las Vegas (also referenced on Slide 9)
– 4Q 2020: Expect to incur $6-7 million, primarily in Las Vegas
• Corporate Expense & Stock Based Compensation
➢ Corporate Expense (Excluding Stock Based Compensation)
– 3Q 2020: 43% year-over-year decrease to $55 million, reflecting the Company’s ongoing cost-savings efforts, properties continuing to
ramp, and lower than expected certain global development and IT costs
– 4Q 2020: Expect sequential increase vs. 3Q 2020, as properties continue to ramp and also due to the timing of certain global development
and technology costs
➢ Stock Based Compensation
– 3Q 2020: $21 million due to the timing of annual grants occurring in August (vs. typically in October) as well as the accelerated recognition
of expense across a minimum of 6 months due to MGM Resorts’ new retirement policy
– 4Q 2020: Expect sequential increase vs. 3Q 2020, due to timing of grants and retirement eligibility
• BetMGM – Full Year 2020 Expectations
➢ Net revenues: $150-160 million (recently increased from ~$130 million)
➢ Ongoing losses reflect the start-up nature of the business and heightened marketing costs
MGM RESORTS INTERNATIONAL 1 Includes approximately $1 million at CityCenter, reflecting MGM Resorts’ 50% share
30TRIPLE NET OPERATING AND GROUND LEASES
• The Company has rental obligations to the following entities: MGM Growth Properties, the Bellagio BREIT venture and the MGP BREIT
venture (Mandalay Bay and MGM Grand Las Vegas)
• Given the Company’s 57% economic ownership in MGP, MGP is consolidated within the Company’s financial statements. However, the BREIT
ventures are not consolidated
• Thus, MGM Resorts’ rent expense associated with the BREIT ventures and other ground leases are expensed within the Company’s
consolidated income statement as part of “General and administrative” expenses
➢ Recognized on a straight-line basis ($189.6 million in 3Q 2020)
• Additionally, the Company’s income is recognized via the equity method under “Income (loss) from unconsolidated affiliates” ($41.7 million in
3Q 2020) and “Non-operating items from unconsolidated affiliates”(-$15.2 million in 3Q 2020)
➢ 5% ownership of Bellagio BREIT venture
➢ 50.1% ownership of MGP BREIT venture through the consolidation of MGP within MGM Resorts financial statements
• Consolidated net income is adjusted to exclude the impact of these items in our Adjusted EBITDAR calculation1
• 3Q 2020 triple net operating lease rent expense on a cash basis:
➢ MGP: $206.9 million (partially offset by $83.9 million in distributions received from MGP)
➢ BREIT ventures: $134.3 million
• Our ground lease expenses aggregate to approximately $8 million of rent expense per quarter (~$32 million per year)
MGM RESORTS INTERNATIONAL 1 Refer to “Reconciliation of Net Income (Loss) Attributable to MGM Resorts International to Adjusted EBITDAR” table within the Company’s 3Q 2020 earnings release
313Q 2020 – LAS VEGAS STRIP
Net Revenues Adjusted Property EBITDAR
($ in U.S. millions) ($ in U.S. millions)
Actual Hold Adjusted Actual Hold Adjusted
$1,507 $1,504
$441 $438
$481 $489
$15 $21
3Q19 3Q20 3Q19 3Q20 3Q19 3Q20 3Q19 3Q20
• Casino revenue decreased 44% compared to the prior year quarter • Rooms revenue decreased 71% compared to the prior year quarter
➢ Table games drop of $498 million compared to $842 million in 3Q 2019 ➢ Occupancy of 44% compared to 92.5% in 3Q 2019
➢ Table games win % of 21.6% compared to 24.2% in 3Q 2019 ➢ ADR declined 15% to $139 compared to $164 in 3Q 2019
➢ Slot handle $1.9 billion compared to $3.3 billion in 3Q 2019 ➢ RevPAR1 decreased 60% to $61 compared to $152 in 3Q 2019
➢ Slot hold % of 9.4% compared to 9.4% in 3Q 2019
MGM RESORTS INTERNATIONAL Note: Excludes CityCenter
1 RevPAR is hotel revenue per available room. Rooms that were out of service during the three months ended September 30, 2020 as a result of property closures due to the COVID-19 32
pandemic were excluded from the available room count when calculating hotel occupancy and REVPAR.3Q 2020 – REGIONAL
($ in U.S. millions)
Net Revenue Adjusted Property EBITDAR
$935
$557
$269
$146
3Q19 3Q20 3Q19 3Q20
• Casino revenue decreased 30% compared to the prior year quarter
➢ Table games drop of $739 million compared to $1.1 billion in 3Q 2019
➢ Table games win % of 21.0% compared to 19.6% in 3Q 2019
➢ Slot handle $4.4 billion compared to $6.7 billion in 3Q 2019
➢ Slot hold % of 9.8% compared to 9.4% in 3Q 2019
MGM RESORTS INTERNATIONAL 333Q 2020 – CITYCENTER
($ in U.S. millions)
1 . S T R U C T U R E T O D A Y ( 7 3 % O WN E RNet
S H IRevenue
P OF OP) 3. M
Adjusted GM RESORTS LONG-TERM STRATEGY
EBITDA
$320
$127
$109
$25
3Q19 3Q20 3Q19 3Q20
• CityCenter reopened in July 2020 • Key Balance Sheet Items (as of 9/30/20)
➢ Occupancy of 36.9% compared to 91.0% in 3Q 2019 ➢ Cash and cash equivalents: $106 million
➢ ADR declined 14% to $213 compared to $248 in 3Q 2019
➢ Availability under revolver: $117 million
➢ RevPAR1 decreased 65% to $79 compared to $225in 3Q 2019
➢ Total debt: $1.74 billion
MGM RESORTS INTERNATIONAL 1RevPAR is hotel revenue per available room. Rooms that were out of service during the three months ended September 30, 2020 as a result of property closures due to the COVID-19
34
pandemic were excluded from the available room count when calculating hotel occupancy and REVPAR.3Q 2020 – MGM CHINA
Net Revenues Adjusted Property EBITDAR
($ in U.S. millions) ($ in U.S. millions)
1 . S T R U C T UActual Hold Adjusted
R E T O D A Y ( 7 3 % O WN ERSHIP OF OP) 3. MGM RESORTS LONG-TERM STRATEGY
Actual Hold Adjusted
$738
$699 $184
$170
3Q20 3Q20
3Q19 3Q19
$47 $54
($96) ($93)
3Q19 3Q20 3Q19 3Q20
• VIP table games: 89% decrease in turnover year-over-year; hold percentage of 1.9%
• Mass table games: 93% decrease in volume year-over-year; hold percentage of 17.3%
• See Supplemental section MGM China reported property-level details
MGM RESORTS INTERNATIONAL 35• MGM CHINA PROPERTY DATA
SUPPLEMENTAL
• CONVENE WITH CONFIDENCE
36MGM CHINA PROPERTY DATA
MGM RESORTS INTERNATIONAL 37MGM CHINA FINANCIAL INFORMATION UNDER IFRS
Due to the time differences between Macau and the United States, this supplemental information is being provided on behalf
of MGM China for the benefit of MGM China investors
Three Months Ended Nine Months Ended
September 30 September 30
2020 2019 2020 2019
HK$'000 HK$'000 HK$'000 HK$'000
(unaudited) (unaudited) (unaudited) (unaudited)
Revenue
MGM Macau $263,882 $2,928,872 $1,532,497 $9,388,221
MGM Cotai $99,357 $2,847,742 $1,201,136 $7,685,027
Total Revenue $363,239 $5,776,614 $2,733,633 $17,073,248
Adjusted EBITDA1
MGM Macau ($274,240) $855,586 ($631,145) $2,901,181
MGM Cotai ($456,326) $692,922 ($1,107,807) $1,724,130
Total Adjusted EBITDA ($730,566) $1,548,508 ($1,738,952) $4,625,311
1
Adjusted EBITDA is profit/loss before finance costs, income tax expense/benefit, depreciation and amortization, gain/loss on disposal/write-off of property and equipment, construction in
progress and other assets, interest income, net foreign currency difference, share-based payments, pre-opening costs and corporate expenses which mainly include administrative expenses
of the corporate office and license fee paid to a related company. Adjusted EBITDA is used by management as the primary measure of the Group’s operating performance and to compare
our operating performance with that of our competitors. Adjusted EBITDA should not be considered in isolation, construed as an alternative to profit or operating profit as reported under IFRS
MGM RESORTS INTERNATIONAL or other combined operations or cash flow data, or interpreted as an alternative to cash flow as a measure of liquidity. Adjusted EBITDA presented in this announcement may not be
38
comparable to other similarly titled measures of other companies operating in the gaming or other business sectors.MGM CHINA FINANCIAL INFORMATION UNDER IFRS
Due to the time differences between Macau and the United States, this supplemental information is being provided on behalf
of MGM China for the benefit of MGM China investors
Three Months Ended Nine Months Ended
September 30 September 30
2020 2019 2020 2019
HK$'000 HK$'000 HK$'000 HK$'000
MGM MACAU (unaudited) (unaudited) (unaudited) (unaudited)
(in thousands, except for percentages and revenue per available room (“RevPAR”))
VIP Table Games Turnover 4,949,128 39,327,793 22,494,616 144,214,901
VIP Gross Table Games Win1 106,704 1,299,582 656,744 4,396,222
VIP Table Games Win Percentage 2.16% 3.30% 2.92% 3.05%
Average Daily Gross Win Per VIP Gaming Table 17.0 181.0 38.9 201.8
Main Floor Table Games Drop 690,385 9,204,392 4,483,888 28,029,967
Main Floor Gross Table Games Win1 118,750 1,976,577 923,604 5,982,457
Main Floor Table Games Win Percentage 17.2% 21.5% 20.6% 21.3%
Average Daily Gross Win Per Main Floor Gaming Table 6.5 103.5 18.7 104.7
Slot Machine Handle 1,174,460 7,883,265 5,556,499 23,760,588
Slot Machine Gross Win1 45,907 296,793 193,667 900,670
Slot Hold Percentage 3.9% 3.8% 3.5% 3.8%
Average Daily Win Per Slot 0.8 3.1 1.2 3.2
Commissions, complimentaries and other incentives1 (53,820) (887,416) (422,373) (2,612,905)
Room Occupancy Rate 12.3% 96.9% 20.5% 96.8%
RevPAR 193 1,954 385 1,951
As of September 30
Gaming Units: 2020 2019
Tables2 285 290
Slot Machines 640 1,083
1
The total of “VIP gross table games win”, “main floor gross table games win” and “slot machine gross win” is different to the casino revenue because casino revenue is reported net of
MGM RESORTS INTERNATIONAL commissions and certain sales incentives including the allocation of casino revenue to hotel rooms, food and beverage and other revenue for services provided to casino customers on a 39
complimentary basis.
2
Permanent table count as of September 30, 2020 and 2019MGM CHINA FINANCIAL INFORMATION UNDER IFRS
Due to the time differences between Macau and the United States, this supplemental information is being provided on behalf
of MGM China for the benefit of MGM China investors
Three Months Ended Nine Months Ended
September 30 September 30
2020 2019 2020 2019
HK$'000 HK$'000 HK$'000 HK$'000
MGM COTAI (unaudited) (unaudited) (unaudited) (unaudited)
(in thousands, except for percentages and revenue per available room (“RevPAR”))
VIP Table Games Turnover 2,239,225 28,350,048 14,767,878 87,955,761
VIP Gross Table Games Win1 27,721 1,188,829 411,374 3,030,147
VIP Table Games Win Percentage 1.24% 4.19% 2.79% 3.45%
Average Daily Gross Win Per VIP Gaming Table 5.6 233.0 30.3 201.6
Main Floor Table Games Drop 416,098 7,369,655 3,165,136 20,155,343
Main Floor Gross Table Games Win1 73,184 1,941,806 813,716 5,011,724
Main Floor Table Games Win Percentage 17.6% 26.3% 25.7% 24.9%
Average Daily Gross Win Per Main Floor Gaming Table 3.8 103.3 16.1 90.3
Slot Machine Handle 573,515 8,472,100 4,541,868 28,231,400
Slot Machine Gross Win1 13,325 275,586 137,778 768,823
Slot Hold Percentage 2.3% 3.3% 3.0% 2.7%
Average Daily Win Per Slot 0.2 2.6 0.8 2.4
Commissions, complimentaries and other incentives1 (58,941) (908,716) (396,275) (2,135,177)
Room Occupancy Rate 7.4% 92.4% 14.5% 92.0%
RevPAR 96 1,449 242 1,409
As of September 30
Gaming Units: 2020 2019
Tables2 267 262
Slot Machines 666 1,186
1
The total of “VIP gross table games win”, “main floor gross table games win” and “slot machine gross win” is different to the casino revenue because casino revenue is reported net of
MGM RESORTS INTERNATIONAL commissions and certain sales incentives including the allocation of casino revenue to hotel rooms, food and beverage and other revenue for services provided to casino customers on a 40
complimentary basis.
2
Permanent table count as of September 30, 2020 and 2019CONVENE WITH CONFIDENCE
MGM RESORTS INTERNATIONAL 41CONVENE WITH CONFIDENCE: MEETINGS MGM RESORTS INTERNATIONAL 42
CONVENE WITH CONFIDENCE: ENTERTAINMENT

MGM RESORTS INTERNATIONAL                     43
PROTECTED EXPERIENCES WITH MGM HEALTH PASS
                                     Optional Multi-Layered Health Screening Capabilities

GUEST JOURNEY
                                 HEALTH                                                                  PROTECTED

                                                                                       FAIL
                                 SCREEN                                                                 EXPERIENCES

     ENROLL        SECURITY/                   HEALTH PASS       HEALTH PASS                  PASS
                                RAPID TEST
   HEALTH PASS   TICKET CHECK                   CREATION           CHECK

                                                                                                     HOTEL        F&B

PARTNERS

                                                                                                        CONVENTIONS

                                                                                                     SPORTS   CONCERTS

MGM RESORTS INTERNATIONAL                                                                                                44
PILOT PROGRAM AT MGM GRAND DETROIT
PHOTO
HERE
NAME HERE
MGM RESORTS INTERNATIONAL 45You can also read