Building a Solid Foundation for a Cleaner Energy Future - CORPORATE PRESENTATION - AUGUST 2019 - Bellatrix Exploration Ltd.
←
→
Page content transcription
If your browser does not render page correctly, please read the page content below
Building a Solid Foundation for a
Cleaner Energy Future
CORPORATE PRESENTATION - AUGUST 2019

                                       1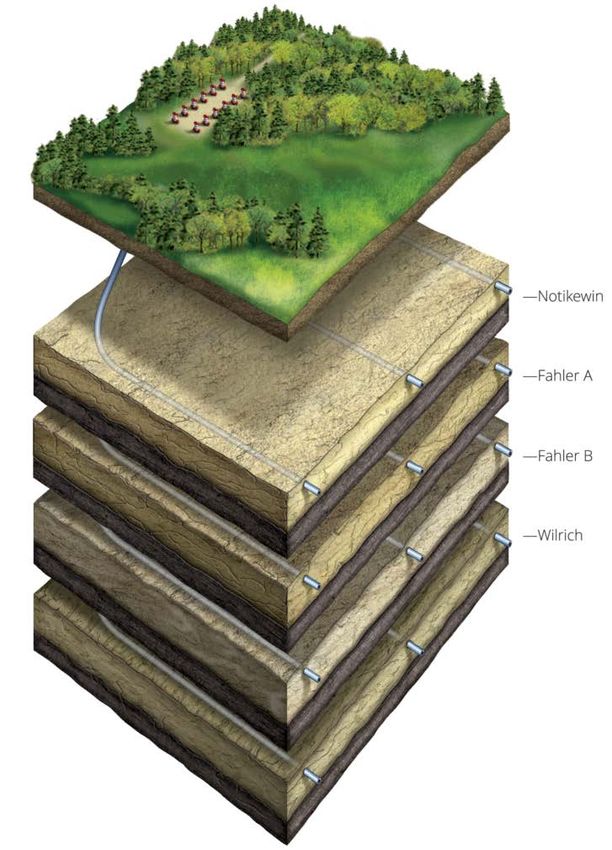
Advisories
FORWARD LOOKING STATEMENTS: In the interest of providing Bellatrix’s shareholders and potential investors with information regarding Bellatrix, including management’s assessment of Bellatrix’s future plans and operations, certain statements contained in these presentation materials (collectively, this
“presentation”) are forward looking statements or information within the meaning of applicable securities legislation, collectively referred to herein as “forward looking statements”. The forward looking statements contained in this presentation speak only as of the date of this presentation and are expressly
qualified by this cautionary statement. Forward looking statements in this presentation include, but are not limited to: statements regarding the quality of the Company’s assets, acreage, well results, and capital efficiencies, the Company’s infrastructure and firm transportation capacity, the expected
performance of the Alder Flats Gas Plant following completion of Phase 2, expected corporate natural gas liquids yields, the Company’s development plans and forecasted investment returns, the Company’s balance sheet and available liquidity, any refinancing of long term debt and the cost of any such
refinancing, future production estimates, future drilling locations, 2019 guidance relating to production, production mix, and total net capital expenditures, the Company’s acreage position, the nature and profitability of the Company’s Spirit River acreage, well results, forecasted well performance, the
sustainability of cost reductions, drilling times and capital efficiencies, development metrics, future drilling inventory, the Company’s land position, and the sufficiency and performance of the Company’s infrastructure. To the extent that any forward-looking information contained herein constitute a financial
outlook, they were approved by management on August 7, 2019 and are included herein to provide readers with an understanding of the anticipated funds available to Bellatrix to fund its operations and readers are cautioned that the information may not be appropriate for other purposes. Forward looking
statements necessarily involve risks, including, without limitation, risks associated with oil and gas exploration, development, exploitation, production, marketing and transportation, loss of markets, volatility of commodity prices, currency fluctuations, imprecision of reserve estimates, environmental risks,
competition from other producers, inability to retain drilling rigs and other services, incorrect assessment of the value of acquisitions, failure to realize the anticipated benefits of acquisitions, delays resulting from or inability to obtain required regulatory approvals, actions taken by the Company's lenders that
reduce the Company's available credit and ability to access sufficient capital from internal and external sources. Events or circumstances may cause actual results to differ materially from those predicted, as a result of the risk factors set out and other known and unknown risks, uncertainties, and other factors,
many of which are beyond the control of Bellatrix. In addition, forward looking statements or information are based on a number of factors and assumptions which have been used to develop such statements and information but which may prove to be incorrect and which have been used to develop such
statements and information in order to provide shareholders with a more complete perspective on Bellatrix’s future operations. Such information may prove to be incorrect and readers are cautioned that the information may not be appropriate for other purposes. Although the Company believes that the
expectations reflected in such forward looking statements or information are reasonable, undue reliance should not be placed on forward looking statements because the Company can give no assurance that such expectations will prove to be correct. In addition to other factors and assumptions which may be
identified herein, assumptions have been made regarding, among other things: the impact of increasing competition; the general stability of the economic and political environment in which the Company operates; the timely receipt of any required regulatory approvals; the ability of the Company to obtain
qualified staff, equipment and services in a timely and cost efficient manner; drilling results; the ability of the operator of the projects which the Company has an interest in to operate the field in a safe, efficient and effective manner; the ability of the Company to obtain financing on acceptable terms; field
production rates and decline rates; the ability to replace and expand oil and natural gas reserves through acquisition, development of exploration; the timing and costs of pipeline, storage and facility construction and expansion and the ability of the Company to secure adequate product transportation; future
commodity prices; currency, exchange and interest rates; the regulatory framework regarding royalties, taxes and environmental matters in the jurisdictions in which the Company operates; and the ability of the Company to successfully market its oil and natural gas products. Readers are cautioned that the
foregoing list is not exhaustive of all factors and assumptions which have been used. As a consequence, actual results may differ materially from those anticipated in the forward-looking statements. Additional information on these and other factors that could affect Bellatrix’s operations and financial results are
included in reports on file with Canadian and United States securities regulatory authorities and may be accessed through the SEDAR website (www.sedar.com), through the SEC website (www.sec.gov), and at Bellatrix’s website (www.bxe.com). Furthermore, the forward looking statements contained herein are
made as at the date hereof and Bellatrix does not undertake any obligation to update publicly or to revise any of the included forward looking statements, whether as a result of new information, future events or otherwise, except as may be required by applicable securities laws.

NON-GAAP MEASURES
Throughout this presentation, the Company uses terms that are commonly used in the oil and natural gas industry, but do not have a standardized meaning presented by International Financial Reporting Standards (“IFRS”) and therefore may not be comparable to the calculations of similar measures for other
entities. Management believes that the presentation of these non-GAAP measures provide useful information to investors and shareholders as the measures provide increased transparency and the ability to better analyze performance against prior periods on a comparable basis.

CAPITAL PERFORMANCE MEASURES
In addition to the non-GAAP measures described above, there are also terms that have been reconciled in the Company’s financial statements to the most comparable IFRS measures. These terms do not have any standardized meaning prescribed by IFRS and therefore may not be comparable with the
calculations of similar measures for other entities. These terms are used by management to analyze operating performance on a comparable basis with prior periods and to analyze the liquidity of the Company.
This presentation contains the term “total net debt” which is not a recognized measure under GAAP. Therefore reference to total net debt may not be comparable with the calculation of a similar measure for other entities. The Company’s calculation of total net debt excludes other deferred liabilities, deferred
capital obligations, long-term risk management contract liabilities, decommissioning liabilities, and deferred tax liabilities. Total net debt includes the working capital deficiency, long term loans receivable, convertible debentures (liability component), current bank debt and long term bank debt.
FD&A costs are used as a measure of capital efficiency. FD&A presented above has been calculated based on exploration and development capital and/or acquisition capital spent in the applicable period (both including and excluding changes in future development capital for that period) divided by the change in
reserves for that period including revisions for that same period. The aggregate of the exploration and development costs incurred in the most recent financial year and the change during the year in estimated future development costs generally will not reflect total finding and development costs related to
reserve additions for the year.
Recycle ratio calculates operating netback divided by FD&A costs. Operating netback is calculated by deducting transportation, royalties and operating costs from revenue and includes the impact of commodity price risk management contracts.

DRILLING LOCATIONS
In this presentation, the Company has disclosed certain drilling locations associated with Bellatrix's interest in the Spirit River and Cardium plays. Of the 382 net Spirit River drilling locations identified herein, 105 are proved locations, 27 are probable locations and 250 are unbooked locations. Of the 251 net
Cardium drilling locations identified herein, 105 are proved locations, 22 are probable locations, and 124 are unbooked locations. Proved locations and probable locations are derived from Bellatrix’s independent reserve report prepared by InSite Petroleum Consultants Ltd. as at December 31, 2018 and account
for drilling locations that have associated proved and/or probable reserves, as applicable. Unbooked locations are internal estimates based on the Company’s prospective acreage and an assumption as to the number of wells that can be drilled per section based on industry practice and internal review.
Unbooked locations do not have attributed reserves or resources. Unbooked locations as disclosed herein have been identified by management as an estimation of the Company's multi-year drilling activities using information including applicable geologic, seismic, engineering, production, pricing assumptions
and reserves information. There is no certainty that Bellatrix will drill all unbooked drilling locations and if drilled there is no certainty that such locations will result in additional oil and gas reserves, resources or production. The drilling locations on which Bellatrix actually drill wells will ultimately depend upon the
availability of capital, regulatory approvals, seasonal restrictions, oil and natural gas prices, costs, actual drilling results, additional reservoir information that is obtained and other factors. While the majority of Bellatrix's unbooked locations are extensions or infills of the drilling patterns already recognized by the
Company's independent qualified reserves evaluator, other unbooked drilling locations are farther away from existing wells where management may have less information about the characteristics of the reservoir and therefore there may be more uncertainty whether wells will be drilled in such locations and if
drilled there may be more uncertainty that such wells will result in additional oil and gas reserves, resources or production.

INITIAL RATES OF PRODUCTION
References in this presentation to initial production rates associated with certain wells are useful in confirming the presence of hydrocarbons, however such rates are not determinative of the rates at which such wells will commence production and decline thereafter and are not indicative of long term
performance or of ultimate recovery. While encouraging, readers are cautioned not to place reliance on such rates in calculating the aggregate production for the Company. The Company cautions that such production rates should be considered to be preliminary.

BOE PRESENTATION: The term barrels of oil equivalent (“boe”) may be misleading, particularly if used in isolation. A boe conversion ratio of six thousand cubic feet of natural gas to one barrel of oil equivalent (6 mcf/ 1 bbl) is based on an energy equivalency conversion method primarily applicable at the burner
tip and does not represent a value equivalency at the wellhead. Given that the value ratio based on the current price of crude oil as compared to natural gas is significantly different from the energy equivalency of 6:1, utilizing a conversion on a 6:1 basis may be misleading as an indication of value. All boe
conversions in this presentation are derived from converting gas to oil in the ratio of six thousand cubic feet of gas to one barrel of oil.

ESTIMATED ULTIMATE RECOVERY (EUR): In this presentation, estimated ultimate recovery represents the estimated ultimate recovery associated with the type curves presented which are based on the assumptions used by InSite Petroleum Consultants Ltd. to estimate Bellatrix's proved plus probable reserves
per well as evaluated effective December 31, 2018 based on forecast prices and costs. There is no certainty that Bellatrix will ultimately recover such volumes from the wells it drills.

CURRENCY: All dollar amounts in this presentation are Canadian dollars unless otherwise identified.

RESERVES INFORMATION: Unless indicated otherwise, reserve estimates and related future net revenue and other reserves information is derived from Bellatrix’s independent reserve report prepared by InSite Petroleum Consultants Ltd. as at December 31, 2018 using forecast prices and costs. Land acreage
information is as available at December 31, 2018, unless otherwise noted.
Bellatrix reserves information includes the impact of IFRS 16, which changes the accounting treatment of certain operating leases so that the future lease payments associated with such leases are recognized as a financial liability on the Company’s balance sheet. As a result, for the purposes of preparing the
reserves data presented herein, the lease payments associated with such leases are recognized as financing costs rather than as operating costs and have not been deducted in calculating the value of the Company's reserves. If such lease payments were recognized as operating costs in calculating the value of
the Company's reserves, it would result in a reduction to the Company’s 2P NPV10 future net revenue by $88 million from approximately $1.5 billion to $1.412 billion.

TYPE CURVE AND CAPITAL EFFICIENCY: In this presentation information relating to the type curve, half cycle economics and capital efficiency for Bellatrix's Spirit River wells have been presented. The 5.2 Bcf type curve set forth herein is based on all Bellatrix operated, Notikewin and Falher B wells drilled between
2013 and 2017, and represents the mean (P50) performance curve. The 6.0 Bcf type curve set forth herein is based on all Bellatrix operated, Notikewin and Falher wells drilled in 2017 and represents the mean (P50) performance curve. Half cycle economics are based on Bellatrix's current expectations of drill,
complete, equip and tie-in costs per well (and excluding land, seismic and related costs). Capital efficiency is a measure of expected capital expenditures per well based on half cycle economics divided by average first year production results (IP365) based on the type curve presented. F&D costs are used as a
measure of capital efficiency. F&D presented above has been calculated based on exploration and development capital divided by the expected ultimate recovery (EUR). The type curve and capital efficiency numbers have been presented to provide readers with information on the assumptions used for
management's budgeting process and future planning. The half cycle economics and capital efficiencies may not be achieved on future wells as a result of a number of factors including the risks identified above under "Forward Looking Statements" and as such are not reliable indicators of future performance. In
addition, there is no certainty that future wells will generate results to match historic type curves presented herein. Half cycle economics and capital efficiencies are not terms that have standardized meanings and therefore such calculations may not be comparable with the calculation of similar measures for
other entities.

FINANCIAL INFORMATION: Unless otherwise stated, financial information is based upon Bellatrix’s audited consolidated financial statements for the years ended December 31, 2018 and 2017.

                                                                                                                                                                                                                                                                                                                                             2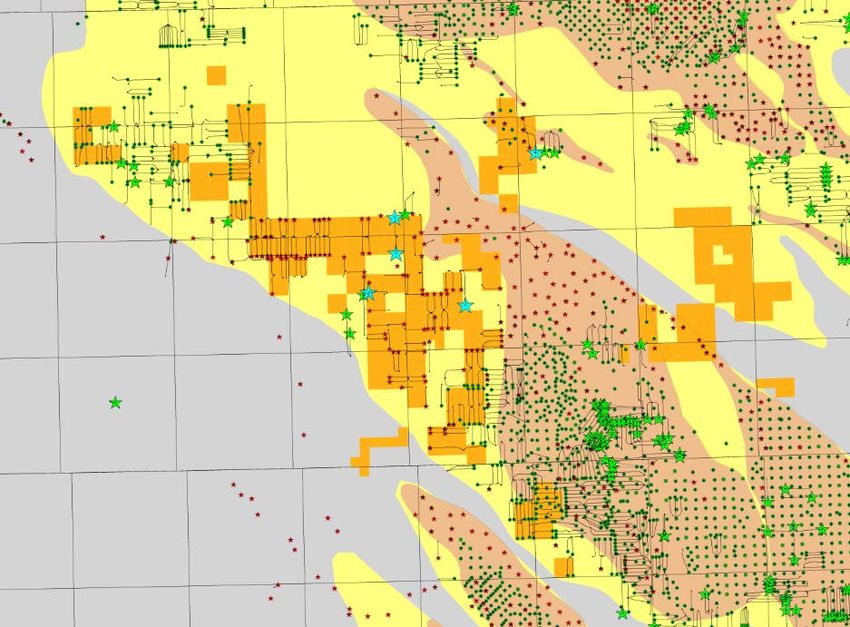
Natural Gas Represents the Bridge Fuel
 for the Future
      MATERIAL NATURAL GAS DEMAND GROWTH EXPECTED THROUGH 2040 (1.7% COMPOUNDED)
                                OVERTAKES COAL AS 2ND LARGEST GLOBAL ENERGY SOURCE BY 2040

Source: BP Energy Outlook, 2019 edition
                                                                                             3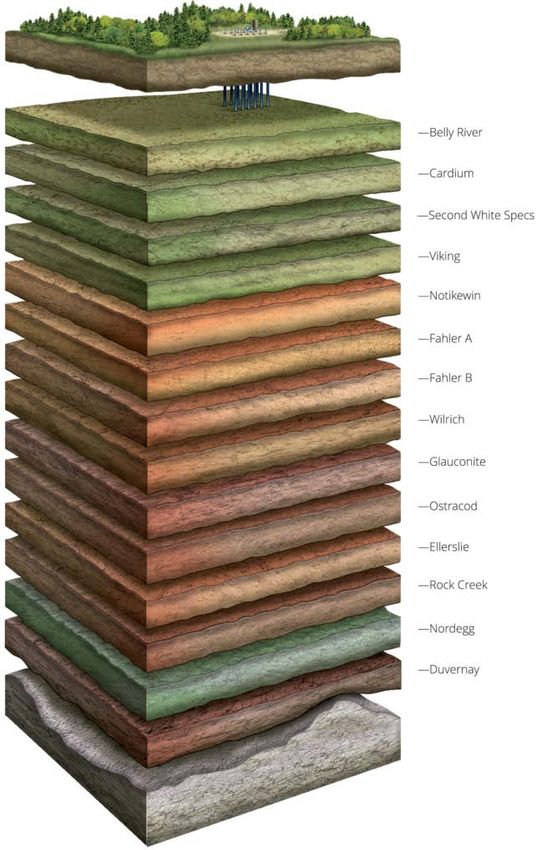
Canada is a Leader in Lower Emissions &
 Environmental Stewardship
                Global CO2 Emissions (2018)                                                         Canadian Natural Gas GHG Emissions & Production

                                                                                                                                                    58                                                                  16,000

                                                                                                                                                                                                                                   Canadian Natural Gas Production (MMcf/d)
                                                                                                    Natural Gas Extraction GHG Emissions (mtCO2e)
                                US
                                                India           Russian
                                                               Federation                                                                           56                                                                  15,500

                                                                   Japan
                                                                                                                                                    54                                                                  15,000
                                                                    Germany
            China                                                   South Korea
                                                                     Iran                                                                           52                                                                  14,500
                                                                    Saudi Arabia
                                                                      Canada (1.6%)
                                                                                                                                                    50                                                                  14,000

                               Rest of World
                                                                                                                                                    48                                                                  13,500

           China                     US                       India                                                                                 46                                                                  13,000
           Russian Federation        Japan                    Germany                                                                                      2013        2014          2015        2016        2017
           South Korea               Iran                     Saudi Arabia
           Canada (1.6%)             Rest of World                                                                                                       GHG Emissions (Left Axis)          Canadian Gas Production (Right Axis)

      Over the five year timeframe (2013 – 2017), Canadian natural gas extraction GHG emissions have been reduced by 11%, despite
      an increase in Canadian marketable natural gas production of 10%
      This equates to a 20% improvement in GHG intensity per unit of natural gas produced by the Canadian industry

Source: Government of Canada, National Energy Board, BP Statistical Review of World Energy (2019)
                                                                                                                                                                                                                                                                              4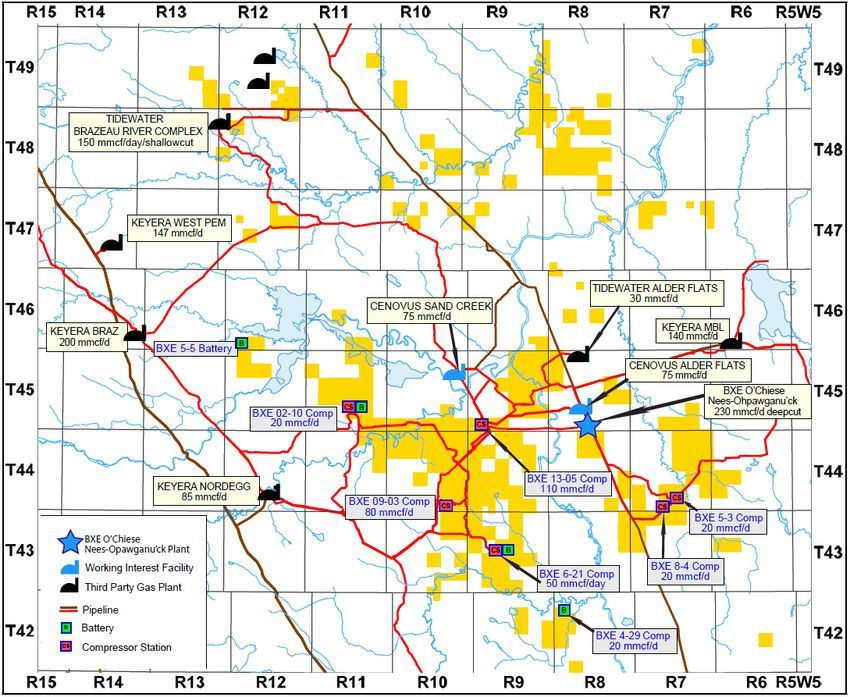
Bellatrix Environmental Metrics
                                DIRECT GHG EMISSIONS                                   FLARED & VENTED GAS
                         0.55                                                8,000

                                                               e3m3/year
                                                                             6,000

                         0.50                                                4,000
Tonnes CO2e (millions)

                                                                             2,000

                                                                                   0
                         0.45                                                            2015         2016        2017         2018
                                                                                         Flared Gas               Vented Gas

                         0.40                                                          REPORTABLE RELEASES
                                                                            100                                                  35
                                                                                                                                 30
                                                                             80

                                                                                                                                      Number of Releases
                                                                                                                                 25
                         0.35                                                60                                                  20
                                                              Volume (m3)

                                                                             40                                                  15
                                                                                                                                 10
                                                                             20
                         0.30                                                                                                    5
                                2015   2016   2017     2018                   0                                                  0
                                                                                       2015     2016         2017     2018
                                                                                  Total Volume (m3)          Reportable Releases (#)
                                                                                                                                                           5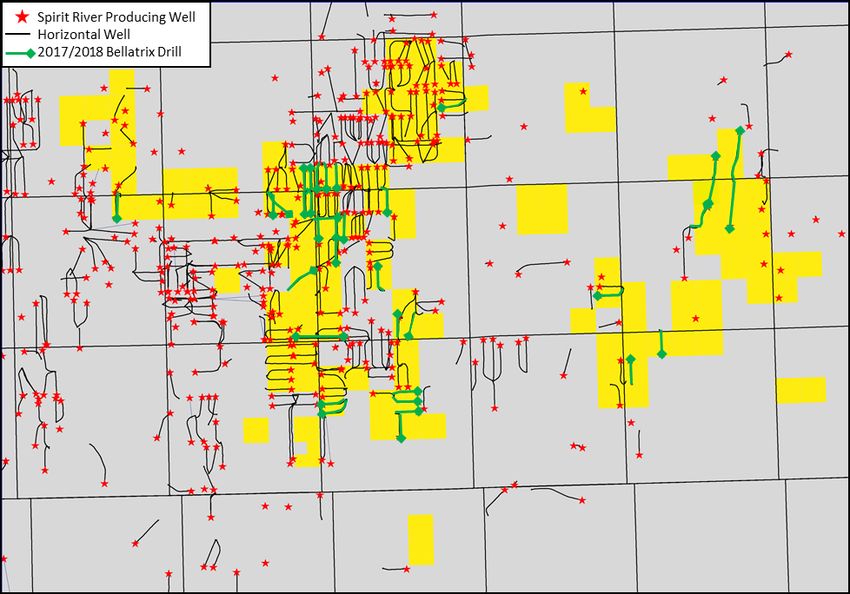
The Call on Canadian Natural Gas to
 Meet Increased Demand
                                                                 Five Year                        The call on WCSB natural gas
                                                     Current     Outlook             Growth       is estimated at 3 to 6 Bcf/d
                                                                                                  over the next five years
    Regional Canadian demand                         5 Bcf/d      7 Bcf/d            2 Bcf/d      This represents required
                                                                                                  basin production growth of
    Canadian exports                                 10 Bcf/d   11 - 14 Bcf/d       1 - 4 Bcf/d   approximately 20 – 40%
    Required WCSB production                         15 Bcf/d   18 - 21 Bcf/d       3 - 6 Bcf/d   compared to current levels

                     WCSB GAS FLOWS - CURRENT                                   WCSB GAS FLOWS – FIVE YEAR OUTLOOK

Source: Adapted from Peters & Co. Limited Research
                                                                                                                                 6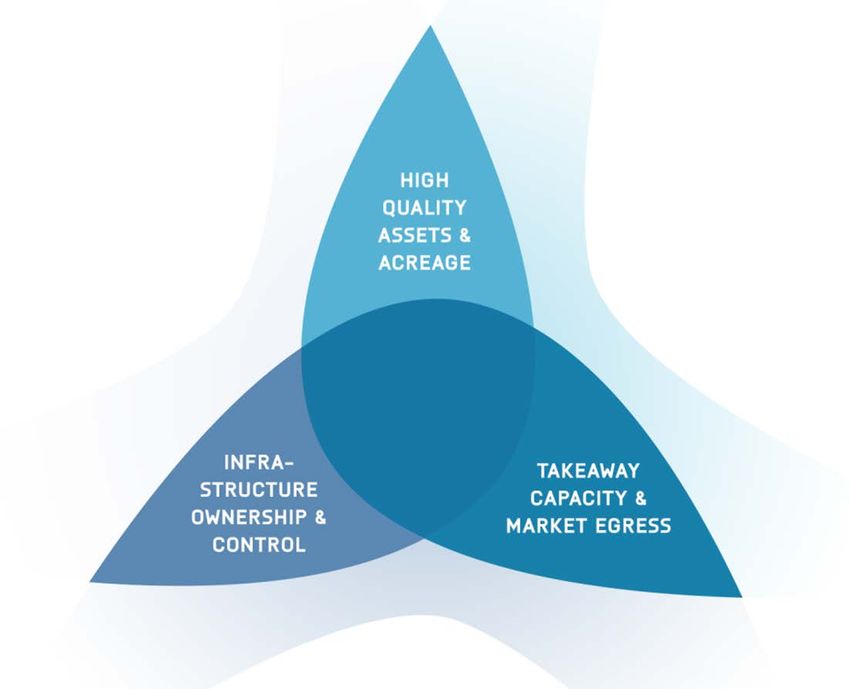
AECO Basis Differential Forecast
   Improvemment
                                                           AECO Basis Differential (US$/MMBtu)
     $1.00

     $0.50                                                       Historical                                 Forecast
     $0.00

   ($0.50)

   ($1.00)

   ($1.50)
                                                     Historical average
                                                   (Jan 2003 to July 2019)
   ($2.00)                                            US$0.80/MMBtu

   ($2.50)

   ($3.00)

   The AECO market was negatively impacted by the changes initiated in July 2017                 The AECO basis differential shows
                                                                                                 narrowing towards historical
   This changed operating methodology used by the pipeline operator to regulate the              levels given anticipated future
   flow of available gas in the Alberta market during periods of maintenance                     egress capacity, with a material
   AECO pricing has been highly discounted from pricing in other North American markets          increase in egress capacity
   and producing basins                                                                          expected in 2020
Source: Bloomberg; forward strip as at August 2, 2019
                                                                                                                                     7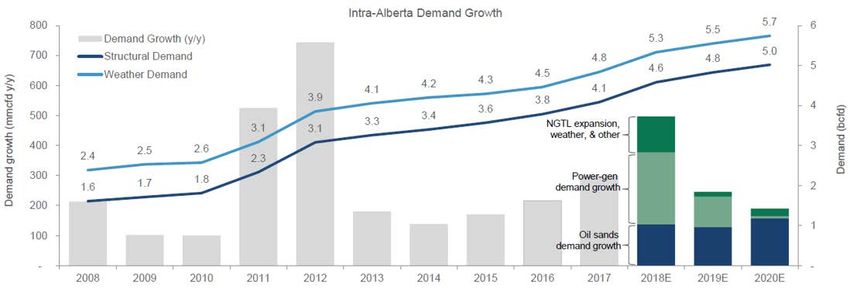
AECO Natural Gas
 Expansion Projects Underway
                  ADDITIONAL EXPORT CAPACITY BEING DEVELOPED OUT OF THE CANADIAN BASIN
 Effective Capacity (MMcf/d) 2017A            2018     2019E    2020E   2021E   2022E   2023E   2024E
 In Service
   Alliance                         1,800 1,800 1,800 1,800 1,800 1,800 1,800 1,800
   NGTL - Empress                   3,800 3,800 3,800 3,800 3,800 3,800 3,800 3,800
   NGTL - McNeill                   1,500 1,500 1,500 1,500 1,500 1,500 1,500 1,500                      Forecasts anticipate the basin will
   NGTL - AB/BC
   Spectra - T-South
                                    2,500 2,500 2,500 2,500 2,500 2,500 2,500 2,500
                                    1,700 1,700 1,700 1,700 1,700 1,700 1,700 1,700
                                                                                                         become long egress and domestic
 Total                             11,300 11,300 11,300 11,300 11,300 11,300 11,300 11,300
                                                                                                        demand between Q4/19 and Q1/21
 Proceeding
  NGTL - AB/BC                                230      350      650      650     650     650     650
  NGTL - Empress/McNeill                                        400     1,280   1,280   1,280   1,280
  Spectra - T-South                                             190      190     190     190     190
  Coastal Gaslink                                                                               2,100
 Total                                        230      350      1,240   2,120   2,120   2,120   4,220

 Capacity Expansion (%)              0%        2%       3%      11%     19%     19%     19%     37%

                 Capacity expansions add over 2.1 Bcf/d
                 of incremental export capacity through
                 2021, an increase of 19% compared to
                         current capacity levels

Source: Scotiabank Energy Research, Altacorp Capital Research
                                                                                                                                               8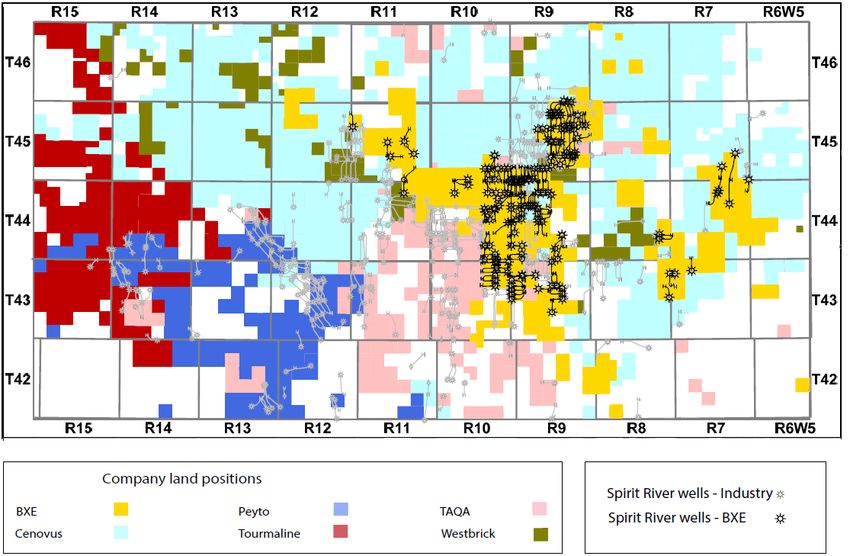
AECO Natural Gas – Demand Growth
 Drivers
                                     INTRA-ALBERTA DEMAND GROWTH
   External forecasts see intra-Alberta demand growth of:
   ↑ 500 MMcf/d YoY in 2018 to 5.3 Bcf/d
   ↑ 245 MMcf/d YoY in 2019 to 5.5 Bcf/d
   ↑ 190 MMcf/d YoY in 2020 to 5.7 Bcf/d

Source: Scotiabank Energy Research
                                                                   9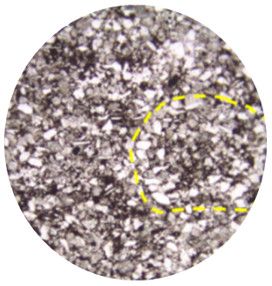
The World Needs More Canadian
Natural Gas
Canada has significant long term
natural gas resources and is the
fourth largest producing country
globally1
Natural gas represents the “bridge Canadian Natural Gas Industry Scorecard
fuel” of the future
Stringent industry regulations
Canadian natural gas development Leader in environmental stewardship
has the potential to continue to High ethical standards
improve global standards of living, Strong safety based culture & practices
while preserving the environment Indigenous consultations & partnerships
and reducing global emissions
Bellatrix is a leader in responsible
Canadian natural gas development,
focused on safe, efficient and
profitable development of our world
class resources
1 Based on 2017 world natural gas production; source Natural Resources Canada
10Bellatrix Investment Highlights
Dominant core acreage position in Top tier capital efficiencies and cost
west central Alberta profile deliver full cycle profitability
Spirit River represents one of North Asset portfolio provides balance of
America’s lowest supply cost natural natural gas and oil/liquids weighted
gas plays opportunities
Consistently deliver top ranked well Term debt maturities extended until
productivity results 2023
Ownership and control Long term market
of strategic diversification strategy
infrastructure including in place through 2020
pipelines, compression, Firm transportation
and processing facilities over current gross
Infrastructure control operated natural gas
creates significant volumes
barriers to competition Firm service contracts
Alder Flats Phase 2 through owned & 3rd
brings total gross party processing plants
processing capacity to Long term fractionation
230 MMcf/d agreements in place for
100% of volumes
11Corporate Profile
MARKET SUMMARY
Ticker Symbol TSX : BXE
Average Daily Volume1 ~130,000
Shares Outstanding2 40.9 million basic / 41.6 million diluted
Market Capitalization3 $27 million
Bank Debt4 $60 million
Second Lien Notes due 20235 US$152 million
Third Lien Notes due 20235 US$55 million
Enterprise Value3 $385 million
2019 Estimated Annual Production 34,000 – 36,000 boe/d
2019 Natural Gas Weighting 71%
2019 Liquids Weighting 29%
1 Three month average at July 29, 2019
2 Share count at June 30, 2019. Diluted shares include options and units.
3 Calculated using July 29, 2019 share price (C$0.67/share). Enterprise value includes market capitalization plus total net debt of $358 million. Total net debt includes bank debt and adjusted working capital
deficiency at June 30, 2019 ($89 million), and assumes conversion of Second and Third Lien notes at Cdn/US $1.3091.
4 Bank debt reflects $60 million outstanding on the Credit Facilities at June 30, 2019
5 Second and third lien notes reflect June 30, 2019 balances
12Strategic Objectives & Outlook
Improving financial strength and value preservation in low commodity price environment
2017 2018 2019
New management team Manage capital Advance debt refinancing
established investment levels within initiatives
funding
Enhanced production Sustain production levels
guidance three times Complete Phase 2 of BXE and optimize liquidity
during the year Alder Flats Plant on-time
and under budget Target further reductions
Reduced capital costs by in cash costs (operating
~10% and operating costs Deliver on guidance costs, G&A)
by ~5% YoY expectations
Optimize returns from
Enhance deliverability of Reduce capital and balanced portfolio
wells with average results operating costs investment
tracking ~6.0 Bcf type
curve Refinance part of long Preserve long term
term notes and extend resource value
Achieved leading PDP debt maturities
FD&A costs of $5.27/boe
Achieved leading PDP
FD&A costs of $3.22/boe
132019 Guidance & First Half Results
STRONG OPERATIONAL PEFORMANCE IN THE FIRST HALF OF 2019
RELATIVE TO ANNNUAL GUIDANCE EXPECTATIONS1
2019 INITIAL ACTUAL RESULTS
FIRST HALF 2019
ANNUAL GUIDANCE VERSUS MIDPOINT
RESULTS
(JAN 15, 2019) OF GUIDANCE
Production (boe/d)
2019 Average daily production 36,450 34,000 – 36,000 +4%
Production mix (%)
Natural gas 71 72 -1%
Crude oil, condensate and NGLs 29 28 +4%
Capital Expenditures ($MM)
Total net capital expenditures 2 $25.5 $40 - $50 n/a
1 2019 capital budget incorporates forward pricing expectations of US$65/bbl WTI and $1.60/GJ AECO
Excludes property acquisitions and dispositions.
14
2Hedging & Market Diversification
Market Diversification Contracts
Market Start Date End Date Volume
Chicago 01-Feb-18 31-Oct-20 15,000 MMBtu/d
Chicago 01-Nov-18 31-Oct-20 15,000 MMBtu/d
Dawn 01-Feb-18 31-Oct-20 15,000 MMBtu/d
Dawn 01-Nov-18 31-Oct-20 15,000 MMBtu/d
Malin 01-Feb-18 31-Oct-20 15,000 MMBtu/d
AECO 75,000 MMBtu/d
Hedging & Market Diversification
H2/19 Total Corporate Volumes
Liquids Dawn
Unhedged Floating
26% 7% Malin
Floating
Malin 2%
Chicago
Oil Hedged Floating
Chicago Dawn 3% 8%
U.S. Fixed
AECO Price Hedges
Unhedged 20%
Henry Hub
27%
AECO Fixed
Price Hedges
7%
Note: Percentage of estimated 2019 production volumes based on midpoint of guidance range 34,000 – 36,000 boe/d (71% natural gas weighted) 15Commodity Price Risk Management &
Diversification
NATURAL GAS MARKET DIVERSIFICATION & FIXED PRICE HEDGING COVERAGE
80%
70%
% of total forecast 2019 gas
60%
50%
volumes
40%
30%
20%
10%
0%
Q3/19 Q4/19 Q1/20 Q2/20 Q3/20 Q4/20
Market Diversification Contracts U.S. Fixed Price Contracts AECO Fixed Price Swaps AECO/NYMEX Basis Swap
NATURAL GAS FIXED PRICE HEDGES OIL HEDGES
AECO fixed price swap contracts: WTI call option contracts:
• 18 MMcf/d @ $2.01/Mcf (July – Oct 2019) • 1,000 bbl/d @ $87.50/bbl (July – Dec 2019)
• 9 MMcf/d @ $1.15/Mcf (July – Sept 2019) • 1,000 bbl/d @ $77.90/bbl (Jan – Dec 2020)
• 9 MMcf/d @ $1.18/Mcf (July – Oct 2019)
• 9 MMcf/d @ $2.33/Mcf (Nov 2019 – Mar 2020)
U.S fixed price contracts1:
• 62 MMcf/d @ $1.77/Mcf (July – Oct 2019)
STRONG PRICE RISK MANAGEMENT & MARKET DIVERSIFICATION COVERAGE
Percent of forecast volumes based on the mid-point of average 2019 production guidance of 34 – 36 mboe/d (71% natural gas weighted).
Natural gas hedges converted from $/GJ to $/Mcf based on an assumed average corporate heat content of 40.0 Mj/m3.
All hedges denominated in Canadian dollars unless otherwise noted.
16
1 Net Canadian equivalent price is calculated as the US$ fixed price, less contracted differential, adjusted to Canadian dollars at an assumed exchange rate of $1.33 USD/CAD.Growing High Value Liquids
Growing NGL Volumes & High Value Condensate
60.00 100%
Corporate NGL yield (bbl/MMcf)
55.00
90% Light oil
Product % of total crude oil &
condensate volumes (bbl/d)
80%
50.00 70%
60%
45.00 50%
Alder Flats Phase 2 40%
40.00
Completed 30% Condensate
35.00 20%
10%
30.00 0%
High Condensate Weighting Drives Strong Realizations Relative to Benchmark Light Oil Prices
$90 $8.00
$80 BXE crude oil & condensate
$6.00
$70 differential (C$/bbl)
$60 $4.00
Oil price (C$/bbl)
$50
$2.00
$40
$30 $0.00
Canadian Light crude blend
$20
BXE crude oil and condensate ($2.00)
$10
$0 ($4.00)
17Recapitalization Transaction
COMPLETED JUNE 4, 2019
Total outstanding debt reduced by approximately $110 million (approximately 23%)
Term debt maturities extended until 2023
Annual cash interests payments reduced by approximately $12 million
(approximately 30%) until December 2021
Improves annual cash flow
Positions company favorably to utilize existing infrastructure and high value assets
to deliver long term sustainable growth for all stakeholders
Increases runway to capitalize on Bellatrix’s significant reserve value1
Note 1: Bellatrix Proved plus Probable (2P) reserve value at December 31, 2018 as evaluated by InSite Petroleum Consultants Ltd. is $1.5 billion
18Diversified Balance Sheet &
Financial Flexibility
Actively exploring refinancing opportunities and additional sources of liquidity
BANK DEBT $60MM CREDIT FACILITY LONG TERM DEBT
AT JUNE 30, 2019 FINANCIAL COVENANTS MATURITIES
5.0
$300
4.0
Debt/EBITDA
3.0 $250
Debt maturities (C$)
2.0 $200
Undrawn
1.0 $150
0.0
Utilized $100
Q3/18
Q4/18
Q1/19
Q2/19
Utilized $50
First Lien Debt to EBITDA $0
Senior Debt to EBITDA 2019 2020 2021 2022 2023
Bank debt $60MM at Two financial covenants US$152MM Second Lien
June 30, 2019 notes due 2023
First Lien Debt/EBITDA; maximum
$90MM credit facility confirmed ratio of 3.0x US$54.9MM Third Lien
May 2019 with total commitments notes due 2023; special repayment
set at $100MM Senior Debt/EBITDA; maximum of principal of US$4.9MM due
ratio of 5.0x December 2019
Next semi-annual redetermination
November 2019 Q2/19 ratios of 1.52x and 4.34x
respectively were both below
financial covenant levels
Bank Debt and Covenants as at June 30, 2019 and excludes letters of credit
Long term U.S denominated debt converted at an exchange rate of $1.3091 CAD/USD 19Highly Concentrated Land Base
DOMINANT ACREAGE POSITION WEST CENTRAL ALBERTA CORE AREA
Highly focused land base in
the prolific Deep Basin of FERRIER
Alberta WILLESDEN GREEN
99% of total corporate GREATER PEMBINA
production and 100% of
~100 Kilometers (60 Miles)
Production1 (% of total): 99%
capital investment focused
in the Greater Ferrier, P+P net locations2: 275
Willesden Green & Pembina
Unbooked net locations2: 585
areas of Alberta
Total net drilling
Control of significant locations:
860
infrastructure (facilities,
pipelines, compression)
creates barriers to
competition
Alberta
~77 Kilometers (48 Miles)
1 Reflects % of June 2019 average field volumes
2 Proved, Probable and unbooked locations as at December 31, 2018
20North American Supply Cost Comparison
$4.00
$3.50
$3.00
Henry Hub (US$/MMbtu)
$2.50
$2.00
$1.50
$1.00
$0.50
$0.00
Economics assume 15% Before tax IRR, assumes $US0.83 = $CDN1.00, US$0.75/MMbtu AECO basis, and a 20:1 oil-to-gas pricing ratio;
Note (*): Bellatrix economics assume to be free of GORR
Source: RBC Capital Markets Research
21Pre-eminent Capital Efficient Operator
in the WCSB
BXE BEST IN CLASS ON 2018 ALL-IN CAPITAL EFFICIENCY
$45,000
All-in capital efficiencies, excl. A&D ($/boe/d)
$40,000
$35,000
$30,000
$25,000
$20,000
$15,000
$10,000
$5,000
$0
PEY
BIR
PSK
VET
KEL
POU
AAV
BNP
TOU
VII
ECA
FRU
PMT
ERF
ARX
NVA
CR
DEE
BXE
PONY
Gas (Bellatrix’s Spirit River Play
BXE Land Sections1 GREATER FERRIER AREA CORE SPIRIT RIVER PLAY
• 198 Gross
• 118 Net
BXE Net Drilling Inventory2
• 105 proved
• 27 probable
• 250 unbooked
• 382 total
• True vertical formation
depth ~2,250 meters
(~7,400 feet)
• Currently drilling one
mile laterals
• Average 17 frac stages
per mile with 40 tonnes
per stage
Spirit River (Notikewin/Falher/Wilrich) provides significant upside
1 Includes Core Areas, Acreage as at December 31, 2018
2 Proved, Probable and unbooked locations as at December 31, 2018 23Spirit River Geology Summary
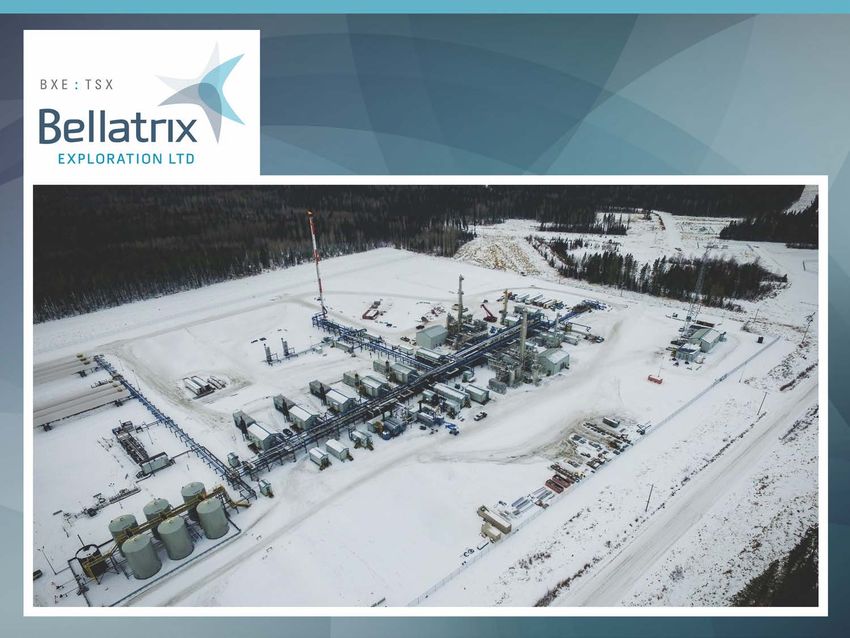
• Broad, thick, extensive sand rich valleys SPIRIT RIVER STACKED SANDS
in Notikewin, Falher and Wilrich
members
One square
• Tight sandstone: long life reserves with mile section
long term hyperbolic decline profile schematic
• Average thickness 20 to 40 meters
(approximately 80 to 130 feet)
• Up to four wells per zone to fully — Notikewin
develop a section
— Falher A
• Porosity 6 to 18%; permeability 1 to 3
mD — Falher B
• Over pressured and very low water
saturation — Wilrich
• Open and closed fracture systems
evident in rock core and to a lesser
degree in rock cuttings
• Continuous reservoir in the horizontal
section
24Comparing Premier Resource Plays
Spirit River Montney Duvernay
Tight Conventional
Siltstone Shale
Sandstone
BXE Typical Reservoir
Porosity 6 to 18%; Porosity 0.6 to 8%;
Porosity 2 to 8%;
Permeability 1 to 3 mD Permeability 0.0001 to
Permeability 0.001 to 0.1 mD
0.0004 mD
High Permeability High Porosity Low Permeability Low Porosity
Source: Spirit River and Duvernay Core Photos from BXE core, Montney core photo from Tom Moslow Publication
25Low Cost Competitive Advantage – BXE Spirit
River Versus Canadian Plays
STAGE COUNT PROPPANT PLACED
40 8,000
35 7,000
Average proppant (tonnes)
Average stage count
30 6,000
25 5,000
20 4,000
15 3,000 TOTAL WELL COST
10 2,000 COMPARISON
5 1,000 $10
0 0 $9
Duvernay Montney BXE Spirit Duvernay Montney BXE Spirit
$8
DCE&T well costs ($MM)
River River
$7
FLUID PUMPED TOTAL DEPTH $6
7,000 $5
60,000
6,000 $4
Average total depth (m)
Average fluid pumped (m3)
50,000
$3
5,000
40,000 $2
4,000
30,000 $1
3,000
$0
20,000
2,000 Duvernay Montney BXE Spirit
10,000 River
1,000
0 0
Duvernay Montney BXE Spirit Duvernay Montney BXE Spirit
River River
Source: Accumap, Scotiabank Energy Research, internal costs 26Play Profitability Comparisons
BXE Spirit River Montney Duvernay
All-in Well Costs
$3.4 $6.4 $9.4
(DCE&T, $MM)
Average IP365
1,070 608 459
(boe/d)
IP365 Capital Efficiency
$3,180 $10,500 $20,560
($/boe/d)
Average Implied EUR
7.1 6.3 4.3
(Bcfe)
Estimated F&D
$2.87 $6.07 $13.12
($/boe)
Source: Accumap, Scotiabank Energy Research
Bellatrix average estimated production (IP365) based on 2017 & 2018 performance. EUR incorporates 6.0 Bcf (raw gas) performance curve and utilizes all-in well costs of $3.4 million
27Spirit River Type Curves
SPIRIT RIVER 5.2 & 6.0 BCF TYPE CURVES Bellatrix Spirit River Economics
9 Economic Assumptions 5.2 Bcf 6.0 Bcf
Liquids (bbl/MMcf) Gross CAPEX (DCE&T, $MM) $3.4 $3.4
8 Gross Natural Gas IP30 (MMcf/d) 6.6 6.3
Liquids yield (bbl/MMcf) 71 71
Producing Day Raw Gas Volumes (MMcf/d)
C5+, 15 EUR (mboe) 1,094 1,245
7
C4, 9 Economic Outputs (C$2.50/GJ) 5.2 Bcf 6.0 Bcf
6 C2, 29
NPV10 BTAX ($MM) $5.5 $7.3
PIR (10%) 1.6 2.1
5 C3, 18
Payout (years) 0.9 0.6
IRR (%) 127 200
4
200%
3
2 150%
1
IRR %
100%
0
0 90 180 270 360 450 540 630 720 50%
Days
5.2 Bcf 6.0 Bcf 0%
$1.50/GJ $2.50/GJ
Note: Type curves based on raw gas assumed recovery, total recovery including liquids 6.6 Bcfe and 7.5 Bcfe
5.2 Bcf 6.0 Bcf
Economics assume liquids prices based on a US$60/bbl WTI oil price and a natural gas variable production expense cost of $0.60/Mcf and transportation cost of $0.20/Mcf.
Assumed shrinkage, liquids yield and heat value based on average Bellatrix Spirit River well composition in the greater core Ferrier area. 28Spirit River All-In Profitability
5.2 Bcf Type Curve
C$1.50/GJ C$2.50/GJ Full Cycle F&D costs
Drill $1.5MM
Full cycle F&D costs $/Mcfe ($0.71) ($0.71) Complete $1.4MM
Equip & tie in $0.5MM
Half cycle costs $3.4MM
Land/seismic/facilities $1.0MM
Cash costs $/Mcfe ($2.17) ($2.25) Full cycle costs $4.4MM
EUR (P50) 6.2 Bcfe
Sales price $/Mcfe $3.24 $4.24 Full cycle F&D $0.71/Mcfe
Cash costs C$1.50/GJ C$2.50/GJ
Royalties (est @ 8%) $0.26/Mcfe $0.34/Mcfe
Profit $/Mcfe $0.36 $1.29 Operating costs 1 $0.73/Mcfe $0.73/Mcfe
Transport2 $0.38/Mcfe $0.38/Mcfe
Profit margin % 11% 30%
G&A2 $0.22/Mcfe $0.22/Mcfe
Interest & financing2 $0.57/Mcfe $0.57/Mcfe
Total costs $2.17/Mcfe $2.25/Mcfe
Half Cycle IRR % 52% 127%
Sales price C$1.50/GJ C$2.50/GJ
Total sales price3 $3.24/Mcfe $4.24/Mcfe
Note: Numbers may not add due to rounding
1 Incremental operating costs assume $0.56/Mcf for natural gas through third party plants, $0.16/Mcf for gas processed through BXE Alder plant and $8.00/bbl for oil/condensate. Includes
estimated attributed operating cost impact from $75 million facilities disposition announced May 13, 2016.
2 Representative transport, G&A and interest costs based on first half 2019 corporate costs
3 Sales prices assume AECO at $1.69/Mcf ($1.50/GJ) or $2.82/Mcf ($2.50/GJ) as per scenario with net NGL pricing: ethane @ $12/bbl, propane @ $25/bbl, butane @ $40/bbl and condensate @
$70/bbl incorporating liquids extraction capabilities given mix of gas through third party and BXE Alder Flats Plant. 29Delivering on our Objectives
RESULTS OUTPERFORMING EXPECTATIONS
14
12
10
Producing Day Volumes (MMCF/d)
8
6
4
2
0
0 30 60 90 120 150 180 210 240 270 300 330 360 390 420 450 480 510 540 570 600 630 660 690 720
Days
2018/19 Wells 2018 Average 2019 Average BXE Spirit River 5.2 Bcf Type Curve BXE Spirit River 6.0 Bcf Type Curve
Historical daily well production (natural gas only) versus Bellatrix representative 5.2 & 6.0 Bcf type curves
30Enduring Efficiency Gains on Drill Times
AVERAGE SPIRIT RIVER DRILLING CURVES DAYS SPUD TO RIG RELEASE BY YEAR
0 20
Days (Spud to Rig Release)
2014 Spirit River
Average
500 15
2015 Spirit River
Average
1,000 10
2016 Spirit River
Average
1,500 2017 Spirit River 5
Measured Depth (m)
Average
2,000 2018 Spirit River 0
Average 2014 2015 2016 2017 2018 2019
2,500 2019 Q1 Spirit
River Average DRILL COST BY YEAR
3,000 Pace Setter $3.0
$2.5
3,500
$2.0
4,000 Drill Cost ($MM) $1.5
4,500 $1.0
$0.5
5,000
0 5 10 15 20 $0.0
Days Spud to Rig Release 2014 2015 2016 2017 2018 2019
Note: Comparative drilling curves by year based on one mile Bellatrix “hybrid” drilling style which constitutes technique employed for majority of wells drilled since 2014 31Spirit River Well Costs & Capital Efficiencies
FOCUSED CAPITAL COST REDUCTIONS
$6.0
Long Reach
Long Reach
$5.0
Long Reach
$4.0
Costs ($millions)
Long Reach
Equip & Tie-in
$3.0
Complete
$2.0 Drill
$1.0
$0.0
2016 - 19 wells 2017 - 23 wells 2018 - 10 wells 2019 - 4 wells
DRIVES STRONG CAPITAL EFFICIENCIES (IP365 ESTIMATE) AVERAGINGBellatrix Focused Spirit River Growth
SPIRIT RIVER PRODUCTION GROWTH
80% 2010
32,000
70%
28,000
Spirit
Spirit River % of Total Company Volumes
River
Average Monthly Production (boe/d)
60% 2018 New 24,000
2014 Drill
Falher A Techniques
50% 2011 Other
2012 Validation 20,000
Slick Water
Frac Extended
40% Reach
16,000
30% 12,000 June 2019
20% 8,000
Other Spirit
10% 4,000
River
0% 0
May-10
May-11
May-12
May-13
May-14
May-15
May-16
May-17
May-18
May-19
Jan-10
Jan-11
Jan-12
Jan-13
Jan-14
Jan-15
Jan-16
Jan-17
Jan-18
Jan-19
Sep-10
Sep-11
Sep-12
Sep-13
Sep-14
Sep-15
Sep-16
Sep-17
Sep-18
Spirit River % of Total Monthly Production (boe/d)
Low cost Spirit River volumes comprise a growing proportion of total corporate production (~80%)
Processing facilities and Firm Transportation (FT) capacity in place to facilitate growth 33Cost Reductions Achieved
36% REDUCTION IN PRODUCTION EXPENSES ($/BOE)
$11.00
Production expense
$10.00
$9.00
($/boe)
$8.00
$7.00
$6.00
$5.00
Q4/16 Q1/17 Q2/17 Q3/17 Q4/17 Q1/18 Q2/18 Q3/18 Q4/18 Q1/19 Q2/19
29% REDUCTION IN PRODUCTION EXPENSES ($MM)
$32
$30
Production expense
$28
$26
($MM)
$24
$22
$20
$18
Q4/16 Q1/17 Q2/17 Q3/17 Q4/17 Q1/18 Q2/18 Q3/18 Q4/18 Q1/19 Q2/19
Note: 2019 operating costs impacted by IFRS 16. Historical figures have not been restated. Q2/19 production expenses included $2.3 million ($0.71/boe) of turnaround costs at Bellatrix operated
facilities during the quarter 34Low Cost FD&A Performance
$6.00
FD&A costs ($/boe)
$5.00
$4.00
$3.00
$2.00
$1.00
$0.00
2018 2017 3 Year Avg 2018 2017 3 Year Avg
('16-'18) ('16-'18)
FD&A Costs Including Plant Capital FD&A Costs Excluding Plant Capital
PDP FD&A 1P FD&A 2P FD&A
FD&A Costs Including Plant Capital FD&A Costs Excluding Plant Capital
3 Year Avg 3 Year Avg
2018 2017 2018 2017
('16-'18) ('16-'18)
PDP FD&A $/boe $3.22 $5.27 $4.67 $3.12 $4.81 $4.31
1P FD&A $/boe $2.36 $4.34 $3.76 $2.28 $4.12 $3.57
2P FD&A $/boe $2.05 $3.36 $3.22 $1.99 $3.15 $3.05
PDP Recycle Ratio x 2.64x 1.71x 1.82x 2.73x 1.88x 1.97x
1P Recycle Ratio x 3.61x 2.08x 2.26x 3.73x 2.19x 2.38x
2P Recycle Ratio x 4.15x 2.68x 2.64x 4.28x 2.86x 2.78x
FD&A costs are used as a measure of capital efficiency. FD&A presented above has been calculated based on exploration and development capital and/or acquisition capital spent in the applicable period
(both including and excluding changes in future development capital for that period) divided by the change in reserves for that period including revisions for that same period. The aggregate of the
exploration and development costs incurred in the most recent financial year and the change during the year in estimated future development costs generally will not reflect total finding and development
costs related to reserve additions for the year. Recycle ratio calculates operating netback divided by FD&A costs. Operating netback is calculated by deducting transportation, royalties and operating costs
from revenue and includes the impact of commodity price risk management contracts. 35Representative Spirit River Inventory
Required to Maintain Production Volumes
Approximately 12-15 net (5.2 Bcf type curve) Spirit River wells1 per year maintains
production in the high 30 mboe/d range through 2023
Alternatively, 10-12 net wells (6.0 Bcf type curve) achieve similar maintenance scenario
40
35
30
25
Production (mboe/d)
20
15
10
5
0
Jan-19 Jul-19 Jan-20 Jul-20 Jan-21 Jul-21 Jan-22 Jul-22 Jan-23 Jul-23
Base 2019 2020 2021 2022 2023 6.0 Bcf/d wells (10/year)
2019 2020 2021 2022 2023 Summary
Beginning net location inventory 382 370 358 346 334 382
Net locations drilled 12 12 12 12 12 60
Ending net location inventory 370 358 346 334 322 322
% drilled of total inventory 3% 3% 3% 3% 4% 16%
Assumes phased drilling development with average well results in line with Bellatrix Spirit River type curve. Representative example as future budgets, drill plans, and anticipated well results are uncertain.
36Greater Ferrier Area Infrastructure
Overview
GREATER FERRIER AREA STRATEGIC INFRASTRUCTURE
GREATER FERRIER EXISTING
INFRASTRUCTURE ACCESS:
Infrastructure gives Bellatrix control
of production and growth
Working interest or operatorship in
• 3 major gas processing facilities
• 9 compressor sites
• 4 oil batteries
BELLATRIX ALDER FLATS PLANT
Bellatrix 25% owner and operator
• Keyera 70% owner
• O’Chiese 5% owner
Phase I - 110 MMcf/d inlet capacity
(on-stream May 2015)
Phase II - 120 MMcf/d inlet capacity
(on-stream March 2018)
• C2 Recovery 57%
• C3 Recovery 100%
• C4+ Recovery 100%
Strategic advantage from
owned infrastructure –
lowered costs and
guaranteed access
37Drill Bit Focused
PLANT PHASE 2 CONSTRUCTION COMPLETE MARCH 2018
• Major compressor stations, pipelines and Bellatrix Alder Flats Plant capital investment completed
• Proportion of incremental capital to drilling & completion expected to increase
• Increased drill bit directed capital positions Bellatrix to deliver enhanced corporate capital efficiency
rates in 2019 & beyond
ALLOCATION OF TOTAL CORPORATE E&D CAPITAL EXPENDITURES
100%
Plant Plant
90% Plant Plant
Land, G&G, and other capital
% of Total E&D Capital Expenditures
80%
Plant
70%
BXE Alder Flats Plant
DRILLING
60%
DRILLING
DRILLING
DRILLING
50%
DRILLING
40% Facilities & equipment
(excluding BXE Plant)
DRILLING
30%
1
20% Drilling & completion capital
10%
0%
2014 2015 2016 2017 2018 2019E
1Drilling and completion capital includes capitalized items
Note: Capital expenditures and development plans for 2019 are based on current capital budget guidance. 38Ample Takeaway Capacity & Market Egress
ALBERTA NATURAL GAS MARKET EGRESS
AMPLE FIRM TRANSPORTATION IN
PLACE FOR CURRENT & GROWTH
ALBERTA
VOLUMES
• Firm Transportation (FT) agreements in
place for gross operated volumes at
multiple receipt points along the Nova Gas
Transmission Ltd. (NGTL) system Montney
FIRM SERVICE PROCESSING CAPACITY
• Maintain firm service capacity through
several natural gas processing plants to
ensure unfettered delivery capability for
current & forecast growth volumes
AMPLE FRACTIONATION CAPACITY Alliance Pipeline
SECURED
• Long term agreements in place provide
100% coverage for current and forecast NGL
Nova Gas
volume growth Transmission
BXE core west central area ideally situated Ltd. (NGTL)
on the NGTL system, downstream of System Pipelines
Montney & northern Deep Basin areas,
with firm transportation capacity
39Supplemental Information
40Concentrated Multi-Zone Acreage
DEEP BASIN MULTI-ZONE ACREAGE
Deep Basin is highly coveted for:
• Sweet, liquids rich natural gas 4,600 ft TVD—
— Belly River
• Sweet, light gravity crude oil 6,200 ft TVD—
— Cardium
• Multi-zone hydrocarbon charged — Second White Specs
formations — Viking
7,400 ft TVD—
• Low production cost with no — Notikewin
formation water — Falher A
Spirit
7,700 ft TVD—
• Year round access — Falher B River
Benefits of multi-zone development: — Wilrich
— Glauconite
• Pad drilling reduces above ground
footprint — Ostracod
— Ellerslie
• Lease sizes minimized — Rock Creek
• Manufacturing style approach — Nordegg
11,200 ft TVD—
• Half-cycle returns expected longer — Duvernay
term as subsequent formation
development utilizes existing lease
pads, pipelines, and infrastructure
TVD: True vertical depth 41Cardium Light Oil Resource Play
BXE Land Sections1
• 176 Gross
• 117 Net BELLATRIX Activity Since Jan 2017
5 Wells Drilled
BXE Net Drilling Inventory2
• 105 proved
• 22 probable
• 124 unbooked
• 251 total
Cardium Resource Play
Summary
• Largest WCSB light oil
accumulation
• Approximately 20,000
square miles
• Approximately 1.9 Billion
bbls produced to date
1 Acreage as at December 31, 2018
2 Proved, Probable, and unbooked locations as at December 31, 2018
Cardium provides light oil exposure with optionality to improving prices
Remains a key focus formation for Bellatrix long-term within its core areas
42Strategic Land Position
GREATER FERRIER/BRAZEAU/WILLESDEN GREEN AREAS OF WEST CENTRAL ALBERTA
Pembina
Brazeau
Ferrier
Willesden Green
Source: Accumap, company presentations and various public sources 43AER Calculated LMR
0
4
8
12
16
20
24
28
LMR as at July 6, 2019
Advantage Oil and Gas
Birchcliff Energy
Pengrowth Energy
Bellatrix Exploration
Torc Oil and Gas
NuVista Energy
Kelt Exploration
Tamarack Valley Energy
Bonavista Energy
Painted Pony Energy
Peer Group LMR Comparison
Baytex Energy
Surge Energy
Liability Management Rating - Alberta
Bonterra Energy
BELLATRIX RETAINS A STRONG LMR POSITION
Cardinal Energy
Crew Energy
Obsidian Energy
Industry average
Pine Cliff Energy
Storm Resources
44Operational Execution Scorecard
Production expense reductions 40% reduction in production expenditures to $6.29/boe in
H1/19 from $10.57/boe in Q4/16
Capital cost reductions 20% reduction in all-in well costs to under $3.4 million (drill, complete,
equip and tie-in) from ~$4.2 million in Q4/16
Operational performance 2018 program delivered average IP180 well performance 35% above
management expectations; 2019 program 15% outperformance on an IP45 basis
Leading peer group F&D cost performance All-in PDP FD&A $3.22/boe ($0.54/Mcfe) in 2018.
2P FD&A $2.05/boe in 2018 and three year average $3.22/boe. Top decile results.
Pre-eminent capital efficient operator in the WCSB 2018/2019 program delivering capital
efficienciesCorporate Information
BOARD OF DIRECTORS SENIOR OFFICERS BANKERS
Todd Dillabough, B.Sc. Brent A. Eshleman, P.Eng. National Bank of Canada
Chairman President & CEO Alberta Treasury Branches
Canadian Western Bank
Cody Church, B.Econ Max Lof, CFA
Executive Vice President & CFO EVALUATION ENGINEERS
Brent A. Eshleman, P.Eng InSite Petroleum Consultants Ltd.
Charles R. Kraus, Esq.
Brian Frank, B.A., M.A.
Executive Vice President, General REGISTRAR & TRANSFER AGENT
Keith E. Macdonald, CPA, CA Counsel & Corporate Secretary Computershare Trust Company of Canada
Thomas E. MacInnis, B.Comm, MBA Garrett Ulmer, P.Eng AUDITORS
Chief Operating Officer KPMG LLP
Mark Smith, P.Eng
Steve G. Toth, CFA EXCHANGE LISTING
Vice President, Investor Relations & The Toronto Stock Exchange - BXE
Corporate Development
ADDRESS
1920, 800 – 5th Avenue SW
Calgary, Alberta Canada T2P 3T6
Tel: (403) 266-8670
Fax: (403) 264-8163
www.bxe.com
investor.relations@bxe.com
46You can also read