Risk Weighted Assets in Ireland - The Link to Mortgage Interest Rates
←
→
Page content transcription
If your browser does not render page correctly, please read the page content below

Risk Weighted Assets in
        Ireland
        The Link to Mortgage Interest Rates

Prepared by the
Department of Finance
finance.gov.ie
Risk Weight Assets in Ireland

Contents
Introduction                                                          2
Section 1                                                             6
      What determines the mortgage interest rate?
Section 2                                                             9
      What are RWAs and how are they calculated?
Section 3                                                             11
      Irish bank RWAs – pre and post crisis
Section 4                                                             16
      Linking RWA and capital with mortgage rates and profitability
Section 5                                                             21
      Will RWAs or risk density fall in the years ahead?
Section 6                                                             23
      Impact of new entrants
      Banks
      Retail credit firms
Section 7                                                             25
      Conclusions

——
1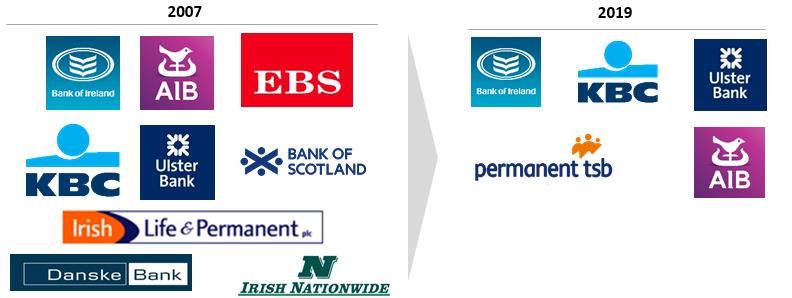
Risk Weight Assets in Ireland

 Introduction
 Irish mortgage interest rates have been a regular topic of media commentary in recent years.
 Of particular focus has been the fact that new mortgage interest rates in Ireland are higher
 than rates in many other European countries. A number of independent research notes have
 been published which discuss this issue including one from the Central Bank of Ireland (CBI)
 in 20151 and one from the Competition and Consumer Protection Commission (CCPC) in
 20172. Various other pieces have been written by market observers and local and
 international banks.

In their 2017 report the CCPC described the Irish mortgage market as “quite dysfunctional from
both a competition and a consumer perspective. The market we have is the legacy of 15 years
of boom and bust”. The CCPC went on to say that “we do not believe there are immediate
remedies that will reduce mortgage rates and fix the other dysfunctional aspects of this
market”.

There are a variety of factors which account for differences in interest rates across Europe.
Indeed this is not a new phenomenon. In 2007, when Irish mortgage rates were below the
European average, the Central Bank of Ireland (CBI) commented that:

              “There are a number of reasons for the gap in
              interest rates between Ireland and the euro
              area. Factors contributing to the differences
              include different product and charging
              structures, the level of competition within the
              banking sector, and firm size and sector.
              Many of these impediments to the
              convergence of retail interest rates are due to
              national market preferences and banking
              practises. The causes of differences are so
              varied that it makes the comparison of
              interest rates across countries difficult.”

These comments are as relevant today, when Irish mortgage interest rates are above the
European average, as they were then.

 1   See “Influences on Standard Variable Mortgage Pricing”, May 2015.
 2   Options for Ireland’s Mortgage Market, June 2017.

 ——
 2
Risk Weight Assets in Ireland

In a more recent note issued in November 2018, the CBI further commented that:

               “The retail banking sector in Ireland became
               much more concentrated during the crisis
               and remains so. More market power allows
               wider margins – greater profits. These
               conditions may attract market entrants in the
               future and increased competition may place
               downward pressure on margins but this
               remains to be seen .”               3

In any discussion on mortgage rates it is important to be clear about whether the topic
concerned is interest rates applying to new loans which by definition impact a small minority of
the population at any point, or the rates applying to the outstanding stock of mortgages which
impact a far larger grouping of people.

Interest rates on new mortgages are heavily discussed and commented on here in Ireland. At
the time of drafting this report, Central Bank of Ireland and ECB data on retail interest rates,
(issued on 11th January) highlighted an average headline interest rate of 3.04% for new
mortgages in Ireland (Figure 1). This compares to an average of 1.79% across the Euro area
(a gap of 1.25% or 125bps) with Ireland being the second highest after Greece.

It should be noted that headline mortgage rates ignore upfront fees, which do not feature in the
Irish market, that are charged in a number of other Euro area countries and increase the cost
of credit for the borrower. Similarly, cashback offers which are in effect a “negative” fee (as
they reduce the cost of credit) are a relatively new feature of the Irish market but are not
common elsewhere.

The most accurate way to quantify the increase these upfront fees have on relative loan pricing
is to compare the annual percentage rate of charge (APRC). The European Central Bank
(ECB) confirms that on this basis the Euro area average new business headline rate of 1.79%
for mortgages would rise to an APRC of 2.11% - a country by country breakdown is shown in
Appendix 1.

Furthermore, if one was to adjust for cashbacks which are a very popular choice for Irish
consumers, the average new business mortgage rates in Ireland would come down from the
headline rate of 3.04% to an APRC of 2.97%, narrowing the gap a little further with the rest of
Europe to 0.86%.

3
    Irish retail bank profitability 2003-2018, November 2018.

——
3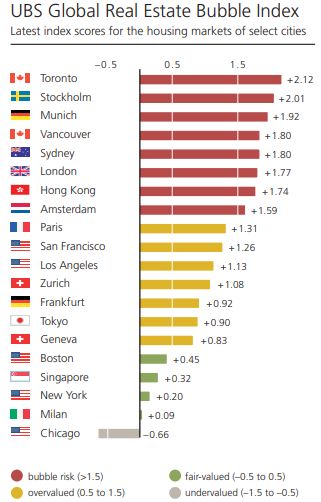
Risk Weight Assets in Ireland

Figure 1: Headline mortgage rates in Europe (%) - new business

Source: European Central Bank (ECB)

There is widespread recognition that the cross subsidisation of older tracker mortgages is one
explanation for why mortgage rates in Ireland have moved higher relative to Europe since the
banking crisis. Trackers, which are still just over 40% of all mortgages outstanding, help
explain why the average overall mortgage interest rate in Ireland is nearer 2.5% according to
ECB data, with the European average at around 2.1% - see Figure 2.

The purpose of this note is to focus on what is a very large but overlooked contributor as to
why the typical or average mortgage rate in Ireland is higher than elsewhere – the level of
bank capital that has to be held against a mortgage in Ireland and how changes here
have contributed to widening the gap. In particular, the note focuses on the elevated level of
Risk Weighted Assets (RWAs) required for Irish banks.

RWAs are a measure of risk and influence the capital that must be held on a mortgage, like
any other loan. For any mortgage in Ireland the risk deemed to be attached to that mortgage is
typically double or triple what it is for a similar bank elsewhere in Europe. This means that the
amount of capital required to be held against that mortgage in Ireland is also a multiple of what
would be required in, for example, the Netherlands or Germany. So to achieve the same return
on the loan, an Irish bank must charge a higher rate of interest, other things being equal.

As there is a very strong link between the risk/capital requirement associated with a mortgage
and the price that a bank charges for the loan, it follows that, if there was some convergence in

——
4
Risk Weight Assets in Ireland
RWAs and bank capital requirements between Ireland and the rest of Europe over time, the
likelihood of Irish rates moving closer to the European average would increase.
Figure 2: Headline Mortgage rates in Europe (%) – outstanding loans
Source: ECB
In summary, this note seeks to help inform the public understanding of Irish mortgage interest
rates by exploring the following:
What determines the mortgage interest rate
What are RWAs and how they are calculated
How Irish bank RWAs have evolved pre and post crisis
We link RWAs and capital with mortgage rates and profitability
The prospect of RWAs or “risk density” falling in the years ahead
How losses incurred during the crisis leave an imprint (via RWAs) for potential new
entrants in the mortgage market
——
5Risk Weight Assets in Ireland
Section 1
What determines the mortgage interest rate?
Outside of the mutual sector, banks are in business to make a profit for a number of reasons.
These include the need to generate capital to support growth in new lending, invest in
infrastructure (e.g. upgraded IT systems), and ultimately to provide a return for their
shareholders. Unlike other businesses (which for the most part are either unregulated or lightly
regulated) banks use depositors’ funds as their key input or raw material and regulations
heavily influence to whom and how much banks lend, and what they charge for their loans.
What a bank charges for a mortgage is determined by a number of factors including:
The cost of funding (mostly depositors money but in reality a mix of sources).
Operating costs.
The cost of risk (expected credit loses under accounting rules i.e. the bad debt charge).
The amount of shareholders’ or equity capital that must be held against the loan for
unexpected losses.
The return that shareholders seek on this capital that they provide
Clearly the level of competitive intensity in the market also plays a key role and as with any
product, the banks may not be able to charge what they would like for their loans. For
shareholders to support the bank they expect a minimum level of return – paid via dividends
and if it is a public company, a rising share price. It is this return on equity (ROE) capital metric
that ultimately influences the bank’s decision to set the price for its products, including its
mortgage rates, at a given level. Other measures of performance, such as net interest margin
(effectively the difference between the rate charged on the loan and the cost of funding –
analogous to gross profit), or return on assets (the net profit on the loan after all costs are
deducted, relative to the size of the loan) are closely watched metrics but they are not the
prime driver of bank behavior when setting pricing.
In a recent note on bank profitability, the ECB commented on the use of ROE:
“ROE is a useful gauge when discussing
banks’ viable level of profitability. First, the
indicator is widely used by practitioners as a
standard measure of bank profitability.
Second, analysts’ expectations about future
ROE developments are widely available,
——
6Risk Weight Assets in Ireland
facilitating a cross-check with market
perceptions. Third, ROE developments are
closely intertwined with the concept of cost
of equity (COE), with the latter serving as an
anchor for bank shareholders’ required
returns .” 4
Today shareholders expect banks to generate an ROE in excess of 9%-10%. Pre-crisis
expectations were nearer 15%-20% though this was possible as banks had to hold less capital
to do the same level of business. Notwithstanding lowered ROE expectations, very few banks
in Europe have met this threshold, including Irish banks, particularly if one ignores non-
recurring gains which have typically been bad debt write-backs i.e. a prior year loss provision
on a loan turns out to be less than what the bank estimated.
Figure 3 shows the ROE for banks by country that were regulated by the Single Supervisory
Mechanism (SSM)5 as at June 2018 (simple average shown is 6.7%). At the end of 2017 only a
third of significant institutions had an ROE greater than their cost of equity (COE) and this was
using an average estimate of 8% for the latter which the market might regard as on the low
side. The COE is in simple terms, the expected (minimum) return that investors require from a
business to compensate for the risk of holding its shares.
From the perspective of a safe, stable and resilient banking sector, this low ROE is a worrying
structural problem for Europe. This is particularly the case as we are currently in the benign
part of the economic cycle when banks are supposed to be in a position of strength yet their
low share price valuations today suggest the opposite. According to the SSM:
“The projected increase in profitability [by
banks themselves] takes this proposition to
more than half but, despite the improvement,
profitability remains an issue for many
directly supervised banks.”
A key reason for this has been sluggish economic growth in Europe but also the zero interest
rate policy pursued by the ECB, which is a double edged sword for banks6. In addition, banks
are now required to retain far more of their shareholders money for prudential capital purposes
4 ECB - Financial Stability Review November 2018.
5
The SSM comprises the ECB and national central banks, and is the mechanism by which significant banks in the Euro area
are supervised.
6
On the one hand zero rates support growth and keep bad debts low, but they also mean banks cannot make a spread on
their deposits which means margins are lower.
——
7Risk Weight Assets in Ireland in view of the damage seen during the last crisis (a larger denominator depresses the ROE % calculation). This is an especially acute issue in Ireland, which this note will discuss, by virtue of the extent of the recent Irish downturn and higher associated losses relative to other countries. Finally, in some markets in Europe there is a very high level of competition for historic reasons which drives down returns even lower than they otherwise would be. Figure 3: Return on equity ratios for Euro area banks Source: SSM In what follows, we focus on the capital dimension to this return generation challenge and how, if a loan has a higher relative risk weighting, a higher level of capital is required to be held against it. This puts upward pressure on the interest rate charged to consumers. —— 8
Risk Weight Assets in Ireland
Section 2
What are RWAs and how are they calculated?
To calculate the quantum of capital required to support a loan in money terms, one must take
the percentage level of capital required to be held and multiply this by the size of loan or asset.
For instance, if a bank has a loan of €100 and must maintain an equity capital ratio of 13% to
protect against losses, then the bank must hold €13 of capital. In other words the quantum of
capital is determined by two variables – the % capital required and the size of the risk being
incurred (the loan). A more detailed explanation is shown in Appendix 2.
Risk weighted assets (RWAs) are a measure of a bank’s assets (mostly loans) adjusted for
their perceived risks. Put simply two loans of €100 are not deemed the same under bank
capital rules if one is a mortgage (low risk as secured on the property) and one is say a credit
card loan (higher risk). When RWAs are being calculated for a bank, the original size of the
mortgage granted is effectively “shrunk” by applying a weighting typically between 10%-50%7 to
denote the fact that it is less risky and therefore needs a smaller quantum of capital versus the
riskier unsecured loan.
Clearly every new loan a bank grants is performing initially and typically it takes a couple of
years before the risk of default emerges in any meaningful way. Similarly the risk weighting for
a mortgage loan that is performing is typically lower than for one that has turned bad or is non-
performing. This is despite the fact that the bank may have had to make a provision on the
non-performing loan suggesting that no further capital (or balance sheet) cushion8 is required to
cover the unexpected loss.
Risk weightings for mortgage books are calculated in accordance with European rules (CRR
and CRD IV)9 using one of two broad approaches:
Standardised, where risk weights are prescribed by the regulator and in most cases
depend on loan-to-value ratios.
Internal ratings based (IRB), where the bank uses risk weights derived from credit risk
models developed by the bank itself. Their use must be approved by regulators.
Banks aspire to use IRB models as they are a mark of greater sophistication and usually they
produce a lower risk calculation than the standardised approach. The key parameters in
developing IRB models include:
7
With reference to the EBA Transparency Exercise, 2018.
8
When a loan turns non-performing and a bank decides to take a provision, one might expect the risk weight to go to zero
i.e. if the bank has provided through its profits for the possible loss then why should it still have to hold capital against the
loan? The answer is linked to the extent of the provision and some technical factors. In banks in countries like Greece and
Portugal risk weights on mortgage NPLs are very close to zero but in most countries including Ireland, NPL risk weights tend
to be much higher than for performing mortgages.
9
CRR – Capital Requirements Regulation; CRD IV – Capital Requirements Directive IV.
——
9Risk Weight Assets in Ireland
Probability of default (PD) – the likelihood that a customer will default on their obligation
within the next year, calibrated to the long run average of one year default rates.
Loss given default (LGD) – the estimated loss that will arise if a customer defaults,
calibrated to the higher of the long run average or the downturn. It is calculated after
taking account of credit risk mitigation (e.g. collateral) and includes the cost of recovery. In
Ireland this is impacted by the extended number of years it takes to repossess a property
e.g. 5+ years vs. say 1 year in the UK.
Exposure at default (EAD). An estimate of the amount expected to be owed by a customer
at the time of the customer’s default.
Around 90% of Irish residential mortgage exposures at the five Irish retail banks10 are treated
as IRB with the only notable exception being the EBS mortgage book (included in the AIB
consolidated balance sheet) which is treated by applying standardised risk weights.
This means that with the exception of EBS, the capital required to be held and by
extension, the profitability of all new mortgages written at these banks are influenced by
what happened in the past and in particular the spike in losses during the 2009-2013
period.
It is also important to point out that if an approved IRB model produces a worse outcome than
the standardised approach, from the point of view of RWAs and capital consumption (as is the
case in Ireland), a regulator will not normally permit the bank to revert to the more simplified
approach.
10
AIB, BOI, KBC, PTSB and Ulster Bank.
——
10Risk Weight Assets in Ireland Section 3 Irish bank RWAs – pre and post crisis Before we provide an analysis of how Irish banks compare on the question of mortgage risk weights, it is useful to give some historic context. Irish banks, as was the case for many banks around the world, held far too little capital against their loan books in the 2000s. In some cases their entire capital base was wiped out by accumulated impairment charges. By some measures, capital levels today for Irish banks are as much as four to five times what they were in 2007 before the financial crisis started, which makes the Irish banks far safer. From the point of view of mortgages, it is useful to chart how the banks’ and regulator’s view of their risk has evolved over time and we can also relate this trend to the cost of mortgage finance. In Figure 4.1 and Figure 4.2 we show the number of mortgage written by AIB (ex EBS) and BOI in Ireland in each year since 2003, that were still on the banks’ books at end 2017 (latest data available). We also show the impairment/non-performing exposure (NPE) rate for each “vintage” of mortgages written in each of those years. Mortgages written in 2006/2007 show the worst impairment rates for the banks ten years on from when they were first written – for AIB about 1 in 7 is still impaired ten years on. This is widely known and no surprise as it was the year the Irish economy peaked. In 2007 AIB published data shows that the bank had a risk weighted asset weighting on its mortgages of 15%11 i.e. for a mortgage of €100, the bank took a figure of €15 into account when calculating its capital requirements against which it probably applied equity capital of less than €1. Post 2011 one can see that, while the banks did not write nearly as much new business, the loss or impairment experience against these loans has been negligible. Cumulatively, between 2011-201512 the impairment rate for AIB was around 0.38% or 1 in 260. Obviously the economy was moving in an upward direction over the latter part of this period but the banks’ underwriting policies also radically changed from being very liberal pre crisis, to being more conservative13. This was a trend seen right across the banking sector in Ireland. So what happened the level of risk ascribed by the banks to these later mortgages that have so far had a pristine record? Based on AIB Pillar 3 disclosures shown in Table 1, the risk weighting for the performing loans (which would include these new loans) effectively doubled 11 In 2007 there was no real distinction between the risk weighting on performing and non-performing loans as there were no NPLs to all intents and purposes 12 We ignore 2016 and 2017 here as it typically takes up to two years for a loan to “season” and bad debts to emerge. 13 The Central Bank’s macro prudential guidelines introduced in 2015 “hard coded” the post crisis underwriting policies introduced by the banks. —— 11
Risk Weight Assets in Ireland

as the historic loss experience associated with the pre-crisis lending was fed into the bank’s
models. This trend was evident for the other Irish banks too and while there have been years
where a reduction has been recorded, this general upward move is continuing largely on the
back of regulatory pressure, even though Ireland is already a relative outlier.

Figure 4.1: AIB new mortgages written by year and impairment in 201714

      35,000                                                                                 16%
                                Mortgages issued #        2017 Impaired % for vintage

      30,000                                                                                 14%

                                                                                             12%
      25,000
                                                                                             10%
      20,000
                                                                                             8%
      15,000
                                                                                             6%
      10,000
                                                                                             4%

       5,000                                                                                 2%

            0                                                                                0%
                2003 2004 2005 2006 2007 2008 2009 2010 2011 2012 2013 2014 2015 2016 2017

Figure 4.2: BOI new mortgages written by year and NPE in 201715

      30,000                                                                                 16%
                                Mortgages issued #        2017 NPE % for vintage
                                                                                             14%
      25,000
                                                                                             12%
      20,000
                                                                                             10%

      15,000                                                                                 8%

                                                                                             6%
      10,000
                                                                                             4%
       5,000
                                                                                             2%

            0                                                                                0%
                2003 2004 2005 2006 2007 2008 2009 2010 2011 2012 2013 2014 2015 2016 2017

Source(s): Bank annual reports

14
     AIB annual report, 2017.
15
     BOI annual report, 2017.

——
12
Risk Weight Assets in Ireland
Table 1: AIB mortgage risk weights - performing only
2008 2013 2017
Performing risk weight 15% 33% 27%
Source: AIB Pillar 3 disclosures.
Clearly the risk attached to Irish mortgages in 2007 was far too low in view of what
subsequently happened. We estimate that the cumulative bad debt provisions taken by
AIB/EBS, Bank of Ireland and PTSB as a result of the crisis have exceeded 7%, when most
banks would have predicted that under a severe downturn losses might get to maybe 1%.
The CBI have acknowledged this. In their May 2015 report “Influences on standard variable
mortgage pricing in Ireland” they said:
“For a new loan issued today versus one in
2006 the risk weighting applied to a mortgage
is estimated to be about 50% higher than pre-
crisis” and that “the combined effect is that
the equity capital required to support a new
mortgage is estimated to be almost four
times higher than it was pre-crisis.”
As shown in Table 1, for some banks the move in risk weights even for performing loans has
been far more than 50% and when one considers the knock on aggregate rise in capital
requirements since the 2015 report was written, we estimate that the amount of equity
needed to support a mortgage today is probably more than 5x16 what it was pre-crisis –
so nearer €5 rather than €1 on a loan of €100.
Table 2 shows the range of risk weights that were in place for the main retail banks in Ireland
at June 2018 according to EBA data. The figures cover both performing and non-performing
loans and also the average for the entire books. The lowest figures are for Bank of Ireland with
the highest being Ulster Bank.
Whether these mortgage risk weights (and they are still trending higher) are set at the right
level will only be determined in time, but three points are worth making:
First, as we show in the next section, Irish mortgage risk weights are far higher than every
country in Western Europe, including other countries that also experienced a housing
downturn. This is largely a function of our loss experience which is far worse. Leaving
16
Another way to show this change at a corporate level is to take the EBS which was largely a stand-alone mortgage player
(89% of loans) - its accounts in 2007 show it had a ratio of equity reserves to assets of 3%. It is now part of the more
diversified AIB Group (53% of lending are mortgages) which in H1 2018 had a pure shareholders equity to asset ratio of
14%.
——
13Risk Weight Assets in Ireland
aside the atypical nature of the last downturn, it could be argued that Ireland as a small
open economy is more volatile than many of its European neighbours and hence the risk
attached to an Irish mortgage should also be higher as a consequence.
Second, this “imprint”17 of the last crisis will be felt in the loss history used by Irish banks to
estimate mortgage risk for many years to come. Other countries banks that have not had
such a loss experience do not reflect such a high risk in their RWA calculations (though
regulators in many cases try to compensate for it elsewhere18) even if in some cases,
much of the contemporaneous evidence such as underwriting standards, house price
valuations, household debt levels etc. suggest the risk of a material downturn is higher.
Third, the very fact that Ireland has gone through what might be deemed a 1 in 100 year
event very recently, reduces the likelihood of a similar recurrence in the near future. This
is because agents’ behaviour has changed, both individuals/firms and banks (e.g. more
appropriate underwriting standards), the regulatory environment has been transformed
with the introduction of the SSM, and new rules have been introduced, such as the
Central Bank’s macro prudential restrictions etc.
Table 2: Mortgage risk weights for the main Irish banks (H1 2018)
RWA - RWA - non
Bank RWA - total performing performing
AIB 30% 26% 73%
BOI 29% 24% 80%
KBC 35% 33% 40%
PTSB 42% 36% 59%
Ulster 61% 38% 181%
Average 38% 29% 93%
Source: EBA Transparency Exercise - 2018; PTSB disclosures19. Note: At end 2018, according
to its annual report, RBS (ex-Ulster) had a mortgage book of 10x Ulster Bank’s, yet had RWA’s
that were just 1.4x those of Ulster Bank.
17
This contrasts with some views expressed publicly that once a bank has provided adequately for the loan through its profit
and loss account that the legacy of crisis era underwriting decisions disappears.
18
The imposition of “floors” on RWA calculations, or higher “buffers” in the % capital required (see appendix 2) is one way
many regulators try to acknowledge that internal RWA models may be computing an uncomfortably low risk. Basel 4 itself
will materially increase RWAs for some European banks through the imposition of floors that limit the benefit of internal
models. These floors will start to come in on a phased basis from 2022.
19
PTSB was not included in the EBA Transparency Exercise. The bank’s 2017 Pillar 3 disclosures have been used as a
proxy.
——
14Risk Weight Assets in Ireland Finally, even allowing for a big reduction in the number of competitors in Ireland, given this fact pattern for capital requirements, it is no surprise that mortgage rates or spreads versus funding costs, were far closer to the ECB rate during the pre-crisis period compared with what is available today. —— 15
Risk Weight Assets in Ireland

Section 4
Linking RWA and capital with mortgage rates and
profitability
The results of the latest EBA Transparency Exercise were published on 14th December last. As
shown in Figure 5, the exercise revealed that the risk weight for Irish residential mortgages
generated from IRB models was 38%, 2.5x the European median of 15%, and the third highest
behind Hungary and Romania.

This outcome is not surprising given the still higher level of NPLs in Ireland and the
incorporation in the models of Ireland’s loss experience during the recent financial crisis.
Moreover, the requirement for a bank to maintain a “downturn” LGD in its models will mean this
loss experience will influence the RWAs of Irish banks for the foreseeable future.

Figure 5: Mortgage IRB RWAs by country – performing and non-performing

60% 56%

50%         48%

40%               38%
                        33%

30%                           25%
                                    22%
                                          20% 19%
20%                                                 17% 17%
                                                              15%15% 14%14%
                                                                              13% 12%12%12% 11%
                                                                                                  11% 11%10% 10%
10%
                                                                                                                   4%

  0%

 Source: European Banking Authority (EBA) Transparency Exercise 2018

In what follows we look at how sensitive mortgage pricing is to risk weights. Table 3 illustrates
a simple example of what mortgage profitability looks like for two identical banks charging the
same interest rate (2.5%, or around the average interest rate on the stock of all Irish
mortgages) but with different RWA densities. Bank A has a density of 38% for total mortgages
performing and non-performing) which is around the average for all Irish banks while Bank B
has a density of 15%, the median for European banks on the same basis. Bank A is generating
an ROE of 12% while Bank B is making an ROE of 31%.

——
16
Risk Weight Assets in Ireland The final column, “Bank B – price adjusted”, shows the level of reduction in the mortgage rate Bank B could process to generate an ROE that is the same as Bank A. This works out at around 40bps. For a mortgage of €250,000 and a term of 25 years, a 40bps reduction in the mortgage rate translates into a reduced annual payment of €600, or around €15,000 over the life of the loan, assuming the loan runs to full term. We also ran the same model using mortgage pricing of 3% (current pricing for new mortgages in Ireland) and RWA densities of 29% and 14% as a proxy for new business. The 29% and 14% levels are the densities for performing loans in Ireland and the median for European banks respectively. The price adjustment to equalise ROEs in this scenario is around 50bps which compares with the Irish/European gap of 86bps mentioned earlier. Tables 4.1 and 4.2 we show a sensitivity analysis of mortgage rates required to achieve a selected range of ROEs for different RWA densities. In Figure 6, we also chart mortgage interest rates, on an APRC basis, versus risk weight density which shows a high correlation between the two variables20. As we outlined with Ireland, because IRB risk weight models reflect banks’ historic experience, if a particular country has had a severe economic downturn in the recent past, the higher its risk weights will be, other things being equal. Conversely if a country has not experienced an economic downturn in the recent past, its risk weights will be lower. It is no coincidence therefore that there is a prima facie link between those countries with the lowest (least capital intensive) mortgage risk weights and those countries that are viewed by many observers as having housing markets that are the most stretched from a valuation and economic cycle point of view. As Table 5 shows there is a perfect alignment21 between those EU countries whose housing markets are most stretched in valuation terms according to UBS’s Global Real Estate Index and those countries with the lowest mortgage risk weights. Table 5 uses risk weights for performing mortgages only which is the data shown in Figure 7, though the country alignment is still very close if you use the aggregate book numbers from Figure 5 (only the order of France and the Netherlands would change). Such a link is known and as previously mentioned, some regulators attempt to take account of this in how they think about overall capital requirements. In fact the new Basel 4 regulations that will come in from 2022 on a phased basis, involve new rules that will limit, or “floor” the benefit from internal models. Hence some European banks with very low mortgage risk weights will see substantial increases as a result, possibly having an impact on their pricing decisions. 20R squared of 0.67. 21 The UBS wealth report gives data on two German cities including Munich. While Munich is deemed to be more overvalued than Frankfurt, we have shown only Frankfurt. —— 17
Risk Weight Assets in Ireland

Table 3: Simple model behind mortgage pricing

                                                                                         Bank B - price
                                              Bank A                Bank B                   adjusted

     Loan                                    250,000               250,000                    250,000

     RWA - %22                                   38%                  15%                       15%

     RWA - €                                    95,000              37,500                    37,500

     Capital required - %23                      13%                  13%                       13%

     Capital required - €                       12,350               4,875                     4,875

     Mortgage rate24                            2.5%                 2.5%                       2.1%

     Cost of funds25                            0.4%                 0.4%                       0.4%

     Net interest margin26 - %                  2.1%                 2.1%                       1.7%

     Net interest margin - €                    5,250                5,250                     4,200

     Fee income27                                250                  250                       250

                                                5,500                5,500                     4,450

     Costs28                                    3,300                3,300                     3,300

                                                2,200                2,200                     1,150

     Cost of risk29 - 20bps                      500                  500                       500

     Profit before tax                          1,700                1,700                      650

     Tax - at 12.5%                              213                  213                        81

     Profit after tax                           1,488                1,488                      569

     Return on equity (ROE)                      12%                  31%                       12%

22 EBA Transparency Exercise, 2018. Bank A – average for Ireland. Bank B – Euro area median.
23
   DOF estimate of normalised CET1 capital requirement. However, some bank may be required to hold capital ratios (permanently
or temporarily) in excess of 13%. For example, we would highlight AIB’s Fully Loaded CET1 ratio of 17.9% at end-Q3 2018.
24 c. the current average interest rate on the stock of all Irish mortgages.
25 DOF estimate; bank financial statements.
26   Net interest margin is akin to gross profit or the bank’s average lending rate minus its funding costs
27   DOF estimate – 10bps to cover cross sell of house/mortgage linked insurance products.
28   DOF estimates – cost/income ratio of 60%; bank financial statements.
29   This is the bank’s estimate of bad debts

——
18
Risk Weight Assets in Ireland
Table 4.1: Mortgage rate to meet selected ROE targets at different RWA densities
< -------------------- RWA density ------------------ >
ROE 10% 15% 20% 30% 38% 40% 50%
10.0% 1.97% 2.05% 2.13% 2.25% 2.40% 2.40% 2.58%
12.0% 2.00% 2.09% 2.18% 2.34% 2.50% 2.52% 2.68%
15.0% 2.05% 2.15% 2.26% 2.47% 2.64% 2.70% 2.90%
17.5% 2.08% 2.20% 2.33% 2.59% 2.80% 2.85% 3.11%
20.0% 2.11% 2.26% 2.40% 2.69% 2.93% 2.98% 3.27%
Table 4.2: Mortgage rate delta to 2.50% with reference to Table 4.1
< -------------------- RWA density ------------------ >
ROE 10% 15% 20% 30% 38% 40% 50%
10.0% (0.53%) (0.45%) (0.37%) (0.25%) (0.10% (0.10%) 0.08%
12.0% (0.50%) (0.41%) (0.32%) (0.16%) 0.00% 0.02% 0.18%
15.0% (0.45%) (0.35%) (0.24%) (0.03%) 0.14% 0.20% 0.40%
17.5% (0.42%) (0.30%) (0.17%) 0.09% 0.30% 0.35% 0.61%
20.0% (0.39%) (0.24%) (0.10%) 0.19% 0.43% 0.48% 0.77%
Table 5: Mortgage RWA models and their link to the property cycle
Lowest risk UBS Bubble index UBS Bubble index
weights 2017 2018
1 Sweden Sweden (Stockholm) Netherlands (Amsterdam)
2 UK UK (London) UK (London)
3 Netherlands Netherlands Sweden (Stockholm)
(Amsterdam)
4 France France (Paris) France (Paris)
5 Germany Germany (Frankfurt) Germany (Frankfurt)
6 Italy Italy (Milan) Italy (Milan)
Source: EBA data and UBS Global Real Estate Bubble Index. Cities in bold are deemed by UBS to
be within the bubble risk zone. Note the country sequencing aligns for 2017 as by 2018 Swedish
and UK house price had already started falling.
——
19Risk Weight Assets in Ireland
Figure 6: Mortgage interest rates (APRC) versus RWA density
40%
Ireland
35% R² = 0.6711
Greece
30%
RWA density - all mortgages
25%
20% Italy
Portugal
15%
Germany Austria Denmark
France
Netherland
10%
UK Spain
Belgium
5%
Sweden
0%
1.00% 1.50% 2.00% 2.50% 3.00% 3.50% 4.00%
APRC
Source: EBA; Goodbody
——
20Risk Weight Assets in Ireland
Section 5
Will RWAs or risk density fall in the years ahead?
As Irish banks have continued to reduce their NPL ratios, either through restructuring or sales,
there has been a corresponding downward influence on the aggregate mortgage risk weights.
As Figure 7 shows, just looking at performing risk weights, would see Ireland at a lower 29%
with the core European countries clustered between 10%-15% with a median of 14%.
So if mortgage NPLs in Ireland were reduced to zero over time, other things being equal, the
risk weight on the sector’s mortgages would migrate to 29%. Another downward influence on
the risk weights in the years ahead should be the Central Bank’s mortgage restrictions around
income multiples and LTVs. These new rules have fed into the banks’ underwriting practices
and should reduce losses as time goes on.
To date, these positive influences have been offset by other actions which have moved risk
weights in the opposite higher direction, such as changes to the parameters used by the banks
in their IRB models. Such actions, have in large part been at the direction of the SSM with the
recent Targeted Review of Internal Models (TRIM) exercise being a case in point.30
TRIM is a Euro area wide exercise designed to analyse and explain large variations in the
outputs of internal risk models across different banks. It started with the mortgage books, and
the purpose of the exercise was to reduce inconsistencies and unwarranted variability in
modelling outcomes across banks. Ireland went into the process an outlier on mortgage risk
weights and the reason for this was the obvious influence the last economic downturn was
having on the calculations (with the exact opposite effect evident in other countries).
As a result, there had been an expectation amongst market observers that the TRIM exercise
might narrow the gap between Ireland and other countries in Europe. While many banks with
low mortgage RWAs have and still are revealing increases, as yet there is little evidence that
any narrowing of the gap has occurred. Banks towards the top end like PTSB for example,
expect to see their mortgage risk weights move above 50% when the full impact of TRIM has
been implemented. We estimate that this will lead to the bank’s equity capital requirements
rising by anything between a quarter and one third since 2017.
Bank of Ireland has also disclosed that the impact of TRIM will cost 70bps of CET1 and as part
of its recent full year 2018 disclosures said that TRIM contributed to a rise in its average
mortgage risk weight in Ireland from 29% in June 2018 to 34% by year end. Although AIB has
yet to disclose the impact of the exercise, any increase in risk weights for the bank will again
further increase the Irish average when the 2019 EBA data is published.
30
The impact of TRIM is ongoing and was not reflected for banks in the EBA Transparency Exercise, 2018.
——
21Risk Weight Assets in Ireland
Figure 7: Mortgage IRB risk weights by country – performing book only
70%
61%
60%
50% 46% 45%
40%
29%
30%
22% 20%
19% 18% 17%17%
20% 14% 14%14% 13% 12%
12%12% 11%11% 10%10%
9% 8%
10% 4%
0%
Source: EBA Transparency Exercise 2018
——
22Risk Weight Assets in Ireland Section 6 Impact of new entrants In the past decade, exits, amalgamations and insolvencies has led to the departure of a significant number of lenders: Figure 8: Mortgage lenders in Ireland* *Excludes small/niche lenders while EBS has been merged with AIB With the current number of main stream lenders reduced to five banks, and the economy growing strongly, the Irish mortgage market would normally be an attractive proposition for new entrants. An obvious question in this context is could a new entrant, benefitting from lower capital requirements, be able to price mortgages materially below the current market whilst still earning a return on equity at least equal to that of the current lenders? We can think of these entities as falling into one of two camps – deposit funded banks who will be subject to RWA and associated capital requirements, and retail credit firms (non-banks) for whom the concept of RWAs does not apply. Banks Any new bank entrant will be required to hold capital at a level which will be determined by its RWAs which can be calculated either by the bank’s own IRB models or by applying standardised risk weights. If a bank chooses the IRB option, it will be required to calculate risk weights based on its own estimates of risk parameters using data which covers a number of years. In addition, to receive the approval of the regulator to use its own models, a bank must be able to demonstrate that the models have been imbedded in the business for some time and that they are performing as designed i.e. credit approval and risk management. This requirement is generally referred to as the Use Test. —— 23
Risk Weight Assets in Ireland

Our base case expectation in this regard is that a new entrant will have to wait at least five
years before it receives the necessary approval to use IRB models. In any event, we
understand that a key driver for IRB RWAs is the historic credit performance of Irish
mortgages. Accordingly, we would not expect a new entrant to benefit from lower IRB RWA
density relative to the incumbents even after the minimum five year period.

In the absence of having approval to use its IRB models for regulatory capital purposes, a bank
will be required to apply standardised risk weights to calculate the RWA of its mortgage
portfolio. The average standardised risk weight for an owner occupier mortgage book might be
around 35%-40% depending on its loan to value composition. Although this would be below the
IRB risk weights of the Irish banks (after the full impact of TRIM is reflected), the difference
would be relatively small with no significant benefit accruing to a bank using the standardised
risk weight.

Retail credit firms
As RWAs are a concept of banking legislation, they do not apply to retail credit firms who fund
their loans without using deposits. Although such firms would need to hold capital to support
their mortgage business, the choice of the appropriate level would not be burdened by the last
crisis to the same extent as the Irish banks.

Should a retail credit firm choose to hold a lower level of capital, it is easy to see how they
could charge a lower rate while at the same time generating a return on equity at least equal to
that of the incumbent banks who are largely funded by deposits.

Although they are regulated entities, as is the case with banks, the CBI does not have explicit
powers to influence pricing decisions of retail credit firms. Rather in regulating such firms, it
would focus on, amongst others, whether market behaviour was consistent with approved risks
strategies, could damage Irish consumers or bring the Irish financial sector into disrepute.

While not strictly falling into either of the two categories described above, for completeness we
highlight that Credit Unions are increasing their presence in the Irish mortgage market,
although from a very low base. Gross outstanding mortgages in the credit union sector was
€171m as of September 2018, a 17% increase year on year. New revised lending regulations
for Credit Unions – proposed by the Central Bank and currently under public consultation –
could significantly increase the capacity of larger and more capable credit unions to engage in
mortgage lending. Capital for credit unions is calculated on total assets, with no allowance for
risk weighting allowed by the regulator.

——
24
Risk Weight Assets in Ireland

Section 7
Conclusions
Irish mortgage rates are a product of many variables and could be somewhat lower if there
were more competitors active in the market. This is because the evidence suggests that the
greater the number of players in a market the greater the competitive rivalry. However as the
CCPC have said “the market we have is the legacy of fifteen years of boom and bust” and
while it has many attractive features, including better than average growth prospects linked to
Irish demographic and economic trends, it also has some characteristics that make it
unattractive.

For instance these include the delay and cost of collateral realisation allied with uncertainty in
relation to banks’ ability to reduce NPLs through selling loans. In recent years Irish banks have
had to resort to loan sales in order to meet regulatory requirements and any restrictions placed
on their ability to do this will create further cost and alternative actions that will be felt by
customers. This could be through higher mortgage pricing and/or reduced choice and capital
allocated to mortgage products. This is not just a one-off historic issue as EU rules due to
come into force in relation to impairment provisions on new NPLs, will also make it less
attractive for banks across Europe to hold and work out mortgage NPLs in the years ahead.

This note explored one aspect of this legacy – the Irish banks’ record breaking loss experience
– and how this continues to leave an imprint through higher capital requirements and pricing
that has become increasingly visible as regulatory demands have increased.

The significant progress Irish banks have made in dealing with NPLs has and will continue to
help reduce RWAs. However, even if NPLs were eliminated today, Irish risk weights on new
mortgage business would remain a multiple of what they are in many countries in Europe
requiring higher mortgage rates to achieve the same returns.

A well-regulated, well capitalised banking system that has enough profitability to support the
economy is in Ireland’s interest. This is self-evident given our recent history and our small open
economy which is more volatile than most. It is also why Ireland is very supportive of the
regulatory changes that have taken place across the EU and proposals for a true Banking
Union. However, all safety nets or insurance come with a cost and the nature and extent of this
cost and how it is paid is not well understood. One element of this cost is what banks charge
for their products, including mortgages.

As a result the all in cost (profit and loss as well as balance sheet) for a deposit funded retail
bank to offer a mortgage in Ireland is higher than the European average and if it wishes to
generate the same return it must charge a higher price.

——
25
Risk Weight Assets in Ireland

New entrants considering whether to enter the Irish mortgage market cannot entirely escape
the Irish loss experience when it comes to pricing decisions – at least if they are traditional
deposit funded banks. This means that non-banks or retail credit firms31 that are not subject to
the same bank capital rules, have a valuable competitive advantage when it comes to pricing,
and could represent a real and under-appreciated competitive threat to the incumbents in the
years ahead.

Clearly such an advantage would be weighed up with all of the other characteristics of the Irish
market in determining whether to compete, not all of which are positive in nature.

31
  Clearly such new entrants, be they technology led or otherwise, have many disadvantages relative to incumbent banks to
overcome in the areas of customer familiarity, distribution, underwriting skills etc.

——
26
Risk Weight Assets in Ireland

Appendix 1: Headline versus APRC new mortgage rates by country

                                Headline mortgage
 Country                               rate         APRC

 Ireland                             3.04%          2.97%
 Austria                             1.79%          2.26%
 Belgium                             1.86%          2.04%
 Denmark                             1.60%          2.49%
 France                              1.50%          2.15%
 Germany                             1.88%          1.94%
 Greece                              3.15%          3.52%
 Italy                               1.90%          2.27%
 Netherland                          2.43%          2.44%
 Norway                              1.60%            n/a
 Portugal                            1.36%          1.94%
 Spain                               2.01%          2.28%
 Sweden                              1.47%          1.47%
 UK                                  2.09%          2.17%
 Europe average                      1.79%          2.11%

Source: ECB.

——
27
Risk Weight Assets in Ireland
Appendix 2: The equity capital equation
The higher RWAs are, the higher equity
must be to achieve the same % figure
Note: SREP stands for supervisory review evaluation process and culminates in the bank being given a minimum capital requirement
to maintain by the SSM. Local buffers are decided by national competent authorities. Banks would normally maintain a buffer level of
capital above whatever the regulator indicates, though this is ignored here for simplicity.
——
28Risk Weight Assets in Ireland Appendix 3: UBS Global Real Estate Bubble Index 2018 data 2017 data —— 29
You can also read