Operational Briefing Presentation to Investors and Analysts 9 February 2021 - Macquarie Group

Page created by Randy Porter
 
CONTINUE READING
Operational Briefing Presentation to Investors and Analysts 9 February 2021 - Macquarie Group
Operational
Briefing
Presentation to Investors
and Analysts
9 February 2021
Operational Briefing Presentation to Investors and Analysts 9 February 2021 - Macquarie Group
Update since the
interim result
Shemara Wikramanayake
Managing Director and
Chief Executive Officer
Operational Briefing Presentation to Investors and Analysts 9 February 2021 - Macquarie Group
MACQUARIE I OPERATIONAL BRIEFING 2021 I MACQUARIE.COM

     UPDATE SINCE THE INTERIM RESULT                                                 MACQUARIE ASSET MANAGEMENT                                                MACQUARIE CAPITAL                                  CORPORATE OPERATIONS GROUP                                             APPENDIX

About Macquarie
                                                                                                                                                         ~70%                                                                                                                      ~30%
Annuity-style activities                                                                                                                                                                  Markets-facing activities
NET PROFIT CONTRIBUTION                                                                                                                                                                   NET PROFIT CONTRIBUTION
              Macquarie Asset                                                   Banking and Financial                                                 Commodities and Global Markets                                                                     Macquarie Capital
             Management (MAM)                                                      Services (BFS)                                                                (CGM)                                                                                      (MacCap)
●    Top 501 global specialist asset manager with                     ●    Macquarie’s retail banking and financial                         Diverse platform covering more than 30 market segments, with more                             Global capability in:
     $A550.9b2 of assets under management,                                 services business with total BFS deposits3 of                    than 200 products                                                                             ●     Advisory and capital raising services, investing
     diversified across regions, products, asset                           $A76.3b2, loan and lease portfolio4 of $A84.5b2                                                                                                                      alongside partners and clients across the capital
     classes and investor types                                            and funds on platform5 of $A97.3b2                               ●    Delivers a range of tailored                 ●    Integrated, end-to-end
                                                                                                                                                 specialised asset finance                         offering across global                       structure, providing clients with specialist
●    Provides investment solutions to clients across ●                     Provides a diverse range of personal banking,                         solutions across a variety of                     markets including equities,                  expertise, advice and flexible capital solutions
     a range of capabilities, including infrastructure &                   wealth management, business banking and                               industries and asset classes                      fixed income, foreign                        across a range of sectors
     renewables, real estate, agriculture,                                 vehicle finance6 products and services to retail                                                                        exchange, commodities                  ●     Development and construction of infrastructure
     transportation finance, private credit, equities,                     clients, advisers, brokers and business clients                  ●    Commodity market lending
                                                                                                                                                 and financing provides                            and technology, media                        and energy projects and, in relation to
     fixed income and multi-asset solutions                                                                                                                                                        and telecoms                                 renewable energy projects, the supply of green
                                                                                                                                                 clients with loans and
                                                                                                                                                 working capital finance                      ●    Provides clients with                        energy solutions to corporate clients
                                                                                                                                                 across a range of commodity                       risk and capital solutions             ●     Equities brokerage, providing clients with
                                                                                                                                                 sectors including metals,                         across physical and                          access to equity research, sales, execution
                                                                                                                                                 energy and agriculture                            financial markets                            capabilities and corporate access

1H21 Net Profit Contribution
MAM                                                                                                  ~47%                  BFS             ~14%                  CGM           ~9%                CGM                                                  ~38%                 MacCap (~8%)

          Risk Management Group                                                          Legal and Governance                                                 Financial Management Group                                                    Corporate Operations Group
An independent and centralised function responsible                          Provides a full range of legal and corporate governance                     Provides financial, tax, treasury, funding and capital,                      Provides technology, market operations, HR,
for objective review and challenge, oversight,                               services, including strategic legal and governance                          corporate affairs and advisory services to all areas of                      workplace, strategy, operational risk management,
monitoring and reporting in relation to Macquarie’s                          advice and risk assessment.                                                 Macquarie.                                                                   data and transformation, resilience and global security
material risks.                                                                                                                                                                                                                       services plus the Macquarie Group Foundation.

Net profit contribution is management accounting profit before unallocated corporate costs, profit share and income tax. All numbers in this presentation have been reclassified to reflect the transfer of Cash Equities from CGM to Macquarie Capital effective 1 Jun 20. 1. P&I Largest Money Managers
19 (published Jun 20). 2. As at 31 Dec 20. 3. BFS deposits exclude corporate/wholesale deposits. 4. The loan and lease portfolio comprises home loans, loans to businesses, vehicle finance and credit cards. 5. Funds on platform includes Macquarie Wrap and Vision. 6. Includes general plant &
equipment.                                                                                                                                                                                                                                                                                                  6
Operational Briefing Presentation to Investors and Analysts 9 February 2021 - Macquarie Group
MACQUARIE I OPERATIONAL BRIEFING 2021 I MACQUARIE.COM

     UPDATE SINCE THE INTERIM RESULT                                               MACQUARIE ASSET MANAGEMENT                                      MACQUARIE CAPITAL                        CORPORATE OPERATIONS GROUP                             APPENDIX

Macquarie’s response to COVID-19
                         Employees                                                                     Clients                                           Portfolio Companies                                                Community

●    Gradual return to office commenced in 82% of                         ●    Enhanced client support and lending relief            ●           Ongoing work with MIRA and Macquarie              ●        $A20m allocation to Macquarie Group
     locations where safe to do so and in numbers                              maintained since Mar. Most clients have now                       Capital portfolio companies including projects             Foundation to help combat COVID-19. To date,
     that allow for social distancing                                          resumed normal payments                                           under construction to ensure business continuity,          $A17.7m has been allocated to 34 organisations
●    Systems and processes have been resilient                            ●    Working closely with clients in the most                          financial resilience and employee wellbeing                around the world:
     to ongoing remote working, reflecting long-term                           challenged sectors on their long-term resilience ●                Maintained essential community services and                – $A7.2m to 24 non-profits focused on direct
     investment in technology and flexible                                     and response to disruption                                        connected best practice across assets,                        relief efforts providing critical food, medical
     working culture                                                      ●    Actively supporting clients in all regions in raising             industries and regions                                        support, humanitarian relief kits and
●    Investment in leadership capability, technology                           essential finance and capital                         ●           Capacity upgrades to MIRA-managed digital                     information to vulnerable groups affected
     and the workplace continues as we respond to                                                                                                infrastructure assets have left them able to                  by COVID-19
     the evolving culture of work and promote                                                                                                    handle significant activity increases resulting            – $A8.5m to eight organisations supporting
     greater flexibility                                                                                                                         from shift to virtual engagement                              workers and businesses in restarting
                                                                                                                                                                                                               economic activity
                                                                                                                                                                                                            – $A2.0m to public health and
                                                                                                                                                                                                               clinical research

We have been agile in adapting our approach to a rapidly-                 We recognise the structural shift COVID-19 has prompted for        Our longstanding approach to crisis planning has           We balanced our support for urgent direct relief needs,
changing environment in each location, capturing regular                  some clients, giving rise to near and longer-term changes in       underpinned the ability of assets to withstand economic    research and investment while also being flexible in our
feedback from staff to address immediate needs and test and               our approach to meeting their needs and ensuring their             impacts and maintain and extend essential services,        support for existing community partners that have had to
learn for longer-term shifts and opportunities.                           ongoing access to opportunities.                                   while also identifying new ways to respond to disruption   quickly respond to change and the increased demand
                                                                                                                                             on behalf of the community.                                on their services.

                                    Staff engagement1                                    Clients accessing assistance2                               Daily users of essential services                                              COVID-19 donation

                                                   +5%                                                      peak
                                                                                                                     ~13%                                                     ~100m                                                    $A20m
             Staff working remotely at peak                                                                                                              Portfolio company employees                                                                 Allocated
                                                                                                                  now ~1%
                                             >98%                                                                                                                                ~130k                                          $A17.7m
1. Annual staff survey Dec 20 vs. Dec 19. 2. BFS, by loan balance – peak as at 30 Jun 20, now as at 31 Dec 20.                                                                                                                                                     7
Operational Briefing Presentation to Investors and Analysts 9 February 2021 - Macquarie Group
MACQUARIE I OPERATIONAL BRIEFING 2021 I MACQUARIE.COM

 UPDATE SINCE THE INTERIM RESULT        MACQUARIE ASSET MANAGEMENT                                                 MACQUARIE CAPITAL                                   CORPORATE OPERATIONS GROUP                                  APPENDIX

3Q21                                 ● Improved trading conditions in 3Q21 across the Group
                                     ● Macquarie's annuity-style businesses' (MAM and BFS) combined 3Q21 net profit
                                       contribution1 up on the prior corresponding period (pcp) (3Q20)
Overview                                   – FY21 year to date (YTD)2 net profit contribution broadly in line with FY20 YTD2
                                             mainly due to: base and performance fees in MAM broadly in line; partially offset
                                             by BFS margin pressure, increased credit impairment charges, and higher costs
                                             to support clients as a result of COVID-19, albeit with continued volume growth
                                     ● Macquarie's markets-facing businesses' (CGM and MacCap) combined 3Q21 net
                                       profit contribution1 which included the partial sale of Macquarie’s interest in Nuix
                                       significantly up on pcp
                                           – FY21 YTD2 net profit contribution broadly in line with FY20 YTD2 primarily due to:
                                             stronger activity across the majority of businesses in CGM, inclusive of income
                                             recognition timing associated with transportation and storage agreements;
                                             partially offset by lower fee revenue and principal income in Macquarie Capital,
                                             albeit with a reduction in expenses

                                   1. Net profit contribution is management accounting profit before unallocated corporate costs, profit share and income tax. 2. YTD refers to the nine months to 31 Dec for the relevant year.              8
Operational Briefing Presentation to Investors and Analysts 9 February 2021 - Macquarie Group
MACQUARIE I OPERATIONAL BRIEFING 2021 I MACQUARIE.COM

 UPDATE SINCE THE INTERIM RESULT         MACQUARIE ASSET MANAGEMENT                                                MACQUARIE CAPITAL                                 CORPORATE OPERATIONS GROUP                                              APPENDIX

3Q21
                                     Macquarie Asset Management                                                                                 Banking and Financial Services

                                     ~47%                                                                                                       ~14%
                                     1H21 contribution1                                                                                         1H21 contribution1

Overview                             ●
                                     ●
                                          AUM of $A550.9b at Dec 20, down 1% on Sep 20
                                          MIM: $A360.6b in AUM, up 3% on Sep 20, primarily driven by
                                          market movements and positive net flows, partially offset by
                                                                                                                                                ●
                                                                                                                                                ●
                                                                                                                                                ●
                                                                                                                                                     Total BFS deposits3 of $A76.3b at Dec 20, up 3% on Sep 20
                                                                                                                                                     Home loan portfolio of $A62.6b at Dec 20, up 9% on Sep 20
                                                                                                                                                     Funds on platform4 of $A97.3b at Dec 20, up 9% on Sep 20
                                          foreign exchange                                                                                      ●    Business banking loan portfolio of $A9.4b at Dec 20, up 5% on Sep 20
                                     ●    MIRA: $A137.1b in EUM2, down 2% on Sep 20, driven by equity                                           ●    Vehicle finance portfolio5 of $A12.0b at Dec 20, down 3% on Sep 20

Annuity-style                             returned and foreign exchange, partially offset by new equity raised
                                          –  3Q21: $A6.6b in new equity raised, $A3.4b of equity invested
                                                                                                                                                ●    1.3% of BFS clients, by loan balance, accessing assistance at 31 Dec 20

businesses
                                             and $A6.6b of asset divestments. $A25.7b of equity to deploy at
                                             Dec 20
                                     ●    MIM entered into an agreement to acquire Waddell & Reed
                                          Financial, Inc. On closing, MAM will retain Waddell & Reed’s asset
                                          management business and sell its wealth management platform to
                                          LPL Financial (LPL), resulting in an increase of ~$US68b in AUM
                                     ●    Macquarie Infrastructure Partners (MIP) II reached financial closure
                                          on the divestment of its final asset, Elizabeth River Tunnels
                                     ●    Macquarie Infrastructure Corporation (MIC) sold International-Matex
                                          Tank Terminals resulting in the MIC board of directors authorising a
                                          special dividend of $US11.00 per share
                                     ●    Formal integration of GLL successfully completed in the quarter
                                     ●    Macquarie AirFinance (50% owned and managed by MQG) –
                                          continues to face headwinds and to work with airlines to provide
                                          relief in response to their revenue challenges

                                   1. Based on 1H21 net profit contribution from operating groups as reported on 6 Nov 20. Net profit contribution is management accounting profit before unallocated corporate costs, profit share and income tax. 2. MIRA’s total
                                   EUM includes market capitalisation at measurement date for listed funds, the sum of original committed capital less capital subsequently returned for unlisted funds and mandates as well as invested capital for managed
                                   businesses. 3. BFS deposits exclude corporate/wholesale deposits. 4. Funds on platform include Macquarie Wrap and Vision. 5. Includes general plant and equipment.                                                               9
Operational Briefing Presentation to Investors and Analysts 9 February 2021 - Macquarie Group
MACQUARIE I OPERATIONAL BRIEFING 2021 I MACQUARIE.COM

 UPDATE SINCE THE INTERIM RESULT        MACQUARIE ASSET MANAGEMENT                                                MACQUARIE CAPITAL                                  CORPORATE OPERATIONS GROUP                                             APPENDIX

3Q21
                                     Commodities and Global Markets                                                                             Macquarie Capital

                                     ~47%                                                                                                       (~8%)
                                     1H21 contribution1                                                                                         1H21 contribution1

Overview                             ● Strong client hedging and trading activity across the
                                       commodities platform driven by market dislocations and
                                       increased volatility, particularly from the oil, gas, and precious
                                                                                                                                                ● 100 transactions valued at $A58.4b4 completed globally, down on pcp
                                                                                                                                                ● Fee revenue down on pcp across advisory and DCM, marginally offset by
                                                                                                                                                  ECM. Investment-related income up significantly on pcp
                                       metals markets businesses
                                                                                                                                                ● Continued focus on green energy:
                                     ● Continued client activity in foreign exchange, credit and
                                                                                                                                                  – Over 250 projects under development and construction, with a pipeline
                                       interest rates

Markets-facing
                                                                                                                                                       of more than 30GW5
                                     ● Increased client activity in Equity Derivatives and Trading,
                                                                                                                                                  – Investment across the green energy project lifecycle with 7 projects
                                       particularly in Asia and Europe
                                                                                                                                                       reaching FID, with a further 7 projects becoming operational6

businesses
                                     ● Consistent performance from asset finance portfolio principally
                                                                                                                                                  – Introduced investors into over 1.1GW projects as they reached
                                       from the UK energy markets business. Established joint venture
                                                                                                                                                       FID or COD6
                                       with Mitsubishi UFJ to grow Australian Technology, Media and
                                       Telecoms business                                                                                        ● No. 1 in ANZ for ECM7, IPOs8 and M&A9 in CY20
                                     ● Maintained ranking as No. 2 physical gas marketer in                                                     ● Partial realisation of our interest in Nuix through an ASX IPO valuing the
                                       North America2                                                                                             business at $A1.8b. Macquarie acted as Joint Lead Manager, Bookrunner
                                                                                                                                                  and Underwriter to the IPO, the largest ASX IPO in CY2010
                                     ● No.1 Futures Broker on the ASX3
                                                                                                                                                ● Acted as exclusive sell-side adviser on the sale of Exemplar Health Care,
                                                                                                                                                  a UK provider of specialty care for adults with high acuity health needs, to
                                                                                                                                                  an Ares Management Corporation managed fund
                                                                                                                                                ● Principal Finance committed over $A3.4b FY21 YTD through focused
                                                                                                                                                  investing in credit markets and providing bespoke financing solutions to
                                                                                                                                                  sponsor portfolio companies and corporate clients across a range of
                                                                                                                                                  industry sectors
                                                                                                                                                ● First acquisition in South America, a majority interest in the 206km
                                                                                                                                                  Briceño-Tunja-Sogamoso operating toll road, one of Colombia’s most
                                                                                                                                                  critical road infrastructure assets, serving ~17m users per year
                                                                                                                                                ● Macquarie Electronic Execution achieved top Greenwich Asia Equities
                                                                                                                                                  rankings with long only investors in 202011
                                   1. Based on 1H21 net profit contribution from operating groups as reported on 6 Nov 20. Net profit contribution is management accounting profit before unallocated corporate costs, profit share and income tax. 2. S&P
                                   Global Platts 3Q 2020. 3. ASX Futures 24 (SFE) Monthly Report Dec 20. 4. Source: Dealogic and IJGlobal for Macquarie Group completed M&A, investments, ECM and DCM transactions converted as at the relevant
                                   report date. Deal values reflect the full transaction value and not an attributed value. 5. At 31 Dec 20. 6. 1 Apr 20 – 31 Dec 20. 7. Dealogic (ex-blocks & by value). 8. Dealogic (by value). 9. Dealogic (completed by
                                   value). 10. Dealogic (ASX IPOs by value). 11. ex-Japan and Australia.                                                                                                                                                      10
Operational Briefing Presentation to Investors and Analysts 9 February 2021 - Macquarie Group
MACQUARIE I OPERATIONAL BRIEFING 2021 I MACQUARIE.COM

     UPDATE SINCE THE INTERIM RESULT                           MACQUARIE ASSET MANAGEMENT                           MACQUARIE CAPITAL           CORPORATE OPERATIONS GROUP                     APPENDIX

Macquarie's global footprint

   Total staff1
                                               Americas                                                         EMEA                            Asia                       Australia            2

                                               Staff                                                            Staff                           Staff                      Staff
   16,429                                      2,700                                                            2,441                           4,117                      7,171
                                               CANADA          USA            Orlando                            EUROPE          Solihull       ASIA           Manila      AUSTRALIA    Newcastle
                                               Calgary         Boise          Philadelphia                       Amsterdam       Vienna         Bangkok        Mumbai      Adelaide     Parramatta
                                               Montreal        Boston         San Diego                          Braintree       Watford        Beijing        Seoul       Brisbane     Perth
                                               Toronto         Chicago        San Francisco                      Coventry        Zurich         Gurugram       Shanghai    Canberra     Sydney

   56%
                                               Vancouver       Dallas         San Jose                           Dublin                         Hong Kong      Singapore   Gold Coast
                                                               Houston        Seattle                            Edinburgh       MIDDLE EAST    Hsin-Chu       Taipei      Manly        NEW ZEALAND
                                               LATIN AMERICA   Jacksonville   Walnut Creek                       Frankfurt       Dubai          Jakarta        Tokyo       Melbourne    Auckland
                                               Mexico City     Los Angeles                                       Geneva                         Kuala Lumpur
   International staff                         Sao Paulo
                                               Santiago
                                                               Minneapolis
                                                               Nashville
                                                                                                                 Limerick
                                                                                                                 London
                                                                                                                                 SOUTH AFRICA
                                                                                                                                 Cape Town
                                                               New York                                          Luxembourg      Johannesburg
                                                                                                                 Madrid
                                                                                                                 Munich
                                                                                                                 Paris
                                                                                                                 Reading

1. As at 31 Dec 20. 2. Includes New Zealand.                                                                                                                                                              11
Operational Briefing Presentation to Investors and Analysts 9 February 2021 - Macquarie Group
MACQUARIE I OPERATIONAL BRIEFING 2021 I MACQUARIE.COM

     UPDATE SINCE THE INTERIM RESULT                                                 MACQUARIE ASSET MANAGEMENT                                                 MACQUARIE CAPITAL                                  CORPORATE OPERATIONS GROUP                                             APPENDIX

Funded balance sheet remains strong
Term liabilities exceed term assets

30 Sep 20                                                                                                        31 Dec 20
          $Ab                                                                                                              $Ab
  180                                                                                                               180
                                                                                                                                                                                                                                    TOTAL CUSTOMER
                                                                                                                                   ST wholesale issued paper 8%                                                                     DEPOSITS
  160             ST wholesale issued paper 4%                                                                      160

                                                                                                                                                                                                                                    $A79.0b                                                     ▲2%
                                                                                                                                      Other debt maturing in the
                    Other debt maturing in the                                                                                          next 12 months ¹ 7%
                      next 12 months ¹ 7%                                                                                                                                                Cash, liquids and
  140                                                                                                               140                                                           self-securitised assets ⁵ 35%
                                                                        Cash, liquids and                                                                                                                                                                                            FROM SEP 20
                                                                 self-securitised assets ⁵ 37%
  120                                                                                                               120
                     Customer deposits 48%                                                                                            Customer deposits 46%                                                                         TERM FUNDING
  100                                                                                                               100                                                                                                             RAISED8

                                                                                                                                                                                                                                    $A4.9b
                                                                                                                                                                                       Trading assets 21%
                                                                     Trading assets 17%
    80                                                                                                               80                                                                                                                                                                        SINCE
                                                                 Loan assets (incl. op lease)                                                                                       Loan assets (incl. op lease)                                                                                 SEP 20
                                                                       < 1 year 7%                                                                                                        < 1 year 7%
    60                                                                                                               60
                      Debt maturing beyond                                                                                              Debt maturing beyond
                        12 months ² 26%                                                                                                   12 months ² 24%
    40                                                             Loan assets (incl. op lease)                      40                                                            Loan assets (incl. op lease)
                                                                       > 1 year ³ ⁶ 33%                                                                                                > 1 year ³ ⁶ 32%

    20                                                                                                               20
                    Equity and hybrids ³ ⁴ 15%                                                                                       Equity and hybrids ³ ⁴ 15%
                                                               Equity investments and PPE ³ ⁷ 6%                                                                                Equity investments and PPE ³ ⁷ 5%
      0                                                                                                                0
                       Funding sources                                Funded assets                                                     Funding sources                                Funded assets

These charts represent Macquarie’s funded balance sheets at the respective dates noted above . 1. ‘Other debt maturing in the next 12 months’ includes Secured funding, Bonds, Other loans, Subordinated debt and Net trade creditors. 2. ‘Debt maturing beyond 12 months’ includes Subordinated
debt, Structured notes, Secured funding (including drawn RBA Term Funding Facility), Bonds, Syndicated loan facilities and Other loans not maturing within next 12 months. 3. Non-controlling interests are netted down in ‘Equity and hybrids’, ‘Equity investments and PPE’ and ‘Loan assets (incl. op
lease) > 1 year’. 4. Hybrid instruments include Macquarie Additional Capital Securities, Macquarie Capital Notes 2, 3 and 4 and Macquarie Bank Capital Notes 2. 5. ‘Cash, liquids and self-securitised assets’ includes self-securitisation of repo eligible Australian assets originated by Macquarie, a
portion of which Macquarie can utilise as collateral in the Reserve Bank of Australia’s Committed Liquidity Facility (CLF) and Term Funding Facility (TFF). 6. ‘Loan Assets (incl. op lease) > 1 year’ includes Debt investment securities. 7. ‘Equity investments and PPE’ includes Macquarie’s co-
investments in Macquarie-managed funds and other equity investments. 8. Issuances cover a range of tenors, currencies and product types and are AUD equivalent based on FX rates at the time of issuance and include undrawn facilities (does not include undrawn accessible TFF Allowances).               12
Operational Briefing Presentation to Investors and Analysts 9 February 2021 - Macquarie Group
MACQUARIE I OPERATIONAL BRIEFING 2021 I MACQUARIE.COM

     UPDATE SINCE THE INTERIM RESULT                                               MACQUARIE ASSET MANAGEMENT                                                 MACQUARIE CAPITAL                                CORPORATE OPERATIONS GROUP                                            APPENDIX

Basel III capital position
● APRA Basel III Group capital at Dec 20 of $A24.9b; Group capital surplus of $A8.1b1
● APRA Basel III CET1 ratio: 12.1%; Harmonised Basel III CET1 ratio: 15.5%
Group regulatory surplus: Basel III (Dec 20)
         $Ab
  12.0

                                                        (2.3)
  10.0
                                                                                                                        (0.4)                           0.7                                                                                             2.6
                                                                                                                                                                                       (1.6)
   8.0

                                               Based on 8.5%
   6.0                  11.7                   (minimum Tier 1 ratio
                                               + CCB)                                                                                                                                                                                                                                   10.7
                                                                                         9.4
   4.0                                                                                                                                                                                                                  8.1

   2.0

   0.0
                   Harmonised                   APRA Basel III                   APRA Basel III             1H21 interim dividend³           3Q21 P&L and other                 Business capital                 APRA Basel III                 APRA Basel III                     Harmonised
                     Basel III                'super equivalence'                  at Sep 20                                                    movements⁴                       requirements                      at Dec 20                 'super equivalence'⁵                    Basel III
                    at Sep 20²                                                                                                                                                                                                                                                      at Dec 20
1. Calculated at 8.5% RWA including the capital conservation buffer (CCB), per APRA ADI Prudential Standard 110. Based on materiality, the 8.5% used to calculate the Group capital surplus does not include the countercyclical capital buffer (CCyB) of ~1bps. The individual CCyB varies by
jurisdiction and the Bank Group’s CCyB is calculated as a weighted average based on exposures in different jurisdictions. 2. Basel III applies only to the Bank Group and not the Non-Bank Group. ‘Harmonised’ Basel III estimates are calculated in accordance with the BCBS Basel III framework.
3. Offset by Dividend Reinvestment Plan issuance. 4. Includes current quarter P&L, movement in the foreign currency translation reserve and other movements in capital supply. 5. APRA Basel III ‘super-equivalence’ includes the impact of changes in capital requirements in areas where APRA differs
from the BCBS Basel III framework, including the treatment of mortgages $A1.0b; capitalised expenses $A0.5b; equity investments $A0.3b; investment into deconsolidated subsidiaries $A0.2b; DTAs $A0.6b.                                                                                                  13
MACQUARIE I OPERATIONAL BRIEFING 2021 I MACQUARIE.COM

     UPDATE SINCE THE INTERIM RESULT                                                 MACQUARIE ASSET MANAGEMENT                                               MACQUARIE CAPITAL                                 CORPORATE OPERATIONS GROUP                   APPENDIX

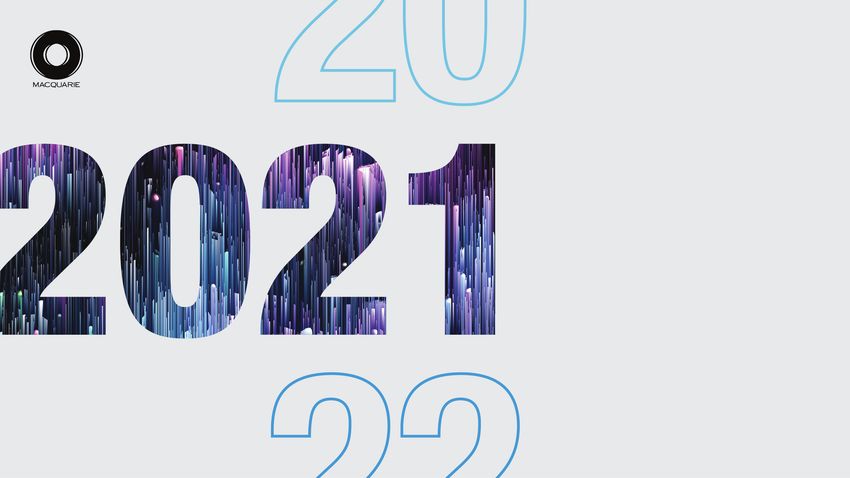
Business capital requirements1

        $Ab
 18.0         $A17.7b                                                                                                                                                                                                        3Q21 KEY DRIVERS
                                               0.1
                               (0.3)                                                                                                                                                       0.1
                                                              (0.4)                                                                                                         0.2                                              MAM
 17.0                                                                                                                                                                                                      (0.4)   $A16.8b   ●   Waddell & Reed
                                                                             (0.5)
                                                                                                                                                            0.6                                        Broadly               Macquarie Capital
                                                                                                                                                                                                       offset by             ●   Principal Finance lending activity, new
                                                                                                                                             0.3                                                        FCTR2                    investments and DCM underwriting
 16.0                                                                                        (1.4)                                                                                                                               positions; offset by asset realisations
                                                                                                                             0.8
                                                                                                          $A15.2b
                                                                                                                                                                                                                             CGM
 15.0                                                                                                                                                                                                                        ●   Derivatives trading volumes in addition to
                                                                                          Broadly
                                                                                                                                                                                                                                 loans and commitments
                                                                                          offset by
                                                                                           FCTR2                                                                                                                             BFS
 14.0                                                                                                                                                                                                                        ●   Growth in residential mortgages and
                                               $A2.5b decrease                                                                                       $A1.6b increase                                                             Business Banking portfolio, partially offset
                                                          over 1H21                                                                                            over 3Q21                                                         by runoff in vehicles financing

 13.0                                                                                                                                                                                                                        Corporate
                                                                                                                                                                                                                             ●   Transfer of the Group shared services
                                                                                                                                                                                                                                 entities, from the Non-Bank to the Bank

 12.0
              Mar-20           MAM             BFS            CGM          MacCap             FX           Sep-20           MAM          MacCap            CGM             BFS            Corp             FX      Dec-20

1. Regulatory capital requirements are calculated at 8.5% RWA. 2. The foreign currency translation reserve (FCTR) forms part of capital supply and broadly offsets FX movements in capital requirements.                                                                      14
MACQUARIE I OPERATIONAL BRIEFING 2021 I MACQUARIE.COM

     UPDATE SINCE THE INTERIM RESULT                                               MACQUARIE ASSET MANAGEMENT                                                MACQUARIE CAPITAL                                 CORPORATE OPERATIONS GROUP                                            APPENDIX

Strong regulatory ratios

Bank Group (Dec 20)
17.5%                                                                      7.5%                                                                           190.0%
                                15.5%                                                                                                                                                                                                  120.0%
                                                                                                             6.0%                                                                           172%
14.0%                                                                      6.0%                                                                           160.0%                                                                       115.0%

                                12.1%                                                                        5.2%                                                                                                                      110.0%                             112%
10.5%                                                                      4.5%                                                                           130.0%
                                                                                                                                                                                                                                       105.0%

 7.0%                                                                      3.0%                                                                           100.0%                                                                       100.0%

                                                                                                                                                                                                                                         95.0%
 3.5%                                                                      1.5%                                                                             70.0%
                                                                                                                                                                                                                                         90.0%

 0.0%                                                                      0.0%                                                                             40.0%                                                                        85.0%
                             CET1 ratio                                                                Leverage ratio                                                                       LCR ²                                                                         NSFR

                                                                                                    Bank Group (APRA)                                     Total                             Basel III minimum ³

1. ‘Harmonised’ Basel III estimates are calculated in accordance with the BCBS Basel III framework. 2. Average LCR for Dec 20 quarter is based on an average of daily observations. 3. Includes the capital conservation buffer in the minimum CET1 ratio requirement. APRA has released a draft
update to 'Prudential Standard APS 110 Capital Adequacy' proposing a minimum requirement for the leverage ratio of 3.5% effective Jan 23.                                                                                                                                                          15
MACQUARIE I OPERATIONAL BRIEFING 2021 I MACQUARIE.COM

     UPDATE SINCE THE INTERIM RESULT                                               MACQUARIE ASSET MANAGEMENT                                               MACQUARIE CAPITAL                                CORPORATE OPERATIONS GROUP                                            APPENDIX

Regulatory update
Australia
● On 8 Dec 20, APRA released for consultation its revisions to the capital framework for ADIs1. The changes are aimed at embedding ‘unquestionably strong’ levels of capital, APRA’s stated objectives of the revisions include:
   – greater risk sensitivity within the risk weighting framework, including more differentiated risk weights for different types of mortgages and reduced risk weights for small business lending;
   – providing for ADIs to hold a larger share of their required capital as buffers, enhancing the ability of the framework to respond flexibly to future stress events; and
   – improving the transparency of the framework by requiring all ADIs to disclose their capital ratios on a common basis, and making it easier to reconcile the Australian framework with international standards.
● The status of the relevant regulatory changes is shown in the table below

 Regulatory Change                                                                                                                Status                                                                                                                                 Compliance date
 APS 110 (Capital Floor, CCB, CCyB, Leverage ratio)                                                                               Draft standard released 8 Dec 20
 APS 112 (Standardised credit risk)                                                                                               Draft standard released 8 Dec 20
 APS 113 (IRB credit risk)                                                                                                        Draft standard released 8 Dec 20                                                                                                       1 Jan 23
 APS 115 (Operational risk)                                                                                                       Standard finalised 11 Dec 19
 APS 117 (IRRBB)                                                                                                                  Draft standard released 4 Sep 19
 APS 116 (FRTB)                                                                                                                   Waiting for draft standard to be released                                                                                              1 Jan 24
 APS 111 (Capital treatment of banking and insurance subsidiaries)                                                                Draft standard released 15 Oct 19, expected to be finalised 2021                                                                       TBA
 APS 220 (Credit risk management)                                                                                                 Standard finalised 12 Dec 19, further revisions in consultation due 29 Jan 21
                                                                                                                                                                                                                                                                         1 Jan 22
 APS 222 (Associations with related entities)2                                                                                    Standard finalised 20 Aug 19

●    Based on current information available, it remains Macquarie’s expectation that it will have sufficient capital to accommodate likely additional regulatory Tier 1 capital requirements as a result of the proposed changes. Noting that
     some of them are at an early stage of review and hence the final impact is uncertain
●    As previously noted, APRA is in discussions with Macquarie on resolution planning and intragroup funding. These discussions are progressing and as part of the discussions, MGSA, the main Group shared services entity for both
     the Bank and Non-Bank groups, was transferred to the Bank Group in Nov 20
●    On 12 Nov 20, APRA released its revised remuneration standard for consultation, with responses due 12 Feb 213. The new standard requires boards to strengthen incentives to manage non-financial risks, regularly assess for risk
     management failings and have deferral arrangements that allow boards to reduce remuneration for poor risk outcomes. The new CPS 511 is scheduled to be finalised in mid-2021 and to come into effect on 1 Jan 23. Increased
     disclosure requirements will also be required, defined through a future consultation expected late 2021
●    On 17 Nov 20, APRA confirmed it intends to grant Macquarie a 12-month period of transition to 1 Jan 23 in relation to APS 222. Macquarie will undertake some restructuring of existing business activities and legal entities as a result
     of APS 222, however Macquarie does not anticipate this will have a material impact on results
●    On 9 Dec 20, APRA announced the commencement of a further consultation for revisions to APS 220. These revisions are contingent on the Government’s proposed consumer credit reforms passing legislation, where ADIs would
     no longer be subject to Responsible Lending Obligations which had been administered by ASIC4. APRA proposes to bring forward the implementation date for APS 220 to align to the reforms’ commencement date, if earlier than 1
     Jan 22, but not before 1 Apr 21
●    On 15 Dec 20, APRA provided updated capital management guidance. From 1 Jan 21, while APRA will expect ADIs to continue to moderate dividend payout ratios and consider the use of dividend reinvestment plans (DRPs) and/or
     other capital management initiatives, APRA will no longer hold ADIs to a minimum level of earnings retention5

1. ‘APRA seeks to enhance flexibility and resilience of ADI capital framework’; 8 Dec 20. 2.‘APRA announces new commencement dates for prudential and reporting standards’; 16 Apr 20. 3. ‘APRA releases revised remuneration standard for consultation’; 12 Nov 20. 4. ‘APRA issues letter to ADIs
on potential changes to credit risk management’, 9 Dec 20. 5. ‘APRA updates capital management guidance and releases ADI stress test results’; 15 Dec 20.                                                                                                                                             16
MACQUARIE I OPERATIONAL BRIEFING 2021 I MACQUARIE.COM

   UPDATE SINCE THE INTERIM RESULT              MACQUARIE ASSET MANAGEMENT                       MACQUARIE CAPITAL      CORPORATE OPERATIONS GROUP             APPENDIX

Regulatory update
Germany
● Macquarie continues to respond to requests for information about its historical activities as part of the ongoing, industry-wide investigation in Germany relating to
  dividend trading
● As previously noted, the German authorities have designated as suspects approximately 100 current and former Macquarie staff in total, most of whom are no longer
  at Macquarie
● The total amount at issue is not material and MGL has provided for the matter
Brexit
● In Dec 20 agreement was reached between the UK and the European Union (EU) on a new Trade and Cooperation Agreement and the UK withdrawal from the EU
  took effect
● As previously stated, Macquarie does not believe that the UK’s withdrawal from the EU will be a material event for the Group
● Macquarie is now operating with all required European licences in place, including a new MiFID investment firm licence in France
● Macquarie has a longstanding and deep commitment to the UK as the hub for the EMEA region’s operations and this will continue to be the case. Macquarie has
  been in the UK for 31 years with over 1,900 staff based there as at 31 Dec 20

                                                                                                                                                                          17
MACQUARIE I OPERATIONAL BRIEFING 2021 I MACQUARIE.COM

   UPDATE SINCE THE INTERIM RESULT               MACQUARIE ASSET MANAGEMENT                    MACQUARIE CAPITAL      CORPORATE OPERATIONS GROUP             APPENDIX

Board and Management Update
 Macquarie Group and Macquarie Bank Boards
                                                        After more than six years on the MGL and MBL Boards, Gordon Cairns will step down on 7 May 21. In November 20,
                                                        Mr Cairns agreed to extend his tenure to accommodate evolution of the Boards, which occurred with the appointment
                                                        of Rebecca McGrath and Mike Roche in Jan 21.

Gordon Cairns    Rebecca McGrath    Mike Roche

 Macquarie Bank Limited
                                                        After 22 years with Macquarie, Mary Reemst has decided to retire from her role as Managing Director and Chief
                                                        Executive Officer of MBL, from the MBL Board and from the MGL and MBL Executive Committees, effective 1 Jul 21.
                                                        Ms Reemst, who has been on the Executive Committees for seven years, also serves as the Chair of the Macquarie
                                                        Group Foundation.
                                                        From 1 Jul 21, and subject to regulatory approvals, Stuart Green will become Managing Director and Chief Executive
Mary Reemst               Stuart Green                  Officer of MBL and join the MBL Board and MGL and MBL Executive Committees. Mr Green has been with Macquarie
                                                        for 20 years, serving as Group Treasurer since Aug 13.

 Macquarie Asset Management
                                                        After 16 years with Macquarie, Martin Stanley has decided to step down as Group Head of MAM and from the
                                                        Executive Committee, effective 1 Apr 21. Mr Stanley, who has been on the Executive Committee for two years, will
                                                        become Chairman of MAM and remain on the regional infrastructure fund investment committees and as Chairman of
                                                        the Board of Directors of the NYSE-listed Macquarie Infrastructure Corporation (NYSE: MIC).
                                                        Ben Way will become Group Head of MAM and join the Executive Committee. Mr Way, who has been with Macquarie
Martin Stanley            Ben Way                       for 14 years and is a member of Macquarie’s Management Committee, currently leads the Global Alternatives division
                                                        in MAM and is also Macquarie Group’s Asia CEO. Mr Way will continue to be based in Hong Kong.
                                                                                                                                                                        18
MACQUARIE I OPERATIONAL BRIEFING 2021 I MACQUARIE.COM

           UPDATE SINCE THE INTERIM RESULT                                          MACQUARIE ASSET MANAGEMENT                                                    MACQUARIE CAPITAL                             CORPORATE OPERATIONS GROUP                                             APPENDIX

Factors impacting short-term outlook
                      Annuity-style businesses                                                                                                                                  Markets-facing businesses
                      Macquarie Asset Management (MAM)                                                                                                                          Macquarie Capital2 (MacCap)

                                                                                                                                                            Non-Banking Group
  Non-Banking Group

                      ● Base fees expected to be broadly in line with FY20                                                                                                      ● Transaction activity improving, although challenging markets continue to
                      ● Net Other Operating Income1 expected to be significantly down, due to strong                                                                              impact the time to completion for many deals. Strong ECM activity in Australia
                        realisations in FY20 and prolonged impact of COVID-19 on Macquarie                                                                                        through 1H21 has not continued in 2H21 to date
                        AirFinance customers                                                                                                                                    ● FY21 expected to be significantly down on FY20, however 2H21 expected to
                                                                                                                                                                                  be significantly up on 2H20

                      Banking and Financial Services (BFS)                                                                                                                      Commodities and Global Markets3 (CGM)

                                                                                                                                                            Banking Group
  Banking Group

                      ● Ongoing monitoring of provisioning to support clients in the                                                                                            ● 2H21 market conditions expected to be more favourable than previously
                        COVID-19 environment                                                                                                                                      anticipated given increased levels of volatility experienced in 3Q21
                      ● Higher deposit and loan portfolio volumes in FY21                                                                                                       ● We now expect 2H21 to be slightly down on 1H21
                      ● Platform volumes subject to market movements                                                                                                            ● Consistent contribution from Specialised and Asset Finance linked to annuity
                      ● Competitive dynamics to continue to drive margin pressure                                                                                                 flows; notwithstanding reduction in balance sheet
                                                                                                                                                                                ● Product and client sector diversity expected to provide some support through
                                                                                                                                                                                  ongoing uncertain economic conditions in FY21

                                                                                                                                           Corporate
  ● Compensation ratio expected to be within the range of historical levels                                                                              ● The FY21 effective tax rate is expected to be broadly in line with FY20

1. Net Other Operating Income includes all operating income excluding base fees. 2. Certain activities of the Equities business are undertaken from within the Banking Group. 3. Certain assets of the Credit Markets business and certain activities of the Commodity Markets and Finance business, and
some other less financially significant activities are undertaken from within the Non-Banking Group.                                                                                                                                                                                                       19
MACQUARIE I OPERATIONAL BRIEFING 2021 I MACQUARIE.COM

 UPDATE SINCE THE INTERIM RESULT        MACQUARIE ASSET MANAGEMENT                                                 MACQUARIE CAPITAL                                  CORPORATE OPERATIONS GROUP                                              APPENDIX

Short-term                              Market conditions are likely to remain challenging, especially given the significant and unprecedented
                                        uncertainty caused by the worldwide impact of COVID-19 and the uncertain speed of the global economic
outlook                                 recovery, making short-term forecasting extremely difficult
                                        We currently anticipate the FY21 result to be slightly down on FY201
                                        The range of factors that will influence our short-term outlook include:
                                        ● The duration and severity of the COVID-19 pandemic
                                        ● The uncertain speed of the global economic recovery
                                        ● Global levels of government support for economies
                                        ● Completion of period-end reviews including asset impairment and expected credit loss allowances
                                        ● The completion rate of transactions
                                        ● Geographic composition of income
                                        ● The impact of foreign exchange
                                        ● Potential tax or regulatory changes and tax uncertainties
                                        ● Market conditions and the impact of geopolitical events
                                        We continue to maintain a cautious stance, with a conservative approach to capital, funding and liquidity
                                        that positions us well to respond to the current environment

                                   1. Pursuant to ASX Guidance Note 8, as revised on 9 Dec 20, Macquarie states that (i) the anticipated FY21 result to which the above guidance relates, is expected to differ materially from the current range of current
                                   analysts’ consensus and (ii) this 2021 Operational Briefing Presentation explains the main factors as to why the anticipated FY21 result may differ to market expectations.
                                                                                                                                                                                                                                                               20
MACQUARIE I OPERATIONAL BRIEFING 2021 I MACQUARIE.COM

 UPDATE SINCE THE INTERIM RESULT   MACQUARIE ASSET MANAGEMENT                     MACQUARIE CAPITAL      CORPORATE OPERATIONS GROUP   APPENDIX

Medium-term                        Macquarie remains well-positioned to deliver superior performance in the medium term

outlook
                                   Deep expertise in major markets
                                   Build on our strength in business and geographic diversity and continue to adapt our portfolio mix to
                                   changing market conditions
                                   ● Annuity-style income is primarily provided by two Operating Groups’ businesses which are
                                     delivering superior returns following years of investment and acquisitions
                                     – Macquarie Asset Management and Banking and Financial Services
                                   ● Two markets-facing businesses well positioned to benefit from improvements in market conditions
                                     with strong platforms and franchise positions
                                     – Commodities and Global Markets and Macquarie Capital
                                   Ongoing program to identify cost saving initiatives and efficiency
                                   Strong and conservative balance sheet
                                   ● Well-matched funding profile with minimal reliance on short-term wholesale funding
                                   ● Surplus funding and capital available to support growth
                                   Proven risk management framework and culture

                                                                                                                                                 21
MACQUARIE I OPERATIONAL BRIEFING 2021 I MACQUARIE.COM

           UPDATE SINCE THE INTERIM RESULT                                           MACQUARIE ASSET MANAGEMENT                                                      MACQUARIE CAPITAL                              CORPORATE OPERATIONS GROUP                                              APPENDIX

Medium term
                      Annuity-style businesses                                                                                                                                     Markets-facing businesses
                      Macquarie Asset Management (MAM)                                                                                                                             Macquarie Capital1 (MacCap)

                                                                                                                                                               Non-Banking Group
  Non-Banking Group

                      ● Leading specialist global asset manager, well-positioned to respond to current                                                                             ● Positioned to benefit from recovery in transaction activity
                        market conditions and grow assets under management through its diversified                                                                                 ● Continues to tailor the business offering to current opportunities and
                        product offering, track record and experienced investment teams                                                                                              market conditions including providing flexible capital solutions across
                                                                                                                                                                                     sectors and regions
                                                                                                                                                                                   ● Opportunities for project development and balance sheet investment by the
                                                                                                                                                                                     group and in support of partners and clients subject to market conditions

                      Banking and Financial Services (BFS)                                                                                                                         Commodities and Global Markets2 (CGM)

                                                                                                                                                               Banking Group
  Banking Group

                      ● Growth opportunities through intermediary and direct retail client distribution,                                                                           ● Opportunities to grow commodities business, both organically and
                        platforms and client service                                                                                                                                 through acquisition
                      ● Opportunities to increase financial services engagement with existing                                                                                      ● Development of institutional and corporate coverage for specialised credit,
                        business banking clients and extend into adjacent segments                                                                                                   rates and foreign exchange products
                      ● Modernising technology to improve client experience and support growth                                                                                     ● Tailored financing solutions globally across a variety of industries and
                                                                                                                                                                                     asset classes
                                                                                                                                                                                   ● Continued investment in asset finance portfolio
                                                                                                                                                                                   ● Growing client base across all regions

1. Certain activities of the Equities business are undertaken from within the Banking Group. 2. Certain assets of the Credit Markets business and certain activities of the Commodity Markets and Finance business and some other less financially significant activities are undertaken from within the Non-
Banking Group.                                                                                                                                                                                                                                                                                                  22
MACQUARIE I OPERATIONAL BRIEFING 2021 I MACQUARIE.COM

     UPDATE SINCE THE INTERIM RESULT                                                 MACQUARIE ASSET MANAGEMENT                                                  MACQUARIE CAPITAL                                  CORPORATE OPERATIONS GROUP                                              APPENDIX

Approximate business Basel III Capital and ROE

30 Sep 20
                                                                                                                                        APRA Basel III Capital1                                    Approx. 1H21 Return on                                    Approx. 14-year Average
 Operating Group                                                                                                                           @ 8.5% ($Ab)                                               Ordinary Equity2                                      Return on Ordinary Equity3

 Annuity-style businesses                                                                                                                                6.6

 Macquarie Asset Management                                                                                                                              2.2
                                                                                                                                                                                                                    24%                                                         22%
 Banking and Financial Services                                                                                                                          4.4

 Markets-facing businesses                                                                                                                               8.0

 Commodities and Global Markets                                                                                                                          4.6
                                                                                                                                                                                                                    10%                                                         16%
 Macquarie Capital                                                                                                                                       3.4

 Corporate                                                                                                                                               0.6

 Total regulatory capital requirement @ 8.5%                                                                                                            15.2

 Group surplus                                                                                                                                           9.4

 Total APRA Basel III capital supply                                                                                                                    24.64                                                       9.5%                                                        14%

Note: Differences in totals due to rounding. 1. Operating Group capital allocations are based on 30 Jun 20 allocations adjusted for material movements over the Sep 20 quarter. 2. NPAT used in the calculation of approximately 1H21 ROE is based on Operating Groups’ annualised net profit
contribution adjusted for indicative allocations of profit share, tax and other corporate items. Accounting equity is attributed to businesses based on regulatory capital requirements which are based on the quarterly average capital usage from FY07 to FY20, inclusive. 3. 14-year average covers
FY07 to FY20, inclusive, and has not been adjusted for the impact of business restructures or changes in internal P&L and capital attribution. 4. Comprising of $A20.5b of ordinary equity and $A4.1b of hybrids.                                                                                        23
Operational
Briefing
Presentation to Investors
and Analysts
9 February 2021
You can also read