Regal Entertainment Group Three Year Strategic Plan April 14, 2016 Quinton Gray - Strategy Club
←
→
Page content transcription
If your browser does not render page correctly, please read the page content below
Regal Entertainment Group
 Three Year Strategic Plan
           April 14, 2016
            Quinton Gray

                  1|Page
Contents
Introduction ……………………………………………………………………………………….…..4
History …………………………………………………………………………………………….…..4
Vision and Mission Statements ……………………………………………………………………….4
      Vision …………………………………………………………………………………….…...4
      Mission ………………………………………………………………………………….….…4
Organizational Structure ……………………………………………………………………….….….4
      Current Organizational Structure …………………………………………………….….……4
      Proposed Organizational Structure ………………………………………………….….…….5
Competitive Profile …………………………………………………………………………..……….6
Internal Assessment ………………………………………………………………………..…………6
      Internal Factor Evaluation (IFE) ……………………………………………….….………….6
      Strengths …………………………………………………………………….…….………….7
      Weaknesses ……………………………………………………………………….…………..7
External Assessment ………………………………………………………………………………….8
      Company Value ………………………………………………………………………………8
      Current Financial Statements and Ratios …………………………………………………….8
      External Factor Evaluation (EFE) ……………………………………………………….......10
             Opportunities ………………………………………………………………………...10
             Threats ……………………………………………………………………………….11
Strategy Formulation ………………………………………………………………………………...11
      Strengths-Weaknesses-Opportunities-Threats ……………………………………………….11
             Strength-Opportunity (SO) Strategy …………………………………………………12
             Weakness-Opportunity (WO) Strategy ………………………………………………12
             Strength-Threat (ST) Strategy …………………………………………………….….12
             Weakness-Threat (WT) Strategy ………………………………………………….….12
Boston Consulting Group (BCG) Matrix …………………………………………………………….13
Internal-External (IE) Matrix ………………………………………………………………………...13

MBA 745: Three Year Strategic Plan for Regal Entertainment Group   2|Page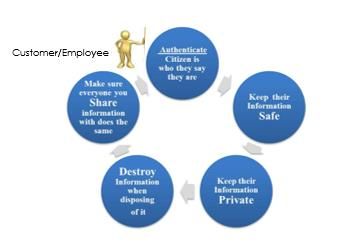
Strategic Position and Action Evaluation ……………………………………………………………14
Grand Strategy Matrix ……………………………………………………………………………….15
Quantitative Strategic Planning Matrix (QSPM) …………………………………………………….16
Recommendations ……………………………………………………………………………………18
      EPS/EBIT Analysis ………………………………………………………………..................20
      Pro Forma Financial Statements and Ratios ………………………………………....……….21
      Notes for Projected Income Statement …………………………………………………….....23
      Notes for Projected Balance Sheet ………………………………………………………...…23
References ……………………………………………………………………………………...…….25
Appendix 1: Truvincio Proposal ……………………………………………………………......……26

MBA 745: Three Year Strategic Plan for Regal Entertainment Group   3|Page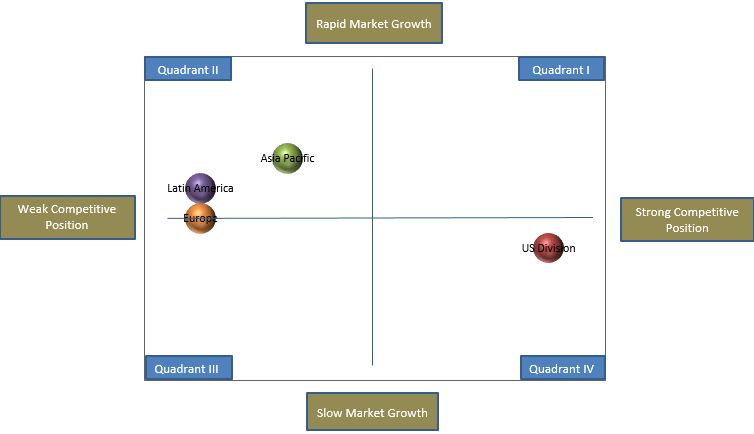
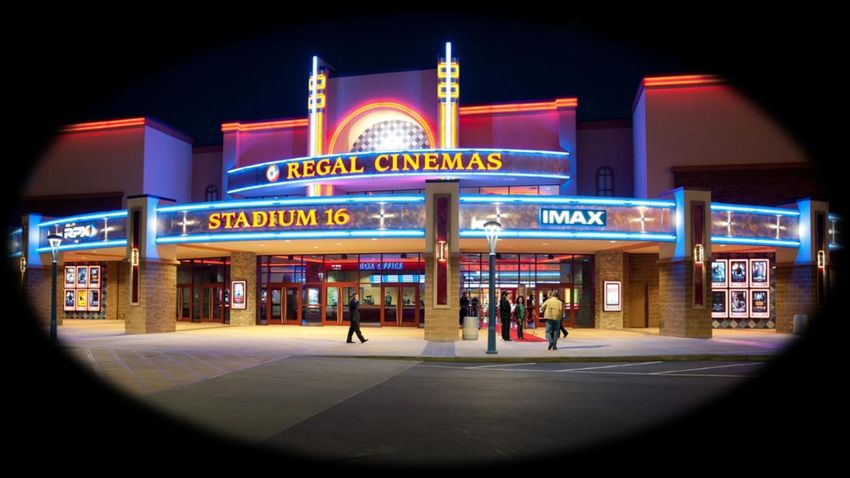
Introduction
History
Regal Entertainment Group is the largest and most diverse moving picture company in the United States.
Regal has been built with roots within the United States around large metropolitan areas to be able to
cater to as many of its customers as possible. Regal began its national theatre circuit in 2002 when it was
incorporated and it is now part of 574 theatres in 42 states. Regal operates 7,367 movie theatre screens
in the United States as well as internationally in Guam, Saipan, and American Samoa.

Vision and Mission Statements
Regal Entertainment Group does not currently have a vision or a mission statement, therefore I have
included a newly proposed vision statement which sets the foundation for the proposed mission
statement.
Vision
Regal Entertainment Group aspires to be the most widely recognized movie exhibitor in the world,
offering an unmatched theatre experience and unrivaled guest service in the most conducive movie
theatre atmosphere on the planet.
Mission
Regal Entertainment Group is the premier and most widely interspersed motion picture exhibitor and
entertainment technology company in the United States (3) which operates a wide variety of multi-
screen RPX, IMAX, and REAL3D theatres (2,4,7) chiefly in mid to large metropolitan areas, providing
a first-in-class movie theatre experience along with superior guest service at affordable prices to families
of all ages (1,8). By employing a talented, spirited and friendly cast which maintains honesty and
integrity (6,8), we are able to promote from within to continue a legacy for exceeding our guests’
expectations (9); generating value for: our guests, employees, key stakeholders, and shareholders of the
company (5).

Organizational Structure
Current Organizational Structure
Currently, Regal Entertainment is extremely dependent upon its CEO, Amy Miles who has
accomplished a lot for Regal Entertainment. Under this particular structure, this company is considered
very lean given its market share and revenues. If Regal Entertainment is going to become a large player
in the international market, then they will need to depend on more than just their CEO. It is
recommended that Regal alter their leadership organizational structure to help better position them for
the future growth and acquisition.

MBA 745: Three Year Strategic Plan for Regal Entertainment Group                         4|Page
Amy Miles, Chief
                                                          Executive Officer

                                                         Peter B. Brandow,                  David H Ownby,
                      Gregory W. Dunn,
                                                      Executive Vice President,         Executive Vice President,
                     President and Chief
                                                        General Counsel and              Chief Financial Officer
                      Operating Officer
                                                              Secretary                      and Treasurer

Proposed Organizational Structure
This new organizational structure illustrates Regal Entertainment’s need for operational support to
maintain the company’s efficiencies in the United States, especially through acquisitions and
conversions as well as abroad when expanding the company’s reach internationally. These Vice
President positions will be able to support the growth that Regal Entertainment needs to reach higher
profits. This new proposed structure also supports the need for a Chief Information Officer as well as a
Chief Technology Officer. These positions reflect the growing concern over data security and
importance for information technology within business and strategic management. Keeping information
safe and reliably available is viable to any company, and Regal will be able to ensure that is the case for
the future with these proposed positions.

                                                             Amy Miles, Chief
                                                             Executive Officer

                                                                                             David H Ownby,
                                                            Peter B. Brandow,
                           Gregory W. Dunn,                                                    Executive Vice
                                                             Executive Vice
                          President and Chief                                                 President, Chief
                                                           President, General
                           Operating Officer                                               Financial Officer and
                                                          Counsel and Secretary
                                                                                                 Treasurer

                                             Vice President of
           Vice President of                                                  Chief Technology              Chief Information
                                                Operations,
         Operations, US Division                                                   Officer                        Officer
                                           International Division

MBA 745: Three Year Strategic Plan for Regal Entertainment Group                                                   5|Page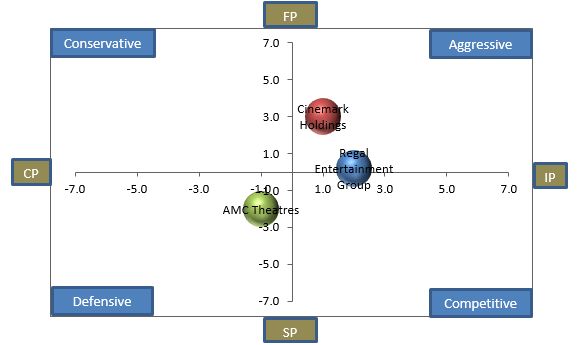
Competitive Profile Matrix
The competitive profile matrix (CPM) is what strategists use to identify major competitors of a firm
within a particular industry. The CPM here uses our firm’s strengths and weaknesses and compares them
to other firms’ strategic positions. The CPM uses weights to help identify the importance of an
industry’s aspects. According to Yahoo Finance, AMC and Cinemark are Regal’s two major competitors
in the movie industry. As you can see below, ten critical success factors were evaluated and analyzed to
score all three companies according to these factors. Regal Entertainment scored at the top of the list in
six (6) of the twelve (12) categories, specifically advertising, store locations and proximity, guest
service, customer loyalty, market share, and movie experience. Areas that Regal fell short compared to
its competitors includes: exploring markets and ticket price competitiveness. Interestingly enough, Regal
understands that their ticker prices are a bit higher than other major theatres due to their increases
services to their customers including concessions and improved luxury seating. Regal will need to plan
to explore markets which are currently booming rather than focusing all of their efforts on the mature
US market.

                                              Regal                 AMC                  Cinemark

 Critical Success Factors   Weight     Rating     Score      Rating       Score       Rating        Score
 Advertising                 0.03         4           0.12      3          0.09         2           0.06
 Exploring Markets           0.08         2           0.16      3          0.24         4           0.32
 Guest Service               0.10         4           0.40      2          0.20         3           0.30
 Store Locations and
                             0.08         4           0.32      3          0.24         2           0.16
 Proximity
 Digital and 3-D Screen
                             0.10         3           0.30      2          0.20         4           0.40
 Technology
 Employee Dedication         0.05         2           0.10      3          0.15         1           0.05
 Financial Profit            0.15         2           0.30      3          0.45         1           0.15
 Customer Loyalty            0.08         4           0.32      2          0.16         3           0.24
 Market Share                0.08         4           0.32      3          0.24         2           0.16
 Movie Experience            0.10         4           0.40      2          0.20         3           0.30
 Senior Management           0.05         3           0.15      2          0.10         4           0.20
 Ticket Price
                             0.10         2           0.20      3          0.30         4           0.40
 Competitiveness
 Totals                      1.00                     3.09                 2.57                     2.74

Internal Assessment
Internal Factor Evaluation (IFE)
The internal factor evaluation (IFE) used below is a strategy tool which helps to summarize the strengths
and weaknesses of a company providing a basis for identifying relationships among the most functional
areas of the industry. Requiring some intuitive judgements to complete, an IFE matrix uses weights and
ratings to identify a weighted score for the particular company. The IFE illustrates ten (10) strengths and
ten (10) weaknesses in the functional areas of Regal’s business. Regal Entertainment describes their

MBA 745: Three Year Strategic Plan for Regal Entertainment Group                        6|Page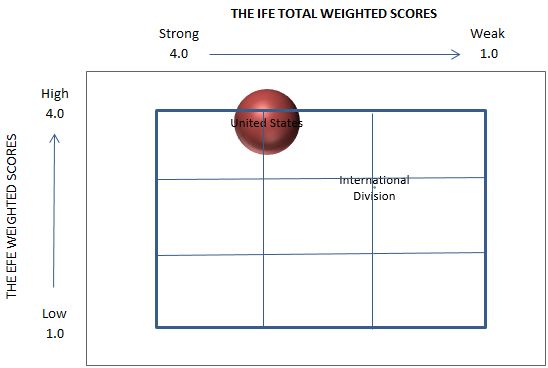
major competitive strengths within the industry as “superior management drives strong operating
margins, proven acquisition and integration expertise, and a quality theatre portfolio” (sec.gov). Many of
Regal’s weaknesses came from their annual 10-K report within the financials section. According to
Statistica.com, Regal Entertainment revenues have not returned back to 2007 levels as of 2015.
Furthermore, another weakness in Regal is that a majority of employees do not have any equity in the
company, are part time, and that has not allowed employee satisfaction to reach very high levels.
Strengths
                                                                                                             Weighted
      Strengths                                                                            Weight   Rating
                                                                                                              Score
 1    Industry leading and largest domestic motion picture exhibitor operating 7,367
                                                                                            0.20      4
      screens in 574 theatres in 42 states.                                                                    0.80
 2    Regal operates in 46 of the top 50 U.S. designated market areas                       0.18      4        0.72
 3    As of January 1, 2015, Regal had 86 IMAX and 86 RPX theatres in the United
                                                                                            0.15      3
      States                                                                                                   0.45
 5    Regal Entertainment Group makes up about 20% of the total North American Box
                                                                                            0.10      4
      Office                                                                                                   0.40
 5    As of January 1, 2015, approximately 79% of theatres had 10 or more screens.          0.10      3        0.30
 6    Regal theatres have an average 12.8 screens per location which is above the North
                                                                                            0.07      3
      American industry average.                                                                               0.21
 7    As of January 1, 2015, Regal had 78% of their North American locations with
                                                                                            0.05      4
      stadium style seating.                                                                                   0.20
 8    Regal offers luxury reclining seating in 336 auditoriums at 32 select locations in
                                                                                            0.05      4
      North America.                                                                                           0.20
 9    Frequent Moviegoer Loyalty Program called Regal Crown Club - 13 million
                                                                                            0.05      3
      active members as of January 1, 2015                                                                     0.15
 10   42% of Regal locations have premium amenity offerings, such as Expanded Food
      and Beverage Offerings in 185 locations                                               0.05      4
                                                                                                               0.20

Weaknesses
                                                                                                             Weighted
      Weaknesses                                                                           Weight   Rating
                                                                                                              Score
 1    As of 2014, Regal Entertainment Return on Equity (ROE) was -13.68%                    0.15       2       0.30
 2    As of 2014, Regal Entertainment debt to equity ratio was -2.53                        0.15       2       0.30
 3    Regal Entertainment is only located in 42 US states and 3 US territories.             0.15       2       0.30
 4    Regal total revenues decreased from $3,038 million to $2,990 million in 2014.         0.12       2       0.24
 5    A large portion of employees are part time who are paid slightly above the
                                                                                            0.10       1
      minimum wage.                                                                                            0.10
 6    Earnings (EBITDA) decreased in 2014 from $606 million to $512 million.                0.10       2       0.20
 7    In 2014, the number of Regal screens decreased from 7,394 to 7,367.                   0.08       1       0.08
 8    Regal is a holding company dependent on subsidiaries for ability to service debt
                                                                                            0.05       1
      and pay dividends.                                                                                       0.05
 9    Income from operations decreased in 2014 from $340 million to $306 million.           0.05       2       0.10
 10   Long term debt increased from $2,187 million to $2,239 million                        0.05       2       0.10
      Total IFE Score                                                                       2.00       0       5.40

MBA 745: Three Year Strategic Plan for Regal Entertainment Group                                     7|Page
External Assessment In this section, using current financials, the value of Regal is examined more closely taking other factors into account, compared to Regal’s largest competitor, AMC Entertainment. By using the current financials from Regal’s form 10-K, the current income statement and balance sheets were able to be prepared. By using these current financial statements, a chart of historical ratios were able to be produced as shown below. These ratios include the return on equity (ROE) as well as the debt to equity ratio. Company Value Regal Entertainment Group Stockholders' Equity - (Goodwill + Intangibles) ($1,272) Net Income x 5 ($106) (Share Price/EPS) x Net Income $2,760,572,767 Number of Shares Outstanding x Share Price $2,760,572,767 Method Average $1,380,286,039 AMC Entertainment Holdings, Inc. Stockholders' Equity - (Goodwill + Intangibles) ($1,002,583) Net Income x 5 $320,400 (Share Price/EPS) x Net Income $1,666,080 Number of Shares Outstanding x Share Price $2,535,156 Method Average $879,763 Current Financial Statements and Ratios Income Statement 12/31/2014 12/31/2015 Percent Change Revenues $3,038 $2,990 -1 -1.58% Cost of Goods Sold 2,698 2,684 -1 -0.52% Gross Profit 340 306 -1 -10.00% Operating Expenses 75 128 1 70.67% EBIT 265 178 -1 -32.83% Interest Expense 141 126 -1 -10.64% EBT 124 52 -1 -58.06% Tax 107 73 -1 -31.40% Non-Recurring Events 0 0 #DIV/0! #DIV/0! Net Income 17 (21) -1 -225.88% MBA 745: Three Year Strategic Plan for Regal Entertainment Group 8|Page
Balance Sheet                            12/31/2014       12/31/2015             Percent Change
 Assets
 Cash and Equivalents                        $281             $147           -1       -48%
 Accounts Receivable                          123              126            1         2%
 Inventory                                     19               18           -1        -6%
 Other Current Assets                          42               50            1        19%
 Total Current Assets                         465              341           -1       -27%
 Property Plant & Equipment                  1,510            1,459          -1        -3%
 Goodwill                                     320              320            0         0%
 Intangibles                                   58               54           -1        -7%
 Other Long-Term Assets                       352              365            1         4%
 Total Assets                                2,705            2,539          -1        -6%

 Liabilities
 Accounts Payable                             170              166           -1        -3%
 Other Current Liabilities                    336              311           -1        -7%
 Total Current Liabilities                    506              477           -1        -6%
 Long-Term Debt                              2,188            2,239           1         2%
 Other Long-Term Liabilities                  730              721           -1        -1%
 Total Liabilities                           3,424            3,437           1         0%

 Equity
 Common Stock                                   0                0            0         0%
 Retained Earnings                             72               48           -1       -33%
 Treasury Stock                               (0)              (0)            0         0%
 Paid in Capital & Other                     (791)            (946)           1        20%
 Total Equity                                (719)            (898)           1        25%

 Total Liabilities and Equity                2,705            2,539          -1        -6%

                                                              Historical Ratios
                                                     12/31/2014                      12/31/2015
 Current Ratio                                           0.92                            0.71
 Quick Ratio                                             0.20                            0.14
 Debt-to-Total-Assets Ratio                              1.27                            1.35
 Debt-to-Equity Ratio                                   -4.76                           -3.83
 Times-Interest-Earned Ratio                              2                                1
 Inventory Turnover                                    159.89                          167.98
 Fixed Assets Turnover                                   2.01                            2.05
 Total Assets Turnover                                   1.12                            1.18

MBA 745: Three Year Strategic Plan for Regal Entertainment Group                  9|Page
Accounts Receivable Turnover 25 24
Average Collection Period 14.78 15.38
Gross Profit Margin % 11% 10%
Operating Profit Margin % 9% 6%
ROA % 1% -1%
ROE % -2% 2%
External Factor Evaluation (EFE)
The external factor evaluation allows strategists to summarize and evaluate economic, social, cultural,
demographic, environmental, political, governmental, legal, and technological information by focusing
on opportunities and threats of an organization. The external factor evaluation includes the opportunities
and threats for Regal Entertainment. Opportunities for Regal include growing the business through
expansions internationally as well as improving the existing theatres in the United States and abroad.
Disposable income is a very important opportunity of which Regal Entertainment should take advantage.
According to IBISWorld Business Environmental Report from March 2016, the United States per capita
disposable income has returned from low 2012 levels to become less volatile since early. Disposable
income has made a rebound in the US marketplace, and according to a chart from IBISWorld’s most
recent report, there seems to be steady levels of income forecasted until 2021 (IBISWorld). This is an
important factor which is necessary to understand to be able to make informed future financial decisions
for our company.
There are also threats that plague Regal Entertainment revenues that include video streaming, more
accessible online movies, increasing prices, and cyber security. The highest weighted scores for threats
to Regal include online streaming of movies, and admissions have decreased over 6% in the last three
(3) years.
Opportunities
Weighted
Opportunities Weight Rating
Score
1 The top growing markets in box office dollars in the world are Asia Pacific
($12.4 billion) and Chinese ($4.8 billion), both grew at 12% and 34% 0.30 4
respectively in 2014. 1.2
2 Last year, disposable income in the United States increased by 3% to $13.6
trillion. 0.20 4
0.8
3 The number of digital screens internationally grew by 16.4% in 2014 to 86,171
0.15 4
0.6
4 The value of entertainment and media in the United States is expected to increase
steadily from 2015 to 2019 approximately 22% to $723.4 billion. 0.10 4
0.4
5 In 2014, 86% of US and Canadian box offices used non-3D theatres. $8.94
billion are being spent on non-3D movies. 0.08 3
0.24
MBA 745: Three Year Strategic Plan for Regal Entertainment Group 10 | P a g e6 International box office market made up for 72% of the global box office in 2014
($26 billion). 0.05 3
0.15
7 Three of the top six films in 2014 in the US and Canada were distributed by
Disney. 14 of the top 25 films in 2014 were rated PG-13. 0.03 2
0.06
8 In 2014, 21% of Asia Pacific used analog screens versus 4% in the US and
Canada. 0.03 2
0.06
9 A movie theatre experience provides the most affordable entertainment, less than
$40 per family of four. 0.03 2
0.06
10 As of 2014, 50% of Regal Theatres in the United States feature premium
amenities. 0.03 2
0.06
Threats
Weighted
Threats Weight Rating
Score
1 By 2019, 80% of the world's internet traffic will be video streaming. 0.25 4 1.00
2 US and Canadian admissions have decreased by 6.6% since 2012. 0.20 4 0.80
3 Admissions (1.27 billion) and average ticket sold per person (3.7) both
declined by 6% in 2014. 0.15 4
0.60
4 73% of adult moviegoers own at least 4 types of technologies, increasing their
availability to other forms of entertainment. 0.10 3
0.30
5 Frequent moviegoers, who attend the movies at least 12 times per year drive
the movie industry in the US and Canada at 51%. 0.05 3
0.15
6 The Motion Picture Association of America (MPAA) says piracy costs $20.5
billion annually in the US. 0.05 3
0.15
7 Since 2012, the number of frequent moviegoers between the ages of 25 and 39
has decreased from $9.9 million in 2012 to $8.2 million in 2013 to $7.1 million 0.05 2
in 2014. 0.10
8 Global Cybersecurity spending as an industry spends more than $50 million
annually, rising 10% annually. 0.05 2
0.10
9 In 2014, the number of broadband connections increased 12% to 323 million
connections. 0.05 2
0.10
10 Video streaming services are now used by more than 42% of American
households has overtaken live TV as the viewing method of choice in the US. 0.05 2
0.10
Total EFE Score 2.00 0 7.03
Strategy Formulation
SWOT Analysis
The SWOT analysis is made up of strengths, weaknesses, opportunities, and threats which is an
important matching tool that allows managers to develop four types of strategies which can be found
below. The four strategies include: strengths-opportunities (SO) strategies, strengths-threats (ST)
strategies, weaknesses-opportunities (WO) strategies, and weaknesses-threats (WT) strategies. The SO
strategies include new offers as well as continuing to expand in the markets that are already saturated for
MBA 745: Three Year Strategic Plan for Regal Entertainment Group 11 | P a g eRegal Entertainment. Technology is also an important aspect of these strategies. The WO strategies offer
what can be for Regal, specifically expanding internationally as well as closing unproductive theatres.
The ST strategies include those which are strengths that defend against the threats including increasing
luxury within the theatres and reducing legal risks within the organization. The WT strategies are those
which apply action to those recommendations that help Regal compete with new streaming services by
revitalizing Regal’s website and then by driving traffic to that website.
Strength-Opportunity (SO) Strategy
SO Strategies
1
Offer monthly "Crown pass" allowing unlimited weekday movie entrance to select theatres (S1, S2, S9, O2, O4, O9).
2
Offer half priced kids candies for select candies to increase sales (S10, O7, O10).
3
Expand to the other 4 out of 50 US designated market areas (S2, S5, O2, O4).
4
Continue to convert theatres digital technology rather than analog for added value and experience (S1, S3, S6, T1,
T2, T10).
Weakness-Opportunity (WO) Strategy
WO Strategies
1
Open 5 Latin American locations in Brazil, Argentina, Colombia, Peru and Chile (W1,W3, W9, O3, O6).
2
Establish 10 new theatres in the Asia Pacific Market in China (W3, W6, O1, O8).
3
Close 5 least productive theatres in the US (W2, W6, W8, W9, W10, O1, O6, O10).
4
Integrate healthier concession choices to cater to younger and healthier moviegoers (W4, W9, O2, O4, O7, O9).
Strength-Threat (ST) Strategy
ST Strategies
1
Increase number of theatres that offer luxury reclining seating from 32 to 50 (S5, S9, T1, T3, T7).
2
Reduce legal employee risk by investing into Data Security and Privacy Training (S1, T4, T6, T8).
3
Add more theatres with IMAX and RPX technology for added value (S1, S3, S6, T1, T2, T10).
4
Offer half priced food and offer kid friendly snacks to cater to younger movies (S10, T2, T7).
Weakness-Threat (WT) Strategy
WT Strategies
1 Make website more interactive to include streaming of movie trailers to increase traffic (W7, T1, T4, T9, T10).
MBA 745: Three Year Strategic Plan for Regal Entertainment Group 12 | P a g e2 Continue upgrading theatres to include full luxury experience allowing for the higher ticket prices (W1, W9, T3, T4,
T5, T9).
3 Continue to develop the movie theatre experience to help differentiate it from online streaming (W7, T1, T4, T7, T9,
T10).
4 Implement no-cost training programs and videos to reduce turnover and part time employees (W5, W6, T7).
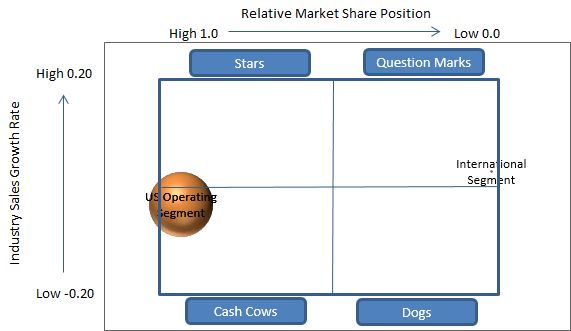
Boston Consulting Group (BCG) Matrix
Below is the BCG matrix for Regal Entertainment and it is designed specifically to enhance a
multidivisional firm’s efforts to formulate strategies. Unfortunately, the relative market share of the
company’s international sector is so small it is almost insignificant when compared to the United States
market share. This illustrates exactly how mature the US market is and how saturated it is with Regal
Entertainment theatres. This is important as this perfectly illustrates Regal Entertainment’s need to
expand and the opportunity that is there for the company.
Internal-External (IE) Matrix
The internal-external (IE) matrix found below for Regal Entertainment helps to position an
organization’s divisions or market segments in an easy to read display. The IE matrix is developed using
the EFE and IFE matrices using the company’s strengths, weaknesses, opportunities, and threats as its
foundation. As before, the international division of Regal Entertainment is just beginning to expand, and
MBA 745: Three Year Strategic Plan for Regal Entertainment Group 13 | P a g etherefore is currently weaker than the United States division which is much more mature as a market segment. Strategic Position and Action Evaluation MBA 745: Three Year Strategic Plan for Regal Entertainment Group 14 | P a g e
GRAND Strategy Matrix
The Grand strategy matrix has become very popular recently in being useful as a tool to formulate
alternative strategic management strategies. This matrix shows the firm in four quadrants usually
separated by way of division. The Grand strategy matrix is able to compare various market segments in
market growth versus the positioning of the firm.

MBA 745: Three Year Strategic Plan for Regal Entertainment Group                   15 | P a g e
Quantitative Strategic Planning Matrix (QSPM)
Stage one of the strategy formulation analytical framework is made up of the external factor evaluation
(EFE), internal factor evaluation (IFE), and the competitive profile matrix (CPM). Stage two includes
the SWOT matrix, SPACE matrix, Boston Consulting Group (BCG matrix, the grand strategy matrix, as
well as the internal-external matrix. This quantitative strategic planning (QSPM) matrix uses input
information from stage one to objectively evaluate feasible alternative strategies in stage two. As can be
seen from the figures below, the weighted score for establishing ten (10) new theatres to the Asia Pacific
market in China is 4.94 and the weighted score of closing the 5 least productive theatres in the United
States is 4.85.

                                                                     Establish 10 new theatres       Close 5 least
                                                                    in the Asia Pacific Market   productive theatres in
                                                                             in China.                 the US.
      Strengths                                            Weight         AS            TAS           AS          TAS
      Industry leading and largest domestic motion
      picture exhibitor operating 7,367 screens in 574      0.20          2             0.40           1          0.20
 1    theatres in 42 states.
      Regal operates in 46 of the top 50 U.S. designated
                                                            0.18          2             0.36           3          0.54
 2    market areas
      As of January 1, 2015, Regal had 86 IMAX and
                                                            0.15          0             0.00           0          0.00
 3    86 RPX theatres in the United States
      Regal Entertainment Group makes up about 20%
                                                            0.10          3             0.30           2          0.20
 4    of the total North American Box Office
      As of January 1, 2015, approximately 79% of
                                                            0.10          0             0.00           0          0.00
 5    theatres had 10 or more screens.
      Regal theatres have an average 12.8 screens per
      location which is above the North American            0.07          0             0.00           0          0.00
 6    industry average.
      As of January 1, 2015, Regal had 78% of their
      North American locations with stadium style           0.05          0             0.00           0          0.00
 7    seating.
      Regal offers luxury reclining seating in 336
      auditoriums at 32 select locations in North           0.05          0             0.00           0          0.00
 8    America.
      Frequent Moviegoer Loyalty Program called
      Regal Crown Club - 13 million active members as       0.05          0             0.00           0          0.00
 9    of January 1, 2015
      42% of Regal locations have premium amenity
      offerings, such as Expanded Food and Beverage         0.05          0             0.00           0          0.00
 10   Offerings in 185 locations

                                                                     Establish 10 new theatres      Close 10 least
                                                                    in the Asia Pacific Market   productive theatres in
                                                                             in China.                 the US.
      Weaknesses                                           Weight        AS             TAS           AS          TAS
      As of 2014, Regal Entertainment Return on
                                                            0.15          4             0.60           3          0.45
 1    Equity (ROE) was -13.68%
      As of 2014, Regal Entertainment debt to equity
                                                            0.15          1             0.15           4          0.60
 2    ratio was -2.53

MBA 745: Three Year Strategic Plan for Regal Entertainment Group                                 16 | P a g e
Regal Entertainment is only located in 42 US
0.15 4 0.60 2 0.30
3 states and 3 US territories.
Regal total revenues decreased from $3,038
0.12 4 0.48 3 0.36
4 million to $2,990 million in 2014.
A large portion of employees are part time who
0.10 0 0.00 0 0.00
5 are paid slightly above the minimum wage.
Earnings (EBITDA) decreased in 2014 from $606
0.10 3 0.30 4 0.40
6 million to $512 million.
In 2014, the number of Regal screens decreased
0.08 0 0.00 0 0.00
7 from 7,394 to 7,367.
Regal is a holding company dependent on
subsidiaries for ability to service debt and pay 0.05 2 0.10 3 0.15
8 dividends.
Income from operations decreased in 2014 from
0.05 2 0.10 3 0.15
9 $340 million to $306 million.
Long term debt increased from $2,187 million to
0.05 2 0.10 4 0.20
10 $2,239 million
Establish 10 new theatres Close 10 least
in the Asia Pacific Market productive theatres in
in China. the US.
Opportunities Weight AS TAS AS TAS
1 The top growing markets in box office dollars in
the world are Asia Pacific ($12.4 billion) and
0.30 4 1.20 2 0.60
Chinese ($4.8 billion), both grew at 12% and 34%
respectively in 2014.
2 Last year, disposable income in the United States
0.20 0 0.00 0 0.00
increased by 3% to $13.6 trillion.
3 The number of digital screens internationally
0.15 4 0.60 2 0.30
grew by 16.4% in 2014 to 86,171
4 The value of entertainment and media in the
United States is expected to increase steadily from
0.10 0 0.00 0 0.00
2015 to 2019 approximately 22% to $723.4
billion.
5 In 2014, 86% of US and Canadian box offices
used non-3D theatres. $8.94 billion are being 0.08 0 0.00 0 0.00
spent on non-3D movies.
6 International box office market made up for 72%
0.05 4 0.20 3 0.15
of the global box office in 2014 ($26 billion).
7 Three of the top six films in 2014 in the US and
Canada were distributed by Disney. 14 of the top 0.03 0 0.00 0 0.00
25 films in 2014 were rated PG-13.
8 In 2014, 21% of Asia Pacific used analog screens
0.03 4 0.12 2 0.06
versus 4% in the US and Canada.
9 A movie theatre experience provides the most
affordable entertainment, less than $40 per family 0.03 0 0.00 0 0.00
of four.
10 As of 2014, 50% of Regal Theatres in the United
0.03 0 0.00 0 0.00
States feature premium amenities.
MBA 745: Three Year Strategic Plan for Regal Entertainment Group 17 | P a g eEstablish 10 new theatres Close 10 least
in the Asia Pacific Market productive theatres in
in China. the US.
Threats Weight AS TAS AS TAS
By 2019, 80% of the world's internet traffic will
0.25 0 0.00 0 0.00
1 be video streaming.
US and Canadian admissions have decreased by
0.20 1 0.20 3 0.60
2 6.6% since 2012.
Admissions (1.27 billion) and average ticket sold
0.15 0 0.00 0 0.00
3 per person (3.7) both declined by 6% in 2014.
73% of adult moviegoers own at least 4 types of
technologies, increasing their availability to other 0.10 0 0.00 0 0.00
4 forms of entertainment.
Frequent moviegoers, who attend the movies at
least 12 times per year drive the movie industry in 0.05 1 0.05 2 0.10
5 the US and Canada at 51%.
The Motion Picture Association of America
(MPAA) says piracy costs $20.5 billion annually 0.05 0 0.00 0 0.00
6 in the US.
Since 2012, the number of frequent moviegoers
between the ages of 25 and 39 has decreased from
0.05 0 0.00 0 0.00
$9.9 million in 2012 to $8.2 million in 2013 to
7 $7.1 million in 2014.
Global Cybersecurity spending as an industry
spends more than $50 million annually, rising 0.05 0 0.00 0 0.00
8 10% annually.
In 2014, the number of broadband connections
0.05 0 0.00 0 0.00
9 increased 12% to 323 million connections.
Video streaming services are now used by more
than 42% of American households has overtaken
0.05 0 0.00 0 0.00
live TV as the viewing method of choice in the
10 US.
TOTALS 4.94 4.85
Recommendations
Below is a chart illustrating the top recommendations for Regal Entertainment along with the
coordinating costs in millions of dollars. Some of these recommendations add benefit with very little
investment, while others are more strategic in nature and require more capital to achieve the return. This
three year strategic plan for Regal Entertainment is one that will require the following recommendations
to be executed and paid for through debt and equity. Before the financing is illustrated in the financial
analysis later, the recommendations with costs are below.
MBA 745: Three Year Strategic Plan for Regal Entertainment Group 18 | P a g e3 Year Cost (in millions)
No. Recommendation
Enter into and open theatres in five (5) locations in Brazil, Argentina, Colombia,
$9,911
1 Peru, and Chile.
Expand to the other four (4) out of the fifty (50) US designated market areas by
$7,929
2 establishing a theatre in each of these areas.
3 Establish ten (10) new theatres in the Asia Pacific Market in China. $19,822
4 Close the five (5) least productive theatres in the United States $30
Increase the number of theatres that offer luxury reclining seating from thirty-two
$600
5 (32) to fifty (50) locations.
6 Reduce legal employee risk by investing into data security and privacy training $0.3
Implement no-cost training programs and videos to help reduce turnover and part
$1.4
7 time employees
Develop website to be more interactive to include streaming of movie trailers to
$17.2
8 increase web traffic.
9 Hire a new Chief Technology Officer and Chief Information Officer $0.3
Offer monthly “Crown Pass” allowing unlimited weekday movie entrance to select
$850
10 theatres for a specific monthly price.
TOTAL $39,161
Below each of these recommendations will be analyzed one by one to understand the benefit involved,
the origin of the research, and how much each of them costs. According to movie theatre models from
RSMeans.com, it costs $1,982 million to build a movie theatre with about 12,000 square feet. There is
nothing to be found that suggests that the cost to build would be different from Latin America to Asia,
therefore we will assume they have the same construction costs. Therefore, this is how we determine the
$9,911 million for the five locations in Latin America as well as the $19,822 million it will cost in the
Asian market for expansion purposes.
According to the SEC.com, a government website, and KFF.com, a Kaiser Family Foundation website,
the US population for ages 0-18 is highest in states: 1) Utah 2) Idaho and 3) Alaska. Similarly, for US
states which have persons aged 65 and over, leading those states in highest population include: 1) Maine
2) Florida and 3) Oregon. According to MPAA.org’s theatrical market statistics from 2014, these two
particular age ranges have the fewest movie goers per capita of any of the age groups. This means that if
Regal Entertainment is going to close any movie theatres, then Regal would be most likely to choose
those five least productive theatres to close in these particular states, according to population statistics.
As of January 1, 2015, Regal Entertainment employed approximately 23,168 employees. Based on
knowing this number, and having a quote from Truvincio, a leader in North American data security
training, we are able to accurately predict the cost for data security and compliance training for all Regal
employees. At $12 per seat to train, and 23,168 employees, the total cost of the training would be
$278,016. This is equivalent to $0.28 million within the recommendations. Based on people-trak.com,
large corporations can expect to pay up to $60 per person for personalized training to help reduce
turnover within business. For every employee, this would be a $1.4 million cost to Regal Entertainment
MBA 745: Three Year Strategic Plan for Regal Entertainment Group 19 | P a g ein order to do the most to reduce turnover within the company. According to Cinemablend.com, Regal
Entertainment’s direct competitor, AMC Entertainment recently spent over $600 million to renovate and
revitalize almost 1,800 auditoriums with luxury reclining seating. Regal averages approximately 12
auditoriums per theatre, and therefore this would mean that to improve and renovate the rest of their
planned theatres within their portfolio will cost Regal approximately $600 million.
Today, Netflix has over 40 million subscribers and that number is only going to grow and accelerate.
According to webtegrity.com, experts in website design for business solutions, approximately every 14
hours of website design, banners inclusion, editing, programming, and entire project management costs
approximately $25,000 for multimillion dollar company website designs. Regal will want to add video
capability as well as unlimited bandwidth and personalize each of the 574 theatres. This will bring the
subtotal to approximately $30,000 per location. For 574 locations, this would mean $17.2 million in
website redesign to be able to compete with YouTube and Redbox in streaming and availability.
According to bizjournals.com, AMC recently closed less productive movie theatres in the United States,
and their costs added to around $60 million for closing 10 theatres. If we extrapolate these costs, then
that would mean the cost per movie theatre close would be about $6 million including breaking leases
and other related expenses. If Regal closes five (5) theatres, then that closing cost total would be $30
million.
EPS/EBIT Analysis
For the Regal Entertainment recommendations, the total dollar with debt and equity financing would be
$19,580 million which would be spread out over the next three years. Regal Entertainment is under
substantial lease and debt obligations currently which leaves little debt to be used to finance any
upcoming strategies. Similarly, Cash and cash equivalents have not been extraordinary for Regal.
Therefore, it makes more sense to split the financing of 50% debt and 50% equity while keeping the
total amount of investment relatively low for monetary risk reasons.
$ Amount of Capital Needed $19,580
EBIT Range $513 - $606
Interest Rate 4%
Tax Rate 15%
Stock Price $20.84
Shares Outstanding 132,465,104
Common Stock Financing Debt Financing
Recession Normal Boom Recession Normal Boom
EBIT $513 $560 $606 $513 $560 $606
Interest 0 0 0 2 2 2
EBT 513 560 606 511 558 604
Taxes 77 84 91 77 84 91
EAT 436 476 515 435 475 514
MBA 745: Three Year Strategic Plan for Regal Entertainment Group 20 | P a g e# Shares 132,465,106 132,465,106 132,465,106 132,465,104 132,465,104 132,465,104
EPS $0.00 $0.00 $0.00 $0.00 $0.00 $0.00
Stock 50% Debt 50%
Recession Normal Boom
EBIT $513 $560 $606
Interest 1 1 1
EBT 512 559 605
Taxes 77 84 91
EAT 435 475 514
# Shares 132,465,105 132,465,105 132,465,105
EPS $0.00 $0.00 $0.00
Pro Forma Financial Statements and Ratios
Projected Income Statement 12/31/2015 12/31/2017 12/31/2018
Revenues $3,349 $3,684 $3,978
Cost of Goods Sold 268 184 199
Gross Profit 3,081 3,499 3,779
Operating Expenses 268 184 199
EBIT 2,813 3,315 3,581
Interest Expense 256 397 549
EBT 2,557 2,918 3,032
Tax 384 438 455
Non-Recurring Events 0 0 0
Net Income 2,173 2,481 2,577
Projected Balance Sheet 12/31/2015 12/31/2017 12/31/2018
Assets
Cash and Equivalents ($25) ($2) $29
Accounts Receivable 248 357 452
Inventory 1,997 4,026 6,074
Other Current Assets 50 50 50
Total Current Assets 2,270 4,431 6,605
Property Plant & Equipment 4,102 6,745 9,388
Goodwill 695 1,145 1,670
Intangibles 89 139 214
MBA 745: Three Year Strategic Plan for Regal Entertainment Group 21 | P a g eOther Long-Term Assets 383 402 422
Total Assets 7,539 12,862 18,299
Liabilities
Accounts Payable 349 549 766
Other Current Liabilities 311 311 311
Total Current Liabilities 660 860 1,077
Long-Term Debt 4,882 7,525 10,168
Other Long-Term Liabilities 721 721 721
Total Liabilities 6,263 9,106 11,966
Equity
Common Stock 0 0 0
Retained Earnings 2,222 4,702 7,279
Treasury Stock (0) (0) (0)
Paid in Capital & Other (946) (946) (946)
Total Equity 1,276 3,756 6,333
Total Liabilities and Equity 7,539 12,862 18,299
Projected Ratios
12/31/2015 12/31/2017 12/31/2018
Current Ratio 3.44 5.15 6.13
Quick Ratio 0.41 0.47 0.49
Debt-to-Total-Assets Ratio 0.83 0.71 0.65
Debt-to-Equity Ratio 4.91 2.42 1.89
Times-Interest-Earned 11 8 7
Ratio
Inventory Turnover 1.68 0.92 0.66
Fixed Assets Turnover 0.82 0.55 0.42
Total Assets Turnover 0.44 0.29 0.22
Accounts Receivable 14 10 9
Turnover
Average Collection Period 27.03 35.37 41.47
Gross Profit Margin % 92% 95% 95%
Operating Profit Margin % 84% 90% 90%
ROA % 29% 19% 14%
ROE % 170% 66% 41%
MBA 745: Three Year Strategic Plan for Regal Entertainment Group 22 | P a g eNotes for Projected Income Statement: 1) Revenues- A 12% increase for the first year due to risk mitigation, crown pass sales, and completion of luxury seating upgrades. Then 10% and 8% thereafter year over year. 2) COGS/Operating Expenses - I would suggest there be an 8% increase due to the expansion in other markets, establishing new theatres, and shutting down poor performing theatres will cost money as well. Hiring new vice presidents and chief officers will not be inexpensive either. 3) Interest Expense - 4% interest rate on $2,241.9 million in debt = $89.7 million 4) Tax Rate- even though I anticipate a 12% increase in revenues, I expect very little change in tax rates considering the 50-50 split of debt versus equity. Notes for Projected Balance Sheet: 1) Dividends – Regal was paying a dividend, but will not increase their dividend over the next three years. 2) Paid in Capital & Other – I am predicting no increase in paid in capital because there was no adjustment to treasury stock. 3) Treasury stock - I expect no change at all 4) Common stock – I expect no change at all 5) Other long-term liabilities – No change in other long term liabilities. 6) Long Term Debt - $6,527 million is for the new property expansions and establishing new theatres, which totaled $19,580 million over three years. 7) Other Current-Liabilities – No additional liabilities 8) Accounts Payable – I forecast an increase of 10% in accounts payable due to increased sales volume domestically and abroad year over year. 9) Other long-term assets – Forecasted to increase by 5% due to the increased number of theatres 10) Intangibles - Increase by 10% due to the upgrade of Regal Entertainment’s website functionality as well as the experience within the theatres. 11) Goodwill- Increase by 20% due to the luxury seating, differentiated concessions offering, and increasing movie experience reach throughout the world. 12) Property, Plant, & Equipment- Increase of $7,275 for the additional properties around the world and in the United States. This is the total $19,580 million divided by three. 13) Other Current Assets – No other current assets 14) Inventory- Decrease by 5% due to the new theatres that were added MBA 745: Three Year Strategic Plan for Regal Entertainment Group 23 | P a g e
15) Accounts Receivables – There is a growing concern that there is too much cash outstanding.
Therefore, we will need to decrease this amount by 10% so that we can use the cash to help pay off
some of our debt obligations
16) The Cash & Cash Equivalents – Forecasted to increase over time as the recommendations should be
adding dollars back as profit to Regal.

MBA 745: Three Year Strategic Plan for Regal Entertainment Group                    24 | P a g e
References
How Much Should I Budget For A Website Design? Web. Retrieved 11 Mar 2016.
http://webtegrity.com/our-blog/web-design-tips/how-much-should-i-budget-for-a-website-design/
IBISWorld. 16 May 2009. Industry Risk Rating Report. 51213: Movie Theatres in the US.
http://moneysoft.com/wp-content/uploads/2010/04/ibisr1.pdf
Ibis World Risk in US. Ulama, D. (2014). Movie Theaters in the US. IBISWORLD.
MPAA Theatrical Market Statistics (2014). Global Box Office. Motion Picture Association of America.
http://www.mpaa.org/wp-content/uploads/2015/03/MPAA-Theatrical-Market-Statistics-2014.pdf
Puchko, Kristy. 14 Mar 2014. AMC Movie Theatres Will Spend $600 Million to Make Seats More
Comfy. Web. Movie News. 16 Mar 2016. http://www.cinemablend.com/new/AMC-Movie-Theaters-
Spend-600-Million-Make-Seats-More-Comfy-43781.html
REMeans-From the Gordian Group. Construction Cost Estimates for Movie Theaters (2013). Web.
https://www.rsmeans.com/models/movie-theater.aspx
Regal Entertainment Group’s Net Income From 2006 to 2015 (in millions). Statistica – The Statistics
Portal. Web. Retrieved 9 Mar 2016. http://www.statista.com/statistics/237769/value-of-the-us-
entertainment-and-media-market/
Smith, Craig. 21 Jan 2016. By the Numbers: Amazing Netflix Statistics and Facts. Digital
Stats/Gadgets. Web. 20 Feb 2016. http://expandedramblings.conetflixm/index.php/_statistics-facts/
Telles, Daniel. 10 Jun 2013. How Much Does HR Software Cost? Web. 12 Mar 2016.
http://www.people-trak.com/blog/06/10/2013/how-much-does-hr-software-cost/
The Henry J. Kaiser Family Foundation. Population Distribution by Age. 2014 Summary. 8 Mar 2016.
http://kff.org/other/state-indicator/distribution-by-age/
Twiddy, David. 4 Apr 2011. AMC Entertainment will close parts of 10 Movie Theatres. Web. 7 Mar
2016. http://www.bizjournals.com/kansascity/news/2011/04/04/amc-entertainment-will-close-parts-
of.html
United States Securities and Exchange Commission Form 10-K. Regal Entertainment Group. Web. 9
Feb 2016. Retrieved from
http://www.sec.gov/Archives/edgar/data/1168696/000116869615000004/rgc201410k.htm

MBA 745: Three Year Strategic Plan for Regal Entertainment Group                    25 | P a g e
Appendix 1: Truvincio Proposal
Truvincio Proposal for Data Security and Compliance Solutions
It is hard to open any news source and not see something about data or cyber security and how it is
negatively impacting a company, a marketplace, the government or our country as a whole. The problem
seems to be spiraling out of control with no sign of getting better. Every business, regardless of industry
is now a target. While many people think that the problem is limited to credit cards and personal
information, the truth is that it is far larger. Any piece of information that you have can be of value to
someone else, from trade secrets and intellectual property to bid specifications, all of it can be used
against you if it gets out.
While this may seem disheartening and cause paralysis in businesses as even if they want to do
something, they are left not knowing what to do, the answer doesn’t have to be that difficult or that
expensive. This is where Truvincio can help.
The Issues
Data security and privacy, collectively referred to today as cybersecurity, is an issue that every
organization must address in the near future if it wishes to have any chance to survive. Because of the
pervasive use of information and technology, the issues associated with cybersecurity are far-reaching
and exist within every facet of an organization and how it does business. Additionally, the fact that in
order for information to be of use it must be made available, the number of people who have access to
sensitive information is often surprising to organizations. Even further, this information may be
available to individuals who may seem to have no reasonable need for it, but who may be able to access
it inadvertently. This includes, but is not limited to cleaning crews, construction or painting crews, plant
workers and many more. This also includes many individuals who do not actually work for the
organization, but are directly or indirectly contracted to provide services to the organization. In other
words, a traditional approach to addressing who has access to information is not only out of date, it is
dangerously misleading. The proof of this fact is that the root cause of more than 80% of all data
breaches is employee error. And 40-50% of all data losses are the result of the actions of third party
service providers.
The legal requirements to protect information are all around you, and most people don’t think about it or
understand it until it is too late. It isn’t just industry specific laws like HIPAA and Gramm Leach Bliley
or industry standards such as PCI. Virtually every state has laws that require the protection of data and
notification in the event of a breach or loss. Additionally, virtually every contract a company has
includes specific requirements to take reasonable efforts to protect any sensitive information. Your
insurance policies require similar precautions in order to be valid. Even your bank accounts require due
diligence regarding data protection. In short, the requirements are everywhere you look. You’ve seen
them a thousand times, but probably never even thought about what they really meant.
When most people think about cyber security, they immediately think of technology. The problem is
that the primary problem is not the technology, but how that technology is used. If you were to compare
a company that has relatively poor technology, but makes excellent use of it with a company that has
cutting edge technology, but makes poor use of it, the better result will almost always be that of the

MBA 745: Three Year Strategic Plan for Regal Entertainment Group                         26 | P a g e
former organization. There are several good examples of this. The Sony breach of 2014 was initiated by
nearly 100 computers that had no or poor passwords. This is by no means a unique example, but it is a
clear case to take note of. One reason that many people focus on the high tech nature of many attacks is
that from a public perception, they do not wish to admit that they failed to take many of the basic
precautions that they should have.
This is not to say that there aren’t some serious technology issues to address, but according to James
Lyne is his 2013 TED Talk, he pointed out that >98% of cyber-attacks would be prevented by doing the
basics. Even if this number is high, the percentage of risk that can be avoided by doing the basics is
very high.
So while the problem seems to be complex and difficult, the way to effectively address it, doesn’t have
to be.
The Approach
The traditional approach to implementing a data security and privacy program is to look to the laws and
regulations as to what they require, then implement a program that addresses those requirements. And
while this generally leads to a program that is compliant with the laws, this may or may not have any
correlation with helping to actually address the problem, being secure.
A better approach is to first look to implement activities that solve the problem. The laws and
regulations provide some guidance as to what these activities are, but must be transformed to work for
an organization. At its core, a good security and privacy program needs to do five things. See Figure 1.

                                                 Figure 1

Any organization that can do the following five things is well on its way to having a living, breathing
Culture of Security, which is essential to preventing a data loss.

MBA 745: Three Year Strategic Plan for Regal Entertainment Group                       27 | P a g e
Authentication – Making sure that every person or organization is who they say they are. This is
both with customers and with employees and third parties.
Keep information safe – Once information is collected, it must be kept safe. An example of this
would be keeping information in a locked file cabinet.
Keep information private – Distinct from keeping information safe, this is about making sure that
only those people who need access to information are actually able to see it.
Proper destruction of information – When it is no longer needed, information must be properly
disposed of.
Oversight of 3rd parties – You have to take reasonable steps to make sure that everyone you do
business with takes the same care when it comes to protecting information.
As a company works to do the right things to protect information, the step to compliance is very easy.
Since compliance is intended to measure the effectiveness of achieving the desired result, if a company
is doing the right things, then it should be relatively easy to be able to demonstrate this to a regulator or
auditor.
Take as a whole, the overall intention of the approach should be one of reducing risk, not eliminating it.
Additionally, security is a process, not a one-time activity. The goal is to, over time, improve behaviors
to make your business more secure, but it is also about be prepared for when a risk or concern does
appear. The best weapon a company has to protecting itself from a data loss are engaged, educated
employees and the worst risk is an uneducated or careless employee.
One last point that is critical to the success of any approach to data security is continuity. In order to be
effective, security should be addressed the same way, throughout the organization. Once a process is
created and put in place, it should be mirrored at every other plant as identically as possible. When
everyone is doing the same things, it is far easier to determine when something is out of place or out of
the ordinary. It is about creating good habits that are practiced by everyone, and the simpler the
processes and habits, the better.
The Solution
The difference between doing security well and doing it poorly is very thin, and it is generally not a
question of how much money is spent trying to address it. The difference is the actions of the
employees.
The best starting point for creating a Culture of Security is to develop and implement policies and
procedures for how the company systematically addresses these issues. This is supplemented with
employee training. Together, these actions help create an environment where everyone is aware of the
issues and has a basic understanding of what to do. This fundamental knowledge is also important
because it helps to better understand what technology needs to be purchased.
The policies and procedures should be written at the sixth grade level so that they are easily understood.
If an employee can’t understand the policy, then they can’t follow it. And having policies and
procedures that don’t match how you do business can be worse than not having policies at all.
Employee training should be done for EVERY employee. There is always a temptation to try to save
money by only training some employees, but the only laws that work perfectly are Murphy’s Law and
the Law of Unintended Consequences. Sure enough the one employee you don’t train will be the one
MBA 745: Three Year Strategic Plan for Regal Entertainment Group 28 | P a g eYou can also read