3Q 2015 Results Presentation 29 October 2015 - CDL ...
←
→
Page content transcription
If your browser does not render page correctly, please read the page content below
3Q 2015 Results Presentation
29 October 2015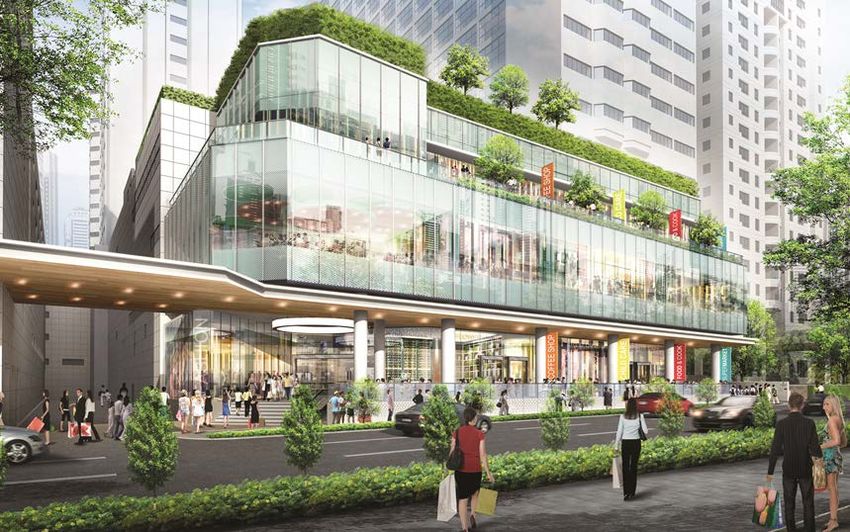
Disclaimer

The value of Stapled Securities and the income derived from them may fall as well as rise. Stapled Securities are not obligations of, deposits in, or
guaranteed by the H-REIT Manager or M&C Business Trust Management Limited, as trustee-manager of CDL Hospitality Business Trust (the “HBT
Trustee-Manager”), or any of their respective affiliates.
An investment in Stapled Securities is subject to investment risks, including the possible loss of the principal amount invested. Investors have no
right to request that the H-REIT Manager and/or the HBT Trustee-Manager redeem or purchase their Stapled Securities while the Stapled
Securities are listed. It is intended that holders of the Stapled Securities may only deal in their Stapled Securities through trading on Singapore
Exchange Securities Trading Limited (the “SGX-ST”). Listing of the Stapled Securities on the SGX-ST does not guarantee a liquid market for the
Stapled Securities.
This presentation contains certain tables and other statistical analyses (the “Statistical Information") which have been prepared by the H-REIT
Manager and the HBT Trustee-Manager. Numerous assumptions were used in preparing the Statistical Information, which may or may not be
reflected herein. As such, no assurance can be given as to the Statistical Information’s accuracy, appropriateness or completeness in any particular
context, nor as to whether the Statistical Information and/or the assumptions upon which they are based reflect present market conditions or future
market performance. The Statistical Information should not be construed as either projections or predictions or as legal, tax, financial or accounting
advice.
Market data and certain industry forecasts used throughout this presentation were obtained from internal surveys, market research, publicly
available information and industry publications. Industry publications generally state that the information that they contain has been obtained from
sources believed to be reliable but that the accuracy and completeness of that information is not guaranteed. Similarly, internal surveys, industry
forecasts and market research, while believed to be reliable, have not been independently verified by the H-REIT Manager or the HBT Trustee-
Manager and neither the H-REIT Manager nor the HBT Trustee-Manager makes any representations as to the accuracy or completeness of such
information.
This document may contain forward-looking statements that involve assumptions, risks and uncertainties. Actual future performance, outcomes and
results may differ materially from those expressed in forward-looking statements as a result of a number of risks, uncertainties and assumptions.
Representative examples of these factors include (without limitation) general industry and economic conditions, interest rate trends, cost of capital
and capital availability, competition from other developments or companies, shifts in expected levels of occupancy rate, property rental income,
charge out collections, changes in operating expenses (including employee wages, benefits and training costs), governmental and public policy
changes and the continued availability of financing in the amounts and the terms necessary to support future business. Predictions, projections or
forecasts of the economy or economic trends of the markets are not necessarily indicative of the future or likely performance of CDL Hospitality
Trusts.
You are cautioned not to place undue reliance on these forward-looking statements, which are based on the current view of management on future
events.
This document and its contents shall not be disclosed without the prior written permission of the H-REIT Manager or the HBT Trustee-Manager.

                                                                                                                                                         2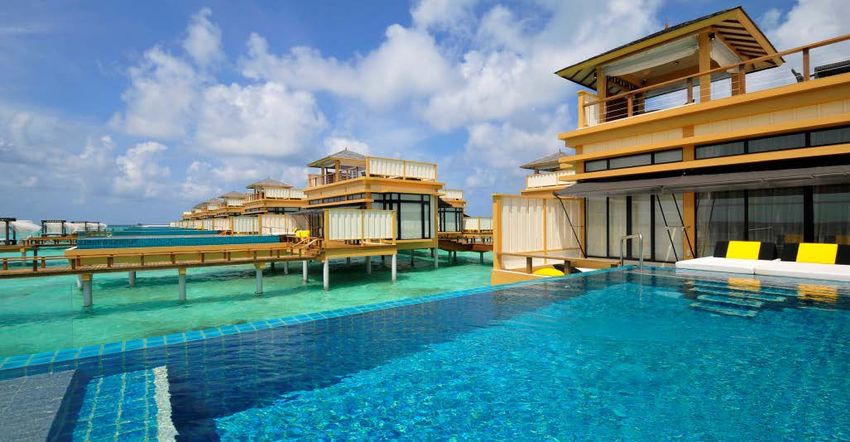
About CDL Hospitality Trusts
CDL Hospitality Trusts ("CDLHT") is a stapled group comprising CDL Hospitality Real Estate Investment Trust
(“H-REIT”), a real estate investment trust, and CDL Hospitality Business Trust (“HBT”), a business trust. CDLHT
was listed on the Singapore Exchange Securities Trading Limited on 19 July 2006. M&C REIT Management
Limited is the manager of H-REIT, the first hotel real estate investment trust in Singapore, and M&C Business
Trust Management Limited is the trustee-manager of CDL Hospitality Business Trust.
CDLHT was established with the principal investment strategy of investing, directly or indirectly, in a diversified
portfolio of income-producing real estate, which is primarily used for hospitality and/or hospitality-related
purposes, whether wholly or partially, and real estate-related assets in relation to the foregoing.
As at 1 October 2015, CDLHT owns 15 hotels and two resorts with a total of 4,909 rooms, comprising:
i. six hotels in Singapore (Orchard Hotel, Grand Copthorne Waterfront Hotel, M Hotel, Copthorne King’s
Hotel, Novotel Singapore Clarke Quay and Studio M Hotel) as well as a shopping arcade adjoining
Orchard Hotel (Claymore Connect);
ii. five hotels in Australia’s key gateway cities of Brisbane and Perth (Novotel Brisbane, Mercure Brisbane,
Ibis Brisbane, Mercure Perth and Ibis Perth);
iii. two hotels in Japan's gateway city of Tokyo (Hotel MyStays Asakusabashi and Hotel MyStays Kamata);
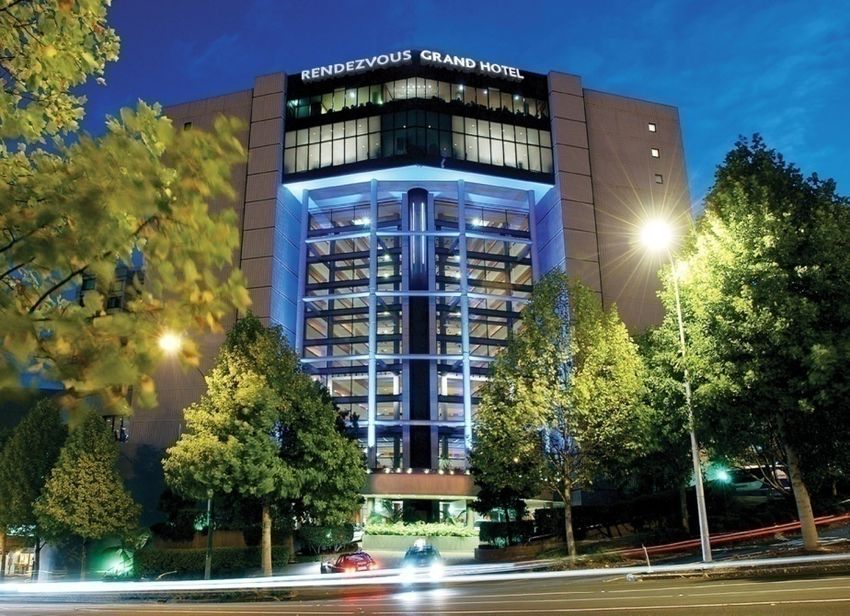
iv. one hotel in New Zealand’s gateway city of Auckland (Rendezvous Grand Hotel Auckland);
v. one hotel in Cambridge, United Kingdom (Cambridge City Hotel); and
vi. two resorts in Maldives (Angsana Velavaru and Jumeirah Dhevanafushi).
3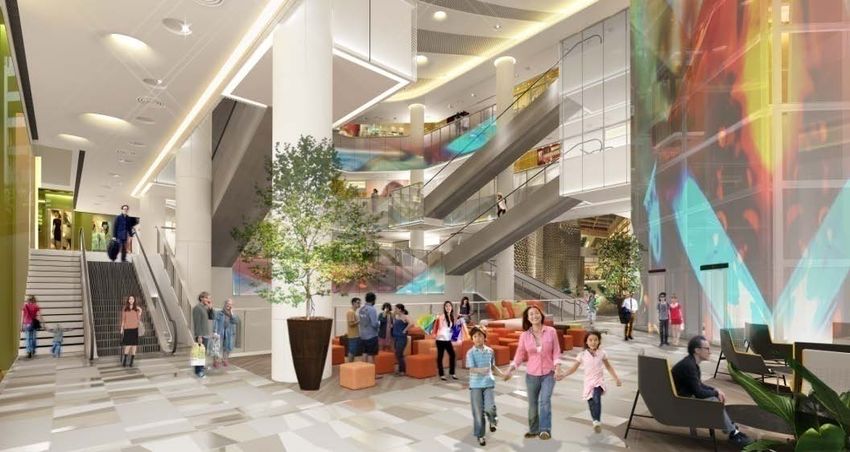
Table of Contents
Results Highlights

                     5
Portfolio Performance

                        8
Acquisition of Cambridge City Hotel

                                      15
Healthy Financial Position

                             18
Asset Enhancement Plans

                          22
Outlook

          27
Annexe 38
Background and Structure
 of CDL Hospitality Trusts

                             38
Information on
CDL Hospitality Trusts Properties

                                    52
4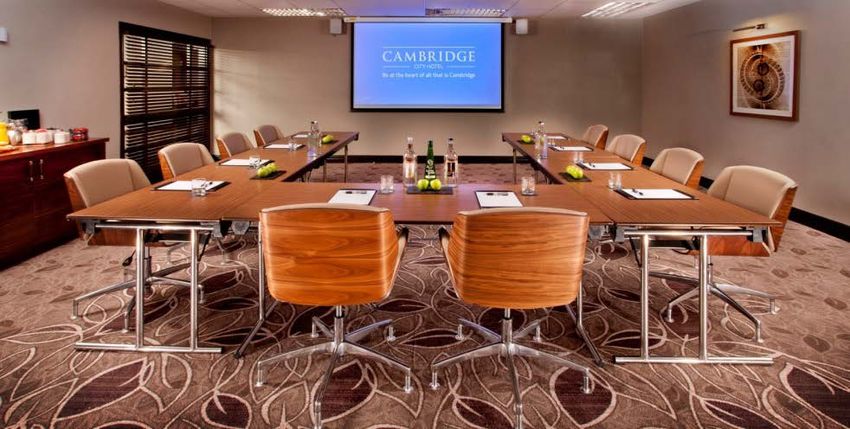
Results Highlights
5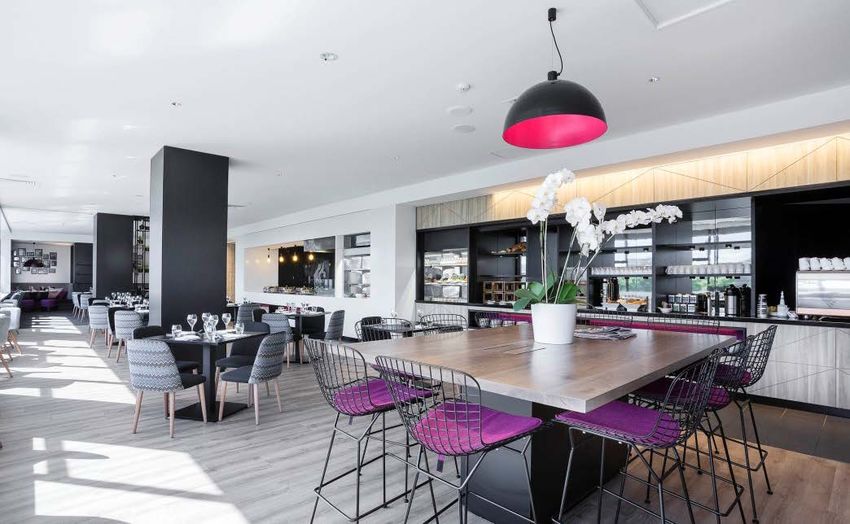
Results Highlights (3Q 2015)
Net property income (“NPI”) declined marginally by 2.2% year-on-year (“y-o-y”) in 3Q 2015
Inorganic NPI contribution of S$1.3 million from the acquisition of the Japan Hotels in end 2014 mitigated the drop in other
markets:
Singapore saw a decline of S$1.3 million due to soft trading environment
Australia and New Zealand recorded lower fixed rents in Singapore dollar terms due to the weakening of Australia dollar
(“AUD”) and New Zealand dollar (“NZD”) against Singapore dollar (“SGD”)
Income available for distribution showed a y-o-y decline mainly due to:
Decline in contributions from the Singapore, Australia and New Zealand Hotels; and
Incremental interest expenses due to the lengthening of the fixed rate tenor of its US dollar (“USD”) and SGD loans,
general rise in interest rates and increased borrowings for Japan Hotels and AEI of Claymore Connect.
The income from the Japan Hotels are only available for distribution in 4Q 2015 once the financial results for the first fiscal
year ending 30 September 2015 are audited
3Q ’15 3Q ’14
Y-o-Y Change
S$’000 S$’000
Net Property Income 33,080 33,823 -2.2%
Income available for distribution (before
25,880 28,425 -9.0%
deducting for working capital)
Income available for distribution (after
23,292 25,582 -9.0%
deducting for working capital)
DPU (1) cents 2.36 2.61 -9.7%
(1) Represents income available for distribution per Stapled Security (after deducting income retained for working capital). Income available for distribution per Stapled
Security (before deducting income retained for working capital) for 3Q 2015 is 2.62 cents. 6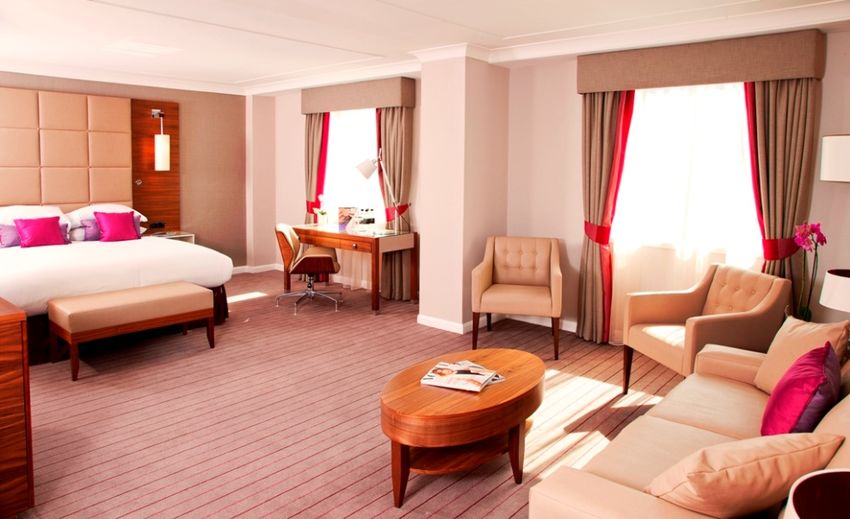
Results Highlights (YTD Sep 2015)
NPI declined by 2.6% y-o-y to S$99.2 million for YTD Sep 2015:
Inorganic NPI contribution of S$4.1 million from the acquisition of the Japan Hotels in end 2014 and higher contribution
from Maldives due to strength of USD, mitigated the drop in overall NPI
Singapore saw a decline of S$5.4 million due to weaker demand
Australia and New Zealand recorded lower rents in SGD terms due to the weakening of AUD and NZD against SGD
Income available for distribution showed a y-o-y decline mainly due to:
Decline in contributions from the Singapore, Australia and New Zealand Hotels; and
Incremental interest expenses due to the lengthening of the fixed rate tenor of its USD and SGD loans, general rise in
interest rates and increased borrowings for Japan Hotels and AEI of Claymore Connect.
The income from the Japan Hotels are only available for distribution in 4Q 2015 once the financial results for the first fiscal
year ending 30 September 2015 are audited
YTD Sep ’15 YTD Sep ’14
Y-o-Y Change
S$’000 S$’000
Net Property Income 99,198 101,879 -2.6%
Income available for distribution (before
77,114 85,398 -9.7%
deducting for working capital)
Income available for distribution (after
69,403 76,858 -9.7%
deducting for working capital)
DPU (1) cents 7.05 7.86 -10.3%
(1) Represents income available for distribution per Stapled Security (after deducting income retained for working capital). Income available for distribution per Stapled
Security (before deducting income retained for working capital) for YTD Sep 2015 is 7.82 cents. 7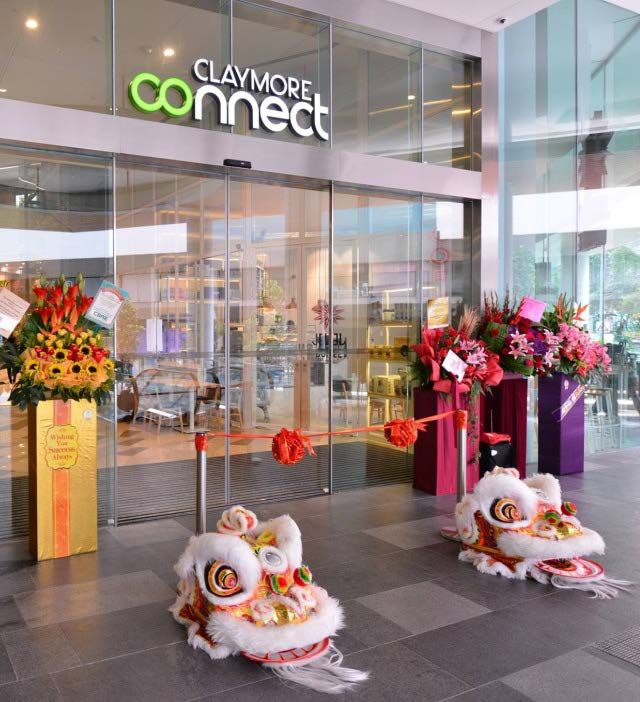
Portfolio Performance
8
Singapore Properties Performance
Performance of Singapore Properties
Y-o-Y Y-o-Y
CDLHT Singapore Hotels 3Q ’15 3Q ’14 YTD Sep ’15 YTD Sep ’14
Change Change
Occupancy 90.2% 92.0% -1.8pp 88.2% 88.9% -0.7pp
ARR S$201 S$209 -3.8% S$199 S$212 -6.1%
RevPAR S$181 S$192 -5.7% S$176 S$188 -6.4%
Room rates remained competitive as a result of new hotel supply
and slower global economic growth continued to affect corporate
demand
More public holidays (especially on weekdays) in 3Q 2015 as
compared to 3Q 2014, had the effect of disrupting corporate travel
momentum
The transboundary haze issue has also dampened travel to
Singapore
Despite above, the Singapore Hotels delivered a robust average
occupancy of 90.2% for the quarter
Claymore Connect officially opened on 8 October 2015. As at 30
September 2015, committed occupancy of Claymore Connect is
81% (1). Majority of the tenants have commenced operations
(1) Inclusive of the adjoining Galleria which is not part of the asset enhancement exercise. 9
Overseas Hotels Performance
Performance of Australia Hotels
Rent contribution for 3Q 2015 saw a decrease of
12.9% y-o-y due to weaker AUD during the
quarter
Performance of Australia Hotels continues to be
affected by the lacklustre Australian economy as
well as the lack of new investments in the mining
sector due to low commodity prices
Mitigated by the defensive lease structure which
provides CDLHT with a high proportion of fixed
rent
Mercure Brisbane Restaurant: Post-refurbishment
Performance of New Zealand Hotel
Fixed rent contribution for 3Q 2015 from Rendezvous Grand Hotel Auckland decreased 9.6% y-o-y mainly
due to the weaker NZD during the quarter
10Overseas Hotels Performance
Performance of Maldives Resorts
The Maldives Resorts recorded a 18.3% y-o-y RevPAR decline in 3Q 2015 mainly due to:
Slowdown in Chinese luxury travel
Devaluation of Chinese yuan in August 2015 and the continued strength of the USD against most
currencies, including the euro and Russian rouble, has weighed down on the performance of the tourism
sector
The underlying weakness in the performance of the resorts in 3Q 2015 is mitigated by the recognition of
only minimum rent for Angsana Velavaru (1) and the positive foreign currency translation as a result of the
strong USD against SGD
InOcean Villa, Angsana Velavaru Ocean Sanctuary, Jumeirah Dhevanafushi
(1) Pro rated minimum rent of US$1.5 million is recognised each quarter. Variable rent will only be recognised in 4Q 2015 once the full year performance of Angsana
Velavaru is determined. 11Overseas Hotels Performance
Performance of Japan Hotels
The Japan Hotels recorded a stellar RevPAR growth of 20.9% (1) in 3Q 2015 mainly due to the robust
growth in visitor arrivals
For YTD September 2015, foreign visitors grew 48.8% y-o-y to 14.5 million. The weak yen and the
numerous favourable government policies towards tourism have been successful in attracting foreign
tourists into Japan
Income from the properties accruing for 3Q 2015 and YTD Sep 2015 was recognised in the NPI but not for
Income Available for Distribution for the same periods. The corresponding cash distribution will be
recognised in 4Q 2015
Double Room, Hotel MyStays Asakusabashi Twin Room, Hotel MyStays Kamata
(1) The y-o-y RevPAR comparison assumes H-REIT, through the Japan trust, owned the Japan Hotels for the quarter ended 30 September 2014.
Image Credit: Dave Powell (http://bit.ly/1ynUN9P) 12Gross Revenue Performance by Country
3Q’15 3Q’14 Change Y-o-Y YTD Sep ‘15 YTD Sep ‘14 Change Y-o-Y
S$’000 S$’000 S$’000 Change S$ ‘000 S$ ‘000 S$ ‘000 Change
Master Leases Gross Rent
Singapore 25,957 27,058 -1,101 -4.1% 73,775 79,200 -5,425 -6.9%
- Hotels 24,339 26,613 -2,274 -8.5% 71,241 77,873 -6,632 -8.5%
- Claymore Connect 1,618 445 (1) 1,173 N.M. 2,534 1,327 (1) 1,207 N.M.
Australia 3,424 3,933 -509 -12.9% 11,726 12,965 -1,239 -9.6%
New Zealand 2,291 2,533 -242 -9.6% 7,263 7,697 -434 -5.6%
Maldives –
2,090 1,883 207 11.0% 6,120 5,669 451 8.0%
Angsana Velavaru
Management Contracts Gross Hotel Revenue
Maldives –
4,910 4,706 204 4.3% 16,243 16,187 56 0.3%
Jumeirah Dhevanafushi
Japan (2) 2,412 - 2,412 N.M. 7,170 - 7,170 N.M.
Total 41,084 40,113 971 2.4% 122,297 121,718 579 0.5%
N.M. denotes Not Meaningful
(1) Note that apart from Galleria, no income was recorded for Claymore Connect in 3Q and YTD Sep 2014 as the mall was undergoing asset enhancement works.
(2) Acquisition of the Japan Hotels was completed on 19 December 2014. Contribution from the Japan Hotels for the nine months ended 30 September 2015 includes
the last 13 days of FY 2014. 13NPI Performance by Country
3Q’15 3Q’14 Change Y-o-Y YTD Sep ‘15 YTD Sep ‘14 Change Y-o-Y
S$’000 S$’000 S$’000 Change S$ ‘000 S$ ‘000 S$ ‘000 Change
Master Leases Net Property Income
Singapore 23,378 24,674 -1,296 -5.3% 66,517 71,931 -5,414 -7.5%
- Hotels 22,304 24,462 -2,158 -8.8% 65,049 71,273 -6,224 -8.7%
- Claymore Connect 1,074 212 (1) 862 N.M. 1,468 658 (1) 810 N.M.
Australia 3,424 3,933 -509 -12.9% 11,726 12,965 -1,239 -9.6%
New Zealand 2,291 2,533 -242 -9.6% 7,263 7,697 -434 -5.6%
Maldives –
1,817 1,628 189 11.6% 5,300 4,889 411 8.4%
Angsana Velavaru
Management Contracts Net Property Income
Maldives –
912 1,055 -143 -13.6% 4,298 4,397 -99 -2.3%
Jumeirah Dhevanafushi
Japan (2) 1,258 - 1,258 N.M. 4,094 - 4,094 N.M.
Total 33,080 33,823 -743 -2.2% 99,198 101,879 -2,681 -2.6%
N.M. denotes Not Meaningful
(1) Note that apart from Galleria, no income was recorded for Claymore Connect in 3Q and YTD Sep 2014 as the mall was undergoing asset enhancement works.
(2) Acquisition of the Japan Hotels was completed on 19 December 2014. Contribution from the Japan Hotels for the nine months ended 30 September 2015 includes
the last 13 days of FY 2014. 14Acquisition of Cambridge City Hotel
15Acquisition of Cambridge City Hotel
Maiden entry into Europe with completion of the acquisition of the 198-room Cambridge City Hotel on 1
October 2015 at the price of £61.5 million
Exceptional city centre location with renowned colleges, famous tourist attractions and transportation
within walking distance
Robust hospitality market with strong demand profile and high barriers of entry
Rare opportunity to own one of the largest hotels in a city where hotels with meeting facilities are
limited
High quality asset with upside potential – an £8.2 million refurbishment was completed in April 2015
Transaction reinforces CDLHT’s strategy to enter markets with strong fundamentals and growth potential
CDLHT has appointed Hilton to provide management services up to 31 December 2027
After completion of certain conversion works and re-launch activities, Cambridge City Hotel will be
rebranded as “Hilton Cambridge” in December 2015
Note: For more information, refer to the announcements on 9 September and 1 October 2015. 16Portfolio Breakdown
Breakdown of H-REIT Group’s Portfolio Valuation (1)
Australia 9.0% Singapore 71.1%
Novotel Brisbane 3.0% Orchard Hotel 18.5%
Mercure & Ibis Brisbane 2.7% Grand Copthorne 14.6%
Mercure Perth 2.0% Waterfront Hotel
Ibis Perth 1.3% Novotel Singapore Clarke 12.8%
Quay
The Maldives 7.7%
M Hotel 9.4%
Angsana Velavaru 4.4%
Studio M Hotel 6.6%
Jumeirah Dhevanafushi 3.3%
Copthorne King’s Hotel 4.9%
United Kingdom 5.4%
Claymore Connect 4.3%
Cambridge City Hotel 5.4%
New Zealand 4.1%
Rendezvous Grand Portfolio Valuation
4.1%
Hotel Auckland S$2.5 billion
Japan 2.7%
MyStays Asakusabashi 1.5%
MyStays Kamata 1.2%
(1) All properties, excluding the Japan Hotels and UK Hotel, were valued as at 31 December 2014. The Japan Hotels which were acquired on 19 December 2014, were
valued (average of two valuations done by DTZ Debenham Tie Leung Kodo Kaisha (“DTZ”) and International Appraisals Incorporated (“IAI”)) as at 30 October 2014.
The UK Hotel, which was acquired on 1 October 2015, was valued by Knight Frank LLP as at 25 August 2015. 17Healthy Financial Position
18Healthy Balance Sheet
With gearing of 36.5% and debt headroom of S$150 million , CDLHT will continue to focus on sourcing for
acquisition opportunities
Key Financial Indicators
As at 30 Sep 2015 As at 30 Jun 2015
Debt Value (1) S$930 million S$775 million
Total Assets S$2,549 million S$2,421 million
Gearing 36.5% 32.0%
Interest Coverage Ratio (2) 6.6x 6.8x
Debt Headroom (3) S$150 million S$322 million
Weighted Average Cost of Debt 2.6% 2.7%
Net Asset Value per Unit S$1.5859 S$1.6185
Fitch Issuer Default Rating BBB- BBB-
(1) Debt value is defined as medium term notes, bank borrowings and the TMK Bond which are presented before the deduction of unamortised transaction costs.
(2) Interest cover is computed using YTD Sep 2015 net property income divided by the total interest paid/ payable in YTD Sep 2015.
(3) Based on assumed gearing level of 40%. 19Debt Facility Details
Borrowings
Multi-Currency MTN Programme
Medium S$1.0 billion
Term Notes
(“MTN”) Issued: S$203.6 million (S$83.6 million 5-year float and S$120.0 million 5-year fixed)
Unutilised: S$796.4 million
3-year Committed Multi-Currency RCF
Revolving S$200.0 million
Credit
Facility Utilised: S$153.3 million
(“RCF”) Unutilised: S$46.7 million
Uncommitted Multi-Currency Bridge Facility
S$300.0 million
Utilised: £62.5 million (S$135.4 million)
Bridge Unutilised: S$164.6 million
Facilities
and Term Term Loans
Loans S$401.0 million
A$93.2 million US$75.0 million US$65.0 million ¥3.3 billion
S$70.0 million
(S$93.0 million) (S$106.8 million) (S$92.6 million) (S$38.6 million)
Tenure: 5-year
Tenure: 3-year Tenure: 5-year Tenure: 5-year Tenure: 5-year
TMK ¥3.1 billion (S$36.5 million)
Bond Tenure: 5-year
20Debt Profile as at 30 September 2015
Debt Maturity Profile (1)
S$ million Weighted Average Debt to Maturity ~ 2.1 years Currency Amount Type Expiry
300 (a) SGD S$153.3M Floating RCF Dec 2015
246
250 219 227 (b) AUD S$93.0M Fixed Term Loan Dec 2015
200 93 (b) (c) SGD S$83.6M Floating MTN Aug 2016
107 (f) 163
150 135 (d) (d) GBP S$135.4M Floating Bridge Loan Aug 2016
93 (h)
(e) SGD S$120.0M Fixed MTN Jun 2018
100 75
153 (a)
50 120 (e) (f) USD S$106.8M Fixed Term Loan Oct 2018
84 (c)
70 (g) 75 (i)
0 (g) SGD S$70.0M Fixed Term Loan Aug 2019
2015 2016 2017 2018 2019 2020 (h) USD S$92.6M Fixed Term Loan Dec 2019
JPY SGD AUD USD GBP Fixed Term Loan and
(i) JPY S$75.1M Sep 2020
TMK Bond
Debt Currency Profile (1) Interest Rate Profile (1)
Singapore Dollar (SGD) 45.9% 30 September 2015 30 June 2015
US Dollar (USD) 21.4% Fixed Rate
60% 61%
Australian Dollar (AUD) 10.0% Borrowings
Japanese Yen (JPY) 8.1% Floating Rate
40% 39%
British Pound (GBP) 14.6% Borrowings
(1) Based on exchange rates of A$1 = S$0.9979, US$1 = S$1.4243, £1.00 = S$2.1666 and S$1 = ¥84.82. 21Asset Enhancement Plans
22Asset Enhancement Plans
Grand Copthorne Waterfront Hotel
A full revamp of the lobby
and reception areas –
expected to start in Nov
2015 and to be completed
around mid-2016
Artist’s impression only, subject to change
Before
23Asset Enhancement Plans
Grand Copthorne Waterfront Hotel
New F&B outlets
Artist’s impression only, subject to change
Before
24Asset Enhancement Plans
Grand Copthorne Waterfront Hotel
Two new function rooms
totalling ~330 sq m to be
added
Artist’s impression only, subject to change
Before
25Asset Enhancement Plans
M Hotel
Refurbishment of 288
rooms – target for
completion by April 2016
26Outlook
27Singapore Visitor Arrivals Down 0.6% for YTD
August 2015
Arrivals for YTD August 2015 registered a 0.6% decline mainly due to the drop in Indonesian arrivals
August 2015 recorded y-o-y increase of 6.0% in visitor arrivals. It was the fourth consecutive month of
increase in 2015
STB has maintained its forecast of 15.1 – 15.5 million visitors for 2015 (1)
International Visitor Arrivals to Singapore (2)
Million
8-year CAGR = 5.6%
18.0 15.1 to
16.0
15.6 15.1 15.5 (1)
14.5
14.0 13.2
11.6
12.0
9.8 10.3 10.1 10.3 10.2
9.7
10.0
8.0
6.0
4.0
2.0
0.0
2006 2007 2008 2009 2010 2011 2012 2013 2014 2015
IPO Sub-Prime
Full Year Visitor Arrivals STB Forecast Arrivals YTD August 2015 Visitor Arrivals
(1) Reuters, “Singapore keeps 2015 tourism forecast, brushing off weak first half”, 17 Sep 2015
(2) Singapore Tourism Board (STB) 28Geographical Mix of Top Markets (Singapore)
Visitors from India and South Korea registered growth of 7.3% and 7.0% respectively compared to the
same period a year ago
Chinese arrivals recorded a 19.3% y-o-y increase for YTD August 2015 after a 24.1% decline in 2014
The recent surge in tourist arrivals from China and India has mitigated weakness from regional markets
such as Indonesia and Malaysia
Geographical Mix of Visitor Arrivals Top 10 Inbound Markets
YTD August 2015 (1) Y-o-Y Change for YTD August 2015 (1) (2)
China 19.3%
Indonesia
18% India 7.3%
Others South Korea 7.0%
26%
USA 2.2%
USA China -3.2% Philippines
3% 14% -4.4% Malaysia
South Korea
4% -4.5% Hong Kong
Philippines Malaysia -4.8% Japan
4% 8% -6.5% Australia
Hong Kong India -11.2% Indonesia
4% 7%
Japan Australia -20.0% -10.0% 0.0% 10.0% 20.0%
5% 7%
(1) Based on STB’s statistics published on 9 October 2015.
(2) The top 10 inbound markets are ranked according to growth rates in descending order. 29Latest Developments in Singapore Tourism
Sector
Recent developments are likely to augment Singapore’s attractiveness as a destination of choice among
business travellers
Singapore - Top international Securing of High Profile and
meeting city for eighth year running Prestigious BTMICE Events
Estimated
Event Year
Attendance
Sibos 2015 7,000
Unicity Global Convention 2016 25,000
International Council of
2019 3,000
Nurses (ICN) Conference
103rd Lions Clubs
2020 20,000
International Convention
Singapore retained its spot as the UIA's top
international meeting city for the eighth year Testament to the city state's attractiveness as a
running, and at the top of Asia Pacific cities in top BTMICE destination for event owners
ICCA's rankings for the 13th consecutive year (1)
Image Credit: STB
Source: CDLHT Research
(1) STB, Press Release “Singapore remains Asia’s top meeting and convention city for 2014”, 9 September 2015 30Enhancing Singapore’s Destination Attractiveness:
A Paradise of World-Class Attractions
Expansion of Singapore Zoo Sisters’ Islands Singapore Sports Hub
(2020) Marine Park (Opened in 2014)
(Opened in 2014)
Nature Sports
Karting Track @
Singapore Turf Club
Integration of Jurong Bird (Opened in 2014)
Park to Mandai area
(~2020)
Family &
Artist’s Impression Arts & Culture
of KidZania Entertainment
(2H 2015)
Singapore
Pinacothèque de Paris
(Opened in May 2015)
Lee Kong Chian Natural
Redevelopment of History Museum
6 precincts in Sentosa Madame Tussauds Singapore National Gallery Singapore (Opened in Apr 2015)
(~2019) (Opened in 2014) (Opening on 24 Nov 2015)
Image credits: National Parks Board, National University of Singapore, W-Architects, KidZania Singapore, National Gallery, Mr Choo Meng Foo, Merlin Entertainment, KF1,
www.sg, Flickr
Source: CDLHT research 31Singapore Hotel Room Supply
New room supply is expected to grow at a CAGR of 5.9% from 2014 – 2017
Operating environment expected to be competitive with 4,361 (1) rooms opening in 2015
Current and Expected Hotel Room Supply in Singapore (1)
No. of Hotel Rooms 3-year CAGR = 5.9%
70,000 2,419
3.7% 67,851
3,899
6.3%
65,000 4,361
65,432
7.6%
60,000 61,533
57,172
55,000 57,172
50,000
45,000
2014 2015 2016 2017 Total 2017
Estimated Hotel Supply as at End-2014 Estimated Future Hotel Supply Estimated Hotel Supply by End-2017
(1) New supply of rooms is a summation of new rooms deducted by existing rooms taken out of inventory for redevelopment.
Sources: STB, Horwath HTL (as at July 2015), URA and CDLHT research 32Potential Supply of New Singapore Hotel Rooms
Until 2017
No. of Horwath Expected No. of Horwath Expected
Name of Hotel Location Name of Hotel Location
Rms Rating Opening Rms Rating Opening
Gallery Hotel -223 Upscale/Luxury City Centre Closed Hotel Indigo Singapore Katong 131 Upscale/Luxury Outside City Centre 2016
Mercure Singapore Middle Road 400 Mid-Tier City Centre 2016
Swissôtel Merchant Court -150 Upscale/Luxury City Centre Closed
M Social 293 Mid-Tier City Centre 2016
Genting Singapore 557 Upscale/Luxury Outside City Centre Opened Holiday Inn Express Singapore
451 Mid-Tier Outside City Centre 2016
Park Hotel Alexandra 442 Upscale/Luxury Outside City Centre Opened Katong
Hotel Chancellor @ Orchard 488 Mid-Tier City Centre Opened Park Hotel Farrer Park 300 Mid-Tier Outside City Centre 2016
D'Resort@Downtown East 397 Mid-Tier Outside City Centre Opened Crowne Plaza Changi Airport
243 Mid-Tier Outside City Centre 2016
(extension)
Aqueen Hotel Paya Lebar 162 Economy Outside City Centre Opened
OASIA West Residences 116 Mid-Tier Outside City Centre 2016
Hotel Vagabond Singapore 41 Upscale/Luxury Outside City Centre Opened Premier Inn Singapore 300 Economy City Centre 2016
Partially The Warehouse Hotel 37 Economy City Centre 2016
The South Beach* 654 Upscale/Luxury City Centre
Opened Ibis Styles 298 Economy Outside City Centre 2016
The Patina Capitol Singapore 157 Upscale/Luxury City Centre 4Q 2015 Aqueen Hotel Geylang 100 Economy Outside City Centre 2016
Hotel Clover @ 7 HK St 22 Upscale/Luxury City Centre 4Q 2015 Aqueen Hotel Little India 70 Economy Outside City Centre 2016
Sofitel Sentosa Resort and Spa 30 Upscale/Luxury Sentosa 4Q 2015 Aqueen Hotel Lavender (Additional
69 Economy Outside City Centre 2016
Rooms)
Villa Samadhi 20 Upscale/Luxury Outside City Centre 4Q 2015
Andaz Singapore (DUO Project) 342 Upscale/Luxury City Centre 2017
Hotel Boss 1,500 Mid-Tier City Centre 4Q 2015 Novotel Singapore on Stevens 259 Upscale/Luxury City Centre 2017
Hotel Grand Central 264 Mid-Tier City Centre 4Q 2015 Somerset Grand Cairnhill Singapore
220 Upscale/Luxury City Centre 2017
Oasia Downtown Hotel 314 Upscale/Luxury City Centre 2016 Redevelopment
InterContinental Singapore Robertson The Murray Hotel 160 Upscale/Luxury City Centre 2017
225 Upscale/Luxury City Centre 2016
Quay (Gallery Hotel after refurbishment) Ibis Singapore on Stevens 528 Mid-Tier City Centre 2017
Clermont Hotel (Tanjong Pagar Centre) 202 Upscale/Luxury City Centre 2016 Amoy (Phase 2) (Additional Rooms) 60 Mid-Tier City Centre 2017
Swissôtel Merchant Court 150 Upscale/Luxury City Centre 2016 Courtyard Marriott at Novena 250 Mid-Tier Outside City Centre 2017
Laguna Dusit Thani 200 Upscale/Luxury Outside City Centre 2016 YOTEL Orchard Road 600 Economy City Centre 2017
Year No. of Rms Upscale/Luxury Mid-Tier Economy
2015 4,361 1,550 36% 2,649 61% 162 4%
2016 3,899 1,222 31% 1,803 46% 874 22%
2017 2,419 981 41% 838 35% 600 25%
Total (2015 – 2017) 10,679 3,753 35% 5,290 50% 1,636 15%
* Soft opening in 3Q 2015 with approximately 200 rooms opened to date.
Sources: URA, Horwath HTL (as at July 2015) and CDLHT research 33Maldives Tourism Market Update
For YTD September 2015, overall visitor arrivals grew 2.0% y-o-y
Looking ahead, Maldives tourism sector may experience softness coming from:
Slowdown in luxury spending by Chinese
Aggressive price promotion to compensate for the continued strength of the USD, particularly against the
euro and Russian rouble
International Visitor Arrivals to Maldives (1)
Thousand
1,400 6-year CAGR = 9.9%
1,205
1,200 1,125 2.0%
1,000 931 958 919
901
792
800 683 656
600
400
200
0
2008 2009 2010 2011 2012 2013 2014 2015
Full Year Visitor Arrivals YTD September Visitor Arrivals
(1) Ministry of Tourism, Republic of Maldives 34Geographical Mix of Top Markets (Maldives)
China, the top source market, grew 2.0% y-o-y for YTD September 2015
The top 5 source markets registered y-o-y growth of 3.9%
Decline in Russian visitors mainly due to sharp depreciation of rouble and the weak Russian economy
Geographical Mix of Visitor Arrivals Top 10 Inbound Markets
YTD September 2015 (1) Y-o-Y Change for YTD September 2015 (1) (2)
India 11.7%
Others Italy 8.4%
29% China Germany 5.9%
32%
UK 2.9%
Japan 2.1%
Switzerland
2% China 2.0%
Korea -1.2% Switzerland
2% -10.4% Korea
Japan Germany -17.5% France
3% 8%
UK -39.2% Russia
Russia France India Italy 8%
3% 4% -50.0% -30.0% -10.0% 10.0% 30.0%
4% 5%
(1) Based on statistics published on 11 October 2015 by the Maldives Tourism Ministry.
(2) The top 10 inbound markets are ranked according to growth rates in descending order. 35Japan Tourism Market Update
For YTD September 2015, Japan registered a 48.8% y-o-y increase in foreign visitors and this was led by
a 114.6% increase in Chinese arrivals
With the upcoming Tokyo Olympics in 2020, the Japanese government has put in place initiatives to
increase inbound tourism arrivals to 20 million (1)
International Visitor Arrivals to Japan (2)
Million 6-year CAGR: 20.0
20.0 6.9%
18.0
16.0 14.5
10-year CAGR: 8.1% 13.4
14.0
12.0 10.4
9.7
10.0 8.6 8.4
8.3 8.4
8.0 7.3 6.8
6.7 6.2
6.1
6.0
4.0
2.0
0.0
2004 2005 2006 2007 2008 2009 2010 2011 2012 2013 2014 2015 2016 2020
Full Year Visitor Arrivals Forecast Arrivals YTD September Visitor Arrivals
(1) Japan Today, “Gov’t eyes 20 million foreign tourists by 2020”, 19 January 2014
(2) Japan National Tourism Organization (JNTO) 36Geographical Mix of Top Markets (Japan)
China has overtaken South Korea as the top source market with a market share of 26.5% for YTD
September 2015 arrivals. China also registered the largest increase of 114.6% for YTD September 2015
arrivals
All top 10 source markets saw double-digit percentage growth in arrivals
Geographical Mix of Visitor Arrivals Top 10 Inbound Markets
YTD September 2015 (1) Y-o-Y Change for YTD September 2015 (1) (2)
Philippines Others
1% China 114.6%
12%
Malaysia Hong Kong 68.5%
UK 1% Philippines 46.0%
1%
South Korea 43.1%
Australia China
2% 27% Taiwan 30.7%
Thailand Thailand 24.7%
4% South Australia 22.2%
USA Korea
UK 19.3%
5% 20%
Taiwan Malaysia 18.1%
Hong Kong 19%
8% USA 14.5%
0.0% 20.0% 40.0% 60.0% 80.0% 100.0%120.0%
(1) Based on JNTO’s statistics published on 20 October 2015.
(2) The top 10 inbound markets are ranked according to growth rates in descending order. 37Background and Structure
of CDL Hospitality Trusts
38Background on CDLHT
Background Post IPO Performance
Announcement
of Novotel
IPO on 19 July 2006 Singapore
High (10 Jul ’07) Announcement of Announcement of Announcement of Announcement of
$3.00 Clarke Quay
= S$2.66 Australia Hotels Private Placement Angsana Velavaru Japan Hotels
Acquisition
Listed on SGX = S$2.01
Acquisition
= S$1.80
= S$1.89 Acquisition =
S$1.95
Acquisition =
S$1.74
Mainboard
$2.50
Sponsored by IPO =
S$0.83 23 Oct' 15
Millennium & = S$1.395
Copthorne Hotels plc $2.00
(listed on LSE)
First Hotel REIT in $1.50
Asia ex Japan Announcement
of Equity Fund
Announcement of
Jumeirah Dhevanafushi
Announcement of
Raising Acquisition
Studio M
= S$2.28 = S$1.58
Acquisition
$1.00 = S$1.94
Announcement of
Market Capitalisation Rendezvous Grand
Announcement of
Cambridge City Hotel
Hotel Auckland Acquisition
$0.50 Acquisition = S$1.32
= S$1.10
31 Dec'07 31 Dec '08 31 Dec '09 31 Dec '10 31 Dec'11 31 Dec '12 31 Dec '13 31 Dec '14
= S$1.74
S$1.37 billion as of $0.00
= S$2.35 = S$0.730 = S$1.75 = S$2.08 = S$1.55 = S$1.88 = S$1.64
23 October 2015
Mar/07
May/07
Mar/08
May/08
Mar/09
May/09
Mar/10
May/10
Mar/11
May/11
Mar/12
May/12
Mar/13
May/13
Mar/14
May/14
Mar/15
May/15
Jul/06
Nov/06
Jul/07
Nov/07
Jul/08
Nov/08
Jul/09
Nov/09
Jul/10
Nov/10
Jul/11
Nov/11
Jul/12
Nov/12
Jul/13
Nov/13
Jul/14
Nov/14
Jul/15
Jan/07
Jan/08
Jan/09
Jan/10
Jan/11
Jan/12
Jan/13
Jan/14
Jan/15
Sep/06
Sep/07
Sep/08
Sep/09
Sep/10
Sep/11
Sep/12
Sep/13
Sep/14
Sep/15
Source: Bloomberg 39CDLHT Structure
Sponsor Investors
≈36.18% Holdings of Stapled Securities ≈63.82%
as at 30 Sep 2015 as at 30 Sep 2015
H-REIT Distributions HBT
Acts on behalf of
DBS Trustee the holders of H-
REIT Units
Stapling
Deed
Management
Management services
M&C REIT services M&C Business Trust
Management Limited H-REIT Rent HBT Acts on behalf
Management Limited
(H-REIT Manager) (owner and lessor) (owner or lessee) of the holders of (HBT Trustee-Manager)
Lease of the HBT Units
Hotels
Lease of
Rent
Hotels
Master
Active asset management Lessees
in close collaboration
with master lessees
Hotel Manager Hotel Manager
Note: For simplicity, the diagram does not include the relationships in relation to Claymore Connect (previously Orchard Hotel Shopping Arcade). The H-REIT Manager
manages Claymore Connect directly, hence the various tenants of the retail units at Claymore Connect make rental payments directly to H-REIT under the terms of their
respective leases. 40Blue Chip Sponsor and Parentage
Millennium & Copthorne Hotels plc City Developments Limited
One of the largest property developers in
Listed on the London Stock Exchange with
Singapore with a market capitalisation of ~ S$7.6
market capitalisation of ~ £1.7 billion (1)
billion (1)
Debt to assets ratio of 20% as at 30 June 2015
Debt to assets ratio of 34% as at 30 June 2015
(1) As at 23 October 2015
Source: Bloomberg 41Management Strategy
Acquisition Growth Strategy Asset Management Strategy
Pursue yield accretive, quality assets with Work closely with master lessees and/or
investment rigour and discipline hotel managers to implement active
Tap on potential pipeline from M&C / CDL revenue and cost management
Tap on global network for third party assets Implement asset enhancement initiatives
to optimise asset potential
Financial
Foundation
Capital Management Strategy
Maintain a healthy balance sheet
Enhance financial flexibility by maintaining
diversified sources of funding
42CDLHT Asset Portfolio – Singapore
Orchard Hotel Novotel Singapore Clarke Quay
Number of rooms 656 Number of rooms 403
Valuation S$460.0M Valuation S$319.0M
Acquisition Date July 2006 Acquisition Date June 2007
Grand Copthorne Waterfront
Studio M Hotel
Hotel
Number of rooms 574 Number of rooms 360
Valuation S$363.0M Valuation S$164.0M
Acquisition Date July 2006 Acquisition Date May 2011
M Hotel Claymore Connect
Number of rooms 413 Number of rooms N.A.
Valuation S$235.0M Valuation S$106.0M
Artist’s
Acquisition Date July 2006 Impression Acquisition Date July 2006
Copthorne King’s Hotel Singapore Portfolio
Number of rooms 310 Number of rooms 2,716
Valuation S$122.0M Valuation S$1,769.0M
Acquisition Date July 2006
Note: All properties were valued as at 31 December 2014. 43CDLHT Asset Portfolio – Overseas
Novotel Brisbane (Australia) Mercure Perth (Australia)
Number of rooms 296 Number of rooms 239
Valuation A$71.3M / S$76.7M Valuation A$45.6M / S$49.1M
Acquisition Date February 2010 Acquisition Date February 2010
Mercure Brisbane (Australia) Ibis Perth (Australia)
Number of rooms 194 Number of rooms 192
Valuation A$62.5M / S$67.3M* Valuation A$30.0M / S$32.3M
Acquisition Date February 2010 Acquisition Date February 2010
Ibis Brisbane (Australia) Australia Portfolio
Number of rooms 218 Number of rooms 1,139
*Valued together with Valuation A$209.4M / S$225.4M
Valuation
Mercure Brisbane
Acquisition Date February 2010
Note: All properties were valued as at 31 December 2014.
Based on exchange rates of A$1 = S$1.0763. 44CDLHT Asset Portfolio – Overseas (con’t)
Angsana Velavaru Hotel MyStays Asakusabashi
(Maldives) (Japan)
Number of rooms 113 Number of rooms 138
Valuation US$82.5M / S$109.2M (1) Valuation ¥3.40B / S$37.4M (2)
Acquisition Date January 2013 Acquisition Date December 2014
Jumeirah Dhevanafushi Hotel MyStays Kamata
(Maldives) (Japan)
Number of rooms 37 Number of rooms 116
Valuation US$62.0M / S$82.0M (1) Valuation ¥2.66B / S$29.2M (2)
Acquisition Date December 2013 Acquisition Date December 2014
Maldives Portfolio Japan Portfolio
Number of rooms 150 Number of rooms 254
Valuation US$144.5M / S$191.2M (1) Valuation ¥6.06B / S$66.6M (2)
(1) The Maldives properties were valued as at 31 December 2014.
(2) The Japan Hotels, which were acquired on 19 December 2014, were valued (average of two valuations done by DTZ and IAI) as at 30 October 2014.
Based on exchange rates of US$1 = S$1.3231 and S$1 = ¥90.99. 45CDLHT Asset Portfolio – Overseas (con’t)
Rendezvous Grand Hotel Auckland (New Zealand)
Number of rooms 452
Valuation NZ$100.0M / S$102.9M (1)
Acquisition Date December 2006
Cambridge City Hotel (United Kingdom)
Number of rooms 198
Valuation £$61.5M / S$133.2M (2)
Acquisition Date October 2015
Total Portfolio Value:
S$2.488 billion
(1) The New Zealand Hotel was valued as at 31 December 2014.
(2) The UK Hotel, which was acquired on 1 October 2015, was valued by Knight Frank LLP as at 25 August 2015.
Based on exchange rates of NZ$1 = S$1.0289 and £$1 = S$2.1655. 46Summary of Leases
Orchard Hotel, Grand Copthorne Waterfront Hotel, M Hotel, Copthorne King’s Hotel:
Rent: 20% of Hotel's revenue + 20% of Hotel’s gross operating profit, with a fixed rent floor of S$26.4 m
Term of 20 years from Listing (19 July 2006) with 20-year option
Singapore IPO Portfolio Claymore Connect:
H-REIT receives rents direct from tenants
& Studio M
Favourable Lease Structure
in Base Portfolio
Studio M Hotel:
Rent: 30% of Hotel’s revenue + 20% of Hotel’s gross operating profit, with a fixed rent floor of S$5.0 m for the initial 10
years of the lease
Term of 20 years from 3 May 2011 with 20+20+10 years option
Novotel Singapore Clarke Quay:
Singapore NCQ Rent: Hotel’s gross operating profit less Accor’s management fee, subject to minimum rent
Variable rental payment of more than 90% of gross operating profit, depending on Novotel Singapore Clarke Quay’s
Lease Structure with performance
Reserve and High Variable Minimum rent of S$6.5 million per year guaranteed by master lessee / Accor S.A., subject to maximum rent reserve of
Rent S$6.5 million for the lease term
Term ~ 13.5 years from 7 June 2007, expiring 31 December 2020
47Summary of Leases
New Zealand Rendezvous Grand Hotel Auckland:
Base rent + Variable rent
RGHA
Base rent escalates at 2.75% per annum
High Degree of Stability Term of 10 years from 7 September 2006 with 5 year option
Novotel, Mercure & Ibis Brisbane, Mercure & Ibis Perth:
Australia Portfolio Base rent + Variable rent
High Stability and Significant Base rent: A$13.7 m per annum
Upside Potential Variable rent: 10% of portfolio’s net operating profit in excess of base rent
Term ~ 11 years from 19 February 2010, expiring 30 April 2021
48Summary of Lease and Management Agreement
Angsana Velavaru:
Maldives Rent: Hotel’s gross operating profit less lessee’s management fee, subject to minimum rent
Angsana Velavaru Minimum rent of US$6.0 million per year guaranteed by lessee / Banyan Tree Holdings Limited, subject to maximum rent
reserve of US$6.0 million for the lease term
Rental Protection with
Substantial Share of the Tiered lessee’s management fee offers further downside protection to CDLHT and incentivises lessee to drive growth in
Upside gross operating profit while allowing CDLHT to enjoy a substantial share of the upside
Term of 10 years from 1 February 2013, expiring 31 January 2023
Maldives Jumeirah Dhevanafushi:
Jumeirah Dhevanafushi CDL Hospitality Business Trust (“HBT”) activated as the master lessee (“HBT Lessee”) for the resort's operations
Jumeirah is the hotel manager of the resort and is engaged by HBT Lessee
Strengthens Foothold with
Term of hotel management agreement with Jumeirah: 35 years from 1 November 2011, expiring 31 October 2046
Potential Upside from Rising
Asian Affluence Typical management fees apply
49Summary of Management Agreement
Hotel MyStays Asakusabashi and Hotel MyStays Kamata:
Japan Portfolio HBT is the master lessee (“HBT Lessee”) for the hotels’ operations
MyStays Hotel Management Co., Ltd. is the hotel manager of the hotels and is engaged by HBT Lessee
Poised to Benefit from
Growing Hospitality Market Hotel management agreements will expire on 18 Jul 2016 (automatically renewed for 3-year term unless notice of
in Tokyo termination is made by either parties)
Typical management fees apply
50Summary of Management Agreement
United Kingdom Cambridge City Hotel:
Cambridge City Hotel HBT is the asset owner and currently responsible for the hotel’s operations
Hilton UK Manage Limited (an affiliate of Hilton Worldwide Inc.) has been appointed as the hotel manager by HBT
Poised to Benefit from
Term of 12.25 years from 1 October 2015, expiring on 31 December 2027
Burgeoning Life Science
Cluster in Cambridge Typical management fees apply
51Information on
CDL Hospitality Trusts Properties
52Hotels in Strategic Locations
Singapore Hotels New Zealand Hotel
Orchard Hotel & Grand Copthorne Novotel
Shopping Arcade Waterfront Hotel Singapore Rendezvous
Clarke Quay Grand Hotel
Auckland
H
H
H H
H
SINGAPORE
RIVER
CENTRAL MARINA BAY
BUSINESS SANDS H
DISTRICT
H
BUSINESS &
FINANCIAL
CENTRE SITE
Copthorne King’s Studio M Hotel M Hotel
Hotel AUCKLAND CITY CENTRE
53Hotels in Strategic Locations
Australia Hotels
Mercure Ibis Novotel Mercure
Brisbane Brisbane Brisbane Ibis Perth Perth
Brisbane CBD Perth CBD
H
H
H H
H
CBD AREA
54Resorts in Premium Destination
Angsana Velavaru
Malé Atoll
40 min
seaplane
flight
55 min
domestic
flight +
15 min
R speedboat Jumeirah Dhevanafushi
ride
South
Nilandhe
Atoll
R
Gan International Airport
55Hotels in Japan’s Gateway City of Tokyo
Japan Hotels
Hotel MyStays Hotel MyStays
Asakusabashi Kamata
Asakusabashi Kamata
H
H
56Hotel in Cambridge, United Kingdom
United Kingdom Hotel
Cambridge
H
Cambridge City Hotel
57Orchard Hotel, Singapore
Significant Highlights
656 rooms
Located on Orchard Road
Large pillarless ballrooms and extensive conference facilities
Caters to both corporate and leisure segments
Accolades
TripAdvisor Certificate of Excellence 2014
People Developer (PD) and Service Class (S-Class) Certification 2014-17 by
SPRING Singapore
SHA Excellent Service Award 2014:
Star Awardees – 22, Gold Awardees – 19, Commemorative Award in
appreciation of 5 or more consecutive years of support to EXSA
AsiaOne People’s Choice Awards 2014 – Top 3 Buffet Restaurants: Orchard Café
Wine & Dine Singapore’s Top Restaurants 2014 – Orchard Café & Noodles
Prestigious awards received by Hua Ting Restaurant:
Double Honours at the World Gourmet Series Awards of Excellence 2014
Asian Cuisine Chef of the Year – Masterchef Chung Lap Fai
Asian Restaurant of the Year
Singapore Tatler’s Best Restaurants 2006 to 2015
Singapore Tatler’s Regional Best Restaurants 2015
Wine & Dine Singapore’s Top Restaurants 2006 to 2015 (Three Star Rating in
2013 to 2015)
Singapore Green Hotel Award 2013-2014 by SHA
BCA Green Mark (Gold) 2011-2014
Singapore Health Award 2014 by Health Promotion Board – Silver award
Hotel Security Award – Excellence Rating 2014 by Singapore Hotel Association
(SHA) and Singapore Police Force
58Grand Copthorne Waterfront, Singapore
Significant Highlights
574 rooms
Located between CBD and Orchard Road, within close proximity
to Robertson Quay, Boat Quay and Clarke Quay
One of the largest conference facilities in Singapore
Well positioned for the MICE market
Accolades
TripAdvisor Certificate of Excellence Award 2013 (Winner)
Excellence Service Award 2014 (7 Gold, 1 Silver)
Commemorative Award by Excellent Service Award Movement (5 or
more consecutive years of commitment)
Prestigious awards received by Pontini:
Singapore Tatler’s Best Restaurants 2013, 2014 and 2015
Wine and Dine Singapore’s Top Restaurants 2013, 2014 & 2015
Executive Chef David Toh – At-Sunrice Global Chef Academy,
Mentor Chef 2013 and 2014
PUB Water Efficient Building Award 2014-2017 (Gold)
BizSAFE Level 4 Certification
Hotel Security Award - Excellence Award 2014 by SHA/SPF/NCPC
Fire Safety Excellence Award 2013/2014
59M Hotel, Singapore
Significant Highlights
413 rooms
Located in the heart of the financial district
Close to government offices, integrated resorts and
Marina Bay
Strong following of business travellers
Accolades
Weekender Foodmania Awards 2015 – Top 3 Voted Buffet
Restaurants
Her World Brides Venue Awards 2014 – Winner of Best
Wedding Package and Perks – 4-Star Hotel Category
Hotel Security Award 2011-2014 by SHA
Fire Safety Award 2014 by NFEC
BCA Green Mark (Gold Plus) 2015
NEA-SHA 3R Awards 2014
PUB Water Efficient Building Award 2013 - 2016 (Silver)
ASEAN Green Hotel Award 2012-2014 by SHA
Singapore Green Hotel Award 2009, 2011, 2013-2014 by
SHA
60Copthorne King’s Hotel, Singapore
Significant Highlights
Boutique-style business hotel with 310 rooms
Located within close proximity to CBD, convention /
exhibition belt, Orchard Road, Robertson Quay, Boat
Quay and Clarke Quay
Strong focus on corporate segment and specialty
events
Accolades
Wine & Dine Singapore’s Top Restaurants
2007 to 2015 – Tien Court
2005 to 2015 – Princess Terrace
Singapore Tatler’s Best Restaurants
2007 to 2013 and 2015 – Tien Court
2007 to 2013 and 2015 – Princess Terrace
BizSAFE Level 3 Certification
Hotel Security Award - Excellence Award 2014 by SHA
and SPF
Fire Safety Excellence Award - 2014
BCA Green Mark (Platinum) - 2015
61Novotel Singapore Clarke Quay, Singapore
Significant Highlights
Prime mid-scale hotel with 403 rooms
Leasehold
Located within immediate proximity to Singapore’s
premier entertainment hub: Clarke Quay, Robertson
Quay and Boat Quay
Accolades
Human Resources Excellence Awards 2014 , Gold
Award for Excellence in Leadership Development
HR Asia Best Companies To Work For In Asia 2015
Certified ISO 14001 - 2014
SEC-Kimberly-Clark Singapore Environmental
Achievement Award (Services) - Winner
3 R Awards for Hotel - Merit award by National
Environment Agency
BCA Building Energy Benchmarking Report 2014 – Top
10 Commercial (Hotel Category) Buildings
BCA Green Mark (Gold Plus) 2013 valid till 2016
PUB - Water Efficiency Building 2015
Gold Planet 21 rating 2013, 2014
BizSAFE Level 3 Certification
Hotel Security Award 2012 and 2014 by SHA and SPF
SHA/SPF/NCPC Hotel Security Award 2014 - Certificate
of Excellence
62Studio M Hotel, Singapore
Significant Highlights
360 rooms
Stylish and contemporary design catering to business and
leisure segments
Vibrant lifestyle options near the Robertson Quay precinct
and in proximity to CBD, tourist attractions, integrated
resorts and convention centres
Accolades
AsiaOne Readers’ Choice Award 2015 - Winner Best
Boutique Hotel
Booking.com – Outstanding Hotel Partner Award 2014
Gulllivers Travel Associates – Outstanding Hotel Partner
Award 2014
BCA Green Mark (Gold) for 2015
PUB Water Efficiency Building Award (Basic)
BizSAFE Level 3 Certification
63Claymore Connect, Singapore
Significant Highlights
Repositioned as a family-friendly mall with
enhanced retail offerings. The tenant mix post-
asset enhancement is expected to cater to the
needs of the residents living in the nearby
precincts
The mall was officially opened on 8 October
2015 and the committed occupancy as of 30
September 2015 stands at 81% (1)
Artist’s Impression
Net Lettable Area ~75,000 sq ft
Knight Frank’s Valuation S$106.0M
Valuation psf ~S$1,400 psf
% of Portfolio Value ~4.3%
Leasehold Interest 75 years from Listing Date
Artist’s Impression
(1) Includes the adjoining Galleria which is not part of the asset enhancement exercise. 64Rendezvous Grand Hotel Auckland,
New Zealand
Significant Highlights
452 rooms – largest hotel in Auckland by rooms
Freehold
Located in the central business district and next to a major conference
centre
Accolades
TripAdvisor Certificate of Excellence 2012 – 2015
Qualmark Ranking 4 Star Plus 2012 – 2014
ISO 14064 range of standards for greenhouse gas accounting
EarthCheck Certified (Bronze) 2009 – 2013
APT – New Zealand Hotel of the Year for the NCC Group Series –
2014
65Novotel, Mercure and Ibis Hotels, Brisbane
Novotel Brisbane
Significant Highlights
Novotel Brisbane
4.5-star accommodation with 296 modern, well-appointed rooms and suites
Freehold
Located next to Central Station and the CBD, Queen Street Mall and the Riverside boardwalk
Comprehensive conference and leisure facilities of ten dedicated rooms with capacity for up to
350 delegates
ISO 14001 certification in 2013, 2014 and 2015
Gold Planet 21 rating
Mercure Brisbane
Mercure Brisbane
4-star accommodation with 194 spacious and stylish rooms and suites, overlooking the
Brisbane River
Freehold
Located steps from the Queen Street Mall shopping precinct, Brisbane Convention and
Exhibition Centre
Three floors of function facilities and eleven conference rooms
Gold Planet 21 rating
Ibis Brisbane
Ibis Brisbane
3.5-star accommodation with 218 rooms
Freehold
Well-situated in the heart of the government and corporate precinct
ISO14001 environmental certification and ISO19001 quality certification
Gold Planet 21 rating
66Mercure and Ibis Hotels, Perth
Mercure Perth Mercure Perth
Significant Highlights
Mercure Perth
4.5-star accommodation with 239 rooms and suites
Freehold
Offers six meeting rooms accommodating up to 350 delegates
Situated in Perth’s CBD and within walking distance to the
Swan River, shopping and entertainment
Mercure Perth
Refurbishment of Restaurant & Bar completed in 2Q 2015
Silver Planet 21 rating
Ibis Perth
3.5-star accommodation with 192 rooms
Freehold
Ibis Perth Ibis Perth
Located steps away from the Murray and Hay Street shopping
belt within Perth’s CBD
ISO14001 environmental certification and ISO19001 quality
certification
Australian Hotel Association Western Australia Awards 2013
and 2014: Best Mid-Range Accommodation
Silver Planet 21 rating
67Angsana Velavaru, The Maldives
Significant Highlights
113-villa resort (79 beachfront villas and 34 water villas)
Exclusive cluster of standalone water villas positioned
~1km away from main island
Offers guests the opportunity to enjoy two distinct
experiences in one resort
The upmarket resort offers a wide range of dining, leisure
and spa options with more than a hundred activities
Accolades
World Luxury Spa Award 2013 – Best Luxury Beauty Spa
(Maldives)
2012 Gold Circle Awards - Agoda.com
Travart.com - “Save the Planet Awards 2009”
Class Top List – Voted one of the best resorts in the world
2009
68Jumeirah Dhevanafushi, The Maldives
Significant Highlights
37-villa resort (21 beachfront villas and 16 over-water villas),
each complete with its own private pool (two beachfront villas
were added in Apr 2015)
Exclusive cluster of standalone over-water villas located 800
metres away from the main island of beachfront villas
Other facilities include three restaurants, an open-air bar with
sunset view, the award-winning Talise Spa, yoga platform, an
infinity edge pool, an over-water gymnasium as well as a dive
centre and water sports centre
Accolades
Trip Advisor Certificate of Excellence: 2012, 2013, 2014, 2015
Recipient
Trip Advisor Traveller’s Choice: 2013 Winner - Luxury
Luxury Travel Guide Awards: 2015 Winner (Luxury Island Spa
of the Year)
World Travel Awards: 2014, 2015 Winner (Maldives' Leading
Luxury Hotel Villa - Ocean Sanctuary Sunset)
2015 Green Globe Certified Resort
69Hotel MyStays Asakusabashi and Kamata, Tokyo
Hotel MyStays Kamata
Significant Highlights
Hotel MyStays Asakusabashi
Business (economy) hotel with 138 rooms and 1
convenience store
Freehold
Awarded TripAdvisor’s 2014 Certificate of Excellence Hotel MyStays Asakusabashi
Situated in close proximity to Asakusa, Akihabara, Tokyo
SKYTREE and Ryogoku SUMO Stadium
Hotel MyStays Kamata
Business (economy) hotel with 116 rooms
Freehold
Awarded TripAdvisor’s 2014 Certificate of Excellence
Located in Kamata area which is only a 10-minute train
ride away from Haneda Airport
70Cambridge City Hotel, United Kingdom
Significant Highlights
Upper upscale hotel with 198 rooms
Leasehold (~100 years remaining) with option to renew for a
further term of 50 years
Situated in the heart of Cambridge city centre and 1.6 km
from Cambridge railway station
Comprehensive suite of facilities including 3 F&B outlets, a
gym, 5 meeting rooms and 50 parking lots
Recently undergone an £8.2 million refurbishment involving
its 198 rooms and public areas
Hotel will be rebranded as “Hilton Cambridge” in December
2015 after completion of certain conversion works and re-
launch activities
Accolades
Trip Advisor Certificate of Excellence 2015
Meeting Industry Association – Accredited in Meetings
71THANK YOU
72You can also read