We Know Where You Live: Privacy Characterization of Foursquare Behavior
←
→
Page content transcription
If your browser does not render page correctly, please read the page content below
We Know Where You Live:
              Privacy Characterization of Foursquare Behavior
                                    Tatiana Pontes∗ , Marisa Vasconcelos∗ , Jussara Almeida∗ ,
                                         Ponnurangam Kumaraguru† , Virgilio Almeida∗
                                               ∗
                                                  Universidade Federal de Minas Gerais, Brazil
                                        †
                                            Indraprastha Institute of Information Technology, India
                                               ∗
                                                 {tpontes,marisav,jussara,virgilio}@dcc.ufmg.br
                                                                †
                                                                  pk@iiitd.ac.in

ABSTRACT                                                                             INTRODUCTION
In the last few years, the increasing interest in location-based                     Online social networks (OSN), such as Facebook, Twitter
services (LBS) has favored the introduction of geo-referenced                        and the recent Google+ , are currently very popular. Some
information in various Web 2.0 applications, as well as the                          reasons for their great popularity include the easiness at which
rise of location-based social networks (LBSN). Foursquare,                           users can communicate and share content at large scale, the
one of the most popular LBSNs, gives incentives to users                             opportunity for self-promotion, commercial interests, as well
who visit (check in) specific places (venues) by means of, for                       as the simple intent of socialization [16]. Thus, users share a
instance, mayorships to frequent visitors. Moreover, users                           lot of information about themselves including age, address,
may leave tips at specific venues as well as mark previous                           relationship status, photos, and topics of interests on OSNs.
tips as done in sign of agreement. Unlike check ins, which
are shared only with friends, the lists of mayorships, tips                          Due to the increasing use of smart devices equipped with
and dones of a user are publicly available to everyone, thus                         Global Positioning System (GPS), LBSs have become very
raising concerns about disclosure of the user’s movement                             prevalent, thus attracting the interest of the research com-
patterns and interests. We analyze how users explore these                           munity. They have also motivated the creation of LBSNs
publicly available features, and their potential as sources of                       [20], which emerge with an additional attraction in relation
information leakage. Specifically, we characterize the use of                        to OSNs, namely, the association of geographical informa-
mayorships, tips and dones in Foursquare based on a dataset                          tion with the shared data. Out of the various existing LBSNs,
with around 13 million users. We also analyze whether it is                          such as Gowalla and Brightkite, Foursquare1 is currently one
possible to easily infer the home city (state and country) of                        of the most popular ones. Its overall goal revolves around the
a user from these publicly available information. Our results                        location sharing while users accumulate awards for visiting
indicate that one can easily infer the home city of around                           specific places in the system. It has been recently reported
78% of the analyzed users within 50 kilometers.                                      that Foursquare already achieved over 20 million members,
                                                                                     with a history of around two billion visits notified by users
Author Keywords                                                                      in places all over the world.2
Location Prediction, Privacy, Foursquare
                                                                                     In Foursquare, users can inform their friends about their cur-
                                                                                     rent location through check ins which may be converted into
ACM Classification Keywords
                                                                                     virtual rewards as badges or mayorships if the user is a fre-
K.4.1 Computing Milieux: Computers and society—Public
                                                                                     quent visitor of the same venue. Besides this gamification
policy issues
                                                                                     aspect, Foursquare has massively invested into the recom-
                                                                                     mendation aspect allowing users to leave notes (tips) for
General Terms                                                                        friends and other users about their experiences at specific
Experimentation, Measurement                                                         places (venues). Users can also keep track of tips marking
                                                                                     them as done or saving them in a to-do list.

                                                                                     Easy availability of information about the location of a user
                                                                                     raises several concerns about privacy violation [18]. For in-
                                                                                     stance, the information about one’s location may facilitate
                                                                                     inferences about her behavioral patterns and habits. For in-
Permission to make digital or hard copies of all or part of this work for            stance, in Foursquare, although check ins are shared only
personal or classroom use is granted without fee provided that copies are            with the user’s friends, the use of other features of the sys-
not made or distributed for profit or commercial advantage and that copies           tem, such as mayorships, tips and dones are publicly avail-
bear this notice and the full citation on the first page. To copy otherwise, or
republish, to post on servers or to redistribute to lists, requires prior specific   1
permission and/or a fee.                                                                 http://foursquare.com
                                                                                     2
UbiComp ’12, Sep 5-Sep 8, 2012, Pittsburgh, USA.                                         http://mashable.com/2012/04/16/foursquare-20-million/
Copyright 2012 ACM 978-1-4503-1224-0/12/09...$10.00.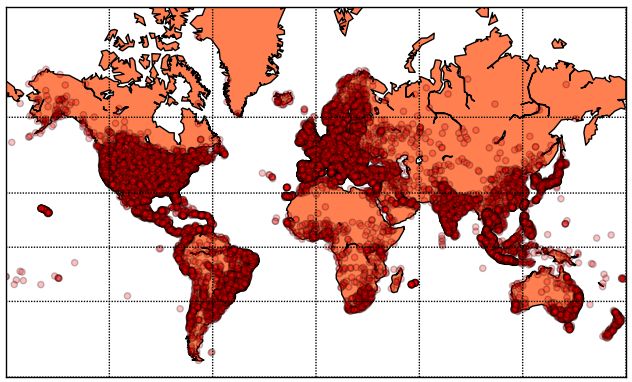
able to everyone. In other words, the information about                          studies have focused on geographically referenced informa-
the venue(s) where the user is mayor (if any) as well as all                     tion addressing aspects such as understanding why users share
venues where she left a tip or marked a tip as done or to-do is                  their location [16], human mobility patterns [2, 3, 14], user
available to anyone. This information may reveal a lot about                     profile identification [10, 17], event detection [15] and anal-
a user. For instance, a mayorship at a specific venue means                      ysis of a city urban development through check ins [5].
that the user is a frequent visitor of that venue, whereas a tip
(or a done/to-do) implies a prior visit or intention to check-                   The information sharing in LBSNs and online social net-
ing out the place in the future. Tipping patterns may ulti-                      works in general also raises concerns about exposure of user
mately reveal user habits and personal interests. Indeed, if                     private data, touching privacy related issues. For instance,
one considers that writing a tip requires more effort from the                   some studies have shown that it is possible to infer user im-
user than simply doing a check in, it could be argued that                       plicit data through explicit information shared in such sys-
the locations at which a user left tips are even stronger indi-                  tems [7]. Mislove et al. have shown that users’ personal
cations of places she actually visited than check ins.3 Users                    interest can be inferred from friends [12], specially because,
may do check ins when they are traveling, far from home, to                      as argued in [4], people with common preferences are more
show their friends that they are enjoying different places.                      likely to be friends. Other studies focused on assessing how
                                                                                 users face privacy related issues and which strategies they
In this paper, we analyze how users explore these publicly                       often adopt to manage their exposure in the system [9].
available features, notably, mayorships, tips and dones in
Foursquare, and their potential as source of information leak-                   There have also been studies that investigate whether it is
age and privacy violation. More specifically, we provide a                       possible to infer a user’s location through other features which
characterization of mayorships, tips and dones in Foursquare                     contain implicit location information. In [6], the home lo-
based on a large dataset we crawled containing information                       cation of Twitter users are inferred from friends, with the
on more than 13 million users and 15 million venues. As a                        simple assumption that users tend to have friends that live
first step towards investigating how much information about                      near them. In [1], Cheng et al estimated the user home city
a user can be inferred from her tips, dones and mayorships,                      using the content of tweets with the assumption that people
we analyze whether one can easily infer the home city (state                     who live nearby do have a similar vocabulary. Other studies
and country) of a user from these publicly available infor-                      use machine learning approaches to infer user home loca-
mation, by simply taking the location of the majority of the                     tion exploiting tweets’ textual content [8] or users’ tweeting
venues the user is connected to via mayorships, tips and                         behavior [11]. Unlike these previous studies, we here fo-
dones. Note that the home city in Foursquare user profile is                     cus on inferring user’s home city in a very popular LBSN
not a mandatory field and appear as an open text field. Thus,                    (Foursquare), exploiting publicly available features such as
a user may choose not to reveal her home city by simply                          mayorships, tips and dones that are associated with location
writing an invalid city name or even leaving it blank. Recent                    information. To our knowledge, no previous work has ad-
analyses of the location field in Twitter have pointed out that                  dressed this problem yet.
34% of the users did not provide real locations, often includ-
ing fake locations or even sarcastic comments. One of the                        FOURSQUARE DATASET
reasons that justifies this user behavior may be to avoid un-                    In this section, we briefly review the main elements of Four-
wanted messages that, for instance, may use the location in-                     square as well as the crawled dataset used in our experimen-
formation to provide a more efficient targeted advertisement                     tal evaluation.
mechanism. The question that we address here is: despite
being a private data that the user may choose not to reveal,
can we still infer the home city of a user in Foursquare from                    Foursquare: Background
her mayorships, tips and dones?                                                  Foursquare is currently the largest and the most popular LBSN
                                                                                 where members can share their locations with friends and
We note that the literature contains several models for pre-                     followers through check ins. Check ins are performed via
dicting user’s home city mainly, exploiting the contents of                      devices with GPS when a user is close to specific locations
user messages [1, 8, 11] or location of their friends [6]. Fo-                   (venues). Venues are pages in the system that represent real
cused mainly on Twitter, these prior efforts aim at improv-                      locations of a great variety of categories such as airports, ho-
ing personalized services [1], performing targeted regional                      tels, restaurants, monuments or squares.
advertisements [19] or even detecting major events [15]. In-
stead, we here focus on a different application, Foursquare,                     Foursquare has a playful aspect that gives incentives to users
exploiting different publicly accessible features, as our in-                    who share more locations. Thus, check ins can be accumu-
tention is to investigate their potential as source of inference                 lated and exchanged by badges and mayorships. Badges are
of information about the user.                                                   like medals given to users who check in at specific venues
                                                                                 or achieve some predefined number of check ins. A mayor-
                                                                                 ship, in turn, is given to the user who was the most frequent
RELATED WORK
                                                                                 visitor (in number of check ins) of a venue in the last 60
The increasing popularity of LBSNs have attracted researchers                    days. Venue mayors are often granted rewards, promotions,
towards the awareness of location data. A number of recent                       discounts or even courtesies by business and marketing man-
3
  Note that Foursquare allows a user to check in at a venue even if she is not   agers who own the venue. Once a user becomes a mayor of
near the corresponding physical location.                                        a given venue, that mayorship will be listed in her history,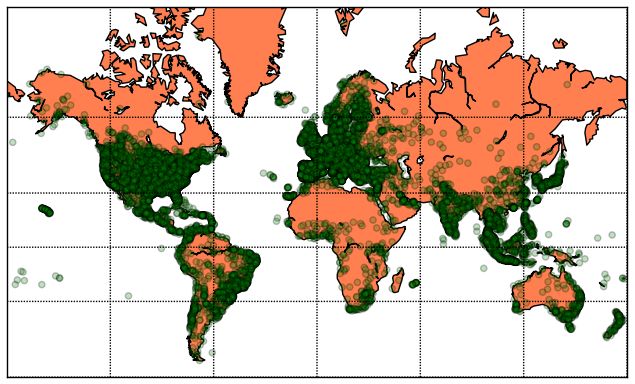
even if some other user later ousts her from that position.                     ciated with venues, we here analyze the user home city and
That is, each user maintains a history of all mayorships she                    the venue location attributes in our dataset.
conquered. Multiple mayorships at the same venue are listed
only once in this history. Moreover, mayorships are not tem-                    User home city, in particular, is limited to 100 characters and
poral referenced.                                                               is not required to be filled. It is expected that users provide
                                                                                the name of the city where they live, although the system
Users can post tips at specific venues, commenting on their                     provides neither rule to enforce it nor any automatic tool to
previous experiences when visiting the corresponding physi-                     help users filling the field (e.g., a predefined list of cities
cal places. Tips can also serve as feedback, recommendation                     from which the user can choose one). Thus, users are free
or review to help other users choose places to visit. Exam-                     to provide this location information at various granularities,
ples of tips include the best option of a menu in a restau-                     ranging from specific addresses, to city, state and country
rant, the best place to have lunch in an airport, or even a                     names, or even regions of the planet (e.g., “North Pole”).
complaint about a service. With a limitation of 200 char-                       We also observed some home city fields filled with emails,
acters, tips nourish the relationship between users and real                    phrases, or even numbers in our dataset. Similarly, the loca-
businesses and may be a key feature to attract future visitors                  tion associated with a venue, and thus, indirectly, with may-
[17]. Each user has a history of all tips she posted, with asso-                orships, tips and dones of that particular venue, is also an
ciated venue and timestamp. When visiting a venues’ page,                       open text field. Unlike the user home city, the address and
after reading a previously posted tip, a user may mark it as                    the city of a venue must be filled before the venue is created.
done or to-do, in sign of agreement with the tip’s content or                   Moreover, it is necessary to set a pin in a map to update the
intention to visit that location in the future, respectively. The               venue’s location. Once again users may choose to provide
history of mayorships as well as the list of tips and dones,                    invalid addresses and city names, and mark arbitrary loca-
along with corresponding venue and timestamp information,                       tions in the map.
of a user are publicly available at the user’s profile page.
                                                                                Table 1. Dictionary. GI = geographic information. UHC = User Home
                                                                                City. VL = Venue Location.
Crawled Dataset                                                                      Statistics                               UHC          VL
Our study is based on a large dataset collected from Four-                           # in dataset                        13,570,060 15,898,484
square using the system API. We crawled user profile data                            # valid GI                          13,299,112 11,683,813
consisting of user type, user home city, list of friends, mayor-                     # valid but ambiguous GI               359,543  2,868,636
                                                                                     # non-GI                               244,233  4,214,671
ships, tips, dones, total number of check ins, Twitter screen                        # empty entries                         26,715          0
names and Facebook identifiers. Our crawler ran from Au-
gust to October 2011, collecting a total of 13,570,060 users,                               Table 2. Quality of Geographic Information.
which is a good approximation of the entire Foursquare com-                               Quality                     # Users   # Venues
munity at the time of the crawling since, reportedly, the num-                            Continent                       107          61
ber of users registered in Foursquare was 10 million in June                              Country                     602,932    294,596
                                                                                          State                       390,224     93,513
2011, reaching 15 million in December of the same year
                                                                                          County                      251,383    276,097
[13]. Our dataset contains 10,618,411 tips, 9,989,325 dones                               City                     10,354,058 6,937,523
and 15,149,981 mayorships at 15,898,484 different venues.                                 Neighborhood                981,139 1,060,124
                                                                                          Area of Interest/Airport     27,307     47,896
                                                                                          Street                      326,751     95,543
FOURSQUARE CHARACTERIZATION                                                               Point of Interest             5,607       9,792
In this section, we discuss characterization of Foursquare                                Coordinate                       61          32
users, focusing on user attributes that are publicly available
in the system API and are associated with geo-referenced in-                    Thus, in order to standardize the home city and venue lo-
formation, i.e., home cities, mayorships, tips and dones. Re-                   cation fields, we created a dictionary of city names using
call that the user home city and the venue location are open                    the Yahoo! PlaceFinder, the Yahoo’s geo-coding API.5 This
text fields, whose validity is not enforced by the system. In-                  tool was used to verify the validity of the data in both fields.
deed, they may carry noise and invalid locations. Thus, we                      For a given query (text), the tool either returns some geo-
start our study by analyzing the amount of valid location in-                   graphic data, in case the query consists of a valid location,
formation in our dataset. Next, we analyze the use of tips,                     or an error, otherwise. For queries consisting of valid lo-
dones and mayorships, focusing on the distribution of as-                       cations, the tool’s response depends on the “quality” of the
sociated locations around the globe. Finally, we perform a                      query, which, in turn, is related to the spatial granularity
temporal and spatial analysis of user activities in terms of                    (e.g., street, city, state, country) of the location information
tipping and marking previous tips as done.                                      provided in the query. For instance, for a query “New York”,
                                                                                Yahoo! PlaceFinder returns that the query’s quality is at
Location Information in Foursquare                                              the granularity of city, and provides the corresponding ge-
We here discuss the location information available in public                    ographic coordinates, a standardized city name as well as
attributes of Foursquare users, i.e., in home city, mayorships,                 the state and country names. Yahoo! PlaceFinder may also
tips and dones.4 Since mayorships, tips and dones are asso-                     identify locations at the finer granularity of streets. More-
                                                                                over, note that the use of standardized city name allows us to
4
  Check ins are private, it is not possible to access the geographic location
                                                                                5
associated with them.                                                               http://developer.yahoo.com/geo/placefinder/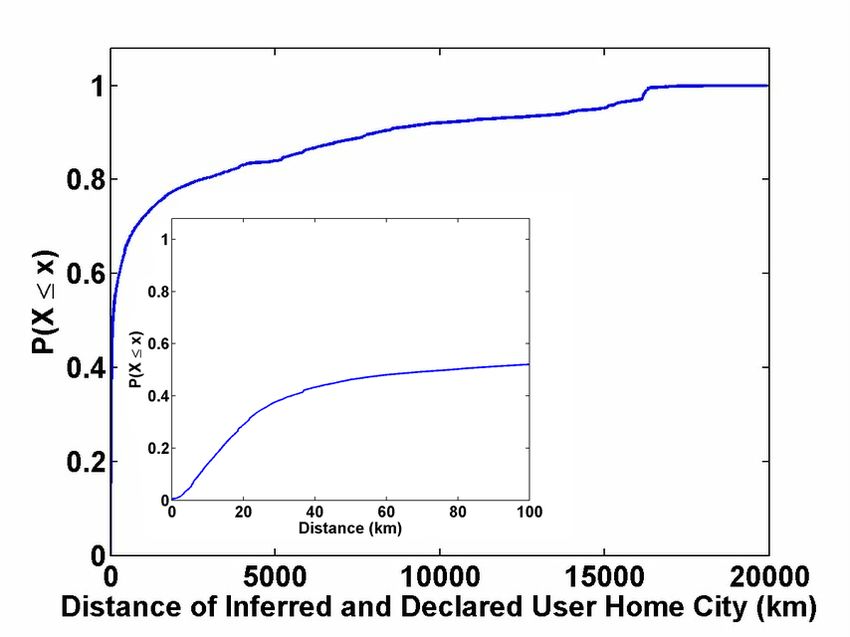
Mayorships, Tips and Dones
In this section, we analyze the mayorships, tips and dones
of users in our dataset. Since our goal is to exploit the loca-
tion of the venues associated with these attributes to infer the
user home city, we start by showing an overview of the use
of mayorships, tips and dones among users in our dataset.
We observe that almost 4,2 million users, or around 30% of
all users in our dataset, have at least one of these attributes.
Out of these, around 1 million have only mayorships, 670
thousand have only tips and 367 thousand have only dones,
whereas 890 thousand users have all three attributes. Thus,
exploiting these attributes to infer a user home city is promis-
Figure 1. Cumulative Distribution of the Number of Mayorships, Tips ing as the required information is available in a large fraction
and Dones per User. of all users. Moreover, as shown in Figure 1 and consistent
with previous analyses of Foursquare [14, 17], the distribu-
tions of the numbers of mayorships, tips and dones per user
are very skewed, with a heavy tail, implying that few users
have many mayorships (tips or dones) while the vast major-
ity have only one mayorship (tip or done). Indeed, for users
that have one of these attributes, we find that 69% (59%
and 56%) of the users have 2 or more mayorships (tips and
dones).
Figure 2 shows the distributions of numbers of mayorships,
tips and dones per city, considering only cities with at least
one instance of the attribute. As shown, the distributions are
Figure 2. Cumulative Distribution of the Number of Mayorships, Tips also very skewed, with a few cities having as many as 100
and Dones per City. mayorships, tips or dones.
uniquely identify the city, despite the existence of multiple Next, we analyzed the correlation between the number of
name variations (e.g., NY, New York City, etc). mayorships, tips and dones per city. We found that there is a
high correlation between the number of mayorships and the
Table 1 provides some details about our dictionary, indicat- number of tips across cities, with a Spearman’s correlation
ing the total number of users and venues with valid, invalid coefficient ρ [21] equal to 0.78. Similarly, the correlation is
as well as empty location information. Note that, perhaps also high between the number of mayorships and the num-
surprisingly, the vast majority (98%) of the users do pro- ber of dones (ρ = 0.72). Moreover, we found that the cities
vide valid locations, according to Yahoo! PlaceFinder, in with the largest numbers of mayorships tend also to have
their home city attributes, and only a tiny fraction of users large numbers of tips and dones, although some interesting
leave this attribute empty (0.2%). The fraction of venues differences are worth noting. For instance, mayorships are
with valid locations is smaller (73.5%), but, also accounts for more concentrated in Southeast Asia, in cities like Jakarta,
most venues in our dataset. We note that, for some queries, Bandung and Singapore, which are the top three cities in
Yahoo! PlaceFinder returned multiple ambiguous answers number of mayorships, jointly having more than 500,000
reflecting alternative locations with the same name (e.g., there mayorships. Tips, in turn, are concentrated in different lo-
are ten cities named “Springfield” in the United States). We cations around the Earth: the top three cities in number of
chose to disregard users and venues with ambiguous loca- tips are New York, Jakarta and São Paulo, with a total of
tions, which correspond to 2.7% and 24.6% of all users and 600,000 tips. Dones, on the other hand, tend to be concen-
venues with valid locations, respectively, in our dataset. trated in venues in the United States, in cities like New York,
Chicago and San Francisco, which jointly received around 1
Next, we analyze the “quality”, in terms of spatial granular- million dones.
ity, of valid (unambiguous) locations associated with users
and venues. In Table 2, we present the distributions of users We note that, although other studies [1, 8, 11] have exploited
and venues across 10 different quality levels, ranging from textual features to analyze user location, we here chose not
continent to specific coordinates. Note that, the majority of to exploit the tip’s content as they are often targeted towards
users and venues provide location information at the gran- more generic topics such as food and service quality. We ob-
ularity of city or at finer granularities. Indeed, users and serve that most words extracted from tips in our dataset are
venues are associated with 100,629 different cities around adjectives or are related to food, meal, services and generic
the world. Note, however, that over 1.2 million users pro- places where one can eat or drink.
vide location information at a coarser granularity, often at
the country level. Thus, the inference of the home city or We now discuss the distribution of cities with venues where
even state of these users based on their mayorships, tips and users have mayorships, tips and dones around the world.
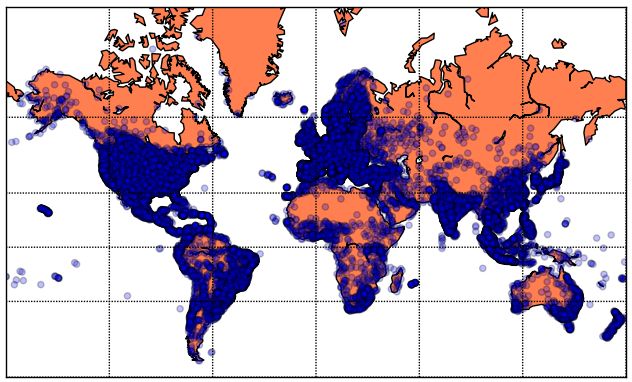
dones will reveal private information.(a) Mayorships. (b) Tips. (c) Dones.
Figure 3. Global Distribution of Mayorships, Tips and Dones.
Figure 4. Cumulative Distribution of Time Interval Between Consecu- Figure 5. Cumulative Distribution of Displacements Between Consecu-
tive Tips/Dones Posted per User. tive Tips/Dones Posted per User.
We only consider attributes associated with venues that have
We start by investigating the frequency at which users leave
valid cities (validated by Yahoo! PlaceFinder) as location.
tips and/or mark previous tips as done. We do so by analyz-
Figure 3 shows these distributions in maps of the globe, with
ing the time interval between consecutive activities (be it a
each point representing a city with venues with at least one
tip or a done) of the same user. Thus, we consider only users
mayorship, tip or done.6 As the maps show, Foursquare
with at least two activities, covering a total of 1,959,647
venues are spread all over the world, including remote places
users. We summarize user activity by the minimum, me-
such as Svalbard, an archipelago in the Arctic Ocean, with
dian, average and maximum inter-activity times. Figure 4
coordinates (78.218590,15.648750). Moreover, all three maps
shows the cumulative distributions of these four measures
are very similar, with most incidences of points in Amer-
computed for all considered users. We note that the distribu-
ica, Europe and Southeast Asia. The distribution of mayor-
tion of minimum inter-activity times is very skewed towards
ships, shown in Figure 3(a), is denser, with a total number of
short periods of time, with almost 50% of the users post-
unique cities (79,194) much larger than in the distributions
ing consecutive tips/dones 1 hour apart. However, on aver-
of tips and dones, which cover a total of 54,178 and 30,530
age, median and maximum, users do tend to experience very
unique cities, respectively. The somewhat sparser tip map
long periods of time between consecutive tips and dones.
(Figure 3(b)) indicates that there are many cities, particularly
For instance, around 50% of the users have an average inter-
in Canada, Australia, central Asia and Africa, where, despite
activity time of at least 450 hours, whereas around 80%
the existence of venues and mayors, users do not post tips.
of the users have a maximum inter-activity time above 167
The distribution of dones, shown in Figure 3(c), reveals an
hours (roughly a week).
even sparser map, with most activity concentrated in touris-
tic or developed areas, such as USA, western Europe and Next, we analyze the displacement between two venues vis-
southeast Asia. We note that a similar map was produced ited in sequence by the user, as indicated by consecutive
for check ins in [2]. Besides both datasets were collected at tips and/or dones of the user. For this analysis, we con-
different times, we can see that their main areas of concen- sider only users with at least two activities, provided that the
tration overlap. venues associated with these activities have valid locations,
with “quality” of city level or finer granularity. Our dataset
Temporal and Spatial Analyses contains almost 1.5 million users in this group. For these
We perform a temporal and spatial analysis of user activity users, we computed the displacements between consecutive
in terms of tips and dones. Our goal is to analyze how often tips/dones by taking the difference between the coordinates
users leave tips / dones as well as how far users “go” between of the associated venues. Once again, we summarize user
consecutive tips / dones. To that end, we make use of the activity computing the minimum, median, average and max-
timestamp associated with each tip and done as well as the imum displacement per user. Figure 5 shows the distribu-
location of the venue where the tip (or done) was left. tions of these measures for all analyzed users. Around 36%
of the users have average and maximum displacements of
6
The Antarctica continent was omitted because there was no point on it. 0 kilometer, indicating very short distances (within a fewWe here discuss the inference approach and evaluation method-
ology adopted in Methodology section whereas our main re-
sults are discussed in Experimental Results section.
Methodology
The key assumption behind this work is that users tend to
have mayorships, tips and dones in venues at the same lo-
cation (e.g., city) where they live. At first, one might think
that the mayorship locations are perhaps the strongest piece
of evidence about a user’s home location, as the former rep-
resent places the user possibly goes very often. Recall that
Figure 6. Distribution of Returning Times. a user only becomes mayor of a venue if she is the most
frequent visitor in the last 60 days. However, tips may also
meters). Moreover, 70% of the users have an average dis-
reveal places where a user has been, since when posting tips
placement of at most 150 kilometers, which could be char-
users are often sharing experiences. 8 Finally, dones may
acterized as within the metropolitan area of a large city. Also
also provide some evidence about a user’s home location,
60% of the users have a maximum displacement of at most
although perhaps not as strong as tips and mayorships. Our
100 kilometers, possibly the distance between neighboring
conjecture is that users often mark as done tips about phys-
cities. Thus, overall, consecutive tips/dones of a user are
ical places where they have been to or intend to go soon.
often posted at places near each other. However, there are
We note however that, despite intuitive, the aforementioned
exceptions. About 10% of the users have a maximum dis-
assumption is not guaranteed to hold for all users. As dis-
placement of at least 6,000 kilometers.7
cussed in Temporal and Spatial Analyses section, 10% of
Finally, we analyze how often users return to the same venue the users in our dataset have a maximum displacement of at
for tipping or marking tips as done. That is, we analyze the least 6,000 kilometers between consecutive tips and dones.
returning times, defined as the time interval between con-
As a first step to address this question, we consider a sim-
secutive tips/dones posted at the same venue by the same
ple approach that takes the most popular location among the
user. This analysis is focused on 813,607 users, who have at
attributes (mayorships, tips and/or dones) of a user as her
least two tips/dones in the same venue, and cover more than
home location, using a majority voting scheme. We note
3 million returns. We here choose to show the distribution
that more sophisticated methods could be applied such as
of all measured returning times, as opposed to summarizing
classification algorithms (e.g., k-nearest neighbor) and other
them per user first, so as to compare our results against pre-
machine learning techniques [8, 11, 1]. Instead, we chose a
vious findings of check in patterns [2]. Figure 6 shows the
simple majority voting approach as it allows us to assess the
distribution, focusing on returning times under 360 hours,
potential for effective inferences of this type in Foursquare.
which account for 69.7% of all measured observations. The
curve shows clear daily patterns with returning times often
We consider seven inference models which differ in terms of
being multiples of 24 hours, which is very similar to the dis-
the attributes used for inference. The Mayorship model uses
tribution of returning times computed based on check ins
only the locations of the mayorships to infer the user’s home
[2]. We note, however, that 50% of the measured returning
location. Similarly, the Tip and Done models use only loca-
times are within 1 hour, which cannot be seen in the Fig-
tions of tips and of dones, respectively. The Mayorship+Tip,
ure as its y-axis is truncated at 1% so that the rest of the
Mayorship+Done, Tip+Done models use information from
curve could be distinguished. Moreover, out of these obser-
only two attributes, whereas the All model takes all three
vations, 90% of them are at most 10 minutes. Thus, return-
attributes jointly. By comparing alternative models, we are
ing times, in general, tend to be very short. If we analyze the
able to assess the potential of each attribute as source of in-
behavior per user (omitted more details, due to space con-
ference. Moreover, recall that, as discussed in Mayorships,
straints), we note that most users have very short minimum
Tips and Dones section, there are non-negligible numbers
returning times, which is below 1 hour for 62% of the users.
of users that only have one or two of the attributes. Thus,
However, consistently with results in Figure 4, on average,
the combination of multiple attributes may enable the infer-
median and maximum, users do tend to experience longer
ence for a larger user population. The models are here used
returning times. For instance, 52% of the users have average
mainly to infer the user’s home city, although we also con-
returning times of at least 168 hours.
sider inferences about the user’s home state and country.
INFERRING USER’S HOME LOCATION To evaluate the effectiveness of each model, we take the in-
In this section we investigate whether one can infer, with rea- formation provided in the user’s home city attribute as ground
sonable effectiveness, the location where a user lives based truth. Although users are free to enter whatever they want in
only on information that is publicly available on her Foursquare this attribute, we found that the majority of Foursquare users
profile page, notably the lists of mayorships, tips and dones. do enter valid locations (see Table 1). To evaluate our in-
7 8
Note that the maximum displacement between two points in the Earth is Although users may post tips at unknown venues to, for instance, inquire
the distance between antipodes (two diametrically opposed points) that is about driving directions, operation time, or parking conditions, we believe
about 20,000 kilometers. that this does not occur very often.Table 3. Home Location Inference.
Classes Distribution
Home City Home State Home Country
Features Class 0 Class 1 Class 2 Class 0 Class 1 Class 2 Class 0 Class 1 Class 2
Mayorship 727,179 847,876 239,129 707,953 913,166 110,110 727,179 1,053,703 33,302
Tip 725,073 671,576 192,781 702,583 727,219 99,672 725,073 835,532 28,825
Done 546,815 541,795 106,297 524,137 561,165 55,115 546,815 630,937 17,155
Mayorship+Tip 898,293 1,322,214 300,831 878,578 1,398,351 146,526 898,293 1,581,654 41,391
Mayorship+Done 825,009 1,213,917 270,974 805,029 1,278,784 130,439 825,009 1,447,581 37,310
Tip+Done 831,759 1,038,268 223,093 807,091 1,089,638 116,549 831,759 1,228,043 33,318
All 939,888 1,573,471 310,045 919,938 1,643,825 153,955 939,888 1,840,850 42,666
Accuracy
Home City Home State Home Country
Features Class 0 Class 1 Total Class 0 Class 1 Total Class 0 Class 1 Total
Mayorship 51.61% 67.41% 60.12% 71.27% 80.92% 76.70% 89.79% 92.92% 91.64%
Tip 51.52% 67.29% 59.11% 70.29% 80.59% 75.53% 90.12% 93.67% 92.02%
Done 50.09% 61.74% 55.89% 70.16% 78.38% 74.41% 89.12% 92.38% 90.87%
Mayorship+Tip 51.57% 66.24% 60.31% 70.21% 80.27% 76.39% 89.71% 93.13% 91.89%
Mayorship+Done 51.05% 65.27% 59.51% 70.01% 79.89% 76.07% 89.18% 92.78% 91.47%
Tip+Done 51.18% 64.16% 58.38% 69.76% 79.28% 75.23% 89.52% 93.04% 91.62%
All 51.46% 64.86% 59.85% 69.74% 79.53% 76.02% 89.29% 92.89% 91.67%
ferences, we consider only users whose home city attributes
contain valid locations at the city level or at a finer granular-
ity, as validated by Yahoo! PlaceFinder.
In our evaluation, we group users into three classes. Class 0
consists of users who have a single activity, either a mayor-
ship, a tip or a done. In this case, the unique choice is to set
the user’s home location equal to that of her activity. Class
1 consists of users who have multiple activities with a pre-
dominant location across them. For these users, the inferred
location matches the most often location of their activities.
Class 2, in turn, consists of users with multiple activities in
which there is no single location that stands out (i.e., there
Figure 7. Cumulative Distribution of Distances Between Inferred and
are ties). Our current inference approach cannot be applied Declared User Home City.
to Class 2 users.
We find that the models produce only marginally different
Thus, we evaluate the proposed models by assessing their results, in terms of accuracy, both per class and overall. As
accuracy on users of both Class 0 and Class 1. The accuracy expected, mayorships are the best single attribute to infer
corresponds to the percentage of correctly inferred locations home location, although, perhaps surprisingly, tips are only
out of all users of each class. Moreover, we also report the marginally worse. Dones, in turn, produce the worst re-
overall accuracy of each model, considering all users that sults among the three attributes, when used in isolation. The
are eligible for inference by the given model (i.e., users who combination of attributes does hurt the accuracy, in com-
have the required attributes). parison with the Mayorship model, in most cases (Mayor-
ship+Tip being the exception), possibly because tips and
Experimental Results dones add some noise. However, note that, despite a some-
In this section, we present the experimental evaluation of what lower accuracy, these combined models actually cover
our inference models. We start by discussing the results for a much larger user population. For instance, the Mayorship
inferring a user’s home city, our main focus, discussing the model can only be applied to 1,814,184 users, whereas the
inference of home state and country later in this section. All model is applicable to 2,823,404. Thus, considering the
actual number of users for which each model was able to
Table 3 shows, for each inference model, the number of users correctly predict the home city, we found that the best model
eligible for inference (i.e., users that have the required at- was All (1,504,262 correct inferences) followed by Mayor-
tribute) in each class (top of the table). It also shows the ship+Tip (1,339,152 correct inferences).
accuracy of the model for users in classes 0 and 1 as well
as the overall accuracy considering all eligible users (bot- To better understand the models’ errors, we computed for
tom). We start by noting that the vast majority of the eli- each incorrect inference the distance between the inferred
gible users (87%- 91%) are in classes 0 and 1. Thus, for city given by the All model and the declared user home city.
most users, either they have a single activity (33-45%) or Figure 7 shows the distribution of these distances. We found
they have multiple activities with a predominant location, that around 46% of the distances are under 50 kilometers,
and thus their home city can be inferred by our approach. which is a reasonable distance between neighboring (twin)cities. Thus, combining these results with the correct infer- model. Also, we can explore more sophisticated machine
ences produced by our model, we find that we can correctly learning approaches in attempt to increase our inference ac-
infer the city of around 78% of the users within 50 kilome- curacy. Moreover, we plan to investigate other types of in-
ters of distance. formation that can be inferred using the same attributes.
We now turn our attention to the inference of a user’s home Acknowledgements
state, whose results are also shown in Table 3. We note This research is partially funded by the Brazilian National
that, in comparison with the home city inference, all mod- Institute of Science and Technology for Web Research (MCT/
els improved for home state inference, reaching an overall CNPq/INCT Web Grant Number 573871/2008-6), and the
accuracy around 75%. Once again, mayorships arise as the authors’ individual grants from CNPq, CAPES and Fapemig.
single attribute that produces the highest accuracy, for home
state inference, followed by tips and dones. Nevertheless all REFERENCES
1. Z. Cheng, J. Caverlee, and K. Lee. You are Where You Tweet: a
models lead to very similar accuracies, both per class and Content-based Approach to Geo-locating Twitter Users. In Proc
overall. Thus, once again, due to the larger user coverage, CIKM’10.
the All model is able to correctly infer the home state of the 2. Z. Cheng, J. Caverlee, K. Lee, and D. Sui. Exploring Millions of
largest number of users (1,948,851). Footprints in Location Sharing Services. In Proc AAAI ICWSM’11.
3. E. Cho, S. Myers, and J. Leskovec. Friendship and Mobility: User
Finally, we also evaluate the models to infer a user’s home Movement in Location-based Social Networks. In Proc ACM
country as a complementary analysis to validate our key as- SIGKDD’11.
sumption that users tend to have mayorships, tips and dones 4. M. Choudhury, H. Sundaram, A. John, D. Seligmann, and A. Kelliher.
“Birds of a Feather”: Does User Homophily Impact Information
close to where he lives. As expected, Table 3 shows that all Diffusion in Social Media? CoRR’10.
models achieve accuracies above 90% for home country in- 5. J. Cranshaw, R. Schwartz, J. Hong, and N. Sadeh. The Livehoods
ference. Unlike in the previous two cases, despite the great Project: Utilizing Social Media to Understand the Dynamics of a City.
similarities in the results, the Tip model is the single attribute ICWSM’12.
model that produces the best accuracy, followed by Mayor- 6. C. Davis Jr., G. Pappa, D. Oliveira, and F. Arcanjo. Inferring the
ship and Done. The combined models produce very similar Location of Twitter Messages Based on User Relationships.
results, with All producing the largest number of correct in- Transactions in GIS, 15(6):735–751, 2011.
ferences (2,549,177). 7. R. Gross and A. Acquisti. Information Revelation and Privacy in
Online Social Networks. In Proc WPES’05.
8. B. Hecht, L. Hong, B. Suh, and E. Chi. Tweets from Justin Bieber’s
Our study presented satisfactory results in predicting user Heart: the Dynamics of the Location Field in User Profiles. In Proc
home location. Thus, an interesting implication of our work CHI’11.
is that even the mispredictions may highlight some implicit 9. I.-F. Lam, K.-T. Chen, and L.-J. Chen. Involuntary Information
user behavior in terms of mobility. At the city level, for Leakage in Social Network Services. In Proc of IWSEC’08.
instance, we observed some users that live nearby the in- 10. N. Li and G. Chen. Sharing Location in Online Social Networks.
ferred cities, which may indicate that they probably live in IEEE Network, 2010.
one place and move frequently to another. At the state level, 11. J. Mahmud, J. Nichols, and C. Drews. Where Is This Tweet From?
the lower but non-negligible fraction of errors indicates that Inferring Home Locations of Twitter Users . In Proc AAAI ICWSM’12.
there are some users that have interstate mobility. Moreover, 12. A. Mislove, B. Viswanath, K. Gummadi, and P. Druschel. You are
Who You Know: Inferring User Profiles in Online Social Networks. In
the inference of the home state may help disambiguate home Proc WSDM’10.
cities, such as the case of Springfield. Finally, at the coun- 13. S. M. News. http://www.socialmedianews.com.au/
try level, we observed that there is a high concentration of foursquare-reaches-15-million-users/.
the activities considered (mayorships, tips and dones) in the 14. A. Noulas, S. Scellato, C. Mascolo, and M. Pontil. An Empirical
declared user home location. This can be verified by the Study of Geographic User Activity Patterns in Foursquare. In Proc
higher accuracy that we obtained in our models. However, ICWSM’11.
inference errors are still possible since some users may have 15. T. Sakaki, M. Okazaki, and Y. Matsuo. Earthquake Shakes Twitter
Users: Real-Time Event Detection by Social Sensors. In Proc
his current home location outdated (e.g., a user who has just WWW’10.
moved to another country) or may travel a lot around the 16. K. Tang, J. Lin, J. Hong, D. Siewiorek, and N. Sadeh. Rethinking
world, or may even have a significant place-based identity Location Sharing: Exploring the Implications of Social-Driven vs.
with some city of another country (as discussed in [8]). Purpose-Driven Location Sharing. In Proc UBICOMP ’10.
17. M. Vasconcelos, S. Ricci, J. Almeida, F. Benevenuto, and V. Almeida.
Tips, Dones and ToDos: Uncovering User Profiles in Foursquare.
CONCLUSIONS AND FUTURE WORK WSDM ’12.
In this paper, we address the problem of privacy inference 18. C. Vicente, D. Freni, C. Bettini, and C. Jensen. Location-Related
using publicly available features in Foursquare. Using a Privacy in Geo-Social Networks. IEEE Internet Computing, 2011.
model that takes into account the majority of places where 19. T. Vgele, C. Schlieder, and C. Schlieder. Spatially- Aware Information
Retrieval with Graph-Based Qualitative Reference Models. In Proc
the user have interacted through mayorships, tips or dones, FLAIRS’03.
we are able to infer with high accuracy where the user cur- 20. Y. Zheng. Location-based social networks: Users. In Y. Zheng and
rent lives or his home location (city, state or country). X. Zhou, editors, Computing with Spatial Trajectories, pages
243–276. Springer, 2011.
As future work, we plan to analyze the impact of differen- 21. D. Zwillinger and S. Kokoska. CRC Standard Probability and
tiating features, e.g. giving weights, in the accuracy of our Statistics Tables and Formulae. Chapman & Hall, 2000.You can also read