CapitaLand Limited Citi 2019 Global Property CEO Conference Florida, U.S 4 - 5 March 2019
←
→
Page content transcription
If your browser does not render page correctly, please read the page content below
CapitaLand Limited

    Citi 2019 Global Property CEO Conference
                   Florida, U.S.
                 4 – 5 March 2019
1
Disclaimer

    This presentation may contain forward-looking statements that involve risks and uncertainties.
    Actual future performance, outcomes and results may differ materially from those expressed in
    forward-looking statements as a result of a number of risks, uncertainties and assumptions.
    Representative examples of these factors include (without limitation) general industry and
    economic conditions, interest rate trends, cost of capital and capital availability, availability of
    real estate properties, competition from other companies and venues for the sale/distribution
    of goods and services, shifts in customer demands, customers and partners, changes in
    operating expenses, including employee wages, benefits and training, governmental and
    public policy changes and the continued availability of financing in the amounts and the terms
    necessary to support future business. You are cautioned not to place undue reliance on these
    forward looking statements, which are based on current view of management on future
    events.

2
Contents
    • FY2018 At A Glance
      –   Key Achievements
      –   Financial Highlights
      –   Looking Ahead

    • Financial Performance
    • Business Updates
      - CapitaLand Singapore, Malaysia, Indonesia
      - CapitaLand China
      - CapitaLand Vietnam
      - CapitaLand International
      - Retail Platform
      - Commercial Platform
      - Lodging Platform
      - Investment Management Platform

3
FY2018 At A Glance

                         Artist’s Impression
4
FY2018 At A Glance

        Key Achievements

       Divesting
    Non-core Assets
                          Sembawang Shopping Centre,                                                                                                 Citadines Harbourview
                                                                               Twenty Anson, Singapore            CapitaMall Quanzhou
                                 Singapore                                                                                                                Hong Kong

     Replenishing
     Landbank In
    Core Residential
       Markets
                                                                                                                                                                     Artist’s Impression of landed residential
                        Pearl Bank Apartment,          Artist’s impression of Sengkang mixed-use site,                                                                  development in Ho Chi Minh City,
                                                                                                         Site Zengcheng District, Guangzhou, China
                              Singapore                                    Singapore                                                                                                  Vietnam

      Identifying
       Attractive
      Investment
        Property
     Opportunities                                                                                                                                   CapitaSpring,
                        Artist’s Impression - 3rd Raffles City In Shanghai         Gallileo, Frankfurt    Heronfield in Seattle, USA
                                                                                                                                                      Singapore

5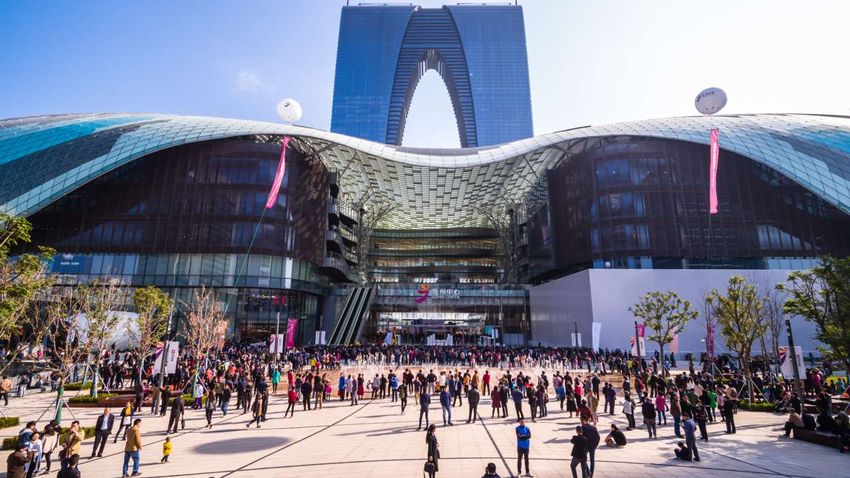
FY2018 At A Glance

       Key Achievements (cont’d)

    Diversifying Into
      Developed
        Markets
                          Gallileo, Frankfurt               Heronfield, Washington                    Marquessa Villas, California                     Village at Union Mills, Washington

      Exceeded
     80K Keys For
       Lodging                                                       Citadines Bacolod     Citadines Blue Cove       Ascott Sudirman        Ascott Songshan Lake Dongguan and
                            YELLO Hotel Manggaraii, Jakarta           City, Cebu City            Danang,                 Jakarta             Citadines Songshan Lake Dongguan

      Significant
       Progress
       Growing
      Operating
       Platforms        NomadX, Singapore’s first ‘phygital’
                                     multi-
                                                                    Flex workspaces available in Capital Tower,
                                                                              Singapore from 1Q 2019
                                                                                                                       Citadines Brand Debut In the U.S. - Citadines Connect Fifth Avenue, New
                                                                                                                                                          York

      Opening Of
     New Malls In
     Core Markets        CapitaMall Tiangongyuan, Beijing                   CapitaMall LuOne, Shanghai                           CapitaMall ONE, Changsha
6
FY2018 At A Glance

        Exceeded S$3 Billion Annual Recycling Target
    S$4.0 Billion Capital Recycled Generating S$348.8 Million of Portfolio Gains

                                                                                                            Consideration
    Divestments
                                                                                                              S$ million

    20 retail assets in China                                                                                                     1,705.9

    Twenty Anson, Singapore                                                                                                          516.0

    A real estate investment in Vietnam                                                                                              441.5
                                                                                                                                                   Sembawang Shopping Centre,
                                                                                                                                                          Singapore
    Sembawang Shopping Centre, Singapore                                                                                             248.0

    Land parcel in Ahmedabad, India                                                                                                    10.8

    Real estate investments in China                                                                                                 185.9

    70% stake in Westgate, Singapore to CMT                                                                                          789.6
                                                                                                                                                        Westgate, Singapore

    Citadines Harbourview Hong Kong                                                                                                    97.0
                                                                                                                                                                                Twenty Anson, Singapore
    Total                                                                                                                         3,994.7

     Note:
     •   The table includes assets divested to unrelated parties and CapitaLand REITs/ Funds. Gain on divestments are based on effective stakes.
7    •   Unless specified, transactions were completed.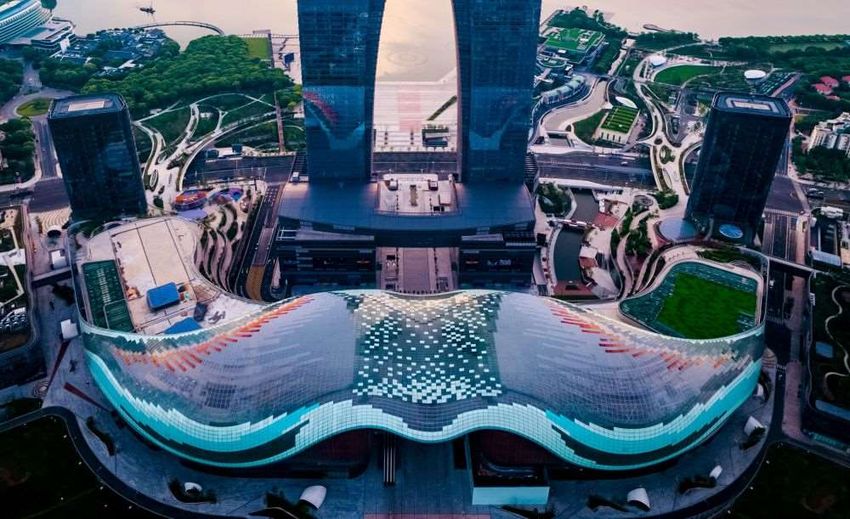
FY2018 At A Glance

        Proceeds Reinvested To Position Portfolio For Future Growth
    Capital Redeployed Into S$6.1 Billion New Investments
                                                                                                          Consideration
    Investments
                                                                                                            S$ million
    Pearl Bank Apartments, Singapore                                                                                              728.0

    Grade A office , Gallileo in Frankfurt, Germany                                                                               569.6

    Mixed-use site in Chongqing, China                                                                                            459.0                                                                   First Integrated
                                                                                                                                                         Sengkang Central, Singapore                      Development in
    Site in Tay Hoy, Vietnam                                                                                                        40.4                                                                  Hanoi

    Two residential sites in Guangzhou, China                                                                                     409.3

    Sengkang Central mixed-use site, Singapore                                                                                    388.9

    70% stake in Westgate, Singapore                                                                                              789.6

    Residential site in HCMC, Vietnam                                                                                               81.4

    70% stake in TAUZIA                                                                                                             35.4

    Multifamily portfolio, U.S.                                                                                                1,142.0                             Artist’s Impression of lyf One North

    lyf one-north, Singapore                                                                                                        62.4

    50% stake in The Work Project                                                                                                   27.0
    75% stake in mixed-use site in Guangzhou Science City                                                                         131.3

    50% stake in 3rd Raffles City in Shanghai                                                                                  1,269.8
                                                                                                                                                                                    Third Raffles City Development In
                                                                                                                                                   Parkfield, Denver, U.S.
    Total                                                                                                                      6,134.1                                                       Shanghai, China
     Note:
     •   The table includes assets acquired by CapitaLand/ CapitaLand REITs/ Funds from unrelated parties. Purchase consideration figures are on 100% basis.
8
     •   Unless specified, transactions were completed.
FY2018 At A Glance

            Growing Significant Scale Across Global Platforms

                                                         Group Managed Real Estate      Revenue Under Management
                                                         Assets

                                                         S$100.1 Billion                S$8.9 Billion of which
             Raffles City Hangzhou, China                                               Rental RUM is S$5.2 Billion

                                                         Total Home Units Constructed   Office Tenants
                                                         (Since 2000)

    CapitaGreen, Singapore
                                Artist’s Impression of
                                                         ~98,000                         ~1,700
                                    CapitaSpring

                                                         Gross Turnover Sales            Shopper Traffic In Our Malls
                                                         Of Retailers

                                                         S$11.4 Billion                  ~1.2 Billion
                Ion Orchard, Singapore

                                                         Retail Leases                   Unique Serviced Residence
                                                                                         Customers
                                                         >15,000                         >1.3 Million
            Ascott Huai Hai Road, Shanghai
9
FY2018 At A Glance

             What We Said… We Delivered

      21 : 79
               1

     TRADING : INVESTMENT

                                                       42 : 58
                                                                    2                      2
          PROPERTIES

                                                                                                                S$4 billion
                                                      EMERGING : DEVELOPED                                                            3
        TARGET – 20 : 80                                    MARKETS

                                                                                                                                                          S$100.1
                                                                                                                                                                                    4
                                                                                                                        DIVESTED VALUE
                                                            TARGET – 50 : 50
                                                                                                                                                                   billion
                                                                                                                                                             GROUP RE AUM AS
                                                                                                                     TARGET – S$3 BILLION                     AT 31 DEC 2018
                                                                                                                      ASSET RECYCLING
                                                                                                                         ANNUALLY

       Note:                                                                                                                                              TARGET – S$100 BILLION GROUP
       1. As a percentage of Group’s effective share of total assets (FY2017: 18%).
       2. Based on total assets as of FY 2018.
                                                                                                                                                              RE AUM BY YEAR 2020
       3. Figure relates to 100% of assets divested to unrelated parties and CapitaLand REITs/ Funds (FY2017: S$2 billion).
10     4. Refers to the total value of all real estate managed by CL Group entities stated at 100% of property carrying value (FY2017: S$88.8 billion).
FY2018 At A Glance
Consistent Improvement In ROE
Aim To Achieve A Return On Equity That Is Above The Cost Of Equity On A Sustainable Basis
ROE (%)
10 9.3 Operating PATMI (1)
Portfolio gains (2)
8.6
Revaluations and Impairments
8 2.9
1.8
6.6
6 1.2 1.7
1.8
0.5
4
4.9 5.1
4.6
2
0
(3)
FY 2016 FY 2017 (Restated) FY 2018
Note:
1. Include corporate and unallocated cost.
2. Include realised revaluation gain/ (loss) of investment properties.
3. Comparatives have been restated due to adoption of SFRS (I) 15 Revenue from Contracts with Customers.
11FY2018 At A Glance
Smooth Leadership Transition
“I have had the honour and the privilege of working with so
many talented and dedicated colleagues at CapitaLand.
Together we have accomplished a lot. CapitaLand is well
positioned for the next phase of growth.”
Mr Lim Ming Yan,
Former President & Group CEO
“I am deeply honoured to have this opportunity to lead
CapitaLand in its next phase of growth. Ming Yan has
built a strong foundation for expansion. I will build upon
it to bring CapitaLand forward and to achieve greater
returns to shareholders. I look forward to working with a
very experienced Board and our dedicated colleagues
at CapitaLand to shape a greater future for the
Group.”
Mr Lee Chee Koon,
President & Group CEO
12FY2018 At A Glance
Sustainability & Corporate Governance Awards
Ranked 3rd in the Singapore Governance and Transparency
Index (SGTI) 20181
Top 10% ESG company GRESB 5 Star, 2018 Singapore Corporate Awards 2018
in real estate industry Silver – “Best Managed Board”
Securities Investors Association Singapore (SIAS) 2018
19th Investors’ Choice Awards
Largest winner: 7 awards for 3rd consecutive year.
Including Most Transparent Company Award (Properties)
Highest-ranked real A constituent of:
estate management FTSE4Good Index Series
and development
company, 2019
A constituent of:
• MSCI ESG Leaders Index
2018
• MSCI SRI Index 2018
A constituent of:
Dow Jones Sustainability • Euronext Vigeo Index: World 120 Non-executive Independent Director, Mr Stephen
World and Asia Pacific • STOXX® Global ESG Leaders Indices Lee, receives Best Managed Board (Silver) award
Indexes 2018 • iEdge SG ESG Leaders Index
• iEdge SG ESG Transparency Index
*The inclusion of CapitaLand Limited in any MSCI index and the use of MSCI logos, trademarks, service marks or index names herein, do not constitute a sponsorship, endorsement or promotion
of CapitaLand Limited by MSCI or any of its affiliates. The MSCI Indexes are the exclusive property of MSCI. MSCI and the MSCI index names and logos are trademarks or service marks of MSCI or
its affiliates.
13 1. This annual study was conducted by the NUS Business School’s Centre for Governance, Institutions and Organisations (CGIO)Financial Highlights
Suzhou Mall, China
14Financial
Key Takeaways – FY20181
Robust Operating Performance
• PATMI of S$1,762.5 million (vs. S$1,569.6 million in FY 2017) improved due to
contributions from key PATMI drivers, namely:
- Higher contributions from trading business in China and Vietnam as well as higher
recurring income from investment properties
- Higher portfolio gains realised from asset recycling
- Higher gains from revaluation of investment properties
Resilient Balance Sheet
• Key coverage ratios
- Net debt/equity at 0.56x (vs. 0.49x in FY2017)
- Interest servicing ratio at 4.4x (vs. 6.7x in FY2017)
- Interest coverage ratio at 8.3x (vs. 8.6x in FY2017)
Note:
1. FY 2017 results have been restated due to adoption of SFRS (I) 15 Revenue from Contracts with Customer.
15Financial
Overview – 4Q 20181
Revenue PATMI
S$1,624.5 S$475.7
million
million
34% YoY 71% YoY
EBIT Operating PATMI
S$1,132.2 S$213.8
million
million
52% YoY 26% YoY
4Q 2018 PATMI Increased Due To
• Higher Handover In China And Contribution From Newly Acquired And Operational Properties
• Higher Gains From Asset Recycling And Revaluations Of Investment Properties
Note:
16 1. 4Q 2017 results restated to take into account the retrospective adjustments relating to SFRS(I)15 Revenue from Contracts with Customers.Financial
Overview – FY20181
Revenue PATMI
S$5,602.4 S$1,762.5
million
million
21% YoY 12% YoY
EBIT Operating PATMI
S$4,145.0 S$872.2
million
million
26% YoY 6% YoY
Excluding The Gain From The Sale Of Nassim2 In 1Q 2017,
• PATMI Would Have Been 25% Higher
• Operating PATMI Would Have Been 14% Higher
Note:
1. FY 2017 results restated to take into account the retrospective adjustments relating to SFRS(I)15 Revenue from Contracts with Customers.
17 2. PATMI FY 2017 included a gain of S$160.9 million from the sale of 45 units of The Nassim.Financial
FY 2018 PATMI Composition Analysis
12% 200000%
S$’ million 49% 20% 31%
180000%
160000%
542
349 1,763 140000%
120000%
179
100000%
170
80000%
872
60000%
40000%
20000%
0%
Operating PATMI Portfolio Gains / Revaluations and PATMI
Realised FV Gains Impairments
Realised revaluation gains relate to 20 China Malls, Twenty Anson, Bugis Village & Westgate
Cash PATMI1 Made Up 69% Of Total PATMI
Note:
1. Cash PATMI = Operating PATMI + Portfolio Gains + Realised Revaluation Gains
18Capital Management
Well-Managed Maturity Profile1 Of 3.6 Years
Plans In Place For Refinancing / Repayment Of Debt Due In 2019
S$B
9.0
Total Group cash balances and available undrawn facilities of CL's treasury vehicles = ~S$7.9 billion
8.0
7.0
6.0
5.0 4.4
4.1
4.0 3.2 3.4
3.2
3.0
2.0
2.2 1.7 1.4
2.0
1.0 0.2
1.0
0.0
2019 2020 2021 2022 2023 2024 2025 2026 2027+
On Balance Sheet Debt Due In 2019 S$’ billion
To be refinanced 2.4 Total
To be repaid 0.8 Debt to be repaid or refinanced as planned
Total 3.2 REIT Level Debt (2)
As a % of Total On Balance Sheet Debt 13.5%
Well Equipped With ~S$7.9 Billion In Cash And Available Undrawn Facilities To Capture Investment
Opportunities
Notes:
(1) Based on the put dates of the convertible bonds.
(2) Ascott Residence Trust (ART), CapitaLand Commercial Trust (CCT), CapitaLand Mall Trust (CMT), CapitaLand Malaysia Mall Trust (CMMT), CapitaLand Retail China Trust (CRCT) and RCS
19 Trust (Raffles City Singapore – directly held by CCT and CMT).Capital Management
Disciplined Interest Cost Management
Implied Interest Rates1 Kept Low at 3.2%
%
6.0
5.0
5.0
4.0 3.7
3.4 3.5
3.3 3.2
3.2
3.0
Implied Interest Rate
2.0
1.0
FY 2012 FY 2013 (Restated) 2 FY 2014 FY 2015 FY 2016 FY 2017 FY 2018
3
Note:
1. Implied interest rate for all currencies = Finance costs before capitalisation/Average debt.
20 2. Implied interest rate for all currencies before restatement was 4.2%.Capital Management
Delivering Sustainable Shareholder Value
Secured First And Largest S$300 Million Effective Deployment Of Capital And
Sustainability-Linked Loan In Asia’s Real Estate Returning Value To Shareholders
Sector
Period From 20 Feb 2018 To 31 Aug 2018
341.8
95.7
CapitaGreen is a BCA Platinum Green 2018
Raffles City Hangzhou is a Leadership in Energy
Mark and Universal Design certified Grade
and Environmental Design (LEED) Gold Value No. of
A office development in Singapore’s
certified integrated development in China (S$ million) Shares (million)
Central Business District
• 5-year term loan and revolving credit facility linked to CapitaLand’s
listing on the Dow Jones Sustainability World Index (DJSI World) • Repurchased shares at an average price of S$3.57 per share,
representing a Price-to-Book ratio of ~0.8 times
• Flexibility to deploy proceeds for general corporate purposes. This
contrast with green loans which proceeds requires to be applied • Number of repurchased shares is equivalent to ~2.3% of total issued
towards the funding of specific projects shares1
3
• Interest rates to be further reduced on a tiered basis, contingent on • Utilised ~66% of 2017 Approved Mandate2 and ~45% of 2018
CapitaLand’s ongoing performance measured against ESG Approved Mandate3
indicators based on RobecoSAM’s Corporate Sustainability
Assessment and a retained listing on the DJSI World
Note:
1. The Company's issued shares excluding treasury shares as at the date of the share buy-back resolution.
21 2. Approval was obtained on 24 April 2017 and expired on 30 April 2018.
3. Approval was obtained on 30 April 2018 and will expire on the date on which the next AGM is held or required by law to be hel d.Financial
Proposed 12 Cents1 Dividend Per Share For FY2018
Proposed Dividend is 40% Of FY2018 Cash PATMI 2
Dividend per share (cents)
14
12 12
12
10
10 9 9
8
8
6
4
2
0
FY 2013 FY 2014 FY 2015 FY 2016 FY 2017 FY 2018
In Line With CapitaLand’s Goal To Ensure Sustainable Dividends For Our Shareholders
Note:
1. Subject to final shareholders’ approval at the upcoming Annual General Meeting.
2. Barring unforeseen circumstances, the Company’s policy is to declare a dividend of at least 30% of the annual profit after tax and non-controlling interests excluding
22 unrealized revaluation gains or losses as well as impairment charges or write backs.Looking Ahead
Raffles City Chongqing, China
23Looking Ahead
Recap
• Another year of solid earnings growth
- Total PATMI of S$1.76 billion
- Operating PATMI of S$872.2 million
• Achieved an ROE of 9.3% - an improvement from 8.6% in FY 2017 and
6.6% in FY 2016
• Proposed final ordinary dividend of 12 Singapore cents a share for FY
2018
24Looking Ahead
Ready for the Next Phase of Growth
• CapitaLand announced our proposed transaction of 100% of Ascendas-Singbridge (ASB) in
January 2019
• An Extraordinary General Meeting (EGM) will be convened by 2Q 2019 to seek independent
shareholders’ approval for this transaction
• As an interested party, Temasek and its associate parties will not be allowed to vote at this
EGM
• Advanced due diligence is currently underway - shareholder circular including the
Independent Financial Advisor and valuer reports are expected to be released by 2Q 2019
• Planning for post-deal integration has commenced with focus on alignment of vision, growth
strategy, culture, operations and processes. Integration Committee formed consisting of senior
members of CapitaLand and ASB to drive success
25Thank You
Supplementary Information

                                 Artist’s Impression Of Raffles City Chongqing, China
27
Financial Performance
Artist’s Impression Of CapitaSpring, Singapore
28Financial
Financial Performance For FY 2018
S$' million FY 2017 FY 2018
2
Change
3 Change
(including (excluding
(Restated)1
gain from gain from
The Nassim) The Nassim)
Revenue 4,618.2 5,602.4 21% 21%
EBIT 3,302.2 4,145.0 26% 32%
PATMI 1,569.6 1,762.5 12% 25%
Operating PATMI 927.2 872.2 -6% 14%
Portfolio Gains 4 318.4 348.8 10% 10%
Revaluation Gains/ Impairments 324.0 541.5 67% 67%
Healthy Operating PATMI Growth Underpinned By Contribution From Residential Projects In China And
Vietnam, Newly Acquired And Operational Investment Properties In Singapore, China And Germany
Note:
1. FY 2017 results restated to take into account the retrospective adjustments relating to SFRS(I)15 Revenue from Contracts with Customers.
2. The Group consolidated CapitaLand Mall Trust, CapitaLand Retail China Trust and RCS Trust into the Group’s results with effect from August 2017. The consolidation of three trusts increased the Group’s revenue and EBIT
by $611.1 million and S$446.9 million respectively for FY 2018, offset by the absence of a re-measurement gain of S$12.0 million in FY 2017.
3. FY 2017 Operating PATMI included a gain of S$160.9 million from the sale of 45 units of The Nassim.
4. Includes realised revaluation gains in respect of divestments of Westgate, Bugis Village and Twenty Anson in Singapore and 20 retail malls in China in FY 2018. Realised fair value gains for FY 2017 relate to divestments of
six malls in India, Golden Shoe Carpark, serviced residence component of Funan and One George Street in Singapore, Citadines Biyun, Shanghai and Citadines Gaoxin, Xi’an and 2 serviced residences in Germany.
29Capital Management
Balance Sheet & Liquidity Position
FY 2017 FY 2018
Leverage ratios (Restated)
Net debt/total assets1 0.28 0.31
Net debt/equity 0.49 0.56
Coverage ratios
Interest coverage ratio2 8.6 8.3
Interest service ratio2 6.7 4.4
Others
% Fixed rate debt 69% 74%
Ave debt maturity3 (Yr) 3.4 3.6
NTA per share ($) 4.20 4.40
Balance Sheet Remains Robust
Note:
1. Total assets excludes cash.
2. Interest Coverage Ratio = EBITDA/ Net Interest Expenses; Interest Service Ratio = Operating Cashflow/ Net Interest Paid. EBITDA includes revaluation gain.
30 3. Based on put dates of Convertible Bond holders.Business Updates
Suzhou Center Mall, China
31Business Updates
Building A Global Presence
FY 2018 Real Estate Assets Under Management (AUM) Has Surpassed 2020 S$100.1 Billion1 AUM
Target
Vietnam,
2%
Rest of The World,
15%
Singapore, Malaysia &
Indonesia,
35%
Total RE AUM
S$100.1 Billion
China,
48%
• RE AUM Grew By S$11.3 Billion, A 12% Increase y-o-y
• ~57% Of Total RE AUM Held By REITs And Funds
32 Note:
1. Refers to the total value of all real estate managed by CL Group entities stated at 100% of property carrying value.Business Updates
Diversified Asset Base Continues To Generate Stable Recurring Income
Aim To Achieve Optimal Asset Class Allocation
Corporate & Others,
Corporate & Others, 3% 3% Residential &
Vietnam, Commercial Strata, 15%
2%
Lodging,
15%
Rest of The World,
14%
Singapore, Malaysia &
Indonesia,
45%
Total Assets Total Assets
S$64.6 Billion S$64.6 Billion
China,
36%
Commercial, 27% Retail,
40%
• Total Assets from Developed Markets is ~58%
• Trading Properties Made Up ~21% of Group’s Effective Share of Total Assets
33CapitaLand
Singapore, Malaysia and Indonesia
34 Artist’s Impression Of Sengkang Central, SingaporeCapitaLand Singapore, Malaysia and Indonesia
Singapore, Malaysia & Indonesia Asset Portfolio
S$29.3 Billion Corresponding To 45% Of Group’s Total Assets
Residential & Lodging,
1% Residential &
Lodging, Commercial Strata,
Commercial Strata,
6% 5%
5%
Commercial,
33%
Total Assets: Total EBIT1
S$1,846.2
S$29.3 Billion
Retail, Million
52%
Commercial,
37%
Retail,
61%
Note:
1. Total EBIT by asset class FY 2018.
35Singapore - Residential
Singapore Residential Sales
Sold 99 Units Worth S$371 Million
1Q
2Q
4Q 2018: ~0.1x y-o-y 4Q 2018: ~0.1x y-o-y 3Q
FY 2018: ~0.2x y-o-y FY 2018: ~0.2x y-o-y 4Q
440 409 1,600 1,494
400
1,400
360 114 328
Sales Value (S$ million)
1,200
Residential Units
320
280 1,000 373
240 108
800
200
99 289 371
160 600
103
120 8 33
400
80 14 52
37 504 136
40 84 200
40 150
0 0
FY 2017 FY 2018 FY 2017 FY 2018
Note:
1. Units sold and sales value are based on options exercised.
2. FY 2017 figures include the sale of 45 units in The Nassim (worth ~S$407.2 million).
36Singapore - Residential
Launched Projects Substantially Sold1
~ 99% Of Units Sold As At 31 Dec 20182
Units sold as at % of launched
Project Total units
31 Dec 2018 units sold
Marine Blue3 124 115 92.7%
Sky Habitat 509 506 99.4%
The Interlace4 1,040 1,039 99.9%
The Orchard Residences 175 173 98.9%
Note:
1. Figures might not correspond with income recognition.
2. Sales figures of respective projects are based on options issued.
3. Sell-by date for Marine Blue has been extended to 10 April 2019.
37 4. Sell-by date for The Interlace has been extended to 13 March 2019.CapitaLand China
Raffles City Hangzhou, China
38CapitaLand China
China Asset Portfolio
S$23.4 Billion Corresponding To 36% Of Group’s Total Assets
Lodging,
6% Lodging,
5%
Residential &
Commercial Strata, Residential &
Commercial, Commercial, Commercial Strata,
32%
20% 13% 38%
Total Assets: Total EBIT1
S$23.4 Billion S$1,987.6
Million
Retail, Retail,
42% 44%
Note:
1. Total EBIT by asset class FY 2018.
39CapitaLand China
Identifying Attractive Investment Properties Opportunities
Acquisitions Aligned With CapitaLand’s Strategy To Invest In Dominant Assets In Core Chinese
City Clusters
• Formed 50:50 joint venture with GIC, through RCCIP III fund, to
acquire Shanghai’s tallest twin tower1 for RMB 19.5 billion
• An iconic landmark in Shanghai’s North Bund, the property is set to
be CapitaLand’s 3rd Raffles City in Shanghai and 10th globally
• Property construction to be completed by June 2019
• Demonstrate fund management capability to grow AUM
• Formed 50:50 joint venture to acquire approximately 70% of Pufa Tower for
RMB 2.8 billion
• First office building in Lujiazui CBD in Pudong New Area, Shanghai’s most
coveted office location for financial and professional services companies
• Immediate contributing to the Group’s recurring income
• To be seed asset for the Group’s new commercial value-add fund
Note:
40 1. CapitaLand holds effective stake of 21% through RCCIP III.China - Residential
Successful Bid For Prime Mixed-Use Site In Guangzhou Science City
Continued To Gather Strong Capital Recycling Momentum In China With Another RMB 882 million
Invested In Guangzhou
Greenfield Site located in Guangzhou Science City – A core zone of China’s Silicon Valley
• Acquired 75% stake in a 4.7 hectare greenfield site in Guangzhou which will be developed into
investment assets comprising office, retail space and serviced residence
• Located in core zone of Guangzhou Science City, Huangpu District, a government-backed innovation
and technology hub
• Tap into growth potential of the Greater Bay Area and target for completion in 2022
41China - Residential
China Residential Sales
• 92% Launched Units Sold As At 31 Dec 20181
• Achieved Solid Sales Despite Deferring Launches Due To Tighter Government Measures
4Q 2018: ~1.8x y-o-y 4Q 2018: ~1.9x y-o-y
FY 2018: ~0.6x y-o-y FY 2018: ~0.8x y-o-y 1Q
2Q
10,000 3Q
15,770
16,000 4Q
8,769
9,000
2,683
Sales Value (RMB million)
1,298 14,000
8,000 12,539
Residential Units
7,000 12,000
2,163 4,407
6,000 10,000 5,024
4,938
5,000 8,000
4,000
3,159 2,368 6,000 4,748 2,608
3,000
4,000
2,000 826 3,231
746 2,000 3,932
1,000 2,149
998 1,676
0 0
FY 2017 FY 2018 FY 2017 FY 2018
Note:
1. Units sold includes options issued as at 31 December 2018.
2. Above data is on a 100% basis. Comparative figures include strata units in integrated development. 2017 figures include the remaining inventory sold through the divestment of Central Park
City Wuxi (108 residential units with a total value RMB192 million) and The Botanica Chengdu (total value RMB105 million).
42 3. Value includes carpark, commercial and value added tax.China – Residential
High Sell-Through Rate For Launches In 4Q 2018
La Botanica, The Metropolis, The Lakeside, Parc Botanica,
Xian Kunshan Wuhan Chengdu
• Launched 535 units in • Launched 460 units in • Launched 372 units in • Launched 388 units in
October 2018 October 2018 October 2018 November 2018
• 99% sold with ASP • About 85% sold with ASP • About 90% sold with ASP • 100% sold with ASP
~RMB11.4k psm ~RMB23.7k psm ~RMB9.0k psm ~RMB8.7k psm
• Sales value • Sales value • Sales value • Sales value
~RMB597 million ~RMB998 million ~RMB316 million ~RMB334 million
Strong Broad-Based Demand Across CapitaLand’s Key Focused City Clusters
43China - Residential
Cautiously Optimistic On China Property Market
~ 7,000 Units Ready To Be Released In 2019
City Project Total Units
Beijing Vermont Hills 196
Chengdu Century Park (East) 751
Parc Botanica 968
Chongqing Raffles City Residences 629
Spring 348
Guangzhou LFIE (PYD) 160
La Riva 303
Shanghai Hanzhonglu Plot 92 138
Shenyang Lake Botanica 860
Wuhan Lakeside 346
Xi’an La Botanica 2,264
Grand Total 6,963
44 Note: Units will be released for sale subject to regulatory approval.China - Residential
China Residential Handover
Handover Value Remains Stable Y-o-Y
4Q 2018: ~1.3x y-o-y 4Q 2018: ~1.9x y-o-y 1Q
FY 2018: ~1.1x y-o-y FY 2018: ~0.9x y-o-y 2Q
3Q
11,958 4Q
7,500 12,000
6,857 11,019
7,000
6,500 6,125 10,500 2,556
Value (RMB million)
6,000
Residential Units
5,500 2,764 9,000
4,777
5,000 2,156
7,500 3,257
4,500
4,000
6,000
3,500 1,279
1,646 2,122
3,000 3,182
4,500
2,500
2,000 1,486 3,000 2,202
1,108
1,500
1,000 1,500 2,963
500 1,215 1,328 1,918
0 0
FY 2017 FY 2018 FY 2017 FY 2018
Note :
1. Above data is on a 100% basis. Comparative figures include strata units in integrated developments. 2017 figures include the remaining inventory considered as sold arising from the
divestment of Central Park City Wuxi (108 residential units with a total value RMB183 million) and The Botanica Chengdu (total value RMB100 million).
45 2. Value includes carpark and commercial.China - Residential
Healthy Future Revenue Recognition
• ~7,000 Units Sold1 With A Value Of ~RMB 15.6 Billion2 Expected To Be Handed Over From 2019
Onwards
• ~70% Of Value Expected To Be Handed Over In 2019
Vermont Hills, Beijing The Metropolis, Kunshan La Botanica, Xi’an
Note:
1. Units sold include options issued as at 31 December 2018. Above data is on a 100% basis, including strata units in integrated developments.
2. Value refers to value of residential units sold including value added tax.
46China - Residential
On-Time Completion And Handover
Vermont Hills, La Botanica, Citta Di Mare, New Horizon,
Beijing Xi’an Guangzhou Shanghai
Pending picture
• Completed 88 units • Completed 1,386 units • Completed 378 units • Completed 485 units
• 97% sold with • 100% sold with • 99% sold with • 100% sold with
• ASP: RMB30.1k psm • ASP: RMB8.8k psm • ASP: RMB19.5k psm • ASP: RMB21.5k psm
• Sales value: ~RMB1,402 • Sales value: ~RMB1,219 • Sales value: ~RMB804 • Sales value: ~RMB910
million million million million
• Handed over 79% of the • Handed over 100% of the • Handed over 100% of the • Handed over 100% of the
units sold units sold units sold units sold
Note: Sales value includes value added tax.
47China - Residential
Residential / Trading Sales & Completion Status
Projects Units CL effective % of Average Completed in Expected Completion for
launched stake launched Selling launched units
units sold 1 Price2
% As at 31 Dec RMB/Sqm 4Q 2018 2019 2020
2018
SHANGHAI
New Horizon Ph 2 - Blk 8 to 12 485 95% 100% 22,027 485 0 0
KUNSHAN
4
The Metropolis Ph 2A – Blk 15 and 18 709 99% 0 0 0
The Metropolis Ph 3 – Blk 2 to 5, 8 1,111 99% 0 1,111 0
3
The Metropolis Ph 4 – Blk 6, 9 and 10 460 85% 0 0 460
The Metropolis – Total 2,280 100% 96% 23,654 0 1,111 460
NINGBO
4
The Summit Executive Apartments (RCN) 180 55% 35% 21,691 0 0 0
BEIJING
4
Vermont Hills Ph 1 86 97% 0 0 0
Vermont Hills Ph 2 88 97% 88 0 0
Vermont Hills Ph 3 87 64% 0 87 0
Vermont Hills – Total 261 100% 86% 35,808 88 87 0
WUHAN
Lakeside Ph 2A 488 99% 96 392 0
3
Lakeside Ph 2B 372 90% 0 0 372
Lakeside - Total 860 100% 95% 8,997 96 392 372
4
CapitaMall Westgate, Wuhan (SOHO) 399 100% 100% 17,030 0 0 0
GUANGZHOU
Citta di Mare – Blk 7 to 8 & 33, Townhouse & Villa 577 45% 86% 28,340 378 199 0
3
La Riva Ph 1A 619 80% 35% 47,304 0 0 619
CHENGDU
4
Chengdu Century Park - Blk 1, 3, 4 & 14 (West site) 588 99% 0 0 0
4
Chengdu Century Park - Blk 9 to 13 (West site) 828 99% 0 0 0
Chengdu Century Park (West site) – Total 1,416 60% 99% 18,007 0 0 0
3
Chengdu Century Park - Blk 11, 12 & 13 (East site) 340 98% 221 119 0
3
Chengdu Century Park - Blk 6 & 7 (East site) 233 70% 0 0 233
Chengdu Century Park (East site) - Total 573 60% 87% 20,104 221 119 233
3
Parc Botanica - Phase 2 784 56% 100% 8,750 0 784 0
CHONGQING
Raffles City Residences (RCCQ) - T1, T2 & T6 769 63% 71% 42,111 0 501 268
Sub-total 9,203 88% 1,268 3,193 1,952
48China - Residential
Residential / Trading Sales & Completion Status (cont’d)
Projects Units CL % of Average Completed Expected Completion for
launched effective launched Selling units in launched units
stake 1 2
units sold Price
% As at 31 Dec RMB/Sqm 4Q 2018 2019 2020
2018
SHENYANG
3, 4
Lake Botanica - Phase 4 (Plot 4) 612 60% 70% 6,022 0 0 0
XIAN
4
La Botanica - Phase 2A (2R8) 432 99% 0 0 0
4
La Botanica - Phase 5 (2R6) 612 99% 0 0 0
4
La Botanica - Phase 7 (2R4) 1,619 99% 0 0 0
La Botanica - Phase 8 (3R2) 1,703 99% 0 1,703 0
3
La Botanica - Phase 9 (2R5) 2,449 99% 1,386 0 1,063
La Botanica - Total 6,815 38% 99% 11,370 1,386 1,703 1,063
Sub-total 7,427 97% 1,386 1,703 1,063
CL China 16,630 92% 2,654 4,896 3,015
Note:
1. % sold: Units sold (Options issued as of 31 December 2018) against units launched.
2. Average selling price (RMB) per sqm is derived using the area sold and sales value achieved (including options issued) in the latest transacted quarter.
3. Launches from existing projects in 4Q 2018, namely The Metropolis: 460 units, Lakeside: 372 units, La Riva: 619 units, Century Park (East): 352 units, Parc Botanica: 388 units, Lake Botanica
Shenyang: 211 units and La Botanica: 535 units.
4. Projects/Phases fully completed prior to 4Q 2018.
49Raffles City China Portfolio 50 Artist’s Impression Of Raffles City Chongqing, China
Raffles City China Portfolio

          Robust NPI
                                                                                                           Net Property Income2
                                                                                                               (RMB million)
                                                                                                                                          NPI         NPI yield on
                                                      CL effective stake
                                                      1                                                        (100% basis)
           Raffles City               Total GFA (sqm)                                                                                 Y-o-Y growth   valuation3 (%)
                                                             (%)
                                                                                                                                          (%)         (100% basis)
                                                                                                         FY 2018            FY 2017

             Shanghai                        ~140,000                          30.7                          575             576         -0.2%

               Beijing                       ~111,000                          55.0                          266             259          2.7
                                                                                                                                                       ~4 to 5%
            Chengdu                          ~209,000                          55.0                          181             170          6.5

              Ningbo                         ~82,000                           55.0                           88              86          2.3
                                                                                                                               5
           Changning                         ~269,000                          42.8                          392              -
                                                                                                                   4           5        Not
            Hangzhou                         ~182,000                          55.0                         114               -                           ~3%
                                                                                                                                      meaningful
                                                                                                                               5
            Shenzhen                         ~122,000                          30.4                          166              -

     Note:
     1.  Relates to Gross Floor Area of leasing components excluding carparks.
     2.  Excludes strata/trading components. Comparative NPI adjusted to include government rebates.
     3.  NPI yields based on valuations as at 31 December 2018 and on an annualised basis.
     4.  Relates mainly to retail, office and serviced residence components, while hotel have yet to commence operations.
51   5.  Not meaningful as these properties’ main components (retail and office) only commence operations in 2Q 2017.
Raffles City China Portfolio
Strong Committed Occupancy
Commence
1 2016 2017 2018
Operations
Raffles City Shanghai
- Retail 100% 100% 100%
2003
- Office 95% 97% 91%
Raffles City Beijing
- Retail 100% 100% 100%
2009
- Office 95% 99% 96%
Raffles City Chengdu
- Retail 98% 96% 100%
- Office Tower 1 2012 81% 96% 100%
- Office Tower 2 91% 92% 100%
Raffles City Ningbo
- Retail 100% 98% 96%
2012
- Office 87% 98% 100%
Raffles City Changning
- Retail 92% 98%
- Office Tower 1 13% 60%
2015
- Office Tower 2 60% 98% 94%
- Office Tower 3 97% 98% 99%
Raffles City Shenzhen
- Retail 99% 98%
2016
- Office 20% 93% 100%
Raffles City Hangzhou
- Retail 98% 99%
2016
- Office 8% 72% 86%
Note:
52 1. Relates to the year of opening of the first component of the Raffles City project.Raffles City China Portfolio
Topping Out Of Raffles City Chongqing
Structural Completion Of One Of The World’s Highest Sky Bridges At 250 Metres
A side profile of Raffles City Chongqing, China An aerial shot of The Crystal after structural completion
• Eighth and final skyscraper topped out
• 1.12 million sqm megastructure to open by 2H 2019 with 460 shops, including flagship stores of China
retail icons – NIO, CGV, Yanjiyou and Ole’
• Launched three residential towers with a total of 772 units, out of which 72% have been sold
• Received an Honourable Distinction for the China Tall Building Innovation Award and LEED-CS pre-
certification (Gold Level) by the U.S. Green Building Council
53CapitaLand Vietnam
The Vista, Ho Chi Min City, VietnamCapitaLand Vietnam
Vietnam Asset Portfolio
S$1.3 Billion Corresponding To 2% Of Group’s Total Assets
Residential & Commercial
Lodging, Strata,
27% 46%
Residential &
Lodging, Commercial Strata,
36% 57%
Total Assets: Total EBIT1
S$1.3 Billion S$71.8 Million
Commercial,
4% Commercial,
Retail, 26%
3% Retail,
1%
Note:
1. Total EBIT by asset class FY 2018.
55Vietnam - Residential
Vietnam Residential Sales
Lower Sales Due To Less Units Available For Sale
4Q 2018: ~1.5x y-o-y 4Q 2018: ~1.8x y-o-y 1Q
FY 2018: ~0.8x y-o-y FY 2018: ~0.8x y-o-y 2Q
3Q
1,600 500 4Q
460
1,409
1,400 47
212 400
1,200 1,102 346
Sales Value (S$ million)
Residential Units
1,000 211 84
312 300
541
800
53
171
200
600
340 83
400 186
524 100
200 119
316
95 23
0 0
FY 2017 FY 2018 FY 2017 FY 2018
Note:
1. Above data is on 100% basis. Value excludes value added tax.
56Vietnam - Residential
Strong Demand For Launched Projects
~ 98% Of Launched Units Sold As At 31 Dec 2018
Units sold as at 31 Dec % of launched units
Project Total units1
2018 sold
Ho Chi Minh City
d’Edge 273 273 100%
D1MENSION 102 67 66%
Feliz en Vista 973 970 99%
Vista Verde 1,152 1,136 99%
De La Sol 870 622 95%2
Hanoi
Mulberry Lane 1,478 1,465 99%
Seasons Avenue 1,300 1,276 98%
Note:
1. Refers to residential units available for sales. The Vista, Spring, D2eight are fully sold and completed.
2. Based on 652 units launched.
57Vietnam – Residential
Higher Handover Volume and Value
Mainly Contributed By Mulberry Lane, Seasons Avenue And Vista Verde
1Q
4Q 2018: ~0.4x y-o-y 4Q 2018: ~0.6x y-o-y
2Q
FY 2018: ~1.0x y-o-y FY 2018: ~1.3x y-o-y 3Q
4Q
300 285
1,600
1,404 1,422 57
250
1,400 223
216
1,200
Handover Value (S$ million)
Residential Units
534 200
1,000 95 96
482
150
800
398
600
100 57
465 77
400
356 50
200 53
259 55
116
0 18
0
FY 2017 FY 2018
FY 2017 FY 2018
58Vietnam – Residential
Future Revenue Recognition
• ~ 2,400 Units Sold With A Value Of ~ S$745 Million Expected To Be Handed Over From 2019
onwards
• ~ 45% In Value Expected To Be Handed Over In 2019
Vista Verde, Ho Chi Minh City Kris Vue, Ho Chi Minh City Seasons Avenue, Hanoi
Note:
1. Above data is on a 100% basis.
59Vietnam - Residential
Residential / Trading Sales & Completion Status
% of Actual units Expected units handed over for launched
Units CL effective launched handed over units
Projects
Launched stake % units sold as at
31 Dec 2018
4Q2018 2019 2020 Beyond 2020
HO CHI MINH
The Vist a 750 100.0% 100.0% 4 - - -
ParcSpring 402 47.5% 100.0% - - - -
The Krist a 344 47.5% 100.0% 6 1 - -
Vist a Verde 1,152 50.0% 98.6% 12 96 17 -
Kris Vue 128 48.0% 100.0% 6 1 - -
D1MENSION 102 100.0% 65.7% 17 48 - -
d'Edge 273 90.0% 100.0% - - 273 -
D2eight 28 50.0% 100.0% - 28 - -
Feliz en Vist a 973 80.0% 99.7% - 671 299 -
De La Sol 652 100.0% 95.4% - - - 622
HANOI
Mulberry Lane 1,478 70.0% 99.1% 108 131 - -
Seasons Avenue 1,300 35.0% 98.2% 63 278 - -
CL Vietnam 7,582 98.0% 216 1,254 589 622
60CapitaLand International 61 Marquessa Villas, The United States of America
CapitaLand International

             International Asset Portfolio
       S$8.7 Billion Corresponding To 14% Of Group’s Total Assets

                                                                                               Others,
                                                 Retail,                                        3%
                                                  12%                            Australia,
                                                                                                                                             Retail,
                                                                                   7%
                                                                                                                                              18%

                                                           Commercial,                                             Lodging2,
                                                              18%                                                    63%
 Lodging2,
   70%
                                                                         U.S.,
                             Total Assets:                                                    Total Assets:                    Total EBIT1
                                                                         24%
                              S$8.7 Billion                                                   S$8.7 Billion   Europe,           S$285.3
                              By Asset Class                                                  By Geography      38%              Million

                                                                                                                                                       Commercial,
                                                                                                                                                          19%

                                                                                   Japan,
                                                                                    28%

        Note:
        1. Total EBIT by asset class FY 2018.
        2. Includes 16 multifamily assets in the U.S.
62
Retail Platform
Artist’s Impression Of Funan, Singapore
63Retail
Retail Platform Overview1
2%
1% 1% 3%
6%
23%
35% 35%
Total property Total sales of 46% Total traffic
84 Properties2 value of 43% S$11.4 billion1 of
8% S$52.1 Billion2 1.2 billion1
56%
60%
62% 4% 7%
8%
Singapore Malaysia China Japan Others 3
Note:
1. Operational data includes properties under management contract. Total sales and traffic info are for FY 2018.
2. Includes properties owned/managed by retail platform as at 31 December 2018. Increase from 83 (as at 30 Sep 2018) to 84 with the acquisition of Raffles City in North Bund, Shanghai, China.
64 3. Others include a mall under management contract in Cambodia.Retail
Healthy Tenant Sales Growth Across Core Markets
Portfolio1
(FY 2018 vs FY 2017) Singapore China
Tenants’ sales growth +1.6% +23.2%
FY 2018 FY 2018 vs FY 2017
Same-mall1,2
NPI yield on Committed Shopper traffic Tenants’ sales
valuation3 occupancy rate4 growth growth (per sq ft/m)
Singapore 5.6% 99.1% +0.9% +1.3%
China5 4.8% 97.7% +2.0% +4.0%
Malaysia 5.7% 94.0% -2.0% +8.6%
Japan6 5.0% 99.3% +3.0% +0.7%
Note:
1. Portfolio includes properties that are operational as at 31 December 2018. It excludes the 20 properties divested in China.
2. Same-mall compares the performance of the same set of property components opened/acquired prior to 1 January 2017.
3. NPI Yield on valuation is based on valuations as at 31 December 2018.
4. Committed occupancy rates as at 31 December 2018 for retail components only.
5. China: Excludes two master-leased malls. Tenants’ sales from supermarkets and department stores are excluded.
65 6. Japan: Excludes two master-leased malls.Retail
Resilient Same-Mall NPI Growth1 In Core Markets
Currency Financial Year Change
Country
(mil) 2018 2017 (%)
Singapore SGD 911 896 +1.7%
Raffles City Singapore
China RMB 3,788 3,598 +5.3%
Malaysia MYR 289 309 -6.6%
Japan2 JPY 2,565 2,627 -2.3%
Suzhou Center Mall, China
Note:
• The above figures are on 100% basis, with the NPI of each property taken in its entirety regardless of CapitaLand’s effective interest. This analysis compares the performance of the same set of
property components opened/acquired prior to 1 January 2017, excluding the 20 divested properties as announced in 1Q 2018.
1. An integrated development is regarded as a single asset. Above tabulation comprises NPI from all the components present in an integrated development.
66 2. Including per-termination compensation, Japan’s same-mall NPI growth would have been +2.6%.Retail
China Retail Portfolio Is Focused In Upper-Tiered Core City Clusters
Tenant Sales And NPI Growth Remains Healthy
NPI yield Tenants’
Number of Cost Yield
on cost (%) sales (psm)
City tier operating (100% basis) improvement
(100% basis) growth
malls (RMB bil.)
2018 2017 FY 2018 vs. FY 2017
Tier 11 12 28.4 8.2 8.0 +2.5% 3.3%
Tier 2 &
20 23.6 6.2 6.0 +3.3% 5.5%
others2
FY 2018 NPI yield on cost Gross revenue on cost
China portfolio 7.3% 11.2%
Note:
• The above figures are on 100% basis, with the financials of each property taken in its entirety regardless of CapitaLand’s effective interest. This analysis compares the performance of the
same set of property components that are opened/acquired prior to 1 January 2017, excluding the 20 divested properties as announced in 1Q 2018.
• Data for Tenants’ Sales excludes two master-leased malls. Tenants’ sales from supermarkets and department stores are excluded.
1. Tier 1: Beijing, Shanghai, Guangzhou and Shenzhen.
67 2. Tier 2: Provincial capital and city enjoying provincial-level status.Retail
Pipeline Of Properties Opening
Number of properties
Country Target1 to be opened in
Opened 2
Total
2019 2020 & beyond
Singapore 17 2 - 19
China 44 5 3 52
Malaysia 7 - - 7
Japan 5 - - 5
Others3 - - 1 1
Total 73 7 4 84
Note:
1. The opening targets relate to the retail components of integrated developments and properties managed by CL Retail.
2. 3 out of 7 scheduled openings in FY2019 relates to malls under management contract in China.
68 3. Others include a mall under management contract in Cambodia.Retail
CapitaLand’s New Malls In China
CapitaMall Tiangongyuan, CapitaMall ONE,
Beijing Changsha
Interior of CapitaMall Tiangongyuan Interior of CapitaMall ONE
• CapitaLand’s largest and 8th mall in Beijing with a GFA of • CapitaLand’s 1st managed mall in Changsha
~200,000 sqm • Committed occupancy of 95%
• Committed occupancy of 97% • Houses ~100 brands
• Houses ~400 brands including two popular anchor tenants • Anchors include a premium supermarket operated by
YH Bravo supermarket and CGV cinema CP Lotus, a multiplex operated by China Film Cinema
• Received ~160,000 shoppers on opening day that features Changsha’s largest movie screen, and an
ice rink
69Retail
NomadX – Singapore’s First “Phygital” Store
• Multi-label Concept Store At Plaza Singapura Featuring Digital Sensors, ePayments Systems
And Unmanned Store Technology
• Empowering Retail Tenants To Interact With New Customers And Know Their Shoppers Better
Through Technology
• Opened with 18 tenants (100% occupancy)
• First physical outlets for Alibaba’s Taobao, Digital Fashion Week, evenodd, Révolte and Style Theory
• New-to-market brands include audio products specialist JBL and restaurant Bizen Okayama Wagyu
Steakhouse by Aston Soon
70Commercial Platform
CapitaGreen, Singapore
71Commercial
Commercial Platform Overview1
2% 2%
4% 5%
4% 5% 5%
10%
25% 23% 21%
34%
Total Total
Total property value Commercial 2% 2%
Total no. of
40 properties of S$38.6 billion Space of
8% tenants
2.0 Mil. sqm2 – 1,700
59%
53% 1% 71%
65%
Singapore Southeast China Japan Germany
Asia 3
Note:
1. Figures as at 31 December 2018 unless otherwise stated.
2. Figures include combination of GFA and NLA of commercial properties.
72 3. Southeast Asia excludes Singapore.Commercial - China
Continue To Grow Commercial Portfolio In China1
Solid Steps To Expand Office Assets In Key Cities
• Matured projects maintained high occupancy
and rent, with average rental reversion of +4% for
FY2018
• New projects2 continued their leasing momentum
with average committed occupancy3 improved
by 7% quarter-on-quarter in 4Q 2018
• Increase more than 190,000 sqm in GFA in 2018
with the acquisition of 3rd Raffles City in Shanghai
Raffles City Shenzhen, China 3rd Raffles City in Shanghai, China
21 Projects In 92.0%
11 Cities
Average Committed
16 In Operations Occupancy For Matured
CapitaMall Westgate, Wuhan, Raffles City Changning,
5 Under Development Projects Innov Center, Shanghai, China
China Shanghai, China
Notes:
1. Matured projects include offices in Raffles City Shanghai, Hongkou, Minhang, Raffles City Ningbo, Raffles City Beijing, Tianjin International Trade Centre, Raffles City Shenzhen, Raffles City
Chengdu, CapitaMall Tianfu and CapitaMall Xindicheng.
2. New projects include offices in Raffles City Changning, Capital Square, Innov Center, Raffles City Hangzhou, Suzhou Center and CapitaMall Westgate.
73 3. As at 31 December 2018.Commercial - Singapore
Resilient Office Portfolio
Achieved Above Market Committed Occupancy
CCT Singapore portfolio
committed occupancy1 99.3% Singapore core CBD
occupancy1 94.8%
Average Office Rent Of CCT’s Singapore Portfolio Eased By 0.3% QoQ
9.74 9.7 9.65 9.74 9.71
9.22 9.2 9.18 9.18 9.23
8.88 8.89 8.9 8.96 8.98
8.78
8.61
Dec-14 Mar-15 Jun-15 Sep-15 Dec-15 Mar-16 Jun-16 Sep-16 Dec-16 Mar-17 Jun-17 Sep-17 Dec-17 Mar-18 Jun-18 Sep-18 Dec-18
Monthly average gross rent for office portfolio (S$ psf)
Notes:
1. As at 31 December 2018.
2. Twenty Anson was divested on 29 August 2018. Aug and Dec 2018 average rent does not include Twenty Anson.
3. Average gross rent per month for office portfolio (S$ psf) = Actual gross rent for occupied office + Committed gross rent for vacant office
Committed area of office
74 4. Excludes Gallileo in Frankfurt, Germany.Commercial - Singapore
Building Vertical Community Through Integrated Offerings
Leveraging On New Shared Spaces And Technology To Connect
Big Picture (previously STI Auditorium)
Movie Premiere of Storm Boy
Photo credit: Salt Media and Entertainment
Open Mind (Fireside/event space)
• Pilot of mobile app
CapitaStar@Work that allows our
tenants to connect with each
other, sign up for activities and in
future, booking of flex spaces
WCS Young Leaders Synergies: The Future of Retail, Work and Living
75 Photo credit: Centre for Liveable CitiesCommercial - Singapore
CapitaSpring On Track For Completion In 1H 2021
Remains The Only Known Office Building Completing in 2021 In Tight New Supply Singapore
Milestones
9 Feb 2018 12 Apr 2018 1H 2019 1H 2021
Groundbreaking Secured anchor tenant, Marketing showsuite to
ceremony for JPMorgan for 24% of the be ready in 1H 2019
redevelopment of development’s office
Golden Shoe Car Park NLA
Integrated development
named
CapitaSpring
76Lodging Platform 77 Artist’s Impression Of lyf one-north Singapore
Lodging

       Lodging Platform Overview

                                2%                                                                                                                            3%    26%

                       6%
                                                                                               8%           8%                                       9%
                                                                                                                                                     12%
            7%
                                                                                                                                              6%
       5%                                                                        9%
                                                                                                                                        4%7%

                       Total 669                                           7%                 Total property                  33%       6%           Total no. of
     18%              properties1                                                                value of                                              units1 –            45%
                                                                                                                                                                          56%
                                                                                              S$27.2 billion2                                          100,050
                                                   62%                                                                                  22%

                                                                                                                                               27%
                                                                                            35%

                             Singapore                   SE Asia & Australia                    China                 North Asia    Europe           Others
                                                         (Ex-S'pore)                                                  (Ex-China)

       Note: Includes operating and pipeline properties owned/managed by the service residence platform.
       1. Figures as at 25 January 2019.
78     2. Figures as at 31 December 2018 and includes estimates of 3rd party owned assets in various stages of development.
Lodging
Resilient Operational Performance
Overall FY 2018 RevPAU Increased 4% Y-o-Y On Same Store Basis
S$
+11% -7% based on
local currency
-1% based on
local currency
+12%
224
202 +4%
+5% -10%
172
-4% 154
106111 108 108
119 116 121
107
93 89
Singapore SE Asia & China North Asia Europe Gulf Region Total
Australia (ex (ex China) & India
S'pore)
FY 2017 FY 2018
Notes:
1. Same store. Include all serviced residences owned, leased and managed. Foreign currencies are converted to SGD at average rates for the period.
79 2. RevPAU – Revenue per available unit.Lodging
Resilient Operational Performance
Overall 4Q 2018 RevPAU Increased 4% YoY
S$
+9%
-2% based on
+17%
228 local currency
210
+2% -1% 182 +4%
-16%
-4% 156
111 113 113 112 119 124
104
94 90 87
Singapore SE Asia & China North Asia Europe Gulf Region Total
Australia (ex China) & India
(ex S'pore)
4Q 2017 4Q 2018
Notes:
1. Same store. Include all serviced residences owned, leased and managed. Foreign currencies are converted to SGD at average rates for the period.
80 2. RevPAU – Revenue per available unit.Lodging
Strong And Healthy Pipeline1
Operational Units Contributed S$186.9 Million2 Fee Income In FY2018
60,000
40,000
20,000
0
Singapore SEA & Australasia China North Asia Europe United States of Others
(ex. SG) (ex. China) America
Operational Under Development
~42,800 Units Under Development Expected To
Contribute Positively To The Group’s Fee Income
Note: Figures above as at 25 January 2019
1. Fee income includes fee based and service fee income
81Lodging
Continue To Grow Global Platform
Exceeded 2020 Target Of 80,000 Units, Ahead Of Schedule
160,000
> 100,000
72,000 Target : 80,000
52,000
43,000
34,000 39,000
2013 2014 2015 2016 2017 2018 2023
On Track To Achieve Global Portfolio Target Of 160,000 Units By 2023
Note:
1. Including units under development.
82Lodging
Units Under Management1
57,274 Operational Units And 42,776 Pipeline Units
REIT/Fund TAL Franchised 3rd Party Leased Total
Managed
Singapore 1,320 1,268 83 2,671
Indonesia 599 185 380 20,649 21,813
Malaysia 205 221 4,335 4,761
Philippines 495 4,226 4,721
Thailand 651 3,664 4,315
Asset-light, ROE-
Vietnam 851 132 5,500 6,483
Myanmar 238 238
Laos 116 116
Cambodia
SEA Total 3,470 1,189 380
571
40,567 83
571
45,689 accretive model
with less than 4%
China 1,441 412 34 20,281 36 22,204
Japan 2,141 427 124 430 3,122
South Korea 1,329 1,329
North Asia Total
India
3,582 839
456
34 21,734
1,215
466 26,655
1,671 of owned assets
South Asia Total 0 456 0 1,215 0 1,671
Fiji 54 54
New Zealand 1,577 1,577
Australia 998 140 10,080 157 11,375
Australasia Total 998 140 11,711 0 157 13,006
United Kingdom 708 230 100 300 1,338
Ireland 136 0 136
France-Paris 1,064 112 236 516 1,928
France-Outside Paris 678 237 1 309 1,225
Belgium 323 323
Germany 721 721
Spain
Netherlands
131
48
131
48 Deepening
Presence And
Georgia 66 66
Europe Total 3,625 478 385 603 825 5,916
U.A.E 307 409 716
Saudi Arabia
Bahrain
Qatar
1,561
118
200
1,561
118
200
Building Scale In
Oman
Turkey
364
463
364
463
Key Gateway
Cities
Gulf Region Total 0 307 0 3,115 0 3,422
Ghana 260 260
Africa Total 0 0 0 260 0 260
Brazil 214 214
South America Total 0 0 214 0 0 214
United States 1,004 261 1,265
North America Total 1,004 261 0 0 0 1,265
Synergy Total 0 0 1,952 1,952
Serviced Apartments 11,162 3,243 12,724 67,494 3,483 98,106
CORP LEASING TOTAL 1,517 427 0 0 0 1,944
GRAND TOTAL 12,679 3,670 12,724 67,494 3,483 100,050
83
Note: As at 25 January 2019Lodging
Solid Progress In Building Scale To Accelerate Growth
• Exceeded 100,000 Lodging Units Globally
• On-Track To Achieve Next Target Of 160,000 Units By 2023
• Acquisition of 70% stake in
TAUZIA and strategic alliance
with Ciputra increased
Indonesian portfolio by nine-
folds through ; consolidates
Ascott’s position as Indonesia’s
Signing of Ascott's strategic alliance with Ciputra
largest lodging owner-operator
• Continue to bolster Ascott’s
position as the largest
international lodging player in
Indonesia through investment,
strategic alliances,
management contracts and
franchises
Citadines Sudirman Jakarta, Indonesia Ascott Sudirman Jakarta, Indonesia
84Investment Management
Platform
Raffles City ChangningFund Business
Diversified Portfolio Of Funds
No. Fund name Fund size
Fund AUM by geography (S$ billion)
(million) 1
REITs PE Funds
1 CapitaLand Mall China I ncome Fund US$ 900
2 CapitaLand Mall China I ncome Fund I I US$ 425
3 CapitaLand Mall China I ncome Fund I I I S$ 900
4 CapitaLand Mall China Dev elopment Fund I I I US$ 1,000
0.2
5 Ascott Serv iced Residence (China) Fund US$ 500
6 Ascott Serv iced Residence (Global) Fund US$ 600
7 Raffles City China I ncome Ventures Limited2 US$ 1,180
8 Raffles City Changning JV S$ 1,026
22.6
9 CTM Property Trust S$ 1,120
10 CapitaLand Tow nship Dev elopment Fund I US$ 250
21.7
11 CapitaLand Tow nship Dev elopment Fund I I US$ 200
12 Vietnam Joint Venture Fund US$ 200
0.6
13 CapitaLand Mall I ndia Dev elopment Fund S$ 880
14 Raffles City China I nv estment Partners I I I US$ 1,500
15 CapitaLand Vietnam Commercial Value-Added Fund US$ 130 5.5
3.6
Total Fund Size US$ 6,885
3
S$ 3,926 China Singapore Others
Available Funds For Deployment US$ 800
Note:
1. Fund size as at respective fund closing date.
2. Formerly known as Raffles City China Fund.
86 3. Others include Malaysia, Vietnam, Other Asia, Europe, United States of America.Fund Business
Capital Deployment Optimised Through REITs And Funds
Earned S$227.5 Million In REITs/Fund Management Fees In FY 2018 Through 5 REITs And 15 PE
Funds
Launched Vietnam
S$ billion Commercial Fund I and
Launched Vietnam Commercial
RCCIP III Value-added Fund
Launched Fund
Ascott-QIA 56.0
54.2
JV Fund 51.2
47.9
46.0
42.4
39.2
2013 2014 2015 2016 2017 2018 2019 2020
On Track To Add Another S$10 Billion In AUM By 20201
Note:
87 1. Target was set in 2015.Fund Business
CREDO I China – First Discretionary Real Estate Debt Fund
One Of China’s Largest Real Estate Debt Funds
• Successfully raised US$556 million for first Target Fund Size ▪ US$750 million
CREDO I China’s closing with strong
investor participation Fund Term ▪ 6 years
• Accretive to growth of CapitaLand’s Target Markets ▪ Tier 1 and Tier 2 cities in China (including
investment management business Hong Kong)
Investment ▪ Offshore US dollar-denominated private
• Fund to tap on CapitaLand’s operating Mandate subordinated debt investments backed by
capabilities and network in China for specific high-quality underlying real estate
investments in quality property debt projects owned by experienced real estate
instruments investors (commercial, retail, residential,
logistics and industrial sub sectors)
• Takes advantage of significant volume of
First Closing ▪ US$556m in Feb 2019
China’s commercial real estate loans (subsequent closing later in the year)
which are due for refinancing within the
next few years CapitaLand Stake ▪ 10%
• Broadens CapitaLand’s fund offerings
beyond our existing private equity funds
888
9
Appendix
Raffles City SingaporeFinancial
Group Managed Real Estate Assets1
As at 31 Dec 2018
Group managed real estate assets
(S$ billion)
On balance sheet & JVs 22.2
Funds 24.9
REITs 31.8
Others2 21.2
Total 100.1
Note:
1. Group Managed Real Estate Assets is the value of all real estate managed by CapitaLand Group entities stated at 100% of the property carrying value.
2. Others include 100% value of properties under management contracts, franchise and corporate leasing.
90 .Financial
Financial Performance For 4Q 2018
S$' million 4Q 2017 4Q 2018 Change
1
(Restated)
Revenue 1,212.6 1,624.5 34%
EBIT 743.4 1,132.2 52%
PATMI 277.8 475.7 71%
Operating PATMI 169.5 213.8 26%
2
Portfolio Gains (0.5) 60.1 NM
Revaluation Gains/ Impairments 108.8 201.8 86%
Healthy Operating PATMI Growth Underpinned By Contribution From Residential Projects In China
And Newly Acquired And Operational Investment Properties In Singapore, China, USA And
Germany
Note:
1. 4Q 2017 results restated to take into account the retrospective adjustments relating to SFRS(I)15 Revenue from Contracts with Customers.
2. Includes realised revaluation gain/loss on investment properties.
91Financial
EBIT By SBU – 4Q 2018
S$' million Operating Portfolio Revaluation Total
EBIT gains / gains/
(loss)1 impairments
CL Singapore, Malaysia and Indonesia 272.1 - 69.9 342.0
CL China 445.4 81.1 247.6 774.1
CL Vietnam 17.6 (23.4) (7.1) (12.9)
CL International 69.1 - (0.4) 68.7
2
Corporate and others (39.7) - - (39.7)
Total 764.5 57.7 310.0 1,132.2
Singapore And China Contribute 94% Of Total EBIT
Note:
1. Includes realised revaluation gain/ loss of investment properties.
92 2. Includes intercompany elimination and expenses at SBU corporates.You can also read