Thorp Arch and Walton - Housing Market Assessment January 2016
←
→
Page content transcription
If your browser does not render page correctly, please read the page content below
Thorp Arch and Walton

Housing Market Assessment

            January 2016
      Huw Jones, Associate Consultant
                  Renew

                                        0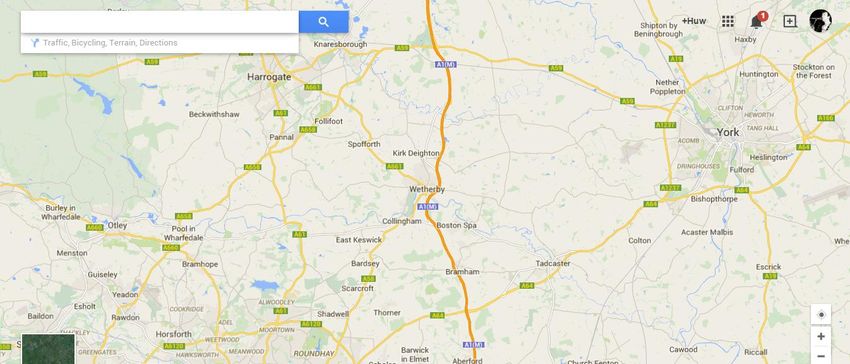
Contents

Executive Summary                                                           2
1. Introduction and Context                                                 6
    1.0 Introduction                                                        6
    1.1 Thorp Arch and its surrounding areas                                6
    1.2 Leeds housing market context                                        8
    1.3 Policy context                                                      12
2. Housing market, demographic and economic characteristics of Thorp Arch   15
   and its surrounding area.
    2.0 Housing stock and tenure                                            15
    2.1 House prices                                                        16
    2.2 Affordability of home ownership                                     18
    2.3 Private rental market                                               20
    2.4 Social housing supply and demand                                    24
    2.5 Local demographic and economic context                              26

3. Assessment of housing market conditions                                  28
    3.0 Housing supply                                                      28
    3.1 Availability and affordability of home ownership                    28

    3.2 Availability and affordability of rental levels                     28

    3.3 Potential demand                                                    29

4. Potential Housing Interventions                                          32
    4.1 Introduction                                                        32

    4.2 New house building                                                  32
    4.3 Rented housing                                                      34

    4.4 Housing for older people                                            34

5. Conclusions                                                              35

                                                                                 1
Executive Summary
A. Context
Thorp Arch is a small affluent village and civil parish near Wetherby set on the River Wharfe between the
villages of Walton and Boston Spa. Thorp Arch has a population of approximately 1,600 living in 324
dwellings mainly detached house and small terraced cottages. The vast majority (75%) of households are
homeowners and levels of both social and private rented housing are relatively low compared to city and
national levels. Private renting has increased in the past decade while levels of owner occupation and
social renting have slightly reduced. Property values are significantly higher than the city average.
Walton is a village and civil parish 2 miles (3 km) east of Wetherby and adjacent to Thorp Arch village
and Thorp Arch Trading Estate. It has a population of 225 people living in 96 dwellings. The population in
Walton is ‘older’ than that of Thorp Arch, and the city as whole. The proportion of older people is
substantially higher than for the city as a whole, as is the proportion of people who will grow old over
the next 20 years. There are more families with children, but fewer single people under 65. It is
predominantly white.
Thorp Arch and Walton are served by the primary school in Thorp Arch and by Boston Spa and Wetherby
High Schools. The Wealstun Prison, and the British Library and the Thorp Arch Trading Estate are located
nearby.
B. Assessment of housing market conditions
B1 Housing supply
Supply of new housing has dwindled and currently across the city new build rates are not keeping
pace with housing needs as measured in the SHMA and reviewed in the current LDF Core Strategy.
New housing for sale at prices that are affordable to first time buyers and existing owners seeking to
‘downsize’ would be attractive, and there may be a demand for additional housing for rent at a
range of levels.
B2 Availability and affordability of home ownership
A joint income of between £45,000 and £73,000 would be needed to afford entry level housing (one
and two bedroom flats or 2 bedroom houses) in Thorp Arch, Walton and nearby villages and over
85% of households do not earn that level of income,
Additionally, a deposit of £26,000 for a one bed flat, and £42,000 for a two bedroom house or flat,
would be required to secure an 80% mortgage at current Loan to Value Ratios (LVRs) which would
take potential first time buyers on average incomes between 6 and 10 years to accumulate, while
households on bottom quartile incomes would be unlikely to be able to afford to accumulate the
deposit required without help from parents or grandparents (or both,) and may not be able to afford
mortgage payments.
However, as 29% of households earn over £40,000 and almost 20% earn over £50,000, amounting
tohouseholds in both villages are in professional or managerial occupations, a substantial proportion
of households with equity from existing housing would be able to afford new housing in Thorp Arch
and Walton, and other nearby villages.
2B3 Availability and affordability of rented housing
There are high-cost rental markets in Thorp Arch, Walton, nearby villages and the town of Wetherby,
comprising a mix of social housing and market rented properties, in a range of terraced and semi-
detached houses purpose built and converted flats
The housing available is accessible to households with a range of incomes and occupations. Given
the increasing demand for rental housing across the city arising from young working households
facing difficulties in accessing home ownership, especially in accumulating deposits, demand for
rented housing is likely to increase, across the city and in the Thorp Arch, Walton and nearby
settlements, especially should there be enhanced employment opportunities emerging in the Thorp
Arch Trading estate
However, existing market rents require a joint income of between £16,500 and £26,200 to afford a 1
bed or 2 bed property, or a single income of £20,000 to £32,000 - out of reach of the majority
households on low incomes in work, and would require two incomes per household to afford at all.
Affordable Rents (80% market rents), would take between 45% and 93% of income for those in very
low paid jobs and between 25% and 51% of income for people in bottom quartile jobs . (Shelter has
put the level of affordability at 35% of income) A joint income of between £13,500 and £21,000, and
a single income of £16,000 to £21,000 is needed to afford rents for 1 or 2 bed properties, and this
raises concerns that this could lead to difficulties for low paid households in maintaining tenancies.
Demand for social rented properties in the outer North East Leeds area, which includes Thorp Arch
and Walton, is strong and the stock of social rented housing in the area is insufficient to enable all
applicants with a high or a moderate priority need to be rehoused, and is able only to rehouse only a
very small proportion of those who may not have a specific social or medical need, but are unable to
afford market housing. Very little social housing is empty, annual turnover of stock is minimal, and
between 43% and 67% of tenants have been resident for over 10 years. This low availability of stock
coupled with a substantial number of long term residents, indicates continuing pressure on the
social housing stock and other affordable housing.
B4 Potential Demand
The proportion of people in Thorp Arch, Walton and nearby settlements who are in full time or self-
employment, and in professional and managerial occupations indicates a strong potential demand
from tenants seeking to move from social housing and private rented housing, and from existing
owners seeking to trade up from their first home. There may also be demand for housing from
households moving to Leeds with work.
Analysis of the 2011 Census and intelligence gathered from local estate agents indicate that there
may be between 100 and 150 existing residents in the Wetherby area who may express a demand to
buy a new home in Thorp Arch or Walton over the next 10 years. 32 would be private or social
housing tenants wanting to buy a new home over the next 10 years. 3 may be social housing tenants
want and be able to, buy a new home over the next 10 years. 101 may be homeowners wanting to
take up the opportunity to buy a new home over the next 10 years; of these 17 may be previous first
time buyers (2nd Stagers). 43 may want or need to ‘trade up’ to a larger home over the next 10 years.
41 may be older homeowners want to ‘downsize’ to a more manageable home over the next 10
years.
3In addition it is estimated that there may be demand for new housing for sale and rent in the outer
North East Leeds area from 1,000 households taking up the 20,000 estimated new jobs to be created
over the next 10 years new jobs across Leeds, some of which may emerge locally on the Thorp Arch
Trading Estate.
There is likely to be continuing demand for rented housing especially from young workers in lower
paid work locally or in the city centre who are unable to access home ownership or social housing, or
not wishing to buy. This demand is likely to be for housing at social, intermediate and market rents.
There may be a potential need for 41 new smaller homes to buy or rent aimed at older people who
may seeking to, or needing to ‘downsize’ to smaller more manageable housing and release equity
from their home, or who may need specific assistance with housing to meet their needs over the
next 10 years.
C Potential Interventions
C1 New housing development.
There may be a demand for an additional 1,133 new homes to meet potential demand from
residents in Thorp Arch and Walton or to meet demand potentially from incoming households.
In terms of meeting potential housing demand, there is currently little planned housebuilding due to
take place in or around Thorp Arch and Walton. Analysis of the Leeds City Council Planning Portal
shows there to be no current approved planning applications pertaining to the Thorp Arch area, and
an outline planning application for residential development of around 2,000 homes at Thorp Arch
Estate has recently been withdrawn by the potential developer, although there are indications that
a smaller application may be brought forward. This could meet the demand for new housing
identified. 6 sites in Thorp Arch and Walton identified in the Leeds SHLAA with a capacity for 847
new homes were ‘sieved out’ during the Site Allocations Plan process and will not be considered for
housing in the future.
In addition, the University of Leeds has announced recently it no longer wishes to pursue plans to
build 4,000 homes on its 600-acre plot near Headley Hall, between Bramham and Tadcaster,
although there is some limited additional capacity to meet demand from within Thorp Arch and
Walton and from incoming demand in nearby settlements where planning applications have been
approved, or are under consideration, with the capacity for up to 159 new homes.
The development of the Thorp Arch estate, which has for a long time been considered a potential
source of supply of new housing, remains as the main potential source of new housing supply in the
immediate area surrounding Thorp Arch and Walton.
The site could also be used for employment and economic development, although it would be likely
that the creation of new jobs on the trading estate may also bring a need for housing locally to
accommodate a proportion of those taking up those jobs who will not want, or be able to afford, to
travel to them.
Whatever, new development does come to fruition in the area, it is important that local needs are
provided for, and that new development assists the future sustainability of the villages concerned. It
should encompass a wide mix of housing types and sizes, and offer a range of prices and rents.
4It is estimated that 58% of new homes aimed at meeting potential demand from residents of Thorp
Arch and Walton (77 new homes) should have 1 or 2 bedrooms and 42% (56) should have 3
bedrooms or more. It is also estimated that 28% of new homes aimed at incoming households
should be homes with 1 or 2 bedrooms (280 new homes), and 72% should be housing with 3
bedrooms or more (720 new homes).The methodology used in arriving at this assessment is
contained in Appendix E.
New development in the area could contain homes aimed at first time buyers including some to
which the Governments Help to Buy scheme could apply, or ‘Starter Homes’ could be offered.
However, starter homes priced at the likely price in the area of £146,835, would require a household
income of just over £50,000 to be able to afford mortgage payments – £12,500 higher than the
average household income in the area, and only 18% of households would have the level of income
required. In addition, a deposit of just over £22,000 would be required to secure an 85% mortgage,
which could take an average earning household just over 5 years to accumulate. Accordingly, the
scheme may be more suited to those already with a deposit saved or who have access to capital
from parents or grandparents to fund the deposit required, or it may need to be used in conjunction
with Help to Buy.
C2 Rented Housing
It is likely that demand for rented housing will increase from young working households, especially
young people in the first or second jobs, and those saving for the deposit needed to secure a
mortgage for home ownership. These are likely to be the first time buyers and ‘second stagers’ who
comprise the ‘family builders’ providing housing for whom could help preserve the sustainability of
amenities in the area. However, the low availability of stock coupled with a substantial number of
long term residents, indicates continuing pressure on the social housing stock. In order to clear the
‘backlog’ of need in the outer North East Leeds area, an additional supply of at least 320 new homes
at social or affordable rents (32 per year) could be required over a 10 year period. Of these new
homes for rent, it is likely that around 15% should be with 3 bedrooms or more and 85% should be
one or two bedroomed properties.
C3 Housing for older people
A proportion of new housing developed in and around Thorp Arch and Walton should include
smaller housing units for sale aimed at older households seeking to downsize; additional non-
sheltered rented options for older single people or couples seeking to leave family housing in the
social rented sector and maybe some extra care housing provision to cater for the needs of the
relatively high proportion of over 85 year olds in the local population. Targeting new homes at older
people downsizing could also free up family homes to meet demand from family households seeking
larger homes.
5Introduction and Context
1.1 Introduction
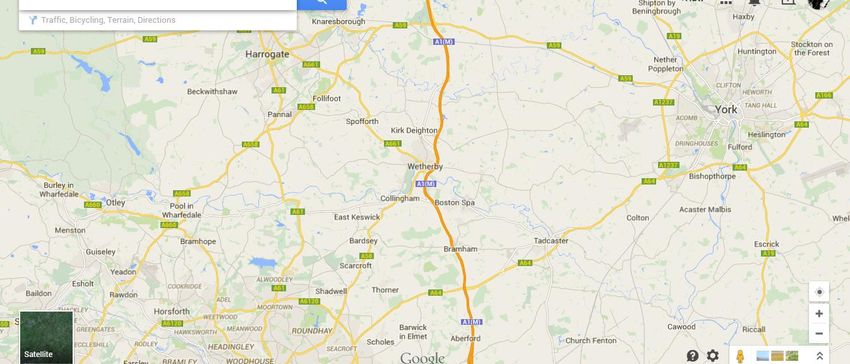
Thorp Arch is a small affluent village and civil parish near Wetherby set on the River Wharfe between
the villages of Walton and Boston Spa. Thorp Arch has a population of approximately 1,600 living in
324 dwellings mainly detached house and small terraced cottages. The vast majority (75%) of
households are homeowners and levels of both social and private rented housing are relatively low
compared to city and national levels. Private renting has increased in the past decade while levels of
owner occupation and social renting have slightly reduced. Property values are significantly higher
than the city average.
Knaresborough
Harrogate
York
Wetherby
THORP ARCH
Collingham
Harewood
East Keswick Boston Spa
Bardsey
Bramham Tadcaster
Scarcroft
Thorner
Barwick-
in-Elmet Aberford
Walton is a village and civil parish 2 miles (3 km) east of Wetherby, It is adjacent to Thorp
Arch village and Thorp Arch Trading Estate. It has a population of 225 people living in 96 homes. The
population in Walton is ‘older’ than that of Thorp Arch, and the city as whole. The proportion of
older people is substantially higher than for the city as a whole, as is the proportion of people who
will grow old over the next 20 years. There are more families with children, but fewer single people
under 65. It is predominantly white.
There is a primary school in the village and it is also served by Boston Spa and Wetherby High
Schools. The Wealstun Prison, and the British Library and theThorp Arch Trading Estate are located
nearby.
6Thorp Arch Trading Estate occupies the major part of the site of a former Royal Ordnance
Factory (ROF), built to supply British forces with munitions during the Second World War. The retail
park is constructed in semi-underground bunkers, with grassy banks running up the sides of the
buildings. The retail park is home to a playground, formerly home to an old tank, a Bren Gun
Carrier and a fire engine, and is still home to a large mock pirate ship (about 40' in height)
Thorp Arch and Walton are surrounded to the North by Wetherby, Knaresborough and Harrogate; to
the north- east by York; to the south by Boston Spa and Bramham, to the south east by the town of
Tadcaster and to the west and south west by the villages of Collingham, Linton, Bardsey and
Scarcroft running along the A58 towards Leeds city centre. The area is part of what has been termed
‘The Golden Triangle’ between North Leeds, Harrogate and York. All are ‘up-market’ settlements
with high house prices and rents.
The aim of this Housing Market Assessment (HMA) is to establish an evidence base for the
Neighbourhood Development Plan that can assess the prospects for the housing provision in the
area being able to contribute positively to the vision and objectives for the area set out in the plan.
It:
outlines the characteristics of housing in the area,
outlines the current housing market conditions in the area,
outlines how the local housing market has been changing,
outlines how affordable housing is in the area and what level of access there is to that
housing; and
Seeks to identify the extent and type of new housing that may be needed to meet the needs,
demands and aspirations of existing residents in the area and accommodate new residents.
The tables within this HMA use a number of different data at different geographical levels depending
on the availability and relevance of the data:
Income banding data is presented for Council Electoral Wards;
house price trend data is drawn from www.home.co.uk and is presented at postcode district
level;
local house prices and market rent data is presented according to the neighbourhoods
identified drawn from individual address records listed on www.rightmove.co.uk;
housing tenure, housing type, overcrowding and under-occupation, and socio-economic and
demographic data is presented at Parish level using 2011 Census data drawn from the ONS
Neighbourhood statistics site;
information on Council and housing association housing is drawn from Leeds City Council
stock, Leeds Housing Register and HCA data and uses the Neighbourhood Office and Local
Lettings Areas used on the Leeds Housing Register; and
Data on planning applications and land availability is drawn from the Leeds City Council
Planning Portal and published SHLAA and Site Allocation Plan reports.
This report now considers the wider housing market context for the HMA and the policy context,
nationally and locally, within which it is set.
71.2 Leeds housing market context
1.2.1 the most recent data from CLG shows the number of households in Leeds increased by 6% in the last
decade, compared to an increase of 3% in the previous decade. 1While below national and sub-
regional levels, this is likely to represent a significant increase in demand for housing. There are now
approximately 320,000 households in Leeds, up from 302,000 a decade earlier2. The number of
households is projected to increase by a further 13% in the next decade, outstripping wider West
Yorkshire and national levels of growth. The number of households is projected to rise to 361,000 by
2021.3
1.2.2 The Leeds Strategic Housing Market Assessment (SHMA) used an employment-led household growth
scenario to inform long term planning decisions. This shows an annual household growth rate of
approximately 4,500 per annum, which, due to latent demand, was translated into a net dwelling
requirement of approximately 4,680 per annum and a gross requirement, taking account of potential
demolitions, of 4,930 per annum.
1.2.3 The Leeds SHMA also indicates that affordability of housing is a key issue to address. In line with
national trends, house prices in Leeds have seen a significant increase over the past 20 years. The
most recent average annual price in the city is now £175,000. This increase has seen house prices
outstrip incomes in this period, making housing increasingly unaffordable, especially to first time
buyers. The most recent SHMA undertaken for the city suggests that approximately 1,158 affordable
dwellings per annum are needed, in order to both clear the existing waiting list backlog and meet
future arising household need. It identified a “sustained demand for ‘affordable’ properties across
the city.”
1.2.4 The waiting list for social housing in Leeds has been above 20,000 since the late 1990s. Positively, it
has reduced since its peak of over 30,000 in 2005, but still represents a consistently large amount of
unmet need. Levels of homelessness have reduced since the early part of the last decade, in line with
national trends although there is evidence of a modest increase since 2009/10.
1.2.5 The Leeds SHMA also found that in line with national trends the city is projected to experience an
increase in the number and proportion of households where the head of household is over 65. The
projections indicate that over half of these households will be couple households and just under half
will be single person households. Significantly, the projections continue to show an increase in
households in the higher age brackets e.g. over 85 years old.
1.2.6 Recent research by Renew for the Leeds City Region,4 showed the issues with affordability of housing
across the city region and in each of its constituent local authority areas. The research found that
Affordability is becoming increasingly problematic across the Leeds City Region for all forms of
tenure. Housing costs, particularly in the northern part of the city region ( but also in some other
areas) are high and increasing while income levels are at best remaining static and competing
household costs are at best static.
1
Demographic Evidence – an update, Edge Analytics; September 2013
2
2001 and 2011 Census reported on ONS website 2015
3
Demographic Evidence – an update, Edge Analytics; September 2013
4
Research on the affordability of housing in the Leeds City Region: Huw Jones, Associate Consultant – Renew, June 2014
8 With house prices rising again, the levels of deposit needed to secure a mortgage and the level
of mortgage payment may well result in people in an increasing range of occupations being
excluded from home ownership across the City region over time.
Almost 40% of people across the Leeds City Region are on incomes that may not be sufficient to
afford housing costs without benefit top-up. A further 35% are on average income levels, and
may either be experiencing difficulties in accessing or being able to afford home ownership or
market rented housing.
The gap between actual market rents and the levels of benefit paid through the Local Housing
Allowance suggests that many parts of the private rented market could be ‘closed off’ for
households on benefit. With market rents more likely to rise than reduce as landlords pursue
demand from professional households unable to buy under present circumstances, and with
Affordable Rents tied to market rents, it is likely that
o households on low pay will have continuing problems in being able to afford rented
housing costs without recourse to benefit, and
o The amount paid out in benefit to cover increasing market and affordable rents will also
increase.
With incomes raises being restrained for those earning below average levels, and with more jobs
being created at very low levels of income, the ability to pay ‘market set’ housing costs is likely to
remain problematic for many people
Home ownership and market (or near market) housing in Leeds is increasingly becoming an
option only for those on average incomes or above. Occupations such as police officers,
experienced teachers, lecturers and landscape architects, nurses, midwives, junior hospital
doctors, as well as more intermediate occupations could be unable to afford entry level house
prices (1 or 2 bedroom houses or flats) or market rents
5
1.2.7 Recent analysis of the Leeds housing market for the Leeds Housing Forum indicates that the
affordability of home ownership continues to be problematic and that the income needed to afford
mortgage payments (without jeopardising the ability to meet other financial commitments) has been
increasing over the last 5 years. Currently;
A joint income of £61,000 is currently needed to afford average prices, and a joint income of
£37,000 is needed to afford entry level housing (1 or 2 bedroom flats or houses). Should prices
continue to rise at their current rate (3% p.a.) then by 2020 a joint income of £73,000 will be
needed to afford average prices, and a joint income of £46,000 will be needed to afford entry
level housing
Current average property prices in Leeds constitute 7.2 times the average income, and 13.4
times the bottom quartile income in Leeds. Should prices continue to increase at their current
rate (3% p.a.) then by 2020 these will have risen to 8.6 and 15.8 respectively.
5
State of the Leeds Housing Market:: Report for the Leeds Housing Forum by Huw Jones, Renew January 2015
9 Current entry level prices are 4.4 times the average income and 8.2 times the bottom quartile
income in Leeds. Should prices continue to rise at their current rate (3% p.a.) then by 2020 these
will have increased to 5.4 and 9.8 respectively.
Under the current mortgage Loan to Value ratio being offered by lenders to first time buyers
(80% of property value) A deposit of £21,600 would be needed to secure a mortgage on an entry
level home, which would increase to £26,319 by 2020 should prices continue to rise at their
current rate, and a deposit of £34,652 would be required to secure a mortgage on a property at
average price levels which would increase to £42,480 by 2020 should prices rise at their current
rate. While mortgages at higher Loan to Value ratios are available the interest rates and
repayment levels are considerably higher.
Research by Scottish Widows 6has indicated that it will take private renters on average 15 years
to save enough for a deposit on a house. For those planning to go through help to buy the
research indicates it will take four-and-a-half years. The research has found that the average
private renter saved £2,090 in 2013, and that if this rate of saving continues, and assuming
average first-time buyer deposits stay at their current level or increase with inflation, it would
take 15 years to accumulate the national average first-time buyer deposit of £30,943, Scottish
Widows also states that: “Some may have given up on property ownership altogether, with only
one in 10 private renters (13%) saving specifically to get on the housing ladder… A third of
private renters [are] not currently putting any money aside and 29% [have] no savings
whatsoever".
Market rents take up over 50%, and Affordable Rents over 40%, of the income of households on
very low pay (the bottom 10%) 7 and the forecast increase in market rent levels will exacerbate
this. This could present a significant barrier to households seeking to move off of benefit and
into work and present real problems for households in being able to afford rent payments
alongside other financial commitments (food, energy, clothing, travel etc).
Affordable (80% market) Rents are affordable to most people in occupations paying average
income levels, but they would be unaffordable to some in intermediate occupations (newly
qualified teachers, nurses and midwives, ambulance drivers, teaching assistants, shop
supervisors, bank cashiers) and in lower paid occupations (e.g. kitchen porters, care assistants,
shop assistants).
The difference between market rents and the Local Housing Allowance varies across Leeds.
Market rents for 2 bed properties in lower rent areas are between £2 and £13 per week lower
than the Local Housing Allowance for Leeds, but in higher rent areas are between £36 and £51
per week higher than the Local Housing Allowance. In mid-market areas market rents tend to be
between £9 and £15 per week higher than the Local Housing Allowance.
6
http://www.scottishwidows.co.uk/knowledge-centre/savings/private-renters.html
7
How Affordable is Affordable: Leeds Alliance 2013
10 Affordable Rents (80% market) for 2 bed properties are between £22 and £35 lower than the
Local Housing Allowance in low rent areas but are up to £34 higher than the Local Housing
Allowance in high rent areas.
In most parts of Leeds, social rents are significantly lower than market rents. Market rents for 2
bed properties are between £29 and £47 per week higher than social rents in lower rent areas
but are between £78 and £93 per week higher in high rent areas. Social rents are generally lower
than Affordable Rent (80% market) levels. Even in low market rent areas, social rents for 2 bed
properties are between £7 and £22 per week lower than Affordable Rents, but in higher market
rent areas they are between £47 and 59 per week lower than Affordable Rents.
The differences between social rents, Affordable Rents and market rents, and between market
and Affordable Rents and the Local Housing Allowance have significant implications for the
ability of households to afford housing costs, especially if they are seeking to move from benefit
into paid work. It also has implications for the amount of housing benefit paid and concerns have
been expressed that housing benefit is in reality subsidising high market rents and very low paid
work.8
Increasing numbers of households who would in the past have sought social rented housing are
now being housed in the private rented sector. While the Local Housing Allowance will cover
rent payments in lower market rent areas, it will not in most mid-market rent areas or in all high
rental areas. In other areas, where the LHA is higher than the market rent, landlords are able to
increase their rents to the LHA level. For households seeking to move from benefit into paid
work, moving to a market rented property would, unless covered by the Local Housing
Allowance involve a significant additional rent payment. For people on benefits needing to live in
high rent areas, there are clear problems in affording the rent payment, and clear disincentives
to find paid work. For households in low paid work, market rented properties are unlikely to be
affordable without subsidy through partial housing benefit.
1.2.8 Changes in policies and practices relating to mortgage lending are currently having a major impact on
the Leeds housing market. Following the credit crunch of 2007 onwards mortgage lending, has
become more restrictive, in contrast to the relatively relaxed nature of mortgage lending policy from
the late 1990s up to 2008, which was accompanied by a long increasing trend in property values and
continuing governmental encouragement to home ownership. The volume of mortgage lending now
appears to be increasing with more loans offered to first time buyers.
Analysis of statistics from the Council of Mortgage Lenders for the UK in June 2015, showed that
while the number of first-time buyers and the amounts advanced had increased, there had been a
year-on-year decline in lending compared to June 2014. There was also increased lending to home
movers , home-owner re-mortgage activity, while Buy-to-Let continued to grow year-on-year and
month-on-month, mainly driven by buy-to-let re-mortgage activity. Increases in lending generally
and to first time buyers in particular have partly been driven by government schemes such as Help to
Buy and the Funding for Lending scheme.
8
BBC News website Why is the UK's housing benefit bill so high? 21st September 2015
11Concerns have been expressed that these could serve as much to drive up prices as to help first time
buyers access home ownership, and that the danger exists of a renewed ‘housing market bubble’
similar to that which preceded the credit crunch in 2008.
From April 2014, new criteria were brought in by mortgage lenders following guidance from the
Financial Services Authority (FSA). These moved away from a focus on ‘multiples of income’ as the
basis for lending, and instead focused on the ability of applicants to repay the mortgage, especially
within a context of potentially increasing interest rates. This new and restrictive approach could
have impacts on the ability of first time buyers to secure mortgages to ‘get on the housing ladder’,
and upon the ability of people seeking to trade up from their existing housing.
1.3 Policy Context
1.3.1 Leeds Local Development Framework (LDF) Core Strategy
The Core Strategy is the main document setting out the strategic level policies and vision to guide
the delivery of development and investment decisions and the overall future for the Leeds district. It
plans for the longer term regeneration and growth of the district over a 15 year period.
The Core Strategy refers to planning for housing growth in a sustainable way in suitable locations,
whilst meeting a range of housing needs, it aims to deliver housing growth in sustainable locations
prioritising previously developed land in urban areas and through the phased release of greenfield
sites to ensure sufficiency of supply and provision of supporting infrastructure. It also aims to plan
for a sufficient mix, tenure and type of housing to meet a range of community needs including
affordable and specialist housing. The LDF Core Strategy proposes 70,000 net new homes for the
plan period 2012-28. This requirement is the full objectively assessed need and is towards the upper
end of growth projected in the Leeds SHMA. It is spread across 11 housing market areas on the basis
of need and capacity. This equate to 4,660 homes per year.
The Core Strategy sets targets for new development, proposing a mix of 75% houses and 25% flats,
with the desired size of dwellings to be set at a mix of 10% 1 beds, 50% 2 beds, 30% 3 beds and 10%
dwellings of 4 bedrooms or more. Density of new housing schemes in smaller settlements such as
Wetherby is set at 30 dwellings per hectare.
The Core Strategy sets a threshold between 10 and 15 dwellings above which affordable housing will
be sought, and variable targets for affordable housing from 5% to 50%.9 The Core Strategy also seeks
that 40% of affordable housing should be for households on lower quartile earnings and 60% be for
households on lower decile earnings. The Core Strategy also proposes that affordable units should
be a pro-rata mix in terms of sizes and types of the total housing provision.
Thorp Arch and Walton are both defined in the Core Strategy as villages. Which the Core Strategy
expects to have limited development opportunities with development permitted only if it
functionally requires a rural location 10 They are both located however, in proximity to Wetherby, a
major settlement and the Core Strategy proposes that development in, and extensions of, these
settlements should contribute to approximately a fifth of all housing development, and this could
have impacts for Thorp Arch and Walton.
9
http://www.leeds.gov.uk/council/Pages/Affordable-housing-plannning-policy-(LDF).aspx
10
Leeds City Council: Core Strategy: Leeds Local Development Framework: page 26
12The Core Strategy is promoting local and city-wide employment through the development of a
strong local economy through enterprise and innovation in order to sustain long term economic
growth, and stimulate jobs. The economic priorities for the district will focus on facilitating existing
strengths in financial and business services and manufacturing and to continue to grow
opportunities in health and medical, low carbon manufacturing, digital and creative, retail, housing
and construction, social enterprise, leisure and tourism and the voluntary sector. To ensure the
potential for future job growth up to 2028, a requirement for 706,250 square metres of new office
floor space and 493 hectares of industrial and warehousing land has been identified. The Core
Strategy aims to promote retail development promoting
Town Centres first and the regeneration of local centres,
vitality and viability,
major retail development in the city centre,
policies to protect shopping frontages, and
protection of shopping function.
The Core Strategy recognises the importance of the local environment to provide a sense of well-
being and opportunities for leisure. It advocates the respect, conservation and enrichment of the
distinctive landscape character of Leeds and the management of growth in a sustainable way that
will deliver high quality design and environmental improvements. As part of the Core Strategy,
an infrastructure delivery plan sets out the importance of the right infrastructure in the right place at
the right time. The Core Strategy was adopted in November 2014. A Preferred Draft Site Allocations
Plan looking at housing, retail, employment and greenspace was released for comment in 2015.
1.3.2 Neighbourhood Planning
Neighbourhood Planning gives communities the right to shape development in their areas through
the production of Neighbourhood Development Plans. Neighbourhood Planning is not led by the
local authority. Introduced as part of the Localism Act 2011, Neighbourhood Development Plans
once made will be used when deciding planning applications. Four Neighbourhood Planning pilots
areas were identified and are testing the process, while 27 neighbourhoods have been designated to
date. There are also four designated neighbourhood forums. A further 9 neighbourhoods are actively
working on neighbourhood plans without a designated area and/or forum. More area and forum
designations are expected.
A local HMA is a valuable tool to help local communities preparing a neighbourhood plan to plan
positively for local housing needs. A local HMA should not be used to seek to amend the levels of
need which the Core Strategy expects individual Housing Market Characteristic Area to
accommodate. Evidence gathered at a local level should align with the wider strategic objectives and
policies of the recently adopted Core Strategy.
The City Council’s strategic evidence base is the Strategic Housing Market Assessment (2011) and
this provided a full objectively assessed housing requirement between 2012 and 2028 and evidence
on levels and types of need across the authority. As well as this, the City Council’s Strategic Housing
Land Availability Study and the Settlement Hierarchy has guided the distribution of this housing
requirement to sustainable locations with least impact on the Green Belt.
13Housing needs change over time so the City Council’s analysis is continually monitored to ensure, for
example, that the balance between job growth and housing growth is correct and to take account of
changes such as demographics, household size or commuting patterns. This strategic evidence base
operates as a whole across Leeds and supports the Core Strategy objectives and policies. It is not
appropriate, therefore, for local amendments to be made as this would necessitate amendments to
the evidence base as a whole.
The role for local evidence – whether an HMA or other forms of evidence - is important and should
seek to implement specific Core Strategy policies and to inform neighbourhood plans. Policy H4
(housing mix) seeks to provide for a range of types and sizes of houses to meet needs. In this
respect, Town Councils and Neighbourhood forums may wish to explore in more detail the need for
a specific housing mix in their area which may involve more homes for older people, first time buyers
etc. This evidence could then help the process of identifying suitable housing sites and be a material
consideration in the determination of planning applications. Policy H4 expects developers of
schemes of over 250 homes (or 50 homes in smaller settlements) to provide a Housing Needs
Assessment. There is an opportunity for parish councils and Neighbourhood Forums to influence
these HMAs.
1.3.3 Leeds Local Housing Investment Plan 2011-15
The Leeds Local Housing Investment Plan sets out the city’s housing investment requirements and
has been developed in conjunction with the Homes and Communities Agency (HCA). The plan is used
by the HCA for scoring funding bids through the Affordable Homes Programme Framework and the
Home Buy Programme. The plan recognises the local authority in its role as an enabler.
1.3.4 The Leeds Housing Strategy 2015 - 2020
This outlines the city’s priorities in relation to housing growth and improved housing quality. It
recognises the need for housing growth across the city to meet the housing needs evident in all
areas of the city in particular for affordable housing.
1.3.5 Leeds Council Housing Growth Programme
An investment programme of almost £43 million has been established to deliver around 400 new
affordable homes in a mixture of new council housing built to good space and energy efficiency
standards, and with the benefit of local employment and training opportunities; this programme
also addressed the repurchase of Right To Buy properties, and acquisition of empty properties.
142.0 Housing market, demographic and economic characteristics of
Thorp Arch and Walton.
2.1 Housing Stock and Tenure
Table 1: Housing tenure in Thorp Arch
Tenure Thorp Arch Parish Walton Parish Leeds
All Households 324 96 320,596
Owner Occupation 259 79.9% 81 84.4% 199,008 58.6%
Private Rented 41 12.7% 7 7.3% 57,456 17.9%
Social Rented 19 5.9% 4 4.2% 70,377 22.0%
Rented from Council 10 3.1% 4 4.2% 54,122 16.9%
Rented from Housing Association 9 2.8% 0 0.0% 16,255 5.1%
Living rent free 5 1.5% 4 4.2% 4,834 1.5%
(Source: 2011 Census from ONS Neighbourhood Statistics 2016)
Thorp Arch and Walton are both villages situated on the outskirts of Leeds. Thorp Arch comprises a
population of 1591 people living in 324 dwellings and Walton has a population of 225 people living in
96 dwellings.
Table 1 shows that the vast majority of households in Thorp Arch (80%) and in Walton (84%) owner
occupied, significantly higher than the city average (59%). The proportion of people renting privately
in Thorp Arch (13%) and Walton (7%) is much lower than the city average. The proportion of people
living in social rented housing in Thorp Arch (6%) is a quarter of the average for the city, and in
Walton (4%) is a fifth.
Appendix A shows data for housing type, housing size and occupancy rates for housing in Thorp Arch
and Walton and the comparison to Leeds as a whole. Table 2 shows the housing stock in Thorp Arch
is split between detached homes (32%). semi-detached homes (37%) and terraced/cottage type
houses (23%), while in Walton, 53% of homes are detached, 31% are semi-detached and 12.5% are
terracedVery few properties in either village are flats.
Table 2 Housing Type, Size and Occupancy
Thorp Arch Walton Leeds
Parish Parish
Detached/Semi-detached houses 224 69.1% 81 84.4% 52.2%
Terraced houses 75 23.1% 12 12.5% 26.5%
Flats 25 7.7% 3 3.1% 20.9%
1 or 2 Bed homes 81 25.0% 25 26.1% 42.6%
3 Bed homes 94 29.0% 30 31.3% 39.3%
4+ bed homes 149 46.0% 41 42.7% 17.8%
Under-occupying 296 91.4% 85 88.6% 68.9%
Overcrowded 1 0.3% 0 0.0% 24.5%
(Source: 2011 Census data at Parish Level taken from ONS Neighbourhood Statistics 2016)
1575% of homes in Thorp Arch, and 74% of homes in Walton have more than 3 bedrooms, and 36%
and 46% of homes respectively have more than 4 bedrooms. Only 2% of homes in both villages have
one bedroom, and 23% and 24% respectively have 2 bedrooms.
91% of households in Thorp Arch, and 89% of households in Walton were assessed in the 2011
Census as having had one more bedroom than needed, and 35% of households in Thorp Arch and
36% of households in Walton were assessed as having 2 or more bedrooms more than are required,
indicating a very high level of under-occupation in both villages.
2.2 House prices
Average prices in the area surrounding Thorp Arch and Walton are very high with the average being
£364,216, now almost 183,000 higher than the city average, or 2.0 times higher. Average house prices have
increased by just over 9% since 2009 (or 1.5% per annum) a slightly lower than that across the city (10.4% or
2% per annum)
The average price for entry level housing (1 or 2 bed houses or flats) is almost £184,000, almost £70,000
higher than the city average, or 1.6 times and has increased by 6.4% since 2009 (or by 1.3% per annum),
compared to 4% for the city as a whole. This places the area as being right at the top of the Leeds housing
market.
Table 3: Price movements 2009 - 2016
Year Average Prices ‘Entry Level ‘ Prices
Area including Area including
Thorp Arch and Leeds MD Thorp Arch and Leeds MD
Walton (LS23) Walton (LS23)
Dec-09 £333,679 £164,310 £172,498 £109,244
Dec-15 £364,216 £181,497 £183,658 £113,656
% increase 2009 - 2015 9.2% 10.4% 6.4% 4.0%
(Source: www.home.co.uk; www.rightmove.co.uk 2016)
Tables presented in Appendix B show that since 2009, prices for detached, semi-detached and
terraced properties, (5%, 15% and 6% respectively) suggesting an excess of demand over supply for
such dwellings. However, the price of flats reduced by 31% suggesting an excess of supply in the area
relative to demand. There was an increase in the prices of 3 bed increased by (19%) and 4 bed
homes (11%) but the price of 1 bed and 2 bed homes fell by around 3%.
Table 4: Gap between prices in Thorp Arch and the city average
Date Area including Leeds (MD) % of Leeds MD
Thorp Arch and Average prices
Walton (LS23)
Dec-09 £333,679 £164,310 203.08%
Dec-15 £364,216 £181,497 211.07%
% increase 2009 - 2015 9.2% 10.4%
(Source: www.home.co.uk 2016)
16Table 4 shows that the difference in house prices between the postcode area including Thorp Arch
and Walton and Leeds as a whole grew from 204% in 2009 to 211% in 2015.
Table 5: Localised house prices – Comparison of Thorp Arch to other adjoining areas
2 bed
3 bed 4+ bed
Surrounding communities 1 bed flat house or All
house house
flat
York £167,550 £327,500 £439,975 £695,000 £466,283
Harrogate £167,450 £302,499 £419,950 £639,975 £462,238
Wetherby £139,749 £247,694 £332,283 £595,000 £443,369
Scarcroft, Thorner £145,000 £239,975 £299,974 £767,500 £436,250
Collingham/Linton £164,975 £292,475 £467,500 £676,247 £420,611
Knaresborough £144,950 £214,975 £352,500 £592,500 £404,336
Boston Spa £129,950 £188,975 £289,997 £552,500 £391,225
Clifford £129,950 £212,475 £282,475 £650,000 £389,975
East Keswick, Bardsey £139,975 £245,000 £312,500 £622,500 £381,237
Bramham £129,950 £229,975 £420,000 £457,475 £369,975
Thorp Arch/Walton £129,950 £209,950 £287,475 £437,475 £364,216
Tadcaster £102,658 £176,215 £219,664 £463,436 £330,443
LEEDS AVERAGE £94,262 £131,767 £165,558 £369,304 £181,497
(Sources: Rightmove.co.uk; local estate agents, 2014)
Table 5 shows that house prices in Thorp Arch are lower than for other nearby villages and for
Wetherby, York and Harrogate.
Figure 2: Average house prices in Thorp Arch and surrounding areas
Knaresborough
Average Price
Harrogate £404,336
area
Average Price
£462,238
York area
Average Price
Wetherby £466,283
Average Price
£443,369 THORP ARCH/
WALTON
Collingham
Average Price
Average price Boston Spa
£420,611 Average Price
£364,216
£388,425
East Keswick/
Bardsey
Average Price
Bramham
Average Price Tadcaster
£381,237
£369,975 Average Price
£330,443
Scarcroft/ Thorner
Average Price
£436,250
LEEDS Barwick/Aberford
Average Price Average price
£399,777
£181,497
(Sources: www.home.co.uk; www.rightmove.co.uk; local estate agents, 2015)
172.3 Affordability of home ownership
Table 6 shows the income distribution for households living in the Wetherby Leeds City Council ward
which includes Thorp Arch and Walton. The data shows that the average household income is just
over £37,500, while the income needed to afford entry level housing in the area is just over £58,600.
(see Table 7 below)
Table 6: Income distribution and income needed to afford entry level housing
Thorp Arch Income range No of % of Cumulative
households households %
Up to £5,000 321 3.7%
£ 5,000 to £9,999 597 6.9% 10.7%
£10,000 to £14,999 787 9.1% 19.8%
£15,000 to £19,999 503 5.8% 25.6%
£20,000 to £24,999 633 7.4% 33.0%
£25,000 to £29,999 864 10.0% 43.0%
£30,000 to £34,999 620 7.2% 50.2%
£35,000 to £39,999 268 3.1% 53.3%
£40,000 to £44,999 1487 17.3% 70.6%
£45,000 to £49,999 877 10.2% 80.8%
£50,000 to £74,999 1321 15.3% 96.1%
£75,000+ 332 3.9% 100.0%
Average Household Income £37,593
Household income needed to afford entry level housing £58,603
% households unable to afford entry level prices 91%
(Source: Acorn demographics segmentation data 2013)
Table 6 suggests that 85% of all households (around 7,400 households) living in Wetherby Ward, do
not have a level of household income that would enable them to buy entry level homes at current
prices in the area. A third of all households earn below average incomes (£24,000) and a fifth have a
very low income (under £15,000), possibly reflecting both a relatively high proportion of pensioner
households in the population and a proportion of households in low paid work.
The underlying level of house prices, however, may have implications for new housebuilding that
may be taken up by incoming households, and the prices, or rental levels, at which they are sold, or
let.
Table 7: Income needed to afford various property types in Thorp Arch
1 bed 2 bed Entry 3 bed 4+ bed
Average Price All
flat house Level house house
Single income needed to afford £37,129 £59,986 £48,557 £82,136 £124,993 £104,062
Joint income needed to afford £44,810 £79,302 £58,603 £99,129 £150,853 £125,592
(Source: www.rightmove.co.uk 2015; CLG Guidance on SHMAs 2013))
Table 7 shows that overall, a single income of over £104,000 or a household income of almost
£126,000 would be needed to afford average house prices in the area, although this level is reduced
once available equity is taken into account.
18 For entry level prices (1 or 2 bed houses or flats) a single income of almost £48,700 (about twice
the average for the city) or a joint income of almost £59,000 (approximately 2.5 times an
average income) would be needed.
A single income of £82,000 or a joint income of £99,000 is needed for three-bed houses, and a
single income of £125,000 or a joint income of £151,000 is needed for houses with four or more
bedrooms. Although obviously, this reduces once available equity is taken into account.
Table 8 Deposits needed to afford entry level housing in Thorp Arch
1 bed flat 2 bed house or flat
5% 15% 20% 5% 15% 20%
Thorp Arch area £6,498 £19,493 £25,990 £10,498 £31,493 £41,990
LEEDS £4,713 £14,139 £18,852 £6,588 £19,765 £73,861
(Source: www.rightmove.com 2015)
The ability of first time buyers to enter the market is now becoming dependent on their ability to
find a sizeable deposit following tightening of lending criteria. Table 8 shows the level of deposit
needed by first time buyers to secure a mortgage for an entry level home (1 or 2 bedroom flat or
terraced house) in the Thorp Arch area. Table 8 shows that:
For a one-bed flat a deposit of between £6,500 ( for a 95% mortgage) and £26,000 (for a 80%
mortgage) would be needed, depending on location;
For a two-bed house or flat a deposit of between £10,500 (for a 95% mortgage) and £42,000
(for an 80% mortgage) would be needed, depending on location.
Table 9 No. of years needed for first time buyers to accumulate deposits
1 bed flat for a 2 bed house or flat
No of years to save a 20%
Bottom Bottom Bottom
deposit Average Bottom 10% Average
10% 25% 25%
income income income
income income income
Thorp Arch area 28.2 13.1 6.4 45.5 21.2 10.4
LEEDS 20.4 9.5 4.7 18.3 37.3 18.3
Source: www.rightmove.com 2014; Leeds Economy Handbook 2012 & CML 2013)
Table 9 shows the number of years it would take households on bottom 10%, bottom 25% and
average incomes to accumulate a 20% deposit to secure a mortgage on entry level property types
across Thorp Arch. It shows that accumulating the deposit needed could be out of reach for
households on bottom quartile incomes and even for average earners, accumulating the necessary
deposit would take between 6 and 10 years.
This suggests that some occupations with average incomes or above such as estate agents,
university lecturers, experienced teachers, graphic designers, educational psychologists, landscape
architects, loans underwriters, class teachers, police officers, nurses, midwifes, paramedics and
19junior hospital doctors may not be able to afford entry level house prices, along with lower paid
intermediate occupations (such as advice workers, teaching assistants, waiting & bar staff,
ambulance drivers, home and health care assistants, retail supervisors and administration officers),
and routine or unskilled occupations.
It is likely therefore, that there will be a growing demand for rented housing for those unable to
quickly provide the required deposit to secure a mortgage to buy a home.
2.4 Private rented market and affordable rents
Research and analysis in Leeds has shown a growing demand for rented housing across the city
brought about changing economic and housing market conditions and demographic changes. The
lending restrictions and the requirement from lenders for larger deposits to secure mortgages have
increased demand for rented housing while households accumulate the deposits needed, while
there is a continuing growth in the number of single person and couple households seeking housing
for rent.
Around 13% of properties in Thorp Arch and 7% in Walton are privately rented. The graphic below
shows the average rent for Thorp Arch in comparison to surrounding areas.
Figure 3: Market rents in Thorp Arch and Walton and surrounding areas
Knaresborough
Average Rent
Harrogate £883
Average Rent York
£1,108 Average Rent
£1,124
Wetherby
Average Rent THORP ARCH/
£999 WALTON
Average Rent
Boston Spa
£908
Average Rent
Collingham, Linton £912
East Keswick
Average Rent Bramham
£956 Average Tadcaster
Rent Average Rent
£880 £696
Bardsey, Scarcroft,
Thorner
Average Rent
£942
LEEDS
Average Rent Barwick/Aberford
Average Rent
£767 £786
(Source: www.rightmove.com and www.home.co.uk 2015)
Analysis of properties advertised for rent in the Thorp Arch and Walton and in surrounding areas is
contained in Table 10a which shows that market rents are higher than the average for Leeds as a
whole but lower than most of the villages surrounding and in the major settlements of Wetherby,
York and Harrogate. This establishes the area including Thorp Arch and Walton as a high cost rental
20market that may be largely inaccessible to households with below average incomes, and even to
some with incomes around the average.
Table 10a Monthly market rents in the Thorp Arch area compared to surrounding areas
Surrounding communities 1 bed 2 bed 3 bed 4+ bed All
York £887 £1,063 £1,119 £1,425 £1,124
Harrogate £602 £854 £1,084 £1,650 £1,048
Wetherby £500 £795 £1,050 £1,650 £999
Collingham/Linton/East Keswick £648 £763 £1,061 £1,350 £956
Bardsey, Scarcroft, Thorner £500 £695 £1,050 £1,525 £942
Boston Spa £475 £722 £1,000 £1,450 £912
Thorp Arch/Walton £475 £752 £975 £1,600 £908
Knaresborough £573 £641 £840 £1,478 £883
Bramham £475 £695 £950 £1,400 £880
LEEDS AVERAGE £500 £661 £783 £1,124 £767
Tadcaster £412 £548 £750 £1,075 £696
(Source: www.rightmove.com December 2015)
Table 10 b shows the level of Affordable Rents, set at 80% of market levels and shows that even
rents at 80% of market levels are significantly higher than the Leeds average and are likely to be out
of reach of many households (see below)
Table 10b Monthly intermediate (80% market) rents compared to surrounding areas
Surrounding communities 1 bed 2 bed 3 bed 4+ bed All
York £710 £850 £895 £1,140 £899
Harrogate £482 £683 £867 £1,320 £838
Wetherby £400 £636 £840 £1,320 £799
Collingham/Linton/East Keswick £518 £610 £849 £1,080 £765
Bardsey, Scacroft, Thorner £400 £556 £840 £1,220 £754
Boston Spa £380 £578 £800 £1,160 £730
Thorp Arch/Walton £380 £602 £780 £1,280 £726
Knaresborough £458 £513 £672 £1,182 £706
Bramham £380 £556 £760 £1,120 £704
LEEDS AVERAGE £400 £529 £626 £899 £614
Tadcaster £330 £438 £600 £860 £557
(Source: www.rightmove.com December 2015)
Table 11 Income needed to afford market and affordable rents
Area including Thorp Arch and Walton 1 Bed 2 Bed 3 Bed 4+ Bed ALL
Market Rents
21You can also read