U.S. END MARKET ANALYSIS FOR FOOTWEAR FROM EAST AFRICA - November 2020
←
→
Page content transcription
If your browser does not render page correctly, please read the page content below
SOUTHERN AFRICA

                                                                     SOUTHERN AFRICA

U.S. END MARKET ANALYSIS FOR
FOOTWEAR FROM EAST AFRICA
         November 2020

                                                                                             1

      U.S. END MARKET ANALYSIS FOR FOOTWEAR FROM EAST AFRICA USAID
SOUTHERN AFRICA

2

    U.S. END MARKET ANALYSIS FOR FOOTWEAR FROM EAST AFRICA USAID
SOUTHERN AFRICA

TABLE OF CONTENTS
1. Executive Summary ................................................................................................................................ 5
II. Introduction and Scope of Report ................................................................................................ 6
III.Product Summary ................................................................................................................................... 6
IV.East Africa Footwear Exports                                   ..................................................................................... 7
     A. East Africa Footwear Exports to the World ..................................................................................... 7
   B. East Africa Footwear Exports to the U.S............................................................................................... 9
V. U.S. Market Summary ........................................................................................................................... 13
     A. General Market Characteristics............................................................................................................... 13
     B. Market Size and growth.............................................................................................................................. 14
     C. U.S. Footwear Market Segment............................................................................................................... 15
     D. U.S. Footwear Market Trends................................................................................................................... 19
     E. Principal Footwear Buyers in The U.S...................................................................................................... 21
     F. U.S. Footwear Prices.................................................................................................................................... 21
V. Non-Tariff Requirements .................................................................................................................. 22
   A. AGOA Rules of Origin.............................................................................................................................. 22
   B. U.S. Footwear Import Tariffs for MFN, AGOA, and GSP                         ...................................................................... 22              3

     C. Import Regulations...................................................................................................................................... 23
     D. Standards and Certifications..................................................................................................................... 24
   E. Packaging and Labeling ................................................................................................................................ 24
VII. U.S. Distribution ................................................................................................................................... 24
     A. Supplier Selection ........................................................................................................................................ 24
   B. Distribution Channels ................................................................................................................................ 24
   C. Retail Channels ............................................................................................................................................ 25
VIII. Sales Promotion .................................................................................................................................. 27
   A. Key Trade Fairs, (2019 Editions)............................................................................................................... 27
   B. Key Industry Associations .......................................................................................................................... 27
IX. Competition ............................................................................................................................................ 28
     A. Key Competitors.......................................................................................................................................... 28
     B. Critical Success Factors .............................................................................................................................. 29
   C. Prospects.................................................................................................................................................... 30
X. Bibliography ................................................................................................................................................ 30

                                          U.S. END MARKET ANALYSIS FOR FOOTWEAR FROM EAST AFRICA USAID
SOUTHERN AFRICA

    ACRONYMS
    AAFA                 American Apparel and Footwear Association

    AAMA                American Apparel Manufacturers Association

    AGOA                 African Growth and Opportunity Act

    CAGR                Compound Annual Growth Rate

    CPSC                Consumer Product Safety Commission

    DoD		               Department of Defense

    FDRA		              Footwear Distributors and Retailers of America

    FFANY               Fashion Footwear Association of New York

    FIA                 Footwear Industries of America

4   FOB		               Free on Board

    GDP                 Gross Domestic Product

    GSP		                Generalized System of Preferences

    ITC		               International Trade Center

    MFN		               Most Favored Nation

    RoO		               Rules of Origin

    SSA		               Sub-Saharan Africa

    TPP		                Trans-Pacific Partnership

    U.S.                 United States

    USAID               United States Agency for International Development

    USFIA               United States Fashion Industry Association

    USFMA               United States Footwear Manufacturers Association

    USITC		             United States International Trade Commission

    WRAP                Worldwide Responsible Accredited Production

             U.S. END MARKET ANALYSIS FOR FOOTWEAR FROM EAST AFRICA USAID
SOUTHERN AFRICA

   I. EXECUTIVE SUMMARY

W
                 hile the African Growth and Opportunity Act            This report identifies four key market trends. First, continued strong
                 (AGOA), passed in 2000 and extended in 2015            growth is expected in the athletic/athleisure segment. Second, there
                 until 2025, provides duty-free access to the U.S.      will be a more pronounced orientation toward eco-friendly products.
                 market for African footwear products, East African     Customers are prepared to pay a premium for footwear made of
countries have for the most part struggled to take advantage of it.     recycled material or which are made using more sustainable production
Although Ethiopia exported, on average, a little over $25 million in    methods. Third, mass customization will offer the benefits of mass
footwear products per year to the U.S. from FY 2016-20, the rest        production while allowing customers to customize certain aspects of
of East Africa generated, in the aggregate, an average of just $0.332   their footwear purchases. Finally, “experientialisation” will see the rise         5
million annually over that period. East Africa’s performance under      of more brand-specific stores offering customized customer in-store
AGOA is compounded by a slowing U.S. end market. Although               experiences while providing brands with more rapid feedback on their
the U.S. remains the largest footwear market in the world by a          products.
wide margin, the industry has stagnated; projected to result in slow
                                                                     While East African manufacturers will need to be cognizant of a variety
growth for the next five years.
                                                                     of import-related regulations and standards, from packaging and
The market is segmented into four categories. The first is sneakers  labeling to consumer safety measures, probably the most prominent
(also known as “athleisure” footwear) that features a sporty look    of these is WRAP (Worldwide Responsible Accredited Production)
and values form over function. The second, athletic footwear, is     certification, which ensures that manufacturers are employing safe,
designed for use in sports activities. Leather footwear is more      lawful, humane, and ethical manufacturing practices. With respect to
closely associated with high-end fashion; while the “textiles        distribution and retailing, although e-commerce has played a strong
and other footwear” category includes town                                                role in the fashion industry, most footwear is
footwear, rubber boots, flip flops, and clogs.                                            still sold through brick-and-mortar stores due to
                                                                                          customer preferences to try footwear on prior to
Textiles and other footwear is the largest                “Textiles and other             purchase.
segment, projected to account for 34.7% of the
market in 2025. However, with a compound               footwear is the largest The U.S. footwear industry is nearly exclusively
annual growth rate (CAGR) of 4.2% from                  segment, projected to imports, which account for upward of 95% of all
2012-2025, it lags both sneakers and athletic                                             consumption. Most of this comes from Asia; with
footwear. These are the least expensive shoes            account for 34.7% of China recently losing share to Vietnam and, to a
on the market. Sneakers, the second largest              the market in 2025.” lesser extent, Indonesia. China now accounts for
market segment, projected to account for                                                  about half of U.S. imports, while Vietnam generates
27.5% of the market in 2025, is also the fastest-                                         about a quarter. Together they dominate the low-
growing; with a 7.9% CAGR. Athletic footwear,                                             cost segment of the market. Imports are likely to
although projected in 2025 to remain the smallest market segment     remain dominant due to the lower cost of imported product in a price-
at 18.3%, is growing quickly at 5.2% per annum. Athletic footwear    sensitive industry, despite a trend toward “re-shoring” production in
has the highest price point on the market. In contrast with the      order to streamline supply chains. While U.S. firms have shown broad
other categories, leather footwear has rapidly lost market share     interest in geographic diversification (especially away from China), East
since 2012, when it accounted for nearly 42% of the market by        African exporters will need to compensate for their higher wages and
revenue. By 2025 is projected to shrink to half that, at just 21.3%. slower speed to market through lower sourcing costs and stronger
In fact, over the 2012-2025 period, leather footwear is projected to compliance. East Africa exporters can also target high MFN tariff
contract, with a CAGR of -2.5% over that time.                       product groups such as protective footwear where AGOA’s duty free
                                                                     tariffs will give them a cost advantage in the U.S. market.

                                U.S. END MARKET ANALYSIS FOR FOOTWEAR FROM EAST AFRICA USAID
SOUTHERN AFRICA

    1I. INTRODUCTION AND                                        aims to be the focal point in East Africa for businesses
                                                                and national governments seeking to take advantage
    SCOPE OF REPORT                                             of AGOA and those wanting to engage in two-way
                                                                trade between the U.S. and the 5 East African states
    USAID Southern Africa Trade and Investment                  through import of goods from the U.S. including
    Hub (USAID TradeHub                                         technology and equipment. To achieve the activity
    The United States Agency for International                  objectives, the buy-in will provide capacity building
    Development (USAID) Southern Africa Trade and               assistance to the private sector and state institutions
    investment Hub (USAID TradeHub) is a five-year              to help them understand the U.S. while creating
    trade and investment program for Southern Africa.           awareness of business opportunities in both the
    The USAID TradeHub is expected to increase global           U.S. and East Africa. The USAID TradeHub will also
    competitiveness and intraregional trade and improve         link enterprises and trade associations in the U.S.
    food security in Southern Africa. The Hub engages           with those in East Africa to promote collaboration
    with partners across the region to increase sustainable     and business exchange, and in addition, provide
    economic growth, global export competitiveness,             technical assistance for trade policy review focusing
    and trade in targeted Southern African countries.           on removing barriers to trade within East Africa.
    It supports these objectives by increasing exports
    from Southern African countries to South Africa             In collaboration with national institutions, the USAID
    and the United States (under the African Growth             TradeHub’s East Africa buy-in activity develops and
    and Opportunity Act [AGOA]), boosting capital               undertakes trade-enhancing activities involving
    and technology flows from South Africa to other             private enterprises in sectors informed by the
    Southern African countries, and providing targeted          national AGOA utilization strategies formulated with
6   trade facilitation support to Zambia. The USAID             the support of previous USAID Trade and Investment
    TradeHub works with market actors to identify and           Hub projects including undertaking U.S. end-market
    resolve enterprise constraints and to implement             studies for target product and building capacity of East
    sustainable solutions through market-based trade and        African enterprises to engage with U.S. businesses.
    investment facilitation services. The USAID TradeHub        This report is one such end market study, with a
    partners with USAID bilateral missions through the          focus on footwear.
    USAID/Southern Africa Regional Economic Growth
    Office in the successful delivery of its objectives.        Scope of the End Market Study
                                                                The current study addresses mainly footwear
    USAID TradeHub East Africa Trade Promotion                  products available in East Africa which have potential
    and AGOA Buy-in activity                                    for export to the United States. The report is intended
    The USAID TradeHub also has an activity in East Africa      to provide footwear producers in the East African
    through a Buy-in arrangement, to promote economic           countries of Ethiopia, Kenya, Rwanda, Tanzania, and
    activity between the United States and 5 East African       Uganda with some actionable intelligence on the
    countries - Ethiopia, Kenya, Rwanda, Tanzania and           U.S. market in a highly accessible format along with
    Uganda. This 18-month activity seeks to boost two-          references and resources for further research.
    way trade and investment between the U.S. and East
    Africa, under the U.S. Government’s Prosper Africa
    Initiative, with a focus of expanding exports to the
                                                                III. PRODUCT SUMMARY
                                                                Footwear is designated HS code 64. Subheadings
    U.S. under the Africa Growth and Opportunity Act
                                                                include:
    (AGOA), and increasing investment and exports of
    technology from the U.S. to East African firms. The
                                                                6401: Waterproof footwear with outer soles and
    activity also seeks to facilitate reduction of barriers
                                                                uppers of rubber or plastics, the uppers of which are
    to trade within East Africa.
                                                                neither fixed to the sole nor assembled by stitching,
                                                                riveting, nailing, screwing, plugging or similar processes
    The USAID TradeHub’s East Africa Buy-in activity

                               U.S. END MARKET ANALYSIS FOR FOOTWEAR FROM EAST AFRICA USAID
SOUTHERN AFRICA

6402: Other footwear with outer soles and uppers of          IV. EAST AFRICA FOOTWEAR
rubber or plastics
                                                             EXPORTS
6403: Footwear with outer soles of rubber, plastics,
leather or composition leather and uppers of leather         A. East Africa Footwear Exports to the World
                                                             Table 1 below uses ITC TradeMap data to show all
6404: Footwear with outer soles of rubber, plastics,         footwear exports from East African countries from
leather or composition leather and uppers of textile         2015-2019 (the most recent year for which data was
materials.                                                   available for world exports for all countries).

Table 1: East Africa-World Footwear Exports by Country, 2015-2019 (‘000 U.S.D)
             2015       2016        2017         2018      2019      Average, 2015-2019

 Ethiopia    $33,412    $37,118     $45,485      $26,549   $37,163   $35,945

 Kenya       $38,400    $34,657     $31,783      $34,569   $38,154   $35,513

 Rwanda      $1,677     $3,790      $3,175       $3,458    $86       $2,437

 Tanzania    $12,642    $127        $288         $590      $1,211    $2,972

 Uganda      $3,406     $3,139      $2,809       $4,047    $671      $2,814

Source: ITC TradeMap. Presentation by Report Author
                                                                                                                           7

Footwear exports from East Africa to the world have been dominated by Ethiopia and Kenya; with the
concentration increasing from an average of 89.7% from 2015-2019 to 97.5% in 2019 (see Figures 1 and 2).

Figure 1: Share of Footwear Exports from East Africa to the World, 2015-2019

                                          3.7%    3.5%
                                   3.1%                     45.1%

                                       44.6%

                 Ethiopia        Kenya         Rwanda        Tanzania         Uganda

                                                            Source: ITC TradeMap. Presentation by Report Author.

                               U.S. END MARKET ANALYSIS FOR FOOTWEAR FROM EAST AFRICA USAID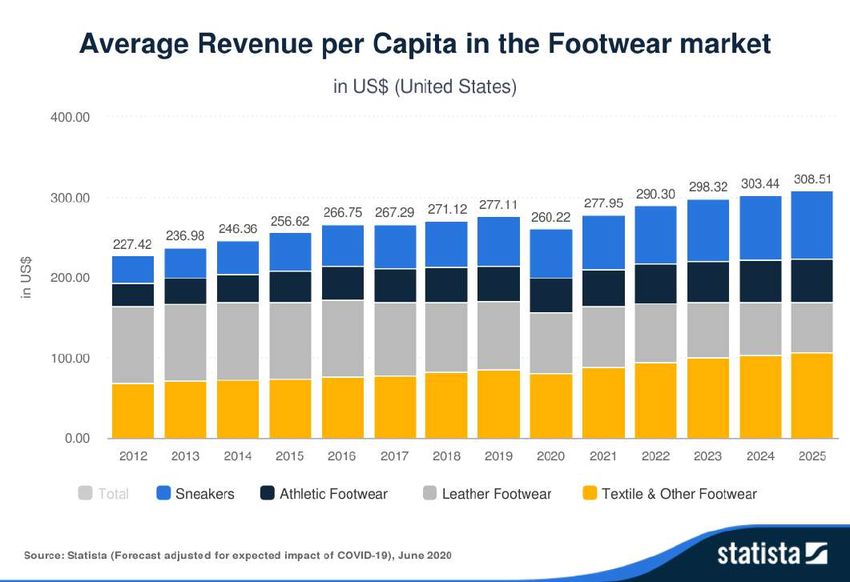
SOUTHERN AFRICA

    Figure 2: Share of Footwear Exports from East Africa to World, 2019
                                                          1.6%
                                                  0.1%
                                                                     0.9%

                                               49.4%                 48.1%

                            Ethiopia        Kenya         Rwanda            Tanzania       Uganda
                                                                    Source: ITC TradeMap. Presentation by Report Author.

     Despite the fact that Ethiopia and Kenya have               exports went to the U.S. When Canada is accounted
8
     accounted for similar export revenues over the past         for, 84.5% of Ethiopia’s exports were bound for the
     five years, however, their respective export portfolios     North American market. Meanwhile, over 90% of
     look dramaticallyEthiopia's
                       different. InFootwear
                                     2018, for example (the      Kenya’s footwear exports were made to regional
     most recent year    for which  country-specific
                    Export Portfolio, 2018            export     countries.
     data was available), nearly three quarters of Ethiopia’s

    Figure 3: Ethiopia’s Footwear Export Portfolio, 2018
                                                                 5.6%
                                                         2.5%
                                                 2.7%
                                              4.8%

                                                     10.9%

                                                                    73.6%

                                        U.S    Canada      Kenya     China     Hong Kong       Other

                                                                    Source: ITC TradeMap. Presentation by Report Author.
                                U.S. END MARKET ANALYSIS FOR FOOTWEAR FROM EAST AFRICA USAID
SOUTHERN AFRICA

       Figure 4: Kenya’s Footwear Export Portfolio, 2018
s Footwear
tfolio, 2018

                                                   4.0%
                                                            8.1%

                                                  12.7%                     29.8%

                                                   16.0%

                                                                   29.5%

                                   Uganda     Rwanda        DRC      Tanzania       S.Sudan        Other

                                                                       Source: ITC TradeMap. Presentation by Report Author.

       B. East Africa Footwear Exports to the U.S.
                                                                                                                                   9
       Table 2 below uses USITC data to show footwear exports from East African countries to the U.S. for U.S. fiscal
       years 2016 to 2020 (October to September).

       Table 2: East Africa Footwear Exports to U.S. by Country, US Fiscal Year 2016-2020 (‘000 U.S.D)

                                                                                                           5 Year
        Country                FY2016         FY2017         FY2018         FY2019         FY2020          Average

        Ethiopia               21,844         27,147         33,783         28,367         15,713          25,371

        Kenya                  250            104            111            179            471             223

        Rwanda                 -              -              -              2              -               0

        Tanzania               6              3              1              1              1               2

        Uganda                 134            141            106            84             70              107

        TOTAL                  22,234         27,395         34,002         28,632         16,255          25,704

                                                                            Source: USITC, Abstracted by USAID TradeHub.
                                    U.S. END MARKET ANALYSIS FOR FOOTWEAR FROM EAST AFRICA USAID
SOUTHERN AFRICA

10

     U.S. END MARKET ANALYSIS FOR FOOTWEAR FROM EAST AFRICA USAID
SOUTHERN AFRICA
11
U.S. END MARKET ANALYSIS FOR FOOTWEAR FROM EAST AFRICA USAIDShare of East Africa footwear SOUTHERN AFRICA
exports to U.S. average
(FY 2016-2020)
Footwear exports from East Africa to the U.S. from Fiscal Year 2016-2020 were dominated by Ethiopia (see
Figure 5). As we can see from Table 2, however, Ethiopia’s exports reached a peak of 33.78 million in FY 2018
and have been in decline ever since.
Figure 5: Share of Footwear Exports from East Africa to the U.S., FY 2016-2020
0%
0% 1%
0%
99%
12
Ethiopia Kenya Rwanda Tanzania Uganda
In FY2016-2020 Ethiopia was almost the only East African exporter of footwear to the U.S. (see Figure 6).
Besides Ethiopia, only Kenya, with a small share at 1 %, registered any exports to the U.S.
Figure 6: Value of Footwear Exports from East Africa to the U.S., FY 2020 ($’000)
Value of East 1 70
African FY 0
2020 exports
471
to U.S.
15,713
Source: USITC,
Abstracted by
Ethiopia Kenya Rwanda Tanzania Uganda USAID TradeHub.
U.S. END MARKET ANALYSIS FOR FOOTWEAR FROM EAST AFRICA USAIDSOUTHERN AFRICA
V. U.S. MARKET SUMMARY
A. General Market Characteristics
Sneakers and athletic shoes have become the bright spots in an otherwise slowing industry, reflecting a
trend toward health and wellness. In addition, more relaxed dress codes contributed to growth in casual,
comfortable shoes typically employed in active lifestyles.1 Imports dominate the U.S. market (an estimated 98
percent of shoes sold in the U.S. are imported2), and most of these are imported from developing countries,
where U.S. brands can take advantage of the lower cost of production.
Domestic production relative to imports may increase in the coming years, however, for two reasons. The
first is the potential for additional tariffs on imported footwear, particularly footwear from China, which
accounts for around half of all imports. The increased U.S. emphasis on pushing U.S. exports and protecting
U.S. jobs was epitomized by its withdrawal from the Trans-Pacific Partnership (TPP), which would have
reduced tariffs on goods (including footwear) sourced from countries that were party to the Agreement
(including Vietnam and Mexico). The second is the Berry Amendment, which will require the Department
of Defense (DoD) to purchase 100% of its footwear (among other items, such as food and clothing) from
domestic sources.3 There has also been a short-term decrease in imports, possibly due (at least in part) to
the impact of Covid-19.
Due to the outsourcing of the largely commoditized production function, most brands focus primarily on
high-value activities, including design, marketing, and distribution. Some major manufacturers, including Nike
and Adidas, have recently started “re-shoring” production in an attempt to streamline their supply chains; but
many of these domestic factories have struggled to stay price-competitive with production factories located
abroad.4
13
Key demand determinants include price, disposable income, brand recognition, and seasonal factors. Overall
footwear sales are dominated by individuals from 35-54 years of age (see Figure 7), who collectively make up
44.6% of all footwear purchases.
700
601
Average annual expenditure in U.S.
600 520
500 447
400 419
400
dollars
284
300 255
200
100
0
Under 25 25 to 34 years35 to 44 years45 to 54 years55 to 64 years 65 years and All consumer
years older units
1. “Footwear in the U.S.,” Euromonitor International, March 2018.
2. “Sourcing Snapshot: Global Footwear Manufacturing and Trade,” Sourcing Journal, August 2018.
3. “Shoe Manufacturing in the U.S. Industry Report”, IBIS World, March 2020. IBIS World.
4. IBIS World.
U.S. END MARKET ANALYSIS FOR FOOTWEAR FROM EAST AFRICA USAIDSOUTHERN AFRICA
B. Market Size and Growth
The U.S. is the largest footwear market in the world by a significant margin (see Figure 8).
Figure 8: Revenue of the Global Footwear Market by Country (Millions of U.S.$), 2019
Source: Statista
14
Figure 9: Projected Growth, U.S. Shoe Manufacturing, 2020-2025
Industry Outlook 2020-2025 The U.S. footwear manufacturing industry has
contracted over the last five years, however,
1
falling at a CAGR of 0.8% since 2015. Projected
0 growth from 2020-2025 is anticipated to be slow,
Percentage
at an annualized rate of just 0.1% p.a. (see Figure
-1
9). The industry’s contribution to U.S. GDP over
-2 that period of time, meanwhile, is projected to
shrink, due in part to high levels of competition,
-3
especially from low-cost imports. Statista project
20 21 22 23 24 25 somewhat faster growth over the same period,
Year at 1.8%, but this is still projected to lag other
Shoe & Footwear Manaufacturing source: IBISWORLD
major markets including China (5.5%), Germany
(2.8%), and the UK (2.6%).5
C. U.S. Footwear Market Segments
There are multiple ways to segment the U.S. footwear market. In Section A we presented consumer
segmentation by age. However, consumer segmentation can also be thought of in other ways (see Figure 10).
Characteristics of each are discussed briefly.6
5. “Footwear Report”, Statista, July 2020.
6. Characteristics as described by IBIS World.
U.S. END MARKET ANALYSIS FOR FOOTWEAR FROM EAST AFRICA USAIDSOUTHERN AFRICA
Figure 10: U.S. Footwear Market by Consumer Segment, 2020
51.8% 25.5% 19.5% 3.2%
Men’s footwear Rubber and plastic Women’s footwear Other footwear
(except athletic) footwear including (except athletic)
athletic footwear
Shoe & footwear Manufacturing Source: IBISWorld
• Men’s Footwear: Characterized by slow changes Segmentation can also be considered by use.7
in style, particularly compared with women’s shoes. The footwear market can be segmented into:
• Rubber and Plastic Footwear, including Athletic
Footwear: Vulcanized, molded or cemented soles • Athletic Footwear: Designed specifically for
and fabric athletic purposes.
15
uppers. Includes children’s, women’s and men’s • Leather Footwear: Includes town footwear,
shoes, and typically includes rubber boots, canvas boots, sandals and clogs with leather uppers for
shoes, women, men
rubber sandals and galoshes. and children.
• Women’s Footwear: Characterized by rapid style • Sneakers: Also known as “athleisure”, this
changes, with the sophisticated, high-end market category features everyday footwear designed with a
serviced sporty look
by Italian imports. but where fashion outweighs function.
• Other Footwear: Includes specialized athletic • Textiles and Other Footwear: Models not made
shoes, protective coverings, work boots, water of leather and/or cannot be assigned to athletic
shoes and footwear. Town footwear with textile, rubber or
house slippers. plastic uppers as well as rubber boots, flip flops and
wooden clogs.
7. “Footwear Report”, Statista, July 2020.
U.S. END MARKET ANALYSIS FOR FOOTWEAR FROM EAST AFRICA USAIDSOUTHERN AFRICA
Figure 11 shows revenue per capita for each of these segments since 2012 and projected out to 2025. A
close look at the figure suggests that three of the segments represent an ever-increasing share of per capita
Figure 11:
Average Revenue per Capital in the footwear market
16
U.S. END MARKET ANALYSIS FOR FOOTWEAR FROM EAST AFRICA USAIDSOUTHERN AFRICA
Sneakers
Figure 12: Revenue from Sneakers Segment (Billions of U.S.$), 2012-2025
Sneakers
35
30
25
20
15
10
5
0
2012 2013 2014 2015 2016 2017 2018 2019 2020 2021 2022 2023 2024 2025
Source: Statista Consumer Market Outlook, 2020. Presentation by Report Author
The sneakers segment is the fastest-growing segment, with a projected CAGR of 7.9% from 2012-2025. It is
projected to be the second-largest segment by 2025, trailing only textiles and other footwear. 17
Athletic Footwear
Athletic Footwear
Figure 13: Revenue from Athletic Footwear Segment (Billions of U.S.$), 2012-2025
Athletic Footwear
20
18
16
14
12
10
8
6
4
2
0
2012 2013 2014 2015 2016 2017 2018 2019 2020 2021 2022 2023 2024 2025
Source: Statista Consumer Market Outlook, 2020. Presentation by Report Author.
U.S. END MARKET ANALYSIS FOR FOOTWEAR FROM EAST AFRICA USAIDSOUTHERN AFRICA
The athletic footwear segment is projected to grow at a CAGR of 5.2% from 2012-2025. Although
projected to be the smallest segment in 2025, it has the second-fastest growth rate and will nearly have
overtaken leather footwear by revenues by that time.
Leather Footwear
Figure 14: Revenue from Leather Footwear Segment (Billions of U.S.$), 2012-2025
Source: Statista Consumer
Leather Footwear Market Outlook, 2020.
Presentation by Report
35
Author.
30
25
20
15
10
5
0
2012 2013 2014 2015 2016 2017 2018 2019 2020 2021 2022 2023 2024 2025
18
The leather footwear segment is projected to grow at a CAGR of -2.5% from 2012-2025. It is the only
segment to post negative growth over this period. After its status as the largest segment in 2012, it will be
nearly overtaken by athletic footwear to be the smallest by 2025.
Textiles and Other Footwear
Figure 15: Revenue from Textiles and Other Footwear Segment (Billions of U.S.$), 2012-2025
Source: Statista Consumer
Textiles and Other Footwear Market Outlook, 2020.
Presentation by Report
40
Author.
35
30
25
20
15
10
5
0
2012 2013 2014 2015 2016 2017 2018 2019 2020 2021 2022 2023 2024 2025
The textiles and other footwear segment is projected to grow at a CAGR of 4.2% from 2012-2025, at which
time it is projected to be the largest segment of the market.
U.S. END MARKET ANALYSIS FOR FOOTWEAR FROM EAST AFRICA USAIDSOUTHERN AFRICA
D. U.S. Footwear Market Trends
There are a number of trends that will have a bearing on the development of the U.S. footwear sector in the
coming years. These include 1) continued growth in the athletic/athleisure segment; 2) a stronger orientation
toward eco-friendly products; 3) mass customization; and 4) experientialisation.
Growth in the Athletic/Athleisure Segment
According to the NPD Group, athleisure accounted for about 65 percent of new dollar value gains. Athletic
footwear sales, in turn, are being driven in large part by increases in participation in athletic activities such
as running and hiking; while the athleisure segment has been driven by an increasing trend toward casual
clothing. Trends within the athletic footwear segment include innovations in sole technology and a growing
preference for premium and customized products.8 Speed to market has also become a priority; with some
companies (such as Under Armour) employing 3-D printing technologies to produce quality footwear more
quickly.9 Athletic footwear sales, by volume, is shown in Figure 16.
Figure 16: Athletic Footwear Sales by Volume (in Millions of Pairs)
450
400 393
378
350 358
336
300 311
284
250 249
200 183
150 150
129
100 91
71
50
19
0
2010 2011 2012 2013 2014 2015 2016 2017 2018 (e) 2019 (p) 2020 (p) 2021 (p)
Source: Statista
Mass Customization
Mass customization combines the benefits of mass production with the ability to allow the individual
consumer to customize their final product, allowing the buyer to co-create the product they purchase. This
is generally done either with an app, through a web interface, or in-store. An example of this is NikeID.10
Experientialisation
Experientialisation refers to dedicated retail outlets owned by a single brand that allows that brand more
control over the customer’s in-store experience. They typically also generate faster turnaround times as
well as more immediate customer feedback that can be incorporated into product design.11
Orientation Toward Eco-Friendly Products
Eco-friendly (or sustainable) production generally involves improved environmental practices along a
company’s manufacturing and supply chain, which may include either the final product (Nike produces
sustainable sneakers made of Flyknit material made from 50% recycled fiber)12 or more eco-friendly
production practices such as plastics recycling. Consumers are increasingly willing to pay a premium price
for a product that is perceived to be eco-friendly (see Figure 17).
8. “Top 3 Trends Impacting the Athletic Footwear Market in the U.S. Through 2020,” Technavio, August 2016.
9. “Market Analysis, Size, Share and Forecast 2018-2026,” Credence Research, October 2018.
10. “Footwear Report”, Statista, July 2020.
11. Ibid.
12. www.prnewswire.com/news-releases/sustainable-footwear-market-size-worth-11-8-billion-by-2027--cagr-5-8-grand-view-research-inc-301059115.html
U.S. END MARKET ANALYSIS FOR FOOTWEAR FROM EAST AFRICA USAIDSOUTHERN AFRICA
• Textiles and Other Footwear: Models not made of leather and/or cannot be assigned to athletic
footwear. Town footwear with textile, rubber or plastic uppers as well as rubber boots, flip flops and
wooden clogs.
Figure 17: Willingness to Pay for More Eco-Friendly Apparel or Footwear Amongst U.S. Consumers,
2018
No
37%
Yes
63%
20
No Yes
Due in large part to the surge in athletic and athleisure wear, Nike holds a strong position among teens in
the U.S. market (see Figure 18).
Figure 18: Leading Footwear Brands Amongst U.S. Teens as of Fall, 2019
Source: Statista
U.S. END MARKET ANALYSIS FOR FOOTWEAR FROM EAST AFRICA USAIDSOUTHERN AFRICA
E. Principal Footwear Buyers in the U.S.
Key players operating in the U.S. footwear market include Nike, Foot Locker, Skechers, Caleras, and
Wolverine World Wide, Inc. The relative size of each, by turnover, is illustrated in Figure 19 below.
Figure 19: Leading Footwear Companies in the U.S. by Turnover, 2018
Source: Statista 21
F. U.S. Footwear Prices
Footwear prices in the U.S. vary dramatically. While prices in each category have generally trended upward
since 2012 and are projected to continue doing so (see Figure 20), there are dramatic differences by cate-
gory, both in prices and in projected growth. Athletic footwear and, to a lesser extent, leather shoes enjoy
higher-end positions in the market; while sneakers are a more commoditized item. Meanwhile, while prices
are projected to climb 44.5% in textiles and other footwear and 46.3% in leather footwear between 2012
and 2025, prices for sneakers will remain relatively flat while athletic footwear is projected to increase just
12.9% over the same period.
U.S. END MARKET ANALYSIS FOR FOOTWEAR FROM EAST AFRICA USAIDSOUTHERN AFRICA
Figure 20: Price Trends by segment of Footwear Market
V. NON-TARIFF REQUIREMENTS
22
A. AGOA Rules of Origin
The African Growth and Opportunity Act (AGOA) provides duty-free access to a wide range of products
(over 6,400, including footwear) from sub-Saharan African (SSA) nations. AGOA was originally enacted in
2000 and renewed in 2015 for an additional 10 years. Duty-free access to the U.S. market is subject to a
Rules of Origin (RoO) provision. This provision specifies that the imports to the U.S. must come directly
from an SSA nation (rather than having transited first through a third country). At least 35 percent of the
value of the product must accrue to the African nation from which it is being exported. This may include
production and/or processing. Up to 15 percent of the final value of the product may be of U.S. origin, while
inputs from other qualifying SSA countries may also contribute to meeting the 35 percent requirement.
More details on AGOA rules of origin can be found on https://agoa.info/about-agoa/rules-of-origin.html
B. U.S. Footwear Import Tariffs for MFN, AGOA, AND GSP
As noted in Part A of this section, tariffs under AGOA have been lowered to 0% for the duration of the
agreement, currently in force until 2025. Table 3. below summarizes the import tariff under Most Favored
Nation (MFN), AGOA, and the General System of Preferences (GSP) for footwear products. This is a rele-
vant consideration for East African exporters since, although AGOA can be a useful market entry mecha-
nism, tariffs after 2025 may return to their pre-AGOA levels in the event that the accord is not renewed;
making these tariffs an important strategic consideration for East African exporters as they make their
determinations about how best to enter the U.S. market.
Table 3: U.S. Import Tariffs Under MFN, AGOA, and GSP
Mechanism Import Tariff
MFN 0 to 48%; some specific rates of duty are up
to 90 U.S. cents per pair
AGOA 0%
GSP Not applicable
U.S. END MARKET ANALYSIS FOR FOOTWEAR FROM EAST AFRICA USAIDSOUTHERN AFRICA
Exporters from East Africa should examine categories which have high Most Favored Nation (MFN) import
tariffs, such as protective shoes, and examine how they can utilize AGOA duty-free benefits to be more
price competitive in the U.S. market, although there are several other competing tariff preference programs.
Exporters can look up the tariff rates on the USITC site https://hts.usitc.gov/
C. Import Regulations
All imports must comply with Consumer Product Safety Commission (CPSC) regulations through laws such
as the Consumer Product Safety Improvement Act of 2008 and the Federal Hazardous Substances Act.
Manufacturers may not infringe U.S. patent and trademark laws on intellectual property protection, US labor
laws, and health and safety legislation. This is described at greater length in the discussion on WRAP certifi-
cation in section (b) below.
Companies within this industry are subject to environmental and anti-dumping laws related to the discharge
of material waste of footwear inputs such as synthetic and leather made footwear.
Customs duties must be paid on imported materials. All importers must submit detailed manifests to US
customs 24 hours prior to the cargo leaving the country of origin.13
All footwear imported into the U.S. requires the following documents for clearance:
• Commercial Invoice
• Bill of Lading (Ocean Bill of Lading, Waybill, Cargo of Lading (Ocean Bill of Lading, Waybill, Cargo Receipt,
or Airwaybill)
• Packing List
In addition, standard commercial invoice requirements include the following: 23
• Must be written in English
• Invoice Date
• Name of Purchaser
• Name and address of Seller
• Name and address of actual factory. If the invoicing party is the factory, this must be clearly stated on the
invoice, for example “Factory is the invoicing party”
• Country of Origin
• Name of Buying Agent or Selling Agent
• Purchase Order Number(s), Department Number(s), Letter of Credit number (if applicable)
• Style Number from Purchase Order.
• Description of the style as detailed below under Additional Invoice Requirements
• Unit of Measure (number, pairs, dozens, etc.)
• Quantity shipped
• Net and Gross weight of the shipment
• Shipping Marks and carton count (per Corporate Logistics Routing Guide)
• Purchase price in the currency of the purchase with currency type specified. This must be shown either as
the FOB/Ex-Factory price OR a breakdown by cut-make-trim and fabric
• INCO Terms of Sale (FOB, CFR, etc.)
• All discounts, and reasons for the discounts
• All charges (packing, declaration fees, etc.)
• United States Port of Entry to which merchandise is destined
13.Source: IBIS World.
U.S. END MARKET ANALYSIS FOR FOOTWEAR FROM EAST AFRICA USAIDSOUTHERN AFRICA
Additional invoice requirements for footwear include:
• Style name/description
• Gender of wearer/Size breakdown on Invoice
D. Standards and Certifications
Buyers of imported footwear in the U.S. generally prefer that the producing factory has some social com-
pliance certification. The most commonly used standard for sewn products is the Worldwide Responsible
Accredited Production (WRAP) Certification, which provides for safe, lawful, humane, and ethical manu-
facturing. This includes several steps, including an application (made at a cost of $1,195), a pre-audit self-as-
sessment, monitoring against WRAP’s twelve principles, evaluation, and certification. Qualifying production
facilities will then be awarded WRAP certification at either the Platinum level (Platinum facilities have passed
every audit with no corrective actions or observations and maintained continuous certification with no
gaps between certification periods), Gold level (no issues and valid for12 months) or Silver (6 months, with
minor issues that need be addressed). More detailed information about WRAP can be found at http://www.
wrapcompliance.org/certification.
E. Packaging and Labeling
According to the U.S. Customs Service, footwear must be:
1. Marked in legible English;
2. Marked permanently and indelibly such as the nature of the article will permit; and
3. If the words United States, America, USA, or any city or state of the United States appears on the foot-
wear or shoe box, but is not the country of origin, the actual country of origin must appear in close prox-
24 imity to the locality name in lettering of comparable size preceded by the “Made in,” “Product of,” or similar
wording.
A textile label sewn on an inner seam or indelible ink stamp are accepted forms of marking. Both shoes in a
pair must be marked. If a textile label is used, it cannot be folded over so that the country of origin cannot
be seen easily.
All footwear must be listed in U.S. sizes. In addition to the number of pairs shipped in each size catego-
ry (listed above), the first cost of each size category must also be included. The percentage breakdown of
external surface area of the upper and outer sole and the type of leather used on upper are also required. If
the leather is “Patent Leather,” provide the thickness of synthetic lacquer (plastic) of coating or lamination. If
waterproof, provide documentation, and if sports footwear, provide sport for which it is designed.
VII. U.S. DISTRIBUTION
A. Supplier Selection
According to a recent survey of the fashion industry , supplier selection is generally based on three consid-
erations; 1) speed to market; 2) sourcing cost; and 3) risk of compliance. The same survey suggested that
sourcing costs are driven principally by labor costs. However, cost of raw materials and shipping costs fin-
ished second and third in the same survey; pointing to the importance of logistics costs in U.S. firm sourcing
decisions. In addition, 87.5 percent of firms suggested that ethical sourcing considerations are more import-
ant than they were five years ago; and that they focus on three primary considerations, including 1) treat-
ment of workers, 2) fire safety, and 3) building safety. These three items are covered in the assessment for
social compliance certification such as for WRAP.
14. “2017 Fashion Industry Fashion Industry Benchmarking Study,” U.S. Fashion Industry Association, July 2017.
U.S. END MARKET ANALYSIS FOR FOOTWEAR FROM EAST AFRICA USAIDSOUTHERN AFRICA
B. Distribution Channels
42.2% of all shoes are sold directly through retail outlets. Companies such as New Balance are vertically inte-
grated and sell through their own stores. Wholesalers, which sell to retailers, are the next-largest channel ac-
counting for about half (20.6%) the sales that retailers do. Interestingly, however, women’s footwear is dispro-
portionately sold through wholesale channels. Although women’s footwear represents only about one fifth of
the total market (see Figure 10, earlier) it represents over three-fifths of the wholesale market (see Figure 21).
Figure 21: U.S. Wholesale Market Segmentation by Revenues, 2020
25
C. Retail Channels
Retail stores continue to be the dominant channel to reach consumers, due to their ability to offer a su-
perior buying experience to the customer.15 Because consumers prioritize fit, size and quality when they
make footwear purchases, their overwhelming preference is to try on products before buying. As a result,
store-based retailing, which includes both apparel and footwear specialist retailers and sports goods stores,
continues to show strong growth (see Figure 22).
Figure 22: Shoe Store Sales in the U.S., 1992-2018
15. Allied Market Research, 2015.
U.S. END MARKET ANALYSIS FOR FOOTWEAR FROM EAST AFRICA USAIDSOUTHERN AFRICA
make footwear purchases, their overwhelming preference is to try on products before buying.16 As a result,
store-based retailing, which includes both apparel and footwear specialist retailers and sports goods stores,
continues to show strong growth (see Figure 22).
Figure 22: Shoe Store Sales in the U.S., 1992-2018
Figure 23: Share of U.S. Consumers Shopping at Shoe Retailers as of 2019
26
While most retail sales continue to be made through brick-and-mortar stores, small online retail outlets are
growing, which has enabled small online stores to provide footwear at a range of price points. Furthermore,
some of the larger (brand) retailers are starting to move more aggressively into the e-commerce space,
where growth in the U.S. has dominated online sales. For example, 41% of all sales at Nike.com were
generated in the U.S. in 2019.17
16. Euromonitor, 2018.
17. ecommerceDB.com, 2020
U.S. END MARKET ANALYSIS FOR FOOTWEAR FROM EAST AFRICA USAIDSOUTHERN AFRICA
VIII. SALES PROMOTION
A. KEY FOOTWEAR TRADE FAIRS
Key Footwear Trade Fairs, (2019 editions)
DATE TRADE FAIR DESCRIPTION LOCATION REMARK
February 4-7, 2019 Footwear Fast fashion Mandalay Bay Biannual event (February
Sourcing at footwear for men, Convention Centers, and August)
MAGIC * women, juniors and Las Vegas, Nevada,
children USA
February 5-7, 2019 FN Platform Fair for luxury to North Hall, Las
lifestyle branded Vegas Convention
footwear for men, Center, Las Vegas,
women, juniors and Nevada, USA
children
March 11-13, 2019 Transit: LA Exhibition for CMC Penthouse, Transit Footwear
Market Week fashion footwear 13th floor, B-Wing, Exhibition in Los Angeles
June 17-19, 2019 Los Angeles, takes place five times a
October 14-16, 2019 California, USA year
February 5-7, 2019 Fashion Footwear International shoe Warwick New York
Association of fair Hotel, New York,
June 4-6, 2019 New York New York, USA
August 6-8, 2019 (FFANY)
December 3-5, 2019
February 25-27, Coterie Links women’s Jacob Javits Centre, Another exhibition usually
2019 apparel, accessories New York, New held in August,
and footwear York, USA 27
designers with
retailers
February 27-28, The Materials Trade show for Portland, Oregon
2019 Show shoes and and Wilmington,
sportswear Massachusetts, USA
August 6-7, 2019
August 14-15, 2019
* Note that due to COVID-19 most of these trade shows have been cancelled or postponed. Footwear Sourcing
at MAGIC was delivered as an online trade event between September and December 2020.
B. Key Industry Associations
American Apparel and Footwear Association (AAFA)
AAFA was formed in August 2000 through the merger of the American Apparel Manufacturers Association
(AAMA) and Footwear Industries of America (FIA). AAFA advocates for the interest of the apparel and
footwear sector in the U.S., representing more than 1,000 world famous name brands, retailers and
manufacturers and is the public and political voice of the apparel and footwear industry from throughout the
United States and around the globe. AAFA works to ensure continued success and growth of the apparel
and footwear industry, its suppliers, and its customers. AAFA represents hundreds of clothing, footwear, and
sewn products companies and their suppliers and provides exclusive expertise in trade, brand protection,
and supply chain & manufacturing to help members navigate the complex regulatory environment and
lower costs. The Association provides members with several benefits including access to information and
exclusive insights on regulation and policy, and opportunities for networking and collaboration.
U.S. END MARKET ANALYSIS FOR FOOTWEAR FROM EAST AFRICA USAIDSOUTHERN AFRICA
Footwear Distributors and Retailers of America (FDRA)
Founded in 1944, FDRA serves the full footwear supply chain and boosts the bottom lines of its members
through innovative products, training and consulting on footwear design and development, sourcing and
compliance, trade and customs, advocacy, and consumer and sales trend analysis for retailers selling shoes
around the world. Members include the majority of U.S. footwear manufacturers, brands, retailers and
importers. In all, FDRA supports nearly 500 companies and brands worldwide, representing 90% of total U.S.
footwear sales. In 2020, FDRA took over management of the Fashion Footwear Association of New York
(FFANY).
United States Fashion Industry Association (USFIA)
The United States Fashion Industry Association (USFIA) represents brands, retailers, importers, and
wholesalers based in the United States and doing business globally. Founded in 1989, USFIA works to
eliminate tariff and non-tariff barriers that impede the fashion industry’s ability to trade freely and create
jobs in the United States. Headquartered in Washington, D.C., USFIA is the voice of the fashion industry in
front of the U.S. government as well as international governments and stakeholders. With constant, two-
way communication, USFIA seeks to stay ahead of current and future regulatory challenges. Through its
publications, educational events, and networking opportunities, USFIA also connects with key stakeholders
across the value chain including U.S. and international service providers, suppliers, and industry groups.
United States Footwear Manufacturers Association (USFMA)
United States Footwear Manufacturers Association (USFMA) is a nonprofit 501(c)(6) association founded
28 in 1986 to protect and enhance the footwear industry’s manufacturing base in the United States. USFMA
members include both domestic footwear manufacturers as well as domestic suppliers. As a whole, the
domestic footwear manufacturing industry employs more than 12,000 workers.
IX. Competition
A. Key Competitors
Competitors to East African footwear are numerous including the U.S. footwear manufacturing industry
which employs 12,000 workers. China remains the dominant producer of imported footwear in the U.S.,
accounting for nearly half of all U.S. imports. However, it has been losing market share to Vietnam (up from
16.1% in 2015 to 25.8% in 2020. This is probably due in part to natural diversification away from China, but
has probably also been spurred by increased tariffs (and/or the threat of increased tariffs) on Chinese-origin
products. Indonesia, meanwhile, has also picked up market share (from 5.3% to 6.2% over the same period),
although Vietnam remains the primary beneficiary due to its low labor and materials costs. Italy retains
a small share but on the basis of a very distinct market position; relying on its reputation for high quality
and strong brand recognition rather than low costs. Figure 24 shows the leading source countries for U.S.
footwear.
U.S. END MARKET ANALYSIS FOR FOOTWEAR FROM EAST AFRICA USAIDSOUTHERN AFRICA
Figure 24: U.S. Import Value of Footwear 2019, by Country of Origin
B. Critical Success Factors
As noted earlier in the report, sourcing decisions are made largely on the basis of three factors; speed to
market, sourcing cost, and risk of compliance. The following table was compiled by the U.S. Fashion Industry
Association in its 2017 report. It presents a rough idea of how the Sub-Saharan Africa region-AGOA
(SSA-AGOA) is viewed relative to other common sourcing alternatives. Five asterisks indicate performance
that is far above average; three asterisks average performance; and one asterisk performance well below
average.
29
SOURCING BASE SPEED TO MARKET SOURCING COST RISK OF COMPLIANCE
USA ***** ** ****
Mexico **** *** ***
CAFTA-DR **** *** ***
China *** **** ***
Vietnam *** **** ***
Cambodia ** **** **
Indonesia ** **** ***
Sri Lanka ** **** ***
India ** **** **
SSA - AGOA ** **** ***
Bangladesh ** ***** *
U.S. END MARKET ANALYSIS FOR FOOTWEAR FROM EAST AFRICA USAIDSOUTHERN AFRICA
C. Prospects categories offering maximum duty differential
against MFN imports and focus on those.
The East Africa footwear sector will continue Finally, niche footwear products using styles and
to face substantial competition from Asian materials unique to East Africa, with superior
producers, although U.S. domestic production workmanship, and timely delivery will enable
is unlikely to represent an imminent threat due East Africa to expand its exports in spite of
to its higher costs. The current trade tensions strong competition.
with China is probably helpful to East Asian
producers, as U.S. footwear firms are more likely
to diversify their production locations. The U.S. X. Bibliography
withdrawal from the Trans Pacific Partnership
(TPP) may benefit East African exporters, as “Footwear Market in the U.S.”, Statista, June
Vietnam was a signatory, and would have 2020.
presented even greater price competition to
30 East African exporters. “Footwear in the U.S.,” Euromonitor
International, March 2018.
As we can see from Table 5. above, the region
as a whole features competitive sourcing costs “Footwear Report”, Statista, July 2020.
and average compliance risk, but below average
speed to market. While this is partly a function “Market Analysis, Size, Share and Forecast
of the region’s distance from the U.S. market, 2018-2026,” Credence Research, October 2018.
it is also partly a function of sub-standard
logistics. Because the region’s speed to market “Shoe Manufacturing in the U.S. Industry
will always likely be lower than average due to Report”, IBIS World, March 2020.
its landlocked geography and distance from the
U.S. market, it will need to compensate through “Sourcing Snapshot: Global Footwear
lower sourcing costs and high reliability on Manufacturing and Trade,” Sourcing Journal,
compliance. Additionally, East African exporters August 2018.
will need to review and adjust their current
focus on leather footwear exports. These are “Sustainable Footwear Market Size, Share &
particularly prominent in Ethiopia, which is Trends Analysis Report By Type (Athletic, Non-
probably the regional country best-positioned athletic), By End User (Men, Women, Children),
to compete with Asian firms given its low labor By Region, And Segment Forecasts,
costs and access to local leather as raw material. 2020 – 2027”, Grandview Research, May 2020.
Other countries can seek to identify tariff
U.S. END MARKET ANALYSIS FOR FOOTWEAR FROM EAST AFRICA USAIDSOUTHERN AFRICA
31
U.S. END MARKET ANALYSIS FOR FOOTWEAR FROM EAST AFRICA USAIDSOUTHERN AFRICA
For more information,
contact:-
32 USAID TradeHub
East Africa Buy-In Activity
Email: EastAfricaTrade@dai.com
SOUTHERN AFRICA
U.S. END MARKET ANALYSIS FOR FOOTWEAR FROM EAST AFRICA USAIDYou can also read