Delivery of the VIVIT Peptide to Human Glioma Cells to Interfere with Calcineurin-NFAT Signaling
←
→
Page content transcription
If your browser does not render page correctly, please read the page content below
molecules
Article
Delivery of the VIVIT Peptide to Human Glioma Cells to
Interfere with Calcineurin-NFAT Signaling
Aleksandra Ellert-Miklaszewska * , Agata Szymczyk, Katarzyna Poleszak                                  and Bozena Kaminska *

                                          Laboratory of Molecular Neurobiology, Nencki Institute of Experimental Biology, Polish Academy of Sciences,
                                          02-093 Warsaw, Poland; agataszymczyk4@gmail.com (A.S.); k.poleszak@nencki.edu.pl (K.P.)
                                          * Correspondence: a.ellert@nencki.edu.pl (A.E.-M.); b.kaminska@nencki.edu.pl (B.K.)

                                          Abstract: The activation of NFAT (nuclear factor of activated T cells) transcription factors by calcium-
                                          dependent phosphatase calcineurin is a key step in controlling T cell activation and plays a vital
                                          role during carcinogenesis. NFATs are overexpressed in many cancers, including the most common
                                          primary brain tumor, gliomas. In the present study, we demonstrate the expression of NFATs and
                                          NFAT-driven transcription in several human glioma cells. We used a VIVIT peptide for interference
                                          in calcineurin binding to NFAT via a conserved PxIxIT motif. VIVIT was expressed as a fusion
                                          protein with a green fluorescent protein (VIVIT-GFP) or conjugated to cell-penetrating peptides
                                (CPP), Sim-2 or 11R. We analyzed the NFAT expression, phosphorylation, subcellular localization and
                                   their transcriptional activity in cells treated with peptides. Overexpression of VIVIT-GFP decreased
Citation: Ellert-Miklaszewska, A.;        the NFAT-driven activity and inhibited the transcription of endogenous NFAT-target genes. These
Szymczyk, A.; Poleszak, K.;               effects were not reproduced with synthetic peptides: Sim2-VIVIT did not show any activity, and
Kaminska, B. Delivery of the VIVIT        11R-VIVIT did not inhibit NFAT signaling in glioma cells. The presence of two calcineurin docking
Peptide to Human Glioma Cells to          sites in NFATc3 might require dual-specificity blocking peptides. The cell-penetrating peptides
Interfere with Calcineurin-NFAT           Sim-2 or 11R linked to VIVIT did not improve its action making it unsuitable for evaluating NFAT
Signaling. Molecules 2021, 26, 4785.
                                          dependent events in glioma cells with high expression of NFATc3.
https://doi.org/10.3390/
molecules26164785
                                          Keywords: NFAT proteins; calcineurin; interfering peptide; cell-penetrating peptide; glioma

Academic Editors: Joanna Bojarska,
Wojciech M. Wolf, Milan Remko,
Piotr Zielenkiewicz, Michele Saviano,
Janusz Zabrocki, Krzysztof
                                          1. Introduction
Kaczmarek and Jean-Marc Sabatier                Short interfering peptides offer one of the most specific tools to target protein–protein
                                          interactions for research and potential therapeutic purposes. A properly designed peptide
Received: 30 June 2021                    can mimic a particular binding motif and thereby precisely inhibit the interaction between
Accepted: 4 August 2021                   two protein partners. However, poor membrane permeability of hydrophilic peptides
Published: 7 August 2021                  prevents their spontaneous cell uptake and constitutes a severe limitation in the case of
                                          targeting intracellular signaling pathways. A promising solution to overcome this obstacle
Publisher’s Note: MDPI stays neutral      is the conjugation of an interfering peptide of interest with a cell-penetrating peptide (CPP),
with regard to jurisdictional claims in   which has the capacity to ubiquitously cross cellular membranes with very limited toxicity,
published maps and institutional affil-   via energy-dependent and/or independent mechanisms, and without the necessity of
iations.                                  recognition by specific receptors [1,2].
                                                The NFAT (nuclear factor of activated T cells) transcription factors play a key regula-
                                          tory role in the expression of genes coding for cytokines during activation and differenti-
                                          ation of T cells [3]. Pharmacological suppressors of NFAT signaling, such as tacrolimus
Copyright: © 2021 by the authors.         (FK506) and cyclosporin A (CsA), are widely used as immunosuppressive drugs in the treat-
Licensee MDPI, Basel, Switzerland.        ment of autoimmune diseases and transplant therapy. Four out of five NFAT family mem-
This article is an open access article    bers, namely NFATc1 (NFAT2), NFATc2 (NFAT1), NFATc3 (NFAT4/NFATx), and NFATc4
distributed under the terms and           (NFAT3), are activated by calcineurin, a calcium/calmodulin-dependent, serine/threonine-
conditions of the Creative Commons        protein phosphatase. Responding to increased intracellular calcium levels, calcineurin
Attribution (CC BY) license (https://
                                          docks to the regulatory domain of cytosolic NFAT and dephosphorylates multiple serine
creativecommons.org/licenses/by/
                                          residues, which leads to the exposure of a nuclear localization sequence (NLS) of NFAT
4.0/).

Molecules 2021, 26, 4785. https://doi.org/10.3390/molecules26164785                                       https://www.mdpi.com/journal/molecules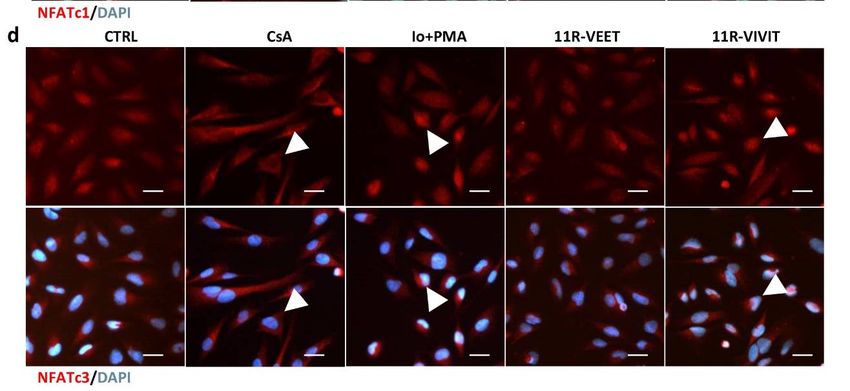
Molecules 2021, 26, 4785                                                                                          2 of 15

                           allowing its translocation to the nucleus and regulation of gene expression. Two binding
                           sites for calcineurin on NFAT have been mapped: the major docking site—a PxIxIT motif,
                           located near the N terminus of the regulatory region and an LxVP motif located near its C
                           terminus. Optimization of the PxIxIT motif through affinity-driven selection from combina-
                           torial peptide libraries led to the discovery of the VIVIT peptide (MAGPHPVIVITGPHEE),
                           which shows higher binding affinity to calcineurin than the native NFATc2 docking se-
                           quence, PRIEIT [4]. This synthetic peptide selectively competes with NFAT for binding
                           to calcineurin and prevents NFAT activation without affecting calcineurin phosphatase
                           activity towards other protein substrates [4,5]. Further development led to the design of
                           CPP-conjugated NFAT inhibitory peptides, which enabled translocation of the peptide
                           through cellular membranes. Sim-2-VIVIT, which contains the Sim-2-CPP from the human
                           Sim-2 transcription factor (AKAARQAARG), was used to inhibit T-cell activation and
                           alleviate allergic airway inflammation [6]. Noguchi et al. [7] modified the VIVIT peptide
                           at the N terminus with an 11-arginine transduction domain (11R) and a 3-glycine linker
                           sequence. A synthetic 11R-VIVIT peptide (RRRRRRRRRRR-GGG-MAGPHPVIVITGPHEE)
                           bearing polyarginine CPP could prevent the activation and proliferation of T cells both
                           in vitro and in vivo, provided immunosuppression in a murine islet xenograft model [7],
                           showed anti-inflammatory activity in lipopolysaccharide-stimulated macrophages and in
                           experimental colitis in mice [8]; ameliorated diabetic nephropathy and podocyte injury in
                           diabetic db/db mice [9]. Delivery of tat-VIVIT (with the HIV-1-derived peptide GRKKR-
                           RQRRRPQ) attenuated inflammatory reactions in the brain and deposition of amyloid Aβ
                           plaques in a murine model of Alzheimer’s disease [10].
                                 Besides their well-described role in the immune system, NFATs have a wide range
                           of functions in other organs of the body. They are involved in the regulation of genes
                           related to cell proliferation, differentiation, apoptosis, and angiogenesis, all of which may
                           be crucial to tumor development [11]. NFATs are overexpressed in many types of cancers
                           such as breast, pancreatic, lung, colorectal and hematological cancers [12]. Few studies,
                           including ours, have demonstrated the expression and activity of NFAT factors in rat and
                           human glioma cells [13–18]. The blocking of calcineurin/NFAT signaling using CsA led to
                           glioma cell apoptosis and treatment with either CsA or FK506 decreased growth of mouse
                           GL261 gliomas [19,20]. However, functions and transcriptional targets of NFAT proteins
                           in glioma cells remain largely unknown. FK506 and CsA bind to intracellular peptidyl
                           propyl isomerases (FKBP12 and cyclophilin A, respectively), and in such complexes inhibit
                           calcineurin. Both drugs not only block calcineurin activity but also hinder the function
                           of their endogenous targets, which limits their use as specific NFAT inhibitors. Therefore,
                           we explored if the VIVIT peptide could be a tool for selective interference into calcienurin-
                           driven activation of NFAT factors.
                                 In the present study, we evaluated the expression/activity of NFAT proteins in glioma
                           cells and the impact of inhibition of calcineurin/NFAT interaction by the VIVIT peptide.
                           The scheme of the peptide delivery routes and the expected mode of action is presented in
                           Figure S1. First, the VIVIT peptide was expressed as a fusion protein with a green fluores-
                           cent protein (GFP). Next, we compared the efficacy of two types of CPP, Sim-2 and 11R, in
                           delivering the VIVIT peptide across the cellular membrane of glioma cells. We analyzed
                           the phosphorylation and subcellular localization of NFATs, as well as their transcriptional
                           activity toward a reporter luciferase gene and endogenous NFAT target genes.

                           2. Results
                           2.1. Human Glioma Cells Show Different Profiles of NFAT Expression and Activity
                                 NFAT mRNA and protein levels were assessed in five established human glioma
                           cell lines LN229, U87, U251, T98 and LN18, a primary glioma cell culture (WG4), and in
                           normal human astrocytes (NHA). All glioma cell lines were derived from WHO grade III
                           and IV brain tumors. mRNA levels of all NFAT family members (NFATc1–NFATc4) were
                           evaluated by qPCR. All glioma cells showed high levels of NFATc3, while NFATc1 and
                           NFATc2 expression levels were variable among the cells (Figure 1a). There was statistically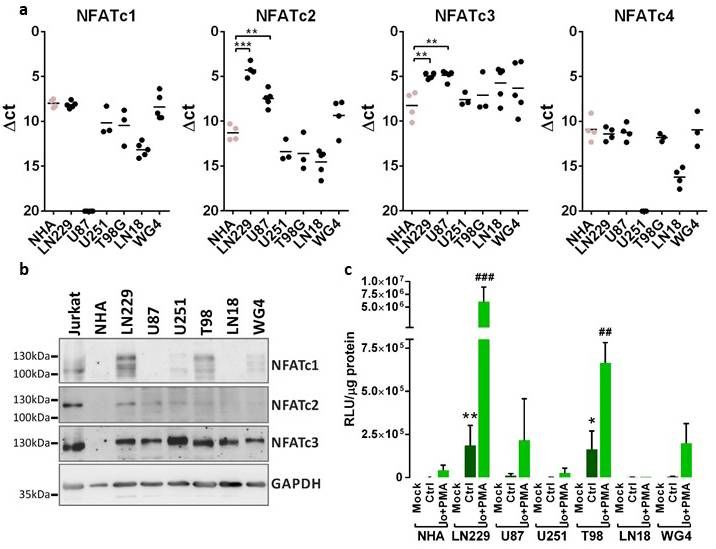
NFAT mRNA and protein levels were assessed in five established human glioma cell
lines LN229, U87, U251, T98 and LN18, a primary glioma cell culture (WG4), and in nor-
Molecules 2021, 26, 4785 mal human astrocytes (NHA). All glioma cell lines were derived from WHO grade III and 3 of 15
IV brain tumors. mRNA levels of all NFAT family members (NFATc1–NFATc4) were
evaluated by qPCR. All glioma cells showed high levels of NFATc3, while NFATc1 and
NFATc2 expression levels were variable among the cells (Figure 1a). There was statisti-
significant
cally upregulation
significant upregulationofofNFATc2
NFATc2and NFATc3ininLN229
and NFATc3 LN229 andand
U87U87
cellscells as compared to
as compared
to NHA.
NHA. Notably,NFATc1
Notably, NFATc1mRNA
mRNA was wasnot notdetected
detectedin U87 cells.
in U87 We found
cells. low expression
We found low expression of
of NFATc4
NFATc4 in tested
in tested cells
cells and
and dueduetotothis
thisobservation
observationthis
this factor
factor was
was omitted
omitted in in further
further studies.
studies. Western
Western blot analysis
blot analysis confirmed
confirmed the abundance
the abundance of NFATc3
of NFATc3 inin testedglioma
tested glioma cells.
cells. NFATc1
was elevated in LN229 and T98 cells, NFATc2 showed detectable levels onlyinin LN229
NFATc1 was elevated in LN229 and T98 cells, NFATc2 showed detectable levels only
LN229 cells, while faint expression was visible in U87 and U251 cells (Figure 1b). The
cells, while faint expression was visible in U87 and U251 cells (Figure 1b). The levels of all
levels of all NFAT factors were very low in NHA. Differences in the pattern of bands in
NFAT factors were very low in NHA. Differences in the pattern of bands in various cells
various cells on Western blots (especially NFATc1) result from altered electrophoretic mo-
on Western
bility of NFATsblots
due(especially NFATc1) result
to the phosphorylation from altered
of multiple serineelectrophoretic mobility of NFATs
residues in the regulatory
due to the phosphorylation
domain of NFATs. of multiple serine residues in the regulatory domain of NFATs.
Figure 1. NFAT expressionFigure and transcriptional activity across
1. NFAT expression glioma cell lines.activity
and transcriptional (a) Theacross
expression of NFAT
glioma mRNA
cell lines. (a)was
The expression of
analyzed by qPCR using TaqMan expression assays in established and primary (WG4) glioma cell cultures and in normal
NFAT mRNA was analyzed by qPCR using TaqMan expression assays in established and primary
human astrocytes (NHA). Results are presented as ∆Ct values (Ct of a target gene—Ct of a reference GAPDH gene). Indi-
(WG4) gliomacell
vidual samples from at least 3 independent cellpassages
cultures and
are in normal
plotted human
and a mean astrocytes
in each group is (NHA). Results
marked with are presented as ∆Ct
a horizontal
values
line. Statistical significance of (Ctvs.ofNHA
changes a target gene—Ct using
was determined of a reference GAPDH
one-way ANOVA gene).byIndividual
followed samples
post hoc Dunnett test from at least
for multiple comparisons. (b)3 Whole-cell
independentextracts
cellwere resolved
passages arebyplotted
SDS-PAGE andand subjected
a mean to immunoblot
in each group is analysis
markedusingwith a horizontal
Abs against NFATc1, NFATc2, line.NFATc3 and significance
Statistical GAPDH. Cellular extractsvs.
of changes from human
NHA wasacute T-line lymphoblastic
determined using one-wayleukemia
ANOVA followed
Jurkat cells served as a positive control in the determination of NFAT protein levels. (c) Glioma cells were transfected with
by post hoc Dunnett test for multiple comparisons. (b) Whole-cell extracts were resolved by SDS-
a construct carrying a gene encoding luciferase under the NFAT-responsive promoter. The cells were left untreated or
were stimulated with 1 µMPAGE and (Io),
ionomycin subjected to ionophore
a calcium immunoblot and analysis using Abs against NFATc1,(PMA),
50 nM phorbol-12-myristate-13-acetate NFATc2,an NFATc3 and
activator of protein kinase C. Luciferase
GAPDH. activityextracts
Cellular was analyzed
from 24 h post-transfection.
human Bars represent means
acute T-line lymphoblastic ± SD Jurkat
leukemia from at cells served as
least 3 experiments carriedaout in duplicates.
positive controlStatistical significance of of
in the determination changes
NFATvs. NHA levels.
protein was determined
(c) Glioma using t-test.
cells were transfected
Statistical significance is indicated as follows: * p < 0.05, ** p < 0.01, *** p < 0.001 vs. NHA Ctrl or # p < 0.05, ## p < 0.01, ### p <
with a construct carrying a gene encoding luciferase under the NFAT-responsive promoter. The cells
0.001 vs. NHA Io + PMA.
were left untreated or were stimulated with 1 µM ionomycin (Io), a calcium ionophore and 50 nM
phorbol-12-myristate-13-acetate (PMA), an activator of protein kinase C. Luciferase activity was
analyzed 24 h post-transfection. Bars represent means ± SD from at least 3 experiments carried out
in duplicates. Statistical significance of changes vs. NHA was determined using t-test. Statistical
significance is indicated as follows: * p < 0.05, ** p < 0.01, *** p < 0.001 vs. NHA Ctrl or ## p < 0.01,
### p < 0.001 vs. NHA Io + PMA.
In order to assess the transcriptional activity of NFAT factors, NHA and the glioma
cells were transiently transfected with the pGL3-3xNFAT-luc plasmid, in which the reporter
gene encoding luciferase is under the control of an NFAT-responsive promoter. This
promoter contains a fragment of the IL-2 gene promoter with 3 binding sites for NFAT
proteins. The highest luciferase activity was detected in LN229 cells, which was in line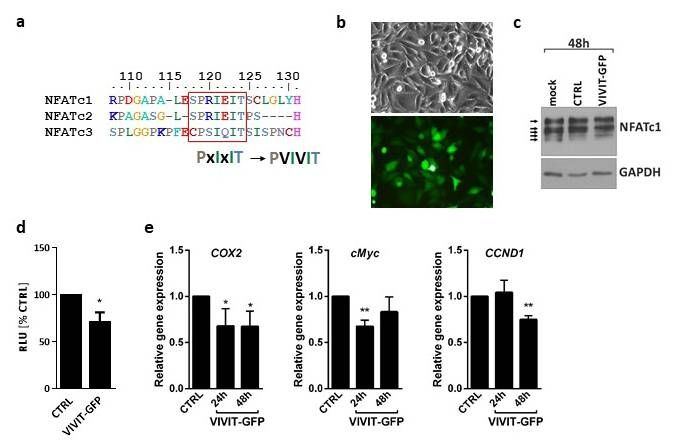
Molecules 2021, 26, 4785                                                                                         4 of 15

                           with the abundance of all NFAT factors in these cells. U251 and LN18 cells, similarly to
                           NHA, showed a low luciferase activity suggesting negligible NFAT signaling (Figure 1c).
                           Since the basic activity of NFAT proteins in glioma cells may be relatively low, the cells
                           were treated with a combination of 1 µM ionomycin (Io, a calcium ionophore) and 50 nM
                           phorbol 12-myristate 13-acetate (PMA, an activator of protein kinase C). This resulted
                           in an increase in intracellular calcium levels and activation of calcineurin, which led to
                           increased activity of NFAT transcription factors and augmented luciferase activity. This
                           also confirmed the specificity of the promoter activation by factors that are dependent on
                           the calcium level in the cell. Based on these results we selected LN229, T98 and U87 cells
                           for further experiments due to the highest expression and activity of NFATs in these cells.

                           2.2. VIVIT-GFP Blocks Transcriptional Activity of NFAT Factors
                                 Activation of all NFATs, including NFATc3, can be blocked by the VIVIT peptide
                           (MAGPHPVIVITGPHEE) [4]. This is due to a high sequence similarity in the major
                           calcineurin binding motif, PxIxIT, shared by NFATc1–c3 (Figure 2a). In order to check if the
                           VIVIT is active in glioma cells, we first overexpressed the VIVIT fused to GFP in LN229
                           cells using a construct coding for VIVIT-GFP. The efficacy of transfection reached over
                           70% and the cell viability was not affected (Figure 2b). In contrast to the mock-transfected
                           cells and the cells transfected with a GFP-coding construct (CTRL, pEGFP-N1 vector),
                           the cells overexpressing VIVIT-GFP showed an altered pattern of bands corresponding
                           to NFATc1 as detected by Western blotting. A shift towards higher molecular weights
                           suggested an appearance of highly phosphorylated, inactive NFATc1 (Figure 2c). Luciferase
                           reporter assay using the pGL3-3xNFAT-luc plasmid showed that the overexpression of
                           VIVIT-GFP in LN229 cells reduced the NFAT-dependent luciferase activity as compared
                           to the cells transfected with CTRL construct (Figure 2d). Moreover, the cells transfected
                           with VIVIT-GFP showed lower mRNA levels of the known endogenous NFAT-target genes,
                           such as COX2, c-MYC and CCND1, relative to CTRL cells (Figure 2e).

                           2.3. Sim-2–Conjugated VIVIT Peptides Are Not Active in Glioma Cells
                                 Next, we sought to determine whether the exogenous VIVIT peptides are capable of
                           interfering with NFAT-calcineurin binding. To improve cell penetration, we used Sim2-
                           CPP-modified peptides. LN229 and T98G cells were treated with 500 µM of one of the
                           peptides: (i) Sim2-VIVIT, which contains the VIVIT and cell-penetrating Sim2 peptides;
                           (ii) Sim2-VEET, which contains the same amino acid residues as the VIVIT but the last
                           12 amino acids were scrambled and the cell-penetrating Sim2 sequence, and (iii) VIVIT
                           alone (Figure S1). The peptides did not show any effect on cell morphology and viability
                           of LN229 and T98G cells, even at a very high concentration of 500 µM (not shown). As
                           an additional control, the cells were treated with CsA, known to inhibit the calcineurin-
                           dependent NFAT dephosphorylation. In both cell lines, CsA retarded the gel mobility
                           of NFATc1 as a result of the accumulation of the hyperphosphorylated forms of NFATc1
                           (Figure 3a) and decreased luciferase activity in cells transfected with the pGL3-3xNFAT-luc
                           plasmid (Figure 3b). None of the peptides mimicked the action of CsA on the pattern of
                           NFATc1 bands in the Western blotting and did not affect the activity of NFAT-responsive
                           promoter in the luciferase reporter assay (Figure 3a,b).
Molecules 2021, 26, 4785
Molecules 2021, 26, x FOR PEER REVIEW 5 of 155 of 16
Figure 2. Overexpression of VIVIT-GFP blocks
Figure 2. Overexpression NFAT activity
of VIVIT-GFP in glioma
blocks NFATcells. (a) Sequences
activity in glioma of calcineurin docking siteof
cells. (a) Sequences in
NFATc1, NFATc2 and NFATc3
calcineurin dockingandsiteVIVIT. (b) Microphotographs
in NFATc1, NFATc2 and NFATc3 of LN229
andcells 48 h(b)
VIVIT. after transfection with VIVIT-GFP
Microphotographs of LN229
construct in phase-contrast and fluorescence microscope (upper/lower panel, respectively). (c) Western blot analysis of
cells 48 h after transfection with VIVIT-GFP construct in phase-contrast and fluorescence microscope
NFATc1 levels in mock transfected LN229 cells and in cells transfected with a control vector (CTRL) or VIVIT-GFP.
(upper/lower
GAPDH detection was usedpanel, respectively).
as a loading (c) Western
control. (d,e) Changesblot analysis
in the of NFATc1
transcriptional levels
activity in mock
of NFAT transfected
factors in VIVIT-
GFP-transfected
LN229 cells. Transcriptional
cells activity of NFAT
and in cells transfected with proteins
a controlwas analyzed
vector by luciferase
(CTRL) reporter
or VIVIT-GFP. assay using
GAPDH pGL3-
detection
3xNFAT-luc plasmid
was used (d)as or by qPCR control.
a loading (e) to measure
(d,e) mRNA
Changeslevels of endogenous
in the NFATactivity
transcriptional target genes at indicated
of NFAT factorstime
in
points. Statistical significance of changes vs. CTRL was determined using one sample t-test (* p < 0.05, ** p < 0.01 ).
VIVIT-GFP-transfected cells. Transcriptional activity of NFAT proteins was analyzed by luciferase
reporter assay 2.3.
Molecules 2021, 26, x FOR PEER REVIEW using pGL3-3xNFAT-luc
Sim-2–Conjugated VIVITplasmid
Peptides(d)
AreorNot
by Active
qPCRin (e)Glioma
to measure
Cells mRNA levels of
6 of 16
endogenous NFAT target genes at indicated time points. Statistical significance of changes vs. CTRL
Next, we sought to determine whether the exogenous VIVIT peptides are capable of
was determined using onewith
interfering sample t-test (* p < 0.05,binding.
NFAT-calcineurin ** p < 0.01
To).improve cell penetration, we used Sim2-
CPP-modified peptides. LN229 and T98G cells were treated with 500 µM of one of the
peptides: (i) Sim2-VIVIT, which contains the VIVIT and cell-penetrating Sim2 peptides;
(ii) Sim2-VEET, which contains the same amino acid residues as the VIVIT but the last 12
amino acids were scrambled and the cell-penetrating Sim2 sequence, and (iii) VIVIT alone
(Figure S1). The peptides did not show any effect on cell morphology and viability of
LN229 and T98G cells, even at a very high concentration of 500 µM (not shown). As an
additional control, the cells were treated with CsA, known to inhibit the calcineurin-de-
pendent NFAT dephosphorylation. In both cell lines, CsA retarded the gel mobility of
NFATc1 as a result of the accumulation of the hyperphosphorylated forms of NFATc1
(Figure 3a) and decreased luciferase activity in cells transfected with the pGL3-3xNFAT-
luc plasmid (Figure 3b). None of the peptides mimicked the action of CsA on the pattern
of NFATc1 bands in the Western blotting and did not affect the activity of NFAT-respon-
sive promoter in the luciferase reporter assay (Figure 3a,b).
Figure3.
Figure Sim2-VIVIT does
3. Sim2-VIVIT does not
not interfere
interferewithwithNFAT
NFATsignaling
signalingininglioma
glioma cells. (a)(a)
cells. Western
Western blot analysis
blot
of NFATc1
analysis levels in LN229
of NFATc1 cells
levels in treated
LN229 cellsfor 24 h and
treated for 48
24 hh with
and 48thehpeptides
with the at the finalatconcentration
peptides the final
of 500 µM. GAPDH
concentration detection
of 500 µM. GAPDH wasdetection
used as awasloading
usedcontrol. (b) Measurement
as a loading of NFAT-dependent
control. (b) Measurement of
NFAT-dependent
promoter activitypromoter activity reporter
using luciferase using luciferase
assay inreporter
LN229 assay
and T98 in LN229 and T98 cells
cells transfected trans-
with pGL3-
fected with pGL3-3xNFAT-luc
3xNFAT-luc plasmid 6 h prior toplasmid 6 h prior
treatments withto500
treatments
µM of each with 500 µM
peptide orof each
with peptide
CsA or
(at 5 µg/mL
with CsA (at
in LN229 and5 µg/mL
1 µg/mL in LN229 and 1 for
in T98 cells) µg/mL18 hin T98 cells)the
following fortransfection.
18 h following the transfection.
Statistical significanceSta- of
tistical significance of changes vs. untreated cells (UNT) was determined
changes vs. untreated cells (UNT) was determined using one sample t-test (** p < 0.01). using one sample t-test
(** p < 0.01).
2.4. Interfering Peptide Linked to Oligoarginine CPP Affects Calcineurin/NFAT Pathway
As Sim2-conjugated peptides were not effective, we used the oligoarginine (11R) se-
quence as a CPP, linked to a VIVIT peptide (11R-VIVIT) or a control VEET peptide (11R-Molecules 2021, 26, 4785 6 of 15
2.4. Interfering Peptide Linked to Oligoarginine CPP Affects Calcineurin/NFAT Pathway
As Sim2-conjugated peptides were not effective, we used the oligoarginine (11R)
sequence as a CPP, linked to a VIVIT peptide (11R-VIVIT) or a control VEET peptide
(11R-VEET) (Figure S1). During the initial screen using a peptide in a wide range of
concentrations, 11R-VIVIT showed cytotoxicity in LN229 cells at and above 50 µM (not
shown). To avoid harmful effects on cell viability, we treated the cells with the peptides
at lower concentrations. The impact of the peptides on NFAT activity was first assessed
using the luciferase reporter assay. The cells were pre-treated for 1 h with 2–20 µM
11R-VIVIT or a control 11R-VEET peptide before transfection with the pGL3-3xNFAT-
luc plasmid. Unexpectedly, 11R-VIVIT at 10 µM and to a much greater extent at 20 µM
caused activation of the NFAT-responsive promoter producing a significant increase in the
luciferase activity as compared to untreated or 11R-VEET-treated cells (Figure 4a). Cell
proliferation measured by BrdU incorporation assay was not affected by any of the peptides
at those concentrations (Figure 4b). A similar set of experiments was repeated on U87 cells,
which lack the expression of NFATc1. We found the upregulated luciferase activity upon
20 µM 11R-VIVIT as compared to untreated or 11R-VEET-treated cells but the increase
was not statistically significant (Figure 4c). The proliferation of U87 cells was also not
affected by the peptides (Figure 4d). Interestingly, in both LN229 and U87 cells, 11R-VIVIT
upregulated the mRNA levels of two out of three tested endogenous NFAT-target genes,
namely COX2 and c-MYC, relative to untreated or 11R-VEET-treated cells. The increases in
the gene expression were higher in LN229 than in U87 cells (Figure 4e,f).
We also checked whether the 11R-VIVIT treatment affected the NFAT mRNA levels
that could explain the observed increase in NFAT signaling in LN229 cells. 11R-VIVIT
upregulated NFATc1 expression in a dose-dependent manner and, to a lesser extent, modu-
lated NFATc2 mRNA levels (Figure S2).
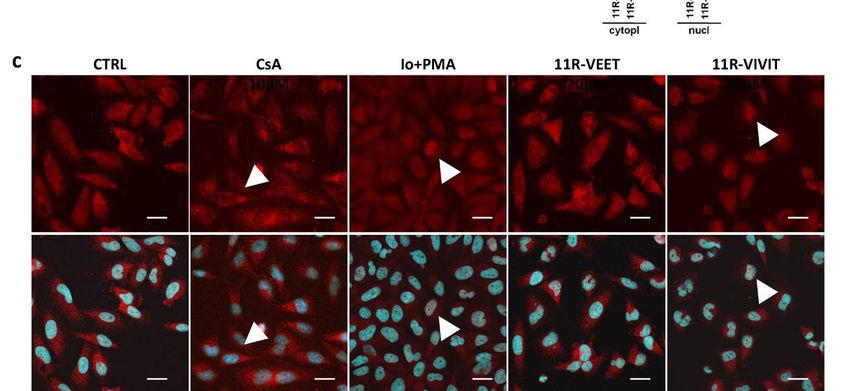
2.5. 11R-VIVIT Triggers Translocation of NFAT to the Nucleus
NFAT proteins upon dephosphorylation and activation change their intracellular
localization. Blocking the interactions between calcineurin and NFAT using an inter-
fering peptide should keep the phosphorylated factor in the cytoplasm and prevent its
translocation to the nucleus. To investigate the effect of the 11R-VIVIT peptide on the
intracellular localization of NFATs in glioma cells, LN229 and U87 cells were treated with
20 µM 11R-VIVIT or the control 11R-VEET peptide for 4 h and NFAT levels were evaluated
in cytoplasmic and nuclear fractions using Western blotting (Figure 5a, Figure S3). CsA
(5 µg/mL), which blocks calcineurin activity, leaves NFAT proteins inactive and in the
cytoplasm. Cells treated with CsA constitute a reference control. Detection of GAPDH and
Lamin B was used to assess the purity of the cytoplasmic and nuclear fractions, respectively,
and to ensure loading of equal amounts of proteins. The levels of NFATc1–c3 decreased
in the cytoplasmic fraction 4 h following administration of 11R-VIVIT in LN229 cells,
which was accompanied by an increase in their levels in the nuclear fraction (Figure 5a,b).
11R-VEET-treated cells showed similar levels of NFATc1–c3 in both cellular fractions as
the untreated cells. NFATc1 is undetectable in U87 cells, and low levels of NFATc2 in
U87 cells hindered the detection of this protein after cellular fractionation. However, the
accumulation of NFATc3 in the nuclear fraction of 11R-VIVIT-treated U87 cells is clearly
visible (Figure S3). In both cell lines, CsA treatment resulted in a reduction in NFAT levels
in the nuclear fraction, in accordance with its known mechanism of action.Molecules 2021, 26, x FOR PEER REVIEW
Molecules 2021, 26, 4785 7 of 15
Figure 4. The effect of 11R-VIVIT on NFAT activity and proliferation of glioma cells. NFAT-dependent
Figure
promoter 4.activity
The effect
was of 11R-VIVIT
measured usingon NFAT reporter
luciferase activityassay
and proliferation
in LN229 (a) andof U87
glioma cells. NFAT
(c) cells
pendent
transfectedpromoter activity was plasmid
with pGL3-3xNFAT-luc measured andusing
treatedluciferase reporter
for 25 h with assayatinindicated
the peptide LN229 (a) and
cells transfected
concentrations with pGL3-3xNFAT-luc
(including 1 h pre-treatment priorplasmid and treated
to transfection). for 25 means
Bars represent h with± the peptide at i
SD from
cated
at leastconcentrations (including
3 experiments carried 1 h pre-treatment
out in duplicates. Statisticalprior to transfection).
significance Bars
of changes vs. represent mea
untreated
from at least
cells (UNT) 3 experiments carried
or 11R-VEET-treated cells wasout in duplicates.
determined Statistical
using one-way ANOVAsignificance
followed by ofTukey
changes vs.
post-hoc test for multiple comparisons (* p < 0.05 vs. UNT, # p < 0.05 vs. 11R-VEET).
treated cells (UNT) or 11R-VEET-treated cells was determined using one-way ANOVA fol The proliferation
of LN229
by Tukey(b)post-hoc
and U87 (d)
testcells
forwas evaluated
multiple after 48 h treatment
comparisons (* p < with
0.05 the
vs.peptides
UNT, #atpthe indicated
< 0.05 vs. 11R-VEE
concentrations. mRNA levels of endogenous NFAT target genes were
proliferation of LN229 (b) and U87 (d) cells was evaluated after 48 h treatment analyzed by qPCR in LN229
with the pe
(e) and U87 (f) cells after 6 h of treatment. Statistical significance of changes vs. untreated cells (UNT)
at the indicated concentrations. mRNA levels of endogenous NFAT target genes were anal
was determined using one sample t-test (* p < 0.05).
qPCR in LN229 (e) and U87 (f) cells after 6 h of treatment. Statistical significance of change
untreated cells (UNT) was determined using one sample t-test (* p < 0.05).
We also checked whether the 11R-VIVIT treatment affected the NFAT mRNA
that could explain the observed increase in NFAT signaling in LN229 cells. 11RMolecules 2021, 26, 4785 Molecules 2021, 26, x FOR PEER REVIEW 8 of 15 9 of 16
FigureFigure
5. 11R-VIVIT enhancesenhances
5. 11R-VIVIT NFAT translocation to the nucleus.
NFAT translocation (a) Distribution
to the nucleus. (a)ofDistribution
NFATc1–c3 in ofcytosolic
NFATc1–c3 and nuclear
in
fractions was evaluated using Western blotting 4 h after treatment of LN229 cells with 11R-VIVIT (20 µM), 11R-VEET (20
cytosolic and nuclear fractions was evaluated using Western blotting 4 h after treatment of LN229
µM) or CsA (5 µg/mL). (b) The graphs show the relative intensity of the bands on immunoblots as compared to the control
(UNT).cells
Thewith
levels11R-VIVIT
were based(20
on µM), 11R-VEET (20
the densitometric µM) or and
evaluation CsAnormalized
(5 µg/mL).to(b) The graphs
GAPDH or Laminshow the relative
B levels for cytosolic
intensity
or nuclear of the
fractions, bands on(the
respectively immunoblots
mean +/− SD asofcompared to the control
three independent (UNT). Statistical
experiments). The levels were based
significance on
of changes
was determined using one-sample
the densitometric evaluationt-testand
(* pnormalized
< 0.05), (c,d) Subcellular
to GAPDHlocalization
or Lamin ofB NFATc1 (c)cytosolic
levels for and NFATc3 (d) in LN229
or nuclear
cells 4fractions,
h after treatment with 11R-VIVIT,
respectively (the mean11R-VEET
+/− SD of (both at 20
three µM), 1 µM Io/50
independent nM PMA or
experiments). CsA (5 µg/mL).
Statistical A scale bar
significance
corresponds to 25 µm.
of changes was determined using one-sample t-test (* p < 0.05), (c,d) Subcellular localization of
NFATc1 (c) and NFATc3 (d) in LN229 cells 4 h after treatment with 11R-VIVIT, 11R-VEET (both at 20
µM), 1 µM Io/50 nM PMA or CsA (5 µg/mL). A scale bar corresponds to 25 µm.
Moreover, the effect of 11R-VIVIT on the intracellular localization of NFAT proteins
was evaluated using immunocytochemical staining for NFATc1 and NFATc3, the mostMolecules 2021, 26, 4785 9 of 15
abundant NFATs in LN229 cells (Figure 5c,d). Two additional treatments were included:
cells were treated with 5 µg/mL CsA (to inhibit the NFAT activity) or cells were stimulated
with 1 µM Io and 50 nM PMA (these compounds activate NFAT). CsA blocked the dephos-
phorylation of NFATs preventing their translocation to the nucleus and thus most of the
staining was detected in the cytoplasm. On the other hand, the action of calcineurin-NFAT
pathway activators, Io and PMA, caused the accumulation of NFAT factors in the cell nuclei.
The cells treated with the control peptide 11R-VEET showed a similar staining pattern as
the untreated cells (CTRL). 11R-VIVIT induced translocation of NFATc1 and NFATc3 to the
cell nucleus.
3. Discussion
Since our first demonstration of the transcription factors NFAT expression and impor-
tance of calcienurin/NFAT pathway in rat glioma cells [13], several other reports confirmed
the presence of calcineurin-dependent NFAT proteins in human glioma cells but processes
regulated by these factors have not been fully understood [14–17]. In the present study,
we demonstrate the expression of NFAT mRNAs and proteins in several human glioma
cells and their lack in normal human astrocytes. To understand NFAT functions in glioma
cells we evaluated the effects of the VIVIT peptide, which was designed as a high-affinity
competitor for NFAT binding to calcineurin [4].
Both quantifications of NFAT expression by qPCR and Western blotting showed
that NFATc3 is the most abundantly expressed member of this family in human glioma
cells. LN229 glioma cells expressed all NFAT factors and presented the highest NFAT-
dependent transcriptional activity. Studies by Wang and co-authors demonstrated the
expression of NFATc1 in U251 glioblastoma cells and linked it to increased invasiveness
and migration of cancer cells. NFATc1 acted via activation of COX-2 expression, which is
an inducer of invasion and migration in many cancer cells [15]. Moreover, NFATc1 was
found constitutionally active in human glioblastoma samples [15]. Microarray analysis
demonstrated that NFATc2 was overexpressed in glioblastoma when compared to low-
grade gliomas, and the expression of the NFATc2 protein in U87 and U251 glioblastoma
cells has been linked to their increased invasiveness [14]. NFATc3 was the predominant
factor detected in U251 cells and a collection of primary human glioblastoma cell lines [16],
which corroborates our results. Knockdown of NFATc3 affected proliferation and migration
of glioma cells in vitro and orthotropic tumor growth in mice [16].
Calcineurin inhibitors, such as tacrolimus (FK506) and CsA, which prevent activation
of NFAT and NFAT-driven expression of immune response genes, have revolutionized
transplant therapy. However, their molecular targets go beyond inhibition of NFAT sig-
naling and their use is associated with adverse effects including progressive loss of renal
function, cardio- and neurotoxicity, and increased risk of malignancy. Compounds that in-
terfere selectively with the calcineurin-NFAT interaction without affecting its phosphatase
activity may be useful as therapeutic agents that are less toxic than current drugs. We
employed the VIVIT peptide [4], which competes with NFAT at calcineurin docking site.
Our results show that forced expression of the construct encoding the VIVIT-GFP peptide
prevents the binding of NFATs to calcineurin and their subsequent dephosphorylation, re-
sulting in the reduced activity of the NFAT-driven promoter and inhibition of transcription
of endogenous NFAT target genes.
To deliver VIVIT to glioma cells, we used a Sim2 peptide, as the Sim2-conjugated VIVIT
showed the inhibitory activity on NFAT signaling in other cells [6]. However, we failed to
detect any effect of the Sim2-VIVIT on NFAT signaling in LN229 and T98 glioma cells. The
pattern of NFATc1 bands detected by immunoblotting and the NFAT-dependent luciferase
activity in the cells treated with Sim2-VIVIT were similar to those in untreated controls and
in cells treated with the VIVIT peptide alone (without CPP, unable to enter the cell) or the
scrambled Sim2-VEET peptide. Next, we tested the previously described 11R-VIVIT and
11R-VEET peptides [7]. Unexpectedly, 11R-VIVIT upregulated the transcriptional activity
of the NFAT-driven luciferase promoter, as well as the expression of NFAT-regulatedMolecules 2021, 26, 4785 10 of 15
genes, such as COX2 and cMYC. Moreover, 11R-VIVIT-treated cells showed increased
expression of NFATc1 and NFATc2 genes. Although the elevated levels of these transcripts
could explain to some extent the observed activation of NFAT signaling, posttranslational
modifications affecting an intracellular localization of NFAT are the essential regulators
of NFAT activity. We found that 11R-VIVIT, but not the scrambled peptide 11R-VEET,
triggered a decrease in NFATc1-c3 in the cytoplasm and their increase in the nuclear fraction.
We corroborated Western blot results by immunocytochemistry and demonstrated a nuclear
import of NFAT factors upon 11R-VIVIT treatment. Thus, the response of glioma cells to
11R-VIVIT resembled the stimulatory effect of Io/PMA rather than the inhibitory action
of CsA on NFAT signaling. Therefore, 11R-VIVIT is not suitable for inhibition of NFAT
signaling and evaluating NFAT targets in glioma cells.
In the original study on the VIVIT peptide, Aramburu and co-authors demonstrated
a blocking activity of VIVIT against NFATc1, NFATc2 and NFATc3 proteins [4]. However,
these experiments were carried out on cell lysates after overexpression of each NFAT
protein. The inhibitory efficacy of the extracellular 11R-VIVIT peptide has been tested in
immune cells, where NFATc2 accounted for 90% of the NFAT transcriptional activity [7].
Other researchers effectively blocked NFAT proteins using the VIVIT peptide in endothelial
cells and vascular smooth muscle cells [21], in which NFATc2 and NFATc1 predominate.
Noteworthy, the calcineurin docking site of NFATc3 within the PxIxIT motif (CPSIQIT)
varies from the sequence shared by NFATc1 and NFATc2 (SPRIEIT). This could contribute
to different effects of 11R-VIVIT in glioma cells, which express mainly NFATc3. More-
over, apart from a PxIxIT motif localized to N-terminus, the C-terminus of NFAT contains
another consensus motif, LxVP, that facilitates calcineurin docking and NFAT dephos-
phorylation [22]. Interestingly, calcineurin exhibits a high affinity toward the LxVP motif
of NFATc1, c3, and c4, but a weak binding strength for NFATc2. Unlike in the immune
cells with dominant expression of NFATc2, NFATc3 in glioma cells could still interact with
calcineurin through an alternative binding site and remain activated despite blocking of
the PxIxIT docking site by 11R-VIVIT. An engagement of this additional binding site in
calcineurin-NFAT interaction may also explain the observed differences in the responses of
glioma cells to 11R-VIVIT peptide and VIVIT-GFP. GFP fused to VIVIT may be a spherical
obstacle, blocking the binding of calcineurin to LxVP and leading to decreased activation
of NFAT. Recently, Wang et al. [23] designed a bioactive peptide against two sites of cal-
cineurin/NFAT interaction, targeting both PxIxIT and LxVP motifs. It would be worth
checking whether a blockade of both docking sites might result in an inhibition of NFAT
activity in glioma cells. However, a synthetic LxVP peptide blocks not only calcineurin–
NFAT interaction, but also calcineurin phosphatase activity [22], which compromises a
peptide specificity.
Polyarginine oligopeptides have been developed to deliver bioactive peptides and
proteins into eukaryotic cells and have been shown to exhibit greater efficiency than
other CPPs [24]. Yet, efficient entry of nona-arginine (9R) cell-penetrating peptides into
adherent cells at 10–20 µM has been recently linked with a transient increase in intracellular
calcium [25]. NFAT activity depends on calcium-regulated phosphatase calcineurin. The
observed upregulation of NFAT signaling following administration of 11R-VIVIT, a peptide
with an oligoarginine CPP, might result from increased calcium levels. However, a lack
of such a response of glioma cells treated with 11R-VEET, which contain the same CPP
sequence and the same set of amino acid residues (just in a scrambled order), excludes this
possibility. Noguchi et al. [26] reported that 11R-VIVIT at concentrations > 10 µM affects
the viability of βTC6 cells (a β-cell line) in a manner dependent on the VIVIT sequence,
not the 11R sequence. Based on the minimal sequence of the regulators of calcineurin
(RCAN), responsible for the inhibition of calcineurin-NFAT signaling, they developed the
RCAN1-11R peptide and showed that RCAN1-11R binds to calcineurin with high affinity
and selectively interferes with the calcineurin/NFAT interaction without affecting cell
viability [26]. The use of such peptide inhibitors could be an alternative for 11R-VIVIT in
glioma cells.Molecules 2021, 26, 4785 11 of 15
4. Materials and Methods
4.1. Materials
VIVIT peptide (MAGPHPVIVITGPHEE), Sim-2-VIVIT (AKAARQAARG-MAGPHPVI
VITGPHEE), Sim-2-VEET (AKAARQAARG-MAGPPHIVEETGPHVI), 11R-VIVIT pep-
tide (RRRRRRRRRRR-GGG-MAGPHPVIVITGPHEE), 11R-VEET (RRRRRRRRRRR-GGG-
MAGPPHIVEETGPHVI) were synthetized by GeneScript. The peptides were purified
by HPLC with >95% purity and were provided as hydrochloric salts. Anti-NFATc1 and
anti-NFATc2 antibodies were from Thermo Scientific, anti-NFATc3 was from Cell Signaling
Technology (Beverly, MA, USA), and anti-Lamin B (C-5) antibodies were from Santa Cruz
Biotechnology, anti-GAPDH was from EMD Millipore (Burlington, MA, USA). Lipofec-
tamine 2000 was from Invitrogen (Carlsbad, CA, USA). Nitrocellulose membrane and
enhanced chemiluminescence detection system (ECL) were from Amersham Pharmacia
Biotech. All other reagents were purchased from Sigma Aldrich (Saint Louis, MO, USA).
4.2. Cell Culture and Treatments
The established human glioma cell lines: T98G and LN18 (derived from glioblas-
tomas, WHO grade IV), LN229, U251MG and U87MG (derived from astrocytomas WHO
grade III) were from ATCC. Patient-derived glioma cell cultures WG4 (WHO grade IV)
were developed as previously described [27]. Cells were grown in Dulbecco’s Modified
Eagle’s Medium supplemented with 10% FBS (fetal bovine serum, Gibco, Paisley, UK)
and antibiotics (50 U/mL penicillin, 50 µg/mL streptomycin) under standard conditions.
Normal human astrocytes (NHA, Lonza, Basel, Switzerland) were cultured in Clonet-
ics™/Poietics™ media and reagents. All peptides were dissolved in UltraPure distilled
water (Thermo Scientific, Waltham, MA, USA) and added to culture media at indicated
concentrations. Cyclosporin A (CsA, Sandimmun, Novartis, Basel, Switzerland) was used
at 5 µg/mL or 1 µg/mL in LN229 and T98 cells, respectively. Ionomycin and phorbol
12-myristate 13-acetate (PMA) were used at the final concentrations of 1 µM and 50 nM,
respectively. The effects of the treatments were monitored at various time points by phase-
contrast microscopy.
4.3. BrdU Incorporation Assay
Cells were cultured in 96-well plates and treated with peptides for 48 h. BrdU (10 µM)
was added to the culture medium for the last 2 h of treatment. Subsequently, the cells were
fixed and the level of BrdU incorporation was determined according to the manufacturer’s
protocol (Cell Proliferation ELISA BrdU assay, Roche Diagnostics GmbH, Mannheim,
Germany). There were 5 biological replicates for each condition and at least 3 experiments.
4.4. Quantitative RT-PCR Analysis
Total RNA was isolated according to the manufacturer’s protocol (Promega, Madi-
son, WI, USA), including a DNase digestion step. cDNAs were synthesized by exten-
sion of oligo(dT)15 primers using SuperScript III reverse transcriptase (Life Technolo-
gies, Carlsbad, CA, USA) in a mixture containing 1 µg of total RNA in 20 µL. Real-
time qPCR analysis was carried out using the QuantStudio 12K Flex Real-Time PCR
System (Applied Biosystems, Waltham, MA, USA) on cDNA equivalent to 10 ng RNA
in 10 µL reaction volume. Human NFATc1-c4 expression was measured using 1x Taq-
Man master mix (Thermo Fisher Scientific, Vilnius, Lithuania) and one of the follow-
ing TaqMan gene expression assays (Life Technologies, Pleasanton, CA, USA): NFATc1
(Hs00542678_m1), NFATc2 (Hs00905451_m1), NFATc3 (Hs00190046_m1) and normalized to
GAPDH (Hs02758991_g1). Alternatively, the qPCR was run using 1x SYBR Green PCR mas-
ter mix (Life Technologies, Carlsbad, CA) and 0.2 µM of each primer. The following primers
were used: human GAPDH sense (5-‘ATCACCATCTTCCAGGAGCGA-3’) and antisense (5-
‘AGCCTTCTCCATGGTGGTGAA-3’); cMYC sense (5-‘AAAACCAGCAGCCTCCCGCGA-
3’) and cMYC antisense (5-‘AATACGGCTGCACCGAGTCGT-3’), COX2/PTGS2 sense
(5-‘AATCCTTGCTGTTCCCACCC-3’) and COX2/PTGS2 antisense (5-‘AATTCCGGTGTTGMolecules 2021, 26, 4785 12 of 15
AGCAGTTT-3’), and CCND1 Quantitect Primer Assay (QT00495285, Qiagen, Hilden, Ger-
many). Each pair of primers was validated for equal amplification efficiency to primers
of the endogenous reference (GAPDH) at a wide range of cDNA concentrations. The
specificity of the PCR reaction was confirmed by a single peak in the dissociation curve. Ct,
the threshold cycle, was determined after setting the threshold in the linear amplification
phase of the PCR reaction and averaged for each sample assayed in duplicates. ∆Ct for
a particular gene was defined as Ct(target gene)-Ct(GAPDH). Data were analyzed with
the Relative Quantification (∆∆ Ct) method using QuantStudio 12K Flex software (Life
Technologies, Carlsbad, CA, USA).
4.5. Immunocytochemistry
Cells grown on glass coverslips were fixed in 4% paraformaldehyde for 10 min at
room temperature, permeabilized with 100% MetOH for 10 min at −20 ◦ C and incubated
in a blocking solution containing 3% donkey serum and 10% FBS in 0.1% Triton-X-100 in
PBS. Immunostaining was performed with mouse anti-human NFATc1 and rabbit anti-
human NFATc3 antibodies, followed by donkey anti-mouse or anti-rabbit AlexaFluor
555-conjugated antibodies, respectively. After final washing in PBS, the coverslips were
dried, mounted on slides with Vectashield Vibrance antifade mounting medium with DAPI
(Vector Laboratories, Burlingame, CA, USA) and visualized with a confocal microscope
(Fluoview FV10i, Olympus Corp., Tokyo, Japan).
4.6. Transfection and Luciferase Reporter Assay
The expression plasmids (0.5 µg per 105 cells) were delivered to the cells by electro-
poration using Amaxa™ 4D–Nucleofector™ system (Lonza, Cologne, Germany) in SE
nucleofection buffer according to the manufacturer’s protocol. The cells were transfected
with the GFP-VIVIT expression vector (Addgene, Watertown, MA, USA), which contained
an oligonucleotide coding for MAGPHPVIVITGPHEE (VIVIT peptide) at the N-terminus
of GFP or with the backbone control pEGFP-N1 plasmid (Addgene, Watertown, MA, USA).
For evaluation of the NFAT transcriptional activity, the cells were seeded at 2.5 × 10⁴ cells/well
in 48 wells plates and after two days transfected with pGL3-NFAT luciferase reporter
plasmid (0.3 µg/well, Addgene) using Lipofectamine 2000 reagent (Invitrogen). The
reporter plasmid contained three copies of the NFAT site from the minimal IL-2 promoter
(−89 to +51). In the case of testing the effect of plasmid-delivered VIVIT, the reporter
plasmid was introduced 24 h after the GFP-VIVIT expression vector. The exogenous
peptides were added to the cells 1 h before the transfection. In some experiments, the
cells were stimulated with 1 µM Io and 50 nM PMA or treated with CsA (1 µg/mL to T98
and 5 µg/mL to LN229 cell cultures) starting at 6 h post-transfection. Twenty-four hours
after transfection the cells were lysed in 50 µL of a passive lysis buffer (Promega, Madison,
WI, USA) and the luciferase activity was measured using the Luciferase Reporter System
(Promega, Madison, WI, USA). Luciferase activity in cell lysates was normalized to the
amount of protein, determined by the BCA Protein Assay Kit (Pierce, Waltham, MA, USA).
Cells were transfected in duplicates in each of at least 3 independent experiments.
4.7. Preparation of Protein Extracts and Western Blot Analysis
Whole-cell protein lysates were prepared by scraping cells into a lysis buffer containing
phosphatase and protease inhibitors as previously described [28]. To obtain nuclear and
cytosolic fractions cells were collected in ice-cold PBS, centrifuged for 5 min at 300× g
and lysed in a buffer containing 10 mM PIPES [pH 6.8], 100 mM NaCl, 1.5 mM MgCl2,
300 mM sucrose, 0.5% Triton X-100, 1 mM DTT and Complete Protease Inhibitor Cocktail
(Roche) for 20 min on ice. Lysed cells were then centrifuged for 5 min at 1000× g to
obtain the soluble (cytoplasmic) fraction. The pellet (nuclear fraction) was washed once,
re-suspended in the same buffer and sonicated briefly. Protein extracts were mixed with
4 × Laemmli Sample Buffer, then boiled for 5 min, cleared by centrifugation for 15 min at
14,000× g and resolved on SDS-PAGE before electrophoretic transfer onto a nitrocelluloseMolecules 2021, 26, 4785 13 of 15
membrane. After blocking in 5% low-fat milk in TBS-T (0.1% Tween 20/Tris-buffered
saline, pH 7.6) the membranes were incubated overnight with primary antibodies diluted
in the blocking buffer and then for 1 h with relevant horseradish-conjugated secondary
antibodies. Immunocomplexes were detected using an enhanced chemiluminescence
detection system ECL (Amersham, Germany) either by membrane exposure to X-ray film
or visualization in ChemiDoc Imaging System (Bio-Rad Laboratories, Hercules, CA, USA).
The molecular weight of proteins was estimated with pre-stained protein markers (Thermo
Fisher Scientific, Vilnius, Lithuania). Densitometric analysis was performed using NIH
ImageJ 1.53 e software.
4.8. Statistical Analysis
All quantitative data are presented as mean ± SD. Statistical analyses were performed
using Student’s t-test or, for multiple comparisons, with one-way ANOVA followed by
post hoc Tukey or Dunnett tests using the GraphPad Prism software (GraphPad, Inc., San
Diego, CA, USA). The p-values < 0.05 were considered to be statistically significant.
5. Conclusions
The development of short peptides disrupting protein–protein binding at functional
sites is an excellent strategy for the exploration and modulation of protein functions
through controlled interference with protein–protein interactions. The selection of a CPP
for conjugation to the interfering peptide in order to facilitate its translocation into the
cell should be adjusted to the target cell type. Sim-2 was not effective in translocating the
VIVIT peptide into glioma cells but we reported the activity of 11R-VIVIT. Our results
suggest that the VIVIT peptide produced inside the cells as a fusion protein with GFP
prevented the binding of NFAT to calcineurin and its subsequent dephosphorylation,
which led to the decreased activity of exogenous NFAT-responsive promoter and reduced
transcription of endogenous NFAT target genes. These results were not reproduced with
synthetic peptides and unexpectedly the VIVIT peptide activated NFAT translocation and
NFAT-driven transcription. These effects may result from the cell-specific expression of
NFAT transcription factors, mainly NFATc3 in glioma cells and mainly NFATc2 and NFATc1
in immune cells, in which the peptides were initially tested. NFATc3 activation engages
two calcineurin docking sites, i.e., PxIxIT, which is targeted by 11R-VIVIT, and LxVP, in
contrast to PxIxIT motif only in NFATc2. A spherical obstacle generated by GFP might
explain the higher efficacy of VIVIT-GFP fusion protein in glioma cells as compared to
11R-VIVIT. In summary, we conclude that none of the tested synthetic VIVIT peptides is
currently suitable for the evaluation of NFAT targets in glioma cells. The VIVIT peptide
without a CPP or with Sim2-VIVIT did not show any activity in these cells and 11R-VIVIT
lacked its inhibitory function on NFAT signaling.
Supplementary Materials: The following are available online, Figure S1: VIVIT peptide delivery
scheme, sequences of the peptides used in the experiment and their expected mode of action.
Figure S2: The effect of 11R-VIVIT and 11R-VEET peptides on the levels of NFAT genes expression.
Figure S3: 11R-VIVIT enhances NFAT translocation to the nucleus.
Author Contributions: Conceptualization, A.E.-M., K.P. and B.K.; Data curation, A.E.-M. and K.P.;
Funding acquisition, A.E.-M. and B.K.; Investigation, A.E.-M., A.S. and K.P.; Methodology, A.E.-M.
and A.S.; Writing—original draft, A.E.-M.; Writing—review & editing, A.E.-M., K.P. and B.K. All
authors have read and agreed to the published version of the manuscript.
Funding: This research was supported by the National Science Center, Poland, grant number
2014/15/B/NZ3/04704 (A.E.-M.). The APC was funded by the Nencki Institute statutory budget.
Institutional Review Board Statement: Not applicable.
Informed Consent Statement: Not applicable.
Data Availability Statement: The data presented in this study are available on request from the
corresponding authors.Molecules 2021, 26, 4785 14 of 15
Acknowledgments: We thank I. Ciechomaska for establishing and sharing a human GBM-derived
glioma culture WG4.
Conflicts of Interest: The authors declare no conflict of interest.
References
1. Farkhani, S.M.; Valizadeh, A.; Karami, H.; Mohammadi, S.; Sohrabi, N.; Badrzadeh, F. Cell penetrating peptides: Efficient vectors
for delivery of nanoparticles, nanocarriers, therapeutic and diagnostic molecules. Peptides 2014, 57, 78–94. [CrossRef]
2. Regberg, J.; Srimanee, A.; Langel, U. Applications of cell-penetrating peptides for tumor targeting and future cancer therapies.
Pharmaceuticals (Basel) 2012, 5, 991–1007. [CrossRef] [PubMed]
3. Macian, F. NFAT proteins: Key regulators of T-cell development and function. Nat. Rev. Immunol. 2005, 5, 472–484. [CrossRef]
4. Aramburu, J.; Yaffe, M.B.; Lopez-Rodriguez, C.; Cantley, L.C.; Hogan, P.G.; Rao, A. Affinity-driven peptide selection of an NFAT
inhibitor more selective than cyclosporin A. Science 1999, 285, 2129–2133. [CrossRef]
5. Li, H.; Rao, A.; Hogan, P.G. Interaction of calcineurin with substrates and targeting proteins. Trends Cell Biol. 2011, 21, 91–103.
[CrossRef]
6. Choi, J.M.; Sohn, J.H.; Park, T.Y.; Park, J.W.; Lee, S.K. Cell permeable NFAT inhibitory peptide Sim-2-VIVIT inhibits T-cell
activation and alleviates allergic airway inflammation and hyper-responsiveness. Immunol. Lett. 2012, 143, 170–176. [CrossRef]
7. Noguchi, H.; Matsushita, M.; Okitsu, T.; Moriwaki, A.; Tomizawa, K.; Kang, S.; Li, S.T.; Kobayashi, N.; Matsumoto, S.;
Tanaka, K.; et al. A new cell-permeable peptide allows successful allogeneic islet transplantation in mice. Nat. Med. 2004,
10, 305–309. [CrossRef]
8. Elloumi, H.Z.; Maharshak, N.; Rao, K.N.; Kobayashi, T.; Ryu, H.S.; Muhlbauer, M.; Li, F.; Jobin, C.; Plevy, S.E. A cell permeable
peptide inhibitor of NFAT inhibits macrophage cytokine expression and ameliorates experimental colitis. PLoS ONE 2012,
7, e34172. [CrossRef]
9. Zhang, L.; Li, R.; Shi, W.; Liang, X.; Liu, S.; Ye, Z.; Yu, C.; Chen, Y.; Zhang, B.; Wang, W.; et al. NFAT2 inhibitor ameliorates
diabetic nephropathy and podocyte injury in db/db mice. Br. J. Pharmacol. 2013, 170, 426–439. [CrossRef]
10. Rojanathammanee, L.; Floden, A.M.; Manocha, G.D.; Combs, C.K. Attenuation of microglial activation in a mouse model of
Alzheimer’s disease via NFAT inhibition. J. Neuroinflamm. 2015, 12, 42. [CrossRef]
11. Muller, M.R.; Rao, A. NFAT, immunity and cancer: A transcription factor comes of age. Nat. Rev. Immunol. 2010, 10, 645–656.
[CrossRef]
12. Mancini, M.; Toker, A. NFAT proteins: Emerging roles in cancer progression. Nat. Rev. Cancer 2009, 9, 810–820. [CrossRef]
13. Mosieniak, G.; Pyrzynska, B.; Kaminska, B. Nuclear factor of activated T cells (NFAT) as a new component of the signal
transduction pathway in glioma cells. J. Neurochem. 1998, 71, 134–141. [CrossRef] [PubMed]
14. Tie, X.; Han, S.; Meng, L.; Wang, Y.; Wu, A. NFAT1 is highly expressed in, and regulates the invasion of, glioblastoma multiforme
cells. PLoS ONE 2013, 8, e66008. [CrossRef] [PubMed]
15. Wang, L.; Wang, Z.; Li, J.; Zhang, W.; Ren, F.; Yue, W. NFATc1 activation promotes the invasion of U251 human glioblastoma
multiforme cells through COX-2. Int. J. Mol. Med. 2015, 35, 1333–1340. [CrossRef]
16. Urso, K.; Fernandez, A.; Velasco, P.; Cotrina, J.; de Andres, B.; Sanchez-Gomez, P.; Hernandez-Lain, A.; Hortelano, S.;
Redondo, J.M.; Cano, E. NFATc3 controls tumour growth by regulating proliferation and migration of human astroglioma
cells. Sci. Rep. 2019, 9, 9361. [CrossRef]
17. Wu, A.; Ericson, K.; Chao, W.; Low, W.C. NFAT and AP1 are essential for the expression of a glioblastoma multiforme related
IL-13Ra2 transcript. Cell. Oncol. 2010, 32, 313–329. [CrossRef] [PubMed]
18. Pacharoen, T.; Chumnanvej, S.; Singhsnaeh, A.; Sanvarinda, P.; Chongthammakun, S.; Jantaratnotai, N. Characterization of NFAT
expression in human glioma and its correlation with tumor grade. J. Sci. Technol. 2019, 41, 679–685.
19. Ciechomska, I.A.; Kaminska, B. ER stress and autophagy contribute to CsA-induced death of malignant glioma cells. Autophagy
2012, 8, 1526–1528. [CrossRef]
20. Gabrusiewicz, K.; Ellert-Miklaszewska, A.; Lipko, M.; Sielska, M.; Frankowska, M.; Kaminska, B. Characteristics of the alternative
phenotype of microglia/macrophages and its modulation in experimental gliomas. PLoS ONE 2011, 6, e23902. [CrossRef]
21. Yu, H.; Sliedregt-Bol, K.; Overkleeft, H.; van der Marel, G.A.; van Berkel, T.J.; Biessen, E.A. Therapeutic potential of a synthetic
peptide inhibitor of nuclear factor of activated T cells as antirestenotic agent. Arterioscler. Thromb. Vasc. Biol. 2006, 26, 1531–1537.
[CrossRef] [PubMed]
22. Martinez-Martinez, S.; Rodriguez, A.; Lopez-Maderuelo, M.D.; Ortega-Perez, I.; Vazquez, J.; Redondo, J.M. Blockade of NFAT
activation by the second calcineurin binding site. J. Biol. Chem. 2006, 281, 6227–6235. [CrossRef] [PubMed]
23. Wang, L.; Cheng, N.; Wang, P.; Li, J.; Jia, A.; Li, W.; Zhang, N.; Yin, Y.; Tong, L.; Wei, Q.; et al. A novel peptide exerts potent
immunosuppression by blocking the two-site interaction of NFAT with calcineurin. J. Biol. Chem. 2020, 295, 2760–2770. [CrossRef]
[PubMed]
24. Ellert-Miklaszewska, A.; Poleszak, K.; Kaminska, B. Short peptides interfering with signaling pathways as new therapeutic tools
for cancer treatment. Future Med. Chem. 2017, 9, 199–221. [CrossRef]
25. Melikov, K.; Hara, A.; Yamoah, K.; Zaitseva, E.; Zaitsev, E.; Chernomordik, L.V. Efficient entry of cell-penetrating peptide
nona-arginine into adherent cells involves a transient increase in intracellular calcium. Biochem. J. 2015, 471, 221–230. [CrossRef]
[PubMed]You can also read