Focal Adhesion Kinase as a Potential Target in AML and MDS
←
→
Page content transcription
If your browser does not render page correctly, please read the page content below
Published OnlineFirst March 7, 2017; DOI: 10.1158/1535-7163.MCT-16-0719

  Cancer Biology and Signal Transduction                                                                                            Molecular
                                                                                                                                    Cancer
                                                                                                                                    Therapeutics
Focal Adhesion Kinase as a Potential Target in AML
and MDS
Bing Z. Carter1, Po Yee Mak1, Xiangmeng Wang1, Hui Yang2,
Guillermo Garcia-Manero2, Duncan H. Mak1, Hong Mu1, Vivian R. Ruvolo1,
Yihua Qiu1, Kevin Coombes3, Nianxiang Zhang4, Brittany Ragon1,
David T. Weaver5, Jonathan A. Pachter5, Steven Kornblau1, and Michael Andreeff1

Abstract
   Although overexpression/activation of focal adhesion kinase                     109) cells compared with normal CD34þ cells. MDS patients
(FAK) is widely known in solid tumors to control cell growth,                      with higher FAK in CD34þ cells tended to have better overall
survival, invasion, metastasis, gene expression, and stem cell self-               survival (P ¼ 0.05). FAK expression was significantly higher in
renewal, its expression and function in myeloid leukemia are not                   MDS patients who later transformed to compared with those who
well investigated. Using reverse-phase protein arrays in large                     did not transform to AML and in AML patients who transformed
cohorts of newly diagnosed acute myeloid leukemia (AML) and                        from MDS compared with those with de novo AML. Coculture with
myeloid dysplastic syndrome (MDS) samples, we found that high                      mesenchymal stromal cells (MSC) increased FAK expression in
FAK expression was associated with unfavorable cytogenetics (P ¼                   AML cells. Inhibition of FAK decreased MSC-mediated adhesion/
2  104) and relapse (P ¼ 0.02) in AML. FAK expression was                        migration and viability of AML cells and prolonged survival in an
significantly lower in patients with FLT3-ITD (P ¼ 0.0024) or RAS                   AML xenograft murine model. Our results suggest that FAK
(P ¼ 0.05) mutations and strongly correlated with p-SRC and                        regulates leukemia–stromal interactions and supports leukemia
integrinb3 levels. FAK protein levels were significantly higher in                  cell survival; hence, FAK is a potential therapeutic target in
CD34þ (P ¼ 5.42  1020) and CD34þCD38 MDS (P ¼ 7.62                             myeloid leukemia. Mol Cancer Ther; 16(6); 1133–44. 2017 AACR.

Introduction                                                                       and promoting regulatory T-cell (Treg) recruitment and retention
                                                                                   in squamous cell carcinoma (5) and inhibition of FAK renders
   Focal adhesion kinase (FAK) coordinates a signaling network
                                                                                   pancreatic cancers responsive to checkpoint immunotherapy (6).
that orchestrates a diverse range of cellular processes through both
                                                                                      FAK is overexpressed and/or constitutively activated in many
kinase-dependent and independent mechanisms (1). Once acti-
                                                                                   solid tumors, and both increased FAK expression and activity are
vated through integrin (ITG) ligation (2) or growth factor recep-
                                                                                   associated with poor clinical outcomes (7–9), suggesting that FAK
tor–mediated (3) signals within the tumor microenvironment,
                                                                                   is a potentially critical target for cancer therapy. Indeed, FAK
FAK cooperates with SRC, leading to SRC phosphorylation and
                                                                                   inhibition has been investigated extensively in solid tumors
subsequent FAK/SRC phosphorylation at multiple sites, which
                                                                                   (10, 11). A recent study in a patient-derived xenograft model of
relays the external signal into cells by activating multiple cell
                                                                                   mesothelioma showed that FAK inhibitor VS-4718 preferentially
proliferating/survival pathways, such as PI3K/AKT and MAPK,
                                                                                   eliminated the cancer stem cells that were enriched following
and by regulating the expression of various genes (4). Most
                                                                                   treatment with chemotherapeutic agents (11). VS-4718 treatment
recently, FAK was found to be able to generate a tumor-suppres-
                                                                                   in combination with dasatinib prolonged survival in a model of
sive microenvironment by regulating chemokine transcription
                                                                                   B-cell acute lymphoblastic leukemia (B-ALL; ref. 12). Several
                                                                                   FAK inhibitors, such as VS-4718, have entered clinical trials
1                                                                                  (NCT01849744, NCT02651727) in solid tumors. However, the
  Section of Molecular Hematology and Therapy, Department of Leukemia, The
University of Texas MD Anderson Cancer Center, Houston, Texas. 2Section of
                                                                                   proposed trial in acute myeloid leukemia (AML; NCT02215629)
Myelodysplastic Syndromes, Department of Leukemia, The University of Texas         was withdrawn largely due to lack of preclinical studies of the
MD Anderson Cancer Center, Houston, Texas. 3Department of Biomedical               compound in acute leukemia.
Informatics, The Ohio State University College of Medicine, Columbus, Ohio.           The critical role of the bone marrow microenvironment in
4
  Life Technologies Corporation, Carlsbad, California. 5Verastem, Inc., Needham,   leukemia progression and drug resistance has only been recog-
Massachusetts.
                                                                                   nized and investigated in the past decade (13). Although it is
Note: Supplementary data for this article are available at Molecular Cancer        extensively studied in solid tumors, limited work was done with
Therapeutics Online (http://mct.aacrjournals.org/).                                regard to the expression and function of FAK in myeloid leukemia.
Corresponding Authors: Michael Andreeff and Bing Z. Carter, Department of          Recher and colleagues demonstrated that FAK is expressed in
Leukemia, University of Texas MD Anderson Cancer Center, 1515 Holcombe             approximately 40% of AML patient samples and that high expres-
Boulevard, Unit 448, Houston, TX 77030-4009. Phone: 713-792-7261; Fax: 713-        sion of FAK in AML was associated with enhanced blast migration,
794-1903; E-mail: mandreef@mdanderson.org; bicarter@mdanderson.org
                                                                                   increased cellularity, and poor prognosis (14). Subsequently,
doi: 10.1158/1535-7163.MCT-16-0719                                                 Tavernier-Tardy and colleagues showed that FAK expression neg-
2017 American Association for Cancer Research.                                    atively associated with overall survival (OS) in AML, and patients

www.aacrjournals.org                                                                                                                                    1133

    Downloaded from mct.aacrjournals.org on January 30, 2021. © 2017 American Association for Cancer Research.
Published OnlineFirst March 7, 2017; DOI: 10.1158/1535-7163.MCT-16-0719

      Carter et al.

      overexpressing two to three factors of FAK, CXCR4, and VLA4 had                     treated at MDACC and were evaluable for outcome. For the MDS
      a significantly shorter OS (15). Given the importance of the bone                    population, bone marrow or peripheral blood specimens were
      marrow microenvironment in leukemogenesis, progression, and                         collected from 133 newly diagnosed MDS patients who were
      drug resistance, it is not surprising that leukemic cell adhesion                   evaluated at MDACC between 1999 and 2007. The 133 newly
      molecules play critical roles in regulating the interactions with                   diagnosed MDS patients include 7 refractory anemia, 8 refractory
      mesenchymal stromal cells (MSC), an important bone marrow                           cytopenia with multilineage dysplasia (RCMD), 3 RCMD and ring
      component affecting patient outcome. Although FAK as a ther-                        sideroblasts, 67 refractory anemia with excess blast, 3 refractory
      apeutic strategy has not been explored in AML, other agents                         anemia with ringed sideroblasts, 1 myelodysplastic syndrome
      potentially impacting the bone marrow microenvironment have                         unclassified, 31 chronic myelomonocytic leukemia, and 13
      been investigated. Pharmacologic disruption of the CXCR4–                           others. The median age at diagnosis was 68.3 years (range,
      CXCL12 interaction has demonstrated preclinically and in clinical                   26.5–89.4). By International Prognostic Scoring System, 13 were
      trials that it is capable of mobilizing leukemia cells from the                     low risk, 48 intermediate-1, 37 intermediate-2, 18 high risk, and
      protective bone marrow microenvironment and sensitizes to                           17 unknown. Cytogenetics of the population includes 72 diploid,
      chemotherapy (16–19). Targeting VLA4/VCAM-1 signaling has                           31 isolated 5q/7q, 4 isolated 20q, and 26 others. CD34þ cells
      also shown the potential of overcoming stroma-mediated che-                         (n ¼ 191, 116 diagnosis and 75 sequential including 73 relapse)
      moresistance in bone marrow–resident leukemia cells (20), indi-                     and CD34þCD38 cells (n ¼ 88, 47 diagnosis and 41 sequential
      cating that disruption of adhesion pathways in leukemic cells may                   including 40 relapse) were separated as reported previously (21).
      have a number of clinical utilities.                                                Sample collection and RPPA analysis were done according to the
         Utilizing improved proteomic technologies, we examined the                       protocols approved by the MDACC Investigational Review Board.
      expression of FAK in a large cohort of newly diagnosed AML                          As controls, FAK expression level was also determined in CD34þ
      (n ¼ 511) patient samples by reverse-phase protein array (RPPA)                     cells from 16, peripheral blood mononuclear cells from 9, and
      and correlated its expression with patient clinical characteristics.                CD133þ cells from 5 normal donors (Table 1). FAK antibody was
      As approximately 30% of MDS patients will progress to AML and                       purchased from Cell Signaling Technology (cat #3285).
      these patients with secondary AML carry poor prognosis, we also
      examined the expression of FAK and its clinical correlation in a                    Cell culture and treatment
      large cohort of newly diagnosed MDS (n ¼ 133) patient samples.                         OCI-AML3 was provided in 2004 by Dr. M. Minden (Ontario
      We determined a role of FAK in AML cell lines in vitro and in vivo                  Cancer Institute, Toronto, ON, Canada). Molm13 and Molm14
      AML models by knocking down FAK with shRNA and/or using a                           were obtained in 2005 and 2014, respectively, from the German
      FAK inhibitor VS-4718. These experiments offer a compelling                         Collection of Microorganisms and Cell Cultures. MV4-11, pur-
      rationale for the use of FAK inhibitors clinically in the AML setting.              chased in 2006, and KG-1, KG-1a, HL-60, and THP1, all purchased
                                                                                          in 1998, were obtained from the ATCC. Cell lines were validated by
      Materials and Methods                                                               STR DNA fingerprinting using the AmpF_STR Identifier Kit accord-
      Protein determination by RPPA in AML and MDS patient                                ing to the manufacturer's instructions (Applied Biosystems, cat
      populations                                                                         #4322288). The STR profiles were compared with known ATCC
        FAK expression in large cohorts of AML and MDS patient                            fingerprints and with the Cell Line Integrated Molecular Authen-
      samples and normal controls was determined by RPPA as                               tication database (CLIMA) version 0.1.200808 (http://archive.is/
      described previously (21, 22). The AML patient population was                       http://bioinformatics.istge.it/clima/; ref. 25). The STR profiles
      the same as published previously (23, 24). Briefly, peripheral                       matched known DNA fingerprints or were identified as unique
      blood and bone marrow specimens were collected from 511                             (OCI-AML3). Authenticated cells are stored under liquid nitrogen
      newly diagnosed AML patients evaluated at The University of                         and are never kept in culture for more than 4 months. Cell lines were
      Texas MD Anderson Cancer Center (MDACC; Houston, TX) from                           cultured in RPMI1640 medium supplemented with 10% heat-
      September 1999 to July 2010. A paired relapse sample was                            inactivated FCS, 2 mmol/L L-glutamine, 100 U/mL penicillin, and
      available for 47 patients. Of the 511 AML patients, 415 were                        100 mg/mL streptomycin. Primary leukemic samples were acquired

      Table 1. FAK protein expression in MDS patient samples by RPPA
                             Mean             SD             Median             Min            Max         >Norm (%)        norm (%), percentage above normal range;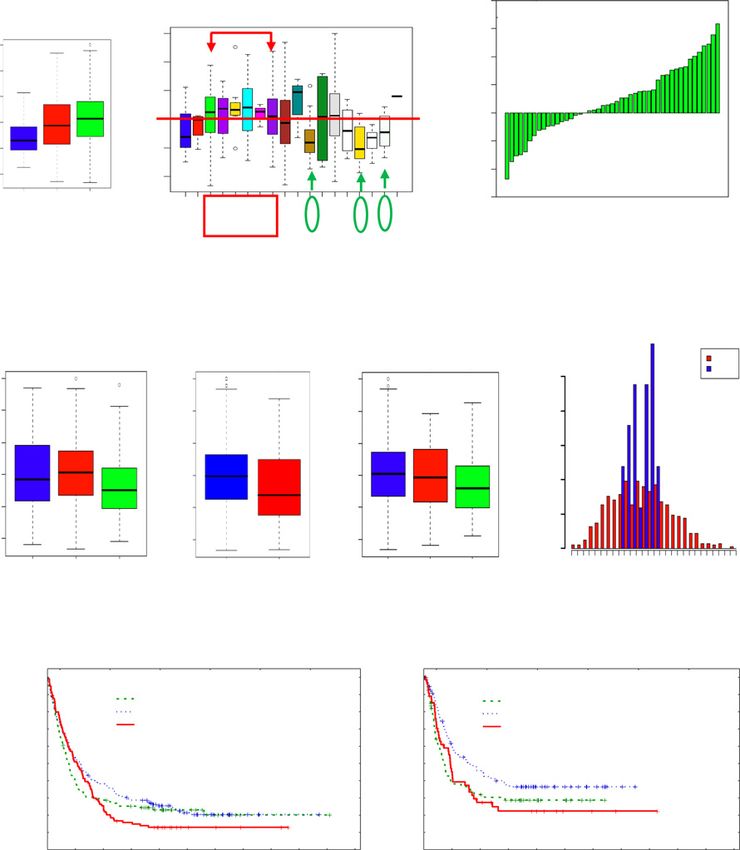
Published OnlineFirst March 7, 2017; DOI: 10.1158/1535-7163.MCT-16-0719

                                                                                                                           FAK in AML and MDS

from AML patients with high blast counts, after informed consent        CyTOF mass cytometry
following the institution-approved protocol. Mononuclear cells             Mononuclear cells from AML primary patient samples were
were isolated from these samples by density gradient centrifugation     stained with antibodies for cell surface and intracellular proteins
using a Lymphocyte Separation Medium (Corning) and cultured in          (Table 2) and subjected to CyTOF mass cytometry as described
a-MEM medium supplemented with 10% heat-inactivated FCS.                previously (29, 30). Data were exported as FCS for subsequent
Cells were kept at 37 C in a humidified atmosphere of 5% CO2.           analysis in SPADE (v3.0, http://pengqiu.gatech.edu/software/
Human MSCs isolated from bone marrow samples obtained from              SPADE/).
healthy subjects as described previously (26, 27) and mouse MSC
cell line MS5 were cultured in the same medium as AML patient           In vivo xenograft mouse model
samples. For coculture experiments, leukemia cells were added to           Animal experiments were performed in accordance with a
MSCs(AMLcells:MSCs ¼ 4:1ratio)that wereplatedthe nightbefore            protocol approved by the Institutional Animal Care and Use
and cultured as above. Leukemia cells cultured alone or cocultured      Committee at MDACC. Molm14 cells (0.6  106) stably expres-
with MSCs were collected at 24 hours for measuring FAK expression       sing a dual luciferase-GFP reporter (Molm14-GFP/Luc) were
or treated with FAK inhibitor VS-4718 for further assessment. VS-       injected via the tail vein into NOD/SCID IL2Rg Null-3/GM/SF
4718was purchasedfromChemietek.The chemicalstructureforVS-              (NSGS) mice (The Jackson Laboratory). Once engraftment was
4718 is presented in Supplementary Fig. S1.                             confirmed by the IVIS-200 noninvasive bioluminescence in vivo
                                                                        imaging system (Xenogen), mice were either untreated or treated
Adhesion and migration assays                                           with VS-4718 twice a day at 75 mg/kg via oral gavage (n ¼ 10/
  Migration of leukemia cells toward and adhesion to MSCs were          group) for 16 days. Leukemia burden was monitored by IVIS in
determined as reported previously (28). Migration was deter-            vivo imaging, flow cytometric measurement of human CD45 cells
mined at 6 hours and adhesion at 24 hours.                              (anti-human CD45 antibody, BD Biosciences) in mouse periph-
                                                                        eral blood, and IHC staining for human CD45þ cells in mouse
Cell viability assay                                                    tissues (stained with anti-human CD45 antibody and visualized
   Viable cell numbers were determined by flow cytometry using           by Biotin-free Tyramide Signal Amplification System, both from
counting beads (Life Technologies). Apoptosis was estimated via         Dako). Mouse survival was recorded.
flow cytometry measurement of phosphatidylserine externaliza-
tion with Annexin V staining (BD Biosciences). Cell membrane            Statistical analyses
integrity was simultaneously assessed by 7-aminoactinomycin D              Protein expressions determined by RPPA, correlations of FAK
(7AAD) exclusion in the Annexin V–stained cells. To assess cell         expression with other proteins in patient samples and with patient
numbers and apoptosis in leukemia cells cocultured with MSCs,           clinical outcomes in AML were analyzed as described previously
CD45þ cells were counted and apoptotic cells were defined as             (23, 24). For RPPA analysis of MDS patient samples, Pearson and
Annexin Vþ/AADþ CD45þ cells.                                            Spearman correlation coefficient of the protein level and contin-
                                                                        uous variables were calculated. A log-rank test was used to
Generating FAK knockdown cells
                                                                        evaluate the survival difference among the groups of subjects
   FAK was knocked down by lentiviral transduction using gene-
                                                                        with different FAK protein level. All in vitro experiments were
specific shRNA transfer vectors (clones TRCN0000001620: shRNA1-
                                                                        conducted in triplicate. Correlation coefficient for two sets of
targeting residues 3053-3073 and TRCN0000001621: shRNA2-tar-
                                                                        values was determined by Pearson (Microsoft Excel 2010). Mouse
geting residues 2739-2759 on RefSeq NM_005607.4; GE Dharma-
                                                                        survival was analyzed using log-rank test. Statistical differences
con). Lentivirus was prepared by cotransfecting HEK293T cells
                                                                        between groups were determined using paired Student t test with
(ATCC) with an equimolar mix of transfer vector and packaging
                                                                        P  0.05 being considered statistically significant. Results are
plasmids (psPAX2 and pMD2.G, gifts from Didier Trono (School of
                                                                        expressed as mean  SEs.
Life Sciences at the Swiss Institutes of Technology, Lausanne,
Switzerland), plasmids #12260 and 12259, Addgene) using Jet-
Prime transfection reagent as directed by the manufacturer (Poly-       Results
plus). Fresh lentiviral supernatants were passed through 0.45-mm        Expression of FAK in AML patient samples and its clinical
pore surfactant-free cellulose acetate membranes and then used          correlations
immediately to infect leukemic cells by incubation overnight at           We determined FAK expression by RPPA in peripheral blood or
37 C under 5% CO2. Infected cells were selected with puromycin         bone marrow samples obtained from a large cohort of newly
(InvivoGen) starting at 0.5 mg/mL. In parallel, cells were transduced
using lentivirus delivering a nonspecific control [pLKO.1-TRC con-
trol, a gift from David Root (Board Institute of MIT and Harvard,       Table 2. Antibody panel   for CyTOF   analysis
Cambridge, MA), plasmid 10879, Addgene]. Knockdown was ver-                    Target               Label     Clone       Vendor
ified by Western blot and real time RT-PCR analyses.                     (1)    CD45                 89Y       HI30        DVS-Fluidigm
                                                                        (2)    CD34                 148Nd     4H11        eBioscience
Western blot analysis                                                   (3)    p-FAK (Y397)         175Lu     D20B1       Cell Signaling Technology
   Western blot analysis was carried out as described previously        (4)    FAK                  141Pr     D2R2E       Cell Signaling Technology
                                                                        (5)    p-ERK1/2             167Er     D13.14.4E   DVS-Fluidigm
(28). Antibodies against FLT3, p-FLT3, and FAK were purchased           (6)    p-AKT                159Tb     M89-61      BD Biosciences
from Cell Signaling Technology and p-FAKy397 from Abcam.                (7)    p-SRC(Tyr416)        164Dy     D49G4       Cell Signaling Technology
b-Actin was used as a loading control. Signals were detected using      (8)    p-STAT5(Y694)        150Nd     47          DVS-Fluidigm
the Odyssey Infrared Imaging System (LI-COR Biosciences) and            (9)    p-STAT3(Y705)        158Gd     4/P-STAT3   DVS-Fluidigm
quantified using the Odyssey software (version 3.0, LI-COR               (10)   p-FLT3               174Yb     30D4        Cell Signaling Technology
Biosciences).                                                           (11)   FLT3                 162Dy     4G8         BD Biosciences

www.aacrjournals.org                                                                                            Mol Cancer Ther; 16(6) June 2017      1135

   Downloaded from mct.aacrjournals.org on January 30, 2021. © 2017 American Association for Cancer Research.
Published OnlineFirst March 7, 2017; DOI: 10.1158/1535-7163.MCT-16-0719
Carter et al.
A B C
cyto.cat F statistics = 2.772 P value = 2e–04
4
–4 AML+APL DATA
cyto. group P = 2 × 10 n = 47/group
New diagnosis Relapse greater
n = 13 5 28 24 7 38 3 33 214 3 19 4 95 6 20 6 15 1
n = 34 225 252
3
3 P = 0.021
(relapse/new diagnosis)
Log2 Ratio of FAK level
3
2
2
2
FAK Level (log2)
FAK Level (log2)
1
1
1
0
0 0
greater
–1
–1 –1
–2
–2 –2
–3
11q23
21
–5
–5,–7
–5,–7,+8
FAV INT UNFAV
–7,+8
8
diploid
IM
inv16
inv9
Misc
NAM
t15;17
t6;9
t8;21
t9;22
–7
Paired observations
D E Newly diagnosed AML (n = 511)
FLT3-ITD Mutation FLT3-D835 Mutation RAS Mutation and CD34+ controls (n = 21)
P = 0.002 P = 0.06 P = 0.05 P = 0.66
n = 11 417 83 434 24 371 76 64
AML
CD34+
1.0
3 3 3
Distribution density
0.8
2 2 2
FAK Level (log2)
FAK Level (log2)
FAK Level (log2)
0.6
1 1 1
0 0 0
0.4
–1 –1 –1
0.2
–2 –2 –2
0.0
–2.4 –1.8 –1.2 –0.6 0 0.4 1 1.4 2 2.4 3
ND NEG POS NEG POS NEG ND POS
FAK Level (log2)
F G
Effect of FAK level on OS Effect of FAK level on remission duration
Cumulative proportion surviving
Cumulative proportion surviving
1.0 1.0
N N Rel
0.9 Below normal 120 0.9 75 48
Below normal
0.8 Normal 180 P = 0.23 0.8 Normal 99 58 P = 0.02
0.7 Above normal 115 0.7 Above normal 57 40
0.6 0.6
0.5 0.5
0.4 0.4
0.3 0.3
0.2 0.2
0.1 0.1
0.0 0.0
0 52 104 156 208 260 312 364 416 468 520 572 0 52 104 156 208 260 312 364 416 468 520 572
Time (weeks) Time (weeks)
Figure 1.
FAK expression determined by RPPA and patient characteristics in AML. A, FAK levels in samples from newly diagnosed AML patients of various cytogenetic groups.
B, FAK levels in samples from newly diagnosed AML patients with various cytogenetics. C, FAK levels in paired newly diagnosed and relapsed AML patient
samples (n ¼ 47). D, FAK expression in AML patient samples with or without FLT3 or RAS mutations. E, FAK levels in newly diagnosed AML samples and CD34þ cells
from normal controls. F, FAK expression and OS. G, FAK expression and remission duration. Cyto, cytogenetic; fav, favorable; int, intermediate; unfav,
unfavorable; ND, not determined; neg, negative; and pos, positive.
diagnosed AML (n ¼ 511). High FAK expression was associated cytogenetic group, including inv16 (n ¼ 19), t(8;21) (n ¼ 15), and
with the unfavorable cytogenetic group (P ¼ 2 104; Fig. 1A). t(15;17) (n ¼ 20) chromosome translocations (green circles, Fig.
The lowest FAK expression was seen in patients with favorable 1B). Patients with 5, 7, and/or þ8 (n ¼ 100) expressed
1136 Mol Cancer Ther; 16(6) June 2017 Molecular Cancer Therapeutics
Downloaded from mct.aacrjournals.org on January 30, 2021. © 2017 American Association for Cancer Research.Published OnlineFirst March 7, 2017; DOI: 10.1158/1535-7163.MCT-16-0719
FAK in AML and MDS
relatively higher FAK (red box, Fig. 1B). Localization of FAK on FAK signaling in AML
chromosome 8 may explain high FAK levels in samples from AML As FAK is activated by ITG ligation or growth factors from the
patients with trisomy of chromosome 8. FAK expression was microenvironment and is known to relay the extracellular signal
higher in relapsed compared with paired newly diagnosed sam- intracellularly through the FAK/SRC signaling cascade, we com-
ples (n ¼ 47, P ¼ 0.02; Fig. 1C). Interestingly, we found that FAK pared FAK expression with the expression of SRC and ITGs in the
expression was significantly lower in patients with FLT3-ITD (n ¼ same AML RPPA samples. FAK expression was highly positively
83, P ¼ 0.0024) or RAS (n ¼ 64, P ¼ 0.05) mutations and tended correlated with p-SRCY416 and ITGb3 expression in a 3D surface
to be lower in patients with FLT3-D835 mutation (n ¼ 24, P ¼ blot (Fig. 3A), suggesting a role for ITG/FAK/SRC signaling in AML
0.06; Fig. 1D), suggesting functional compensation of these cells.
signaling pathways. Perhaps the hyperleukocytosis characteristic To better define growth factor and cell–cell interaction deter-
of FLT3-ITD AML is related to the decreased FAK levels observed. minants of FAK signaling in AML, we first investigated whether
Figure 1E shows the distribution of FAK expression in samples FAK in AML cells is regulated by myeloid growth factors. GM-CSF
with newly diagnosed AML (n ¼ 511) and CD34þ cells from induced FAK expression in OCI-AML3 cells (Fig. 3B). MSCs secrete
normal controls (n ¼ 21). Among the 415 evaluable patients, we multiple growth factors/cytokines and are an important compo-
did not observe significant differences in OS (P ¼ 0.23) among nent of the bone marrow microenvironment that is critical for the
patients whose FAK expression was lower, equal, or higher com- homing and survival of leukemia cells. We next examined whether
pared with that of normal controls, although patients with lower FAK expression in AML cells is increased by MSC coculture. We
FAK tended to do worse short term and patients with higher FAK cultured leukemic mononuclear cells obtained from patients with
did worse long term (Fig. 1F). Interestingly, FAK expression levels AML with or without a murine MSC cell line (MS5) for 24 hours
significantly impact remission duration of the patients (P ¼ 0.02). and determined FAK expression by Western blot analysis. In an
Patients with FAK levels the same as normal controls had the evaluation of 7 AML patient samples, leukemic cells cocultured
longest remission duration, followed by patients with lower FAK with MSCs expressed significantly more FAK than without (P ¼
levels, the shortest being the patients with FAK levels higher than 0.016; Fig. 3C), suggesting that the microenvironment modulates
normal controls (Fig. 1G). Thus, by multiple criteria, increased leukemia cell function in part through activating FAK signaling.
FAK expression is a poor prognostic marker in AML and associates To determine FAK signaling, we treated primary AML cells from
with unfavorable cytogenetic profiles. 2 patients, one with wild-type FLT3 and one with FLT3-ITD with
FAK inhibitor VS-4718 and measured cell signaling in blasts and
Expression of FAK in MDS patient samples and its clinical CD34þ subset by CyTOF mass cytometry, aided by SPADE anal-
correlations ysis. We found that VS-4718 decreased p-FAK, FAK, and p-SRC as
RPPA was performed on 279 bone marrow or peripheral well as FLT3 downstream targets p-AKT and p-STAT5, but not p-
blood samples collected from 133 newly diagnosed MDS FLT3 and FLT3 in bulk and CD34þ cells of both samples (Fig. 3D),
patients and their follow-up (Table 1). Elevated or decreased suggesting that VS-4718 inhibits cell survival signaling through
expression was defined as expression levels above or below FAK, not FLT3 inhibition. We also treated OCI-AML3 and
90% confidence interval of CD34þ normal specimen mean Molm14 cells with VS-4718 and found that VS-4718 reduced
expression, respectively. Overexpression of FAK was seen in FAK in both AML cell lines and did not affect p-FLT3 and FLT3
90.7% of all samples compared with CD34þ normal speci- levels in Molm14 cells with FLT3-ITD (Fig. 3D).
mens. Furthermore, overexpression of FAK was observed in
91.6% of CD34þ samples, including 91.4% in newly diagnosed Inhibition of FAK blocks leukemia–stromal interactions
samples and 91.8% in samples from relapsed patients. Over- To determine whether FAK has a role in leukemia–microenvi-
expression of FAK was observed in 88.6% of CD34þCD38 ronment interactions, we conducted adhesion and migration
samples, including 85.1% in newly diagnosed samples and assays. Inhibition of FAK by VS-4718 decreased the adhesion
92.5% in samples from relapsed patients (Table 1). We then (Fig. 4A) and migration (Fig. 4B) of OCI-AML3 cells to bone
compared the distribution of FAK level in the 116 newly marrow–derived MSCs, suggesting that inhibition of FAK blocks
diagnosed CD34þ samples and 47 newly diagnosed leukemia–stroma interactions. Note that reduced adhesion and
CD34þCD38 samples with 16 normal CD34þ controls. FAK migration of AML cells to MSCs were not caused by FAK inhibi-
expression levels were significantly higher in both CD34þ (n ¼ tion–induced cell death, as at the doses and time points for the
116, P ¼ 5.42 1020) and CD34þCD38 (n ¼ 47, P ¼ 7.62 assay, no marked decreases in cell viability were observed (Fig. 4A
109) cells from MDS patient samples compared with CD34þ and B). Furthermore, inhibition of FAK expression by shRNA in
cells from normal controls (n ¼ 16; Fig. 2A), suggesting their OCI-AML3 cells decreased the adhesion and migration of these
involvement in MDS pathogenesis. Patients with higher FAK cells in a dose-dependent manner to human bone marrow–
expression in CD34þ cells tended to have a better OS (P ¼ 0.05) derived MSCs (Fig. 4C), supporting that FAK mediates the
in newly diagnosed MDS (Fig. 2B). This result was not found interactions.
for FAK levels in CD34þCD38 cells (not shown).
We next compared FAK levels in MDS patients not transformed Inhibition of FAK decreases viability and induces apoptosis of
(n ¼ 83) with those later transformed to AML (n ¼ 26) and found leukemia cells
significantly higher FAK in the latter group (P ¼ 0.013 or 0.022 by To determine the role of FAK in leukemia cell growth and
F or Kruskal-Wallis H test, respectively; Fig. 2C). We then com- survival, we first determined the expression of FAK and p-FAKy397
pared FAK levels between de novo (n ¼ 262) and MDS-transformed in AML cell lines (Fig. 5A). We then treated these cell lines with
(n ¼ 127) AML and found significantly higher FAK (P < 106 by FAK inhibitor VS-4718. VS-4718 potently decreased viable cell
either F or Kruskal-Wallis H test) in MDS-transformed AML numbers in all the leukemia cell lines tested (IC50 range from
patients (Fig. 2C). 90 nmol/L toPublished OnlineFirst March 7, 2017; DOI: 10.1158/1535-7163.MCT-16-0719
Carter et al.
A CD34+ cells from newly diagnosed CD34+CD38– cells from newly
MDS samples (n = 116) diagnosed MDS samples (n = 47)
Relapse
CD34+
12
6
PBMC Relapse
CD133+ CD34+
PBMC
P = 5.42 ×10⁻²⁰
10
CD133+
5
P = 7.62 ×10⁻⁹
Frequency
4
8
Frequency
3
6
CD34+ cells CD34+ cells
from normal from normal
2
4
controls controls (n = 16)
(n = 16)
1
2
0
0
–2 0 2 4 –3 –2 –1 0 1
Log2 Concentration Log2 Concentration
B
1.0
FAK[–2.24,–0.345]N = 29
FAK[–0.345,–0.0895]N = 29
FAK[–0.0895,–0.278]N = 29
FAK[0.278,4.63]N = 29
0.8
OS Probability
P = 0.05
0.6
0.4
0.2
0.0
0 100 200 300 400 500
Time (weeks)
C MDS Cohort AML Cohort
5 F(1,107) = 6.35, 3 F(1,398)
P = 0.013;
= 25.9049,
4 KW(1,109) = 5.27, P = 0.00000;
P = 0.022 2
KW(1,400)
3
FAK Level (log2)
FAK Level (log2)
= 24.0188,
P = 0.00000
1
2
1 0
0
–1
–1
–2
–2 Median
Median 25%-75%
25%-75% Non-outlier range
–3 Non-outlier range –3 Outliers
Outliers Extremes
MDS MDS to AML Extremes De novo AML AML from MDS
n = 83 n = 26 n = 262 n = 127
Figure 2.
FAK expression and patient characteristics in MDS. A, FAK levels determined by RPPA in CD34þ and CD34þCD38 cells from newly diagnosed MDS patient samples
and CD34þ cells from normal controls. B, FAK levels in CD34þ cells from newly diagnosed MDS patient samples determined by RPPA and patients' OS. C,
Comparisons of FAK levels between MDS patients not transformed and later transformed to AML and between de novo and MDS-transformed AML patients
(Statistica, Version 12).
1138 Mol Cancer Ther; 16(6) June 2017 Molecular Cancer Therapeutics
Downloaded from mct.aacrjournals.org on January 30, 2021. © 2017 American Association for Cancer Research.Published OnlineFirst March 7, 2017; DOI: 10.1158/1535-7163.MCT-16-0719
FAK in AML and MDS
A C
>2Published OnlineFirst March 7, 2017; DOI: 10.1158/1535-7163.MCT-16-0719
Carter et al.
A OCI-AML3, 24 h B 75 OCI-AML3, 6 h
75
50
% Migration
% Adhesion
50
25 25
0 0
Control 1.25 2.5 Control 1.25 2.5
VS-4718, (μmol/L) VS-4718, (μmol/L)
90 90
CD45+ AnnV/7AAD+ (%)
CD45+ AnnV/7AAD+ (%)
Floating
Insert
Attached
60 60 Migrated
30 30
0 0
Control 1.25 2.5 Control 1.25 2.5
VS-4718, (μmol/L) VS-4718, (μmol/L)
C
OCI-AML3 45 45
24 h 6h
% Adhesion
30 30
% Migration
Vector shRNA shRNA
control 1 2
FAK 15 15
β-Actin
0 0
Vector shRNA1 shRNA2 Vector shRNA1 shRNA2
control control
Figure 4.
Inhibition of FAK decreases AML–MSC interactions. A, OCI-AML3 cells added to human bone marrow–derived MSCs plated the night before and treated with VS-4718.
At 24 hours, the attached and floating cells (i.e., total cells) were counted, and the fraction of the attached per the total cells calculated. B, Migration of
OCI-AML3 toward MSCs was determined 6 hours after cells were treated with VS-4718 using transwell plates. Viability of both floating and adherent or migrated and
nonmigrated leukemia cells was determined by measuring Annexin V/7AAD positivity in CD45þ cells. C, Adhesion and migration of FAK knockdown and
vector control OCI-AML3 cells to MSCs.
bone marrow microenvironment signals to leukemia cells. VS- cells by IHC staining of human CD45þ cells (Fig. 6B). VS-4718–
4718 induced cell death in leukemia cell lines with variable treated mice survived significantly longer than the untreated
potencies, even in cells cocultured with MSCs (Fig. 5C). controls (medium survival 27 vs. 20 days, P ¼ 0.0003; Fig.
6C). No weight loss or other treatment-related toxicities were
Inhibition of FAK by VS-4718 exerts antileukemia activity in vivo observed. One mouse in the treatment group died of causes
in human AML xenografted NSGS mice unrelated to the experiment.
To explore the role of FAK in an in vivo model of AML, NSGS
mice were injected with Molm14-GFP/Luc cells and treated with
75 mg/kg VS-4718 twice a day via oral gavage for 16 days Discussion
following the experimental scheme shown in Fig. 6A. We demonstrate in this study that FAK is expressed in AML
VS-4718–treated mice had decreased leukemia burden by in vivo patient samples and that high expression is associated with
imaging, lower human CD45 positivity in peripheral blood by unfavorable cytogenetics. FAK, activated in AML cells by the
flow cytometry analysis, and less tissue infiltration of leukemia bone marrow microenvironment, promotes leukemia/stroma
1140 Mol Cancer Ther; 16(6) June 2017 Molecular Cancer Therapeutics
Downloaded from mct.aacrjournals.org on January 30, 2021. © 2017 American Association for Cancer Research.Published OnlineFirst March 7, 2017; DOI: 10.1158/1535-7163.MCT-16-0719
FAK in AML and MDS
A OCI-
MoIm13 AML3 KG-1 MV4-11 HL-60 THP-1 MoIm14 KG1-a
p-FAKy397
FAK
β-Actin
B MoIm13-alone
IC50 (μmol/L)
0.09 MoIm13-cocx
IC50 (μmol/L)
0.11
48 h OCI-AML3-alone 48 h 0.53
0.12 OCI-AML3-cocx
CD45+ Viable cells (mol/L/mL)
CD45+ Viable cells (mol/L/mL)
KG1-alone 1.61 1.5 KG1-cocx 2.07
1.5
MV4-11-alone 0.09 MV4-11-cocx 0.20
HL60-alone 0.29 HL60-cocx 0.23
THP-1-alone 1.86 THP-1-cocx 0.59
Molm14-alone 0.14 Molm14-cocx 0.16
1.0 1.0
KG-1a-alone 0.57 KG-1a-cocx 1.02
0.5 0.5
Figure 5.
VS-4718 decreases cell viability and
induces apoptosis in leukemia cell
lines. A, Expression of p-FAK and 0.0 0.0
total FAK in various leukemia cell 0.00 0.04 0.12 0.37 1.11 3.33 0.00 0.04 0.12 0.37 1.11 3.33
lines. B, VS-4718 decreases viable cell VS-4718 (μmol/L) VS-4718 (μmol/L)
counts of various leukemia cell lines
cultured alone or cocultured with
human bone marrow–derived MSCs Alone-48 h Coculture-48 h
(top); bottom, correlation of p-FAK 0.15 R = 0.26 P = 0.54 0.15 R = 0.73 P = 0.04
P-FAK/β-Actin
P-FAK/β-Actin
expression and IC50 of VS-4718 in
these cells. C, VS-4718 induces 0.1 0.1
apoptosis of various leukemia cell
0.05 0.05
lines cultured alone or cocultured
with MSCs. Cells were treated with 0 0
VS-4718 for 48 hours. 0 0.5 1 1.5 2 2.5 0 0.5 1 1.5 2 2.5
IC50 IC50
C 48 h EC50 (μmol/L) 48 h EC50 (μmol/L)
MoIm13-alone 1.30 100 MoIm13-cocx 2.62
100 OCI-AML3-alone 28.0 OCI-AML3-cocx 150.1
KG1-alone 325.7 KG1-cocx 526.8
CD45+AnnV+/7AAD+
MV4-11-alone 3.9 MV4-11-cocx 5.37
CD45+AnnV+/7AAD+
HL60-alone 28.5 75
75 HL60-cocx 24.2
THP-1-alone >1000 THP-1-cocx >1000
Molm14-alone 0.9 Molm14-cocx 1.87
KG-1a-alone 17.1 50 KG-1a-cocx 17.8
50
25 25
0 0
0.00 0.04 0.12 0.37 1.11 3.33 0.00 0.04 0.12 0.37 1.11 3.33
VS-4718 (μmol/L) VS-4718 (μmol/L)
interaction and supports the survival of leukemia cells. FAK were performed in subsets of patients with intermediate cytoge-
inhibition decreases viability of leukemia cells in vitro and netics, intermediate cytogenetics with or without FLT3-ITD muta-
prolongs mouse survival in a human AML xenograft model. tions, or unfavorable cytogenetics, we did not find an FAK level
There were significantly higher FAK levels in relapsed versus impact OS either. These findings may in part be due to the highly
paired newly diagnosed AML samples, suggesting that high FAK heterogeneous genetic and epigenetic backgrounds of AML
expression contributes to drug-acquired or intrinsic resistance in patients and to the fact that leukemia cell signaling is regulated
AML. FAK was reported by others to predict poor prognosis in and compensated by multiple interconnected signaling pathways.
patients with AML (14, 15). Although we observed a significant For example, we found that FAK expression was significantly
difference in remission duration in AML patients with different lower in patients with FLT3-ITD or RAS mutations, suggesting
FAK levels (the shortest in patients with FAK levels higher than that FAK signaling and FLT3/RAS signaling may compensate each
normal controls), we did not find significant differences in OS other. Although FAK plays multiple roles to support cancer cell
among these patients based on their FAK levels. When the analyses survival, it, by itself, may not be sufficient to predict AML patient
www.aacrjournals.org Mol Cancer Ther; 16(6) June 2017 1141
Downloaded from mct.aacrjournals.org on January 30, 2021. © 2017 American Association for Cancer Research.Published OnlineFirst March 7, 2017; DOI: 10.1158/1535-7163.MCT-16-0719
Carter et al.
MoIm14-
A GFP/Luc
Imaging Imaging Imaging PB and
treatment started treatment end tissue collection
NSGS mice
Experiment day 0 5 13 21 25
Treatment day 1 8 16 20
B Controls 75 mg/kg
Quantitative analysis
ROI Total flux (photons/sec)
×105 5.E+09
Day 5
before the P = 0.023
4.E+09
treatment
Control
3.E+09
75 mg
Day 21 2.E+09
end of the ×108
treatment 1.E+09
0.E+00
Radiance 0 Day 8 Days 16 Days
(p/sec/cm2/sr)
Days (post treatment)
20 PB
Bone marrow Liver Lung Spleen
15 P = 0.055
hCD45+ %
10 Control
5
0 75 mg/kg
Ctrl 75 mg
n=7 n = 10
C Median survival
100
Control 20 days
80
Percent survival
75 mg/kg 27 days
60
40 P = 0.0003
20 Treatment twice a day
0
0 2 4 6 8 10 12 14 16 18 20 22 24 26 28 30
Days
Figure 6.
Inhibition of FAK by VS-4718 exerts antileukemia activity in vivo. NSGS mice injected with Molm14-GFP/Luc cells were treated with VS-4718. A, Experimental scheme.
B, IVIS in vivo image, flow cytometric measurement of human CD45 cells in mouse peripheral blood, and IHC staining of human CD45 cells in various tissues
(20) of the mice treated with VS-4718 or untreated controls. C, Mouse survival curves.
OS. Reports from Tavernier-Tardy and colleagues (15) demon- analysis cannot detect cell localization, and CXCR4 and VLA4
strated that AML patients with combined overexpression of two or were not included in our RPPA panels.
three adhesion proteins, including CXCR4, VLA4, and FAK, had a The ITG/FAK/SRC signaling cascade is a well-established path-
significantly shorter OS. In that study, flow cytometry was used to way that translates environmental signaling and activates multi-
determine functional cell surface CXCR4 and VLA4 levels. RPPA ple intracellular signaling pathways to support cell growth and
1142 Mol Cancer Ther; 16(6) June 2017 Molecular Cancer Therapeutics
Downloaded from mct.aacrjournals.org on January 30, 2021. © 2017 American Association for Cancer Research.Published OnlineFirst March 7, 2017; DOI: 10.1158/1535-7163.MCT-16-0719
FAK in AML and MDS
survival. ITGb3 was identified by in vivo RNAi screening to be with the progression of MDS (37). It is possible that aberrantly
essential for leukemia cells but not for normal hematopoietic high levels of chemokines and cytokines and upregulated NFkB
stem/progenitor cells (31). We observed that AML samples expres- signaling induce overexpression of FAK in MDS, but the asso-
sing high ITGb3 simultaneously expressed high levels of FAK and ciation with disease severity and progression has yet to be
p-SRCY416. The data suggest a functional role of ITG/FAK/SRC determined. Interestingly, we found FAK expression was sig-
signaling in AML cells. We demonstrate that FAK in AML cells is nificantly higher in MDS patients who later transformed to
induced by cytokines and MSCs and that FAK regulates AML–MSC compared with those who did not transform to AML and in
interactions. Interestingly, it was previously reported that FAK in AML patients who transformed from MDS compared with
AML cells modulates the function of MSCs (32), suggesting that those with de novo AML, suggesting functional importance of
FAK can facilitate the bidirectional cross-talk between leukemic FAK expression in AML and MDS patients.
cells and the bone marrow microenvironment. Collectively, our data suggest that FAK regulates leukemia–
Although VS-4718 reduced cell viability in all tested AML cell stromal interactions and supports leukemia cell survival and
lines, Molm14, Molm13, and MV4-11, all harboring the FLT3-ITD hence is a potential therapeutic target in myeloid leukemia.
mutation, were the most sensitive. It was previously shown that in Combination strategies may improve the efficacy of FAK inhibi-
addition to FAK, VS-4718 has activities against other kinases, tion in AML, which is currently under investigation.
particularly FLT3 by in vitro kinase profiling (33). We do not
exclude that VS-4718 can inhibit FLT3 and other kinases in a Disclosure of Potential Conflicts of Interest
biochemical assay. However, at the doses used, VS-4718 was able No potential conflicts of interest were disclosed.
to decrease FAK but not p-FLT3 or FLT3 in AML cell lines or patient
samples by either Western blot or CyTOF analysis. Interestingly, Authors' Contributions
VS-4718 decreased FLT3 downstream signaling proteins p-AKT Conception and design: B.Z. Carter, H. Yang, G. Garcia-Manero, J.A. Pachter,
S. Kornblau
and p-STAT5, independent of FLT3 mutation status. FLT3-mutat-
Development of methodology: P.Y. Mak, G. Garcia-Manero, Y. Qiu,
ed cells may depend more than wild-type cells on these signaling S. Kornblau
proteins for growth and survival. Acquisition of data (provided animals, acquired and managed patients,
Inhibition of FAK by VS-4718 for only 16 days significantly provided facilities, etc.): P.Y. Mak, X. Wang, H. Yang, G. Garcia-Manero,
prolongs survival of leukemia-engrafted mice, which may possi- D.H. Mak, H. Mu, V.R. Ruvolo, S. Kornblau
bly be extended by prolonged inhibition. Although inhibition of Analysis and interpretation of data (e.g., statistical analysis, biostatistics,
computational analysis): B.Z. Carter, P.Y. Mak, X. Wang, H. Yang, G. Garcia-
FAK significantly prolonged survival of leukemia-engrafted mice
Manero, D.H. Mak, K. Coombes, N. Zhang, B. Ragon, S. Kornblau
and greatly suppressed cell growth in all the cell lines tested (IC50 < Writing, review, and/or revision of the manuscript: B.Z. Carter, X. Wang,
2 mmol/L) and was also effective under MSC coculture at a H. Yang, G. Garcia-Manero, K. Coombes, B. Ragon, D.T. Weaver, J.A. Pachter,
clinically achievable dose (about 3 mmol/L) in vitro, it was less M. Andreeff
potent in inducing cell death, suggesting combined strategies are Administrative, technical, or material support (i.e., reporting or organizing
needed for enhancing cytotoxic efficacy, which is currently under data, constructing databases): P.Y. Mak, G. Garcia-Manero, V.R. Ruvolo
Study supervision: B.Z. Carter
investigation. In addition, a recent study demonstrated that FAK
Other (partially supported the study): B.Z. Carter
splice variants are overexpressed in stem/progenitor cells of AML
patients with poor prognosis and maintain primitive AML cells,
Acknowledgments
suggesting that targeting FAK has the potential to eliminate AML We thank Numsen Hail for editorial support and assistance with the
stem/progenitor cells (34). Inhibition of FAK in combination preparation of the manuscript.
with agents that potently eliminate bulk leukemia cells may be
more effective in the eradication of various leukemic subpopula- Grant Support
tions supported by a recent study in Phþ B-ALL showing synergism This work was supported in part by the University Cancer Foundation via the
of combined inhibition of FAK and Bcr-Abl tyrosine kinase (12). Institutional Research Grant program at the University of Texas MD Anderson
Although FAK expression tended to positively impact survival in Cancer Center (to B.Z. Carter), grants from the NIH (P01CA055164), Cancer
MDS, overexpression of FAK in CD34þ cells from MDS patients Prevention Research Institute of Texas (CPRIT, RP121010), the Paul and Mary
Haas Chair in Genetics (to M. Andreeff), and MD Anderson's Cancer Center
may also suggest that FAK signaling is involved in the pathogenesis Support Grant CA016672 (Flow Cytometry and Cellular Image Facility and
of the disease. It was reported that the 50 -flanking region of FAK Characterized Cell Line Core).
promoter contains several potential transcription factor–binding The costs of publication of this article were defrayed in part by the payment of
sites, including NFkB-binding sites (35). Inhibition of NFkB page charges. This article must therefore be hereby marked advertisement in
decreased and activation of NFkB by TNFa induced FAK transcrip- accordance with 18 U.S.C. Section 1734 solely to indicate this fact.
tion. The presence of abnormal levels of cytokines and chemo-
kines, such as TNFa, in MDS patients have been extensively Received October 27, 2016; revised November 11, 2016; accepted January 29,
documented (36). Elevated NFkB signaling has been correlated 2017; published OnlineFirst March 7, 2017.
References
1. Lee TS, Lin JJ, Huo YN, Lee WS. Progesterone inhibits endothelial cell 3. Chen HC, Chan PC, Tang MJ, Cheng CH, Chang TJ. Tyrosine phosphor-
migration through suppression of the rho activity mediated by cSrc ylation of focal adhesion kinase stimulated by hepatocyte growth factor
activation. J Cell Biochem 2015;116:1411–8. leads to mitogen-activated protein kinase activation. J Biol Chem
2. Frame MC, Patel H, Serrels B, Lietha D, Eck MJ. The FERM domain: 1998;273:25777–82.
organizing the structure and function of FAK. Nat Rev Mol Cell Biol 4. Sulzmaier FJ, Jean C, Schlaepfer DD. FAK in cancer: mechanistic findings
2010;11:802–14. and clinical applications. Nat Rev Cancer 2014;14:598–610.
www.aacrjournals.org Mol Cancer Ther; 16(6) June 2017 1143
Downloaded from mct.aacrjournals.org on January 30, 2021. © 2017 American Association for Cancer Research.Published OnlineFirst March 7, 2017; DOI: 10.1158/1535-7163.MCT-16-0719
Carter et al.
5. Serrels A, Lund T, Serrels B, Byron A, McPherson RC, von Kriegsheim A, et al. analysis of primary leukemia specimens and hematopoietic stem cells. Mol
Nuclear FAK controls chemokine transcription, Tregs, and evasion of anti- Cancer Ther 2006;5:2512–21.
tumor immunity. Cell 2015;163:160–73. 23. Carter BZ, Qiu Y, Huang X, Diao L, Zhang N, Coombes KR, et al. Survivin is
6. Jiang H, Hegde S, Knolhoff BL, Zhu Y, Herndon JM, Meyer MA, et al. highly expressed in CD34(þ)38(-) leukemic stem/progenitor cells and
Targeting focal adhesion kinase renders pancreatic cancers responsive to predicts poor clinical outcomes in AML. Blood 2012;120:173–80.
checkpoint immunotherapy. Nat Med 2016;22:851–60. 24. Carter BZ, Qiu YH, Zhang N, Coombes KR, Mak DH, Thomas DA, et al.
7. Hess AR, Postovit LM, Margaryan NV, Seftor EA, Schneider GB, Seftor RE, Expression of ARC (apoptosis repressor with caspase recruitment domain),
et al. Focal adhesion kinase promotes the aggressive melanoma phenotype. an antiapoptotic protein, is strongly prognostic in AML. Blood 2011;
Cancer Res 2005;65:9851–60. 117:780–7.
8. Park JH, Lee BL, Yoon J, Kim J, Kim MA, Yang HK, et al. Focal adhesion 25. Romano P, Manniello A, Aresu O, Armento M, Cesaro M, Parodi B. Cell
kinase (FAK) gene amplification and its clinical implications in gastric Line Data Base: structure and recent improvements towards molecular
cancer. Hum Pathol 2010;41:1664–73. authentication of human cell lines. Nucleic Acids Res 2009;37:D925–32.
9. Sood AK, Armaiz-Pena GN, Halder J, Nick AM, Stone RL, Hu W, et al. 26. Kojima K, McQueen T, Chen Y, Jacamo R, Konopleva M, Shinojima N, et al.
Adrenergic modulation of focal adhesion kinase protects human ovarian p53 activation of mesenchymal stromal cells partially abrogates microen-
cancer cells from anoikis. J Clin Invest 2010;120:1515–23. vironment-mediated resistance to FLT3 inhibition in AML through HIF-
10. Lee BY, Timpson P, Horvath LG, Daly RJ. FAK signaling in human cancer as 1alpha-mediated down-regulation of CXCL12. Blood 2011;118:4431–9.
a target for therapeutics. Pharmacol Ther 2015;146:132–49. 27. Studeny M, Marini FC, Champlin RE, Zompetta C, Fidler IJ, Andreeff M.
11. Shapiro IM, Kolev VN, Vidal CM, Kadariya Y, Ring JE, Wright Q, et al. Merlin Bone marrow-derived mesenchymal stem cells as vehicles for interferon-
deficiency predicts FAK inhibitor sensitivity: a synthetic lethal relationship. beta delivery into tumors. Cancer Res 2002;62:3603–8.
Sci Transl Med 2014;6:237ra68. 28. Carter BZ, Mak PY, Chen Y, Mak DH, Mu H, Jacamo R, et al. Anti-apoptotic
12. Churchman ML, Evans K, Richmond J, Robbins A, Jones L, Shapiro IM, et al. ARC protein confers chemoresistance by controlling leukemia-microenvi-
Synergism of FAK and tyrosine kinase inhibition in Phþ B-ALL. JCI Insight ronment interactions through a NFkB/IL1b signaling network. Oncotarget
2016;1:e86082. 2016;7:20054–67.
13. Tabe Y, Konopleva M. Advances in understanding the leukaemia micro- 29. Carter BZ, Mak PY, Mu H, Zhou H, Mak DH, Schober W, et al. Combined
environment. Br J Haematol 2014;164:767–78. targeting of BCL-2 and BCR-ABL tyrosine kinase eradicates chronic myeloid
14. Recher C, Ysebaert L, Beyne-Rauzy O, Mansat-De Mas V, Ruidavets JB, leukemia stem cells. Sci Transl Med 2016;8:355ra117.
Cariven P, et al. Expression of focal adhesion kinase in acute myeloid 30. Han L, Qiu P, Zeng Z, Jorgensen JL, Mak DH, Burks JK, et al. Single-cell mass
leukemia is associated with enhanced blast migration, increased cellularity, cytometry reveals intracellular survival/proliferative signaling in FLT3-ITD-
and poor prognosis. Cancer Res 2004;64:3191–7. mutated AML stem/progenitor cells. Cytometry A 2015;87:346–56.
15. Tavernier-Tardy E, Cornillon J, Campos L, Flandrin P, Duval A, Nadal N, 31. Miller PG, Al-Shahrour F, Hartwell KA, Chu LP, Jaras M, Puram RV, et al.
et al. Prognostic value of CXCR4 and FAK expression in acute myelogenous In vivo RNAi screening identifies a leukemia-specific dependence on integ-
leukemia. Leukemia Res 2009;33:764–8. rin beta 3 signaling. Cancer Cell 2013;24:45–58.
16. Cho BS, Zeng ZH, Mu H, Wang ZQ, Konoplev S, McQueen T, et al. 32. Despeaux M, Labat E, Gadelorge M, Prade N, Bertrand J, Demur C, et al.
Antileukemia activity of the novel peptidic CXCR4 antagonist LY2510924 Critical features of FAK-expressing AML bone marrow microenvironment
as monotherapy and in combination with chemotherapy. Blood 2015; through leukemia stem cell hijacking of mesenchymal stromal cells.
126:222–32. Leukemia 2011;25:1789–93.
17. Nervi B, Ramirez P, Rettig MP, Uy GL, Holt MS, Ritchey JK, et al. Chemo- 33. Tanjoni I, Walsh C, Uryu S, Tomar A, Nam JO, Mielgo A, et al. PND-1186
sensitization of acute myeloid leukemia (AML) following mobilization by FAK inhibitor selectively promotes tumor cell apoptosis in three-dimen-
the CXCR4 antagonist AMD3100. Blood 2009;113:6206–14. sional environments. Cancer Biol Ther 2010;9:764–77.
18. Uy GL, Rettig MP, Motabi IH, McFarland K, Trinkaus KM, Hladnik LM, et al. 34. Despeaux M, Chicanne G, Rouer E, De Toni-Costes F, Bertrand J, Mansat-
A phase 1/2 study of chemosensitization with the CXCR4 antagonist De Mas V, et al. Focal adhesion kinase splice variants maintain primitive
plerixafor in relapsed or refractory acute myeloid leukemia. Blood 2012; acute myeloid leukemia cells through altered Wnt signaling. Stem Cells
119:3917–24. 2012;30:1597–610.
19. Zeng Z, Shi YX, Samudio IJ, Wang R, Ling X, Frolova. Targeting the leukemia 35. Golubovskaya V, Kaur A, Cance W. Cloning and characterization of
microenvironment by CXCR4 inhibition overcomes resistance to kinase the promoter region of human focal adhesion kinase gene: nuclear
inhibitors and chemotherapy in AML. Blood 2009;113:6215–24. factor kappa B and p53 binding sites. Biochim Biophys Acta 2004;
20. Jacamo R, Chen Y, Wang Z, Ma W, Zhang M, Spaeth EL, et al. Reciprocal 1678:111–25.
leukemia-stroma VCAM-1/VLA-4-dependent activation of NF-kappaB 36. Kitagawa M, Saito I, Kuwata T, Yoshida S, Yamaguchi S, Takahashi M, et al.
mediates chemoresistance. Blood 2014;123:2691–702. Overexpression of tumor necrosis factor (TNF)-alpha and interferon (IFN)-
21. Kornblau SM, Qutub A, Yao H, York H, Qiu YH, Graber D, et al. Proteomic gamma by bone marrow cells from patients with myelodysplastic syn-
profiling identifies distinct protein patterns in acute myelogenous leuke- dromes. Leukemia 1997;11:2049–54.
mia CD34þCD38- stem-like cells. PLoS One 2013;8:e78453. 37. Kerbauy DM, Lesnikov V, Abbasi N, Seal S, Scott B, Deeg HJ. NF-kappaB
22. Tibes R, Qiu Y, Lu Y, Hennessy B, Andreeff M, Mills GB, et al. Reverse phase and FLIP in arsenic trioxide (ATO)-induced apoptosis in myelodysplastic
protein array: validation of a novel proteomic technology and utility for syndromes (MDSs). Blood 2005;106:3917–25.
1144 Mol Cancer Ther; 16(6) June 2017 Molecular Cancer Therapeutics
Downloaded from mct.aacrjournals.org on January 30, 2021. © 2017 American Association for Cancer Research.Published OnlineFirst March 7, 2017; DOI: 10.1158/1535-7163.MCT-16-0719
Focal Adhesion Kinase as a Potential Target in AML and MDS
Bing Z. Carter, Po Yee Mak, Xiangmeng Wang, et al.
Mol Cancer Ther 2017;16:1133-1144. Published OnlineFirst March 7, 2017.
Updated version Access the most recent version of this article at:
doi:10.1158/1535-7163.MCT-16-0719
Supplementary Access the most recent supplemental material at:
Material http://mct.aacrjournals.org/content/suppl/2017/03/04/1535-7163.MCT-16-0719.DC1
Cited articles This article cites 37 articles, 16 of which you can access for free at:
http://mct.aacrjournals.org/content/16/6/1133.full#ref-list-1
Citing articles This article has been cited by 2 HighWire-hosted articles. Access the articles at:
http://mct.aacrjournals.org/content/16/6/1133.full#related-urls
E-mail alerts Sign up to receive free email-alerts related to this article or journal.
Reprints and To order reprints of this article or to subscribe to the journal, contact the AACR Publications Department at
Subscriptions pubs@aacr.org.
Permissions To request permission to re-use all or part of this article, use this link
http://mct.aacrjournals.org/content/16/6/1133.
Click on "Request Permissions" which will take you to the Copyright Clearance Center's (CCC)
Rightslink site.
Downloaded from mct.aacrjournals.org on January 30, 2021. © 2017 American Association for Cancer Research.You can also read