AN INTEGRIN ΑEΒ7-DEPENDENT MECHANISM OF IGA TRANSCYTOSIS REQUIRES DIRECT PLASMA CELL CONTACT WITH INTESTINAL EPITHELIUM
←
→
Page content transcription
If your browser does not render page correctly, please read the page content below
www.nature.com/mi

ARTICLE                  OPEN

An integrin αEβ7-dependent mechanism of IgA transcytosis
requires direct plasma cell contact with intestinal epithelium
Mauricio Guzman1,2, Luke R. Lundborg1,2, Shaila Yeasmin1,2, Christopher J. Tyler1,2, Nadia R. Zgajnar1,2, Vanessa Taupin3,
                                                                                              ✉
Katarzyna Dobaczewska4, Zbigniew Mikulski4, Giorgos Bamias5 and Jesús Rivera-Nieves 1,2

This is a U.S. government work and not under copyright protection in the U.S.; foreign copyright protection may apply 2021

    Efficient IgA transcytosis is critical for the maintenance of a homeostatic microbiota. In the canonical model, locally-secreted dimeric
    (d)IgA reaches the polymeric immunoglobulin receptor (pIgR) on intestinal epithelium via simple diffusion. A role for integrin αE
    (CD103)β7 during transcytosis has not been described, nor its expression by intestinal B cell lineage cells. We found that αE-
    deficient (αE−/−) mice have a luminal IgA deficit, despite normal antibody-secreting cells (ASC) recruitment, local IgA production
    and increased pIgR expression. This deficit was not due to dendritic cell (DC)-derived retinoic acid (RA) nor class-switching defects,
    as stool from RAG−/− mice reconstituted with αE−/− B cells was also IgA deficient. Flow cytometric, ultrastructural and
    transcriptional profiling showed that αEβ7-expressing ASC represent an undescribed subset of terminally-differentiated intestinal
    plasma cells (PC) that establishes direct cell to cell contact with intestinal epithelium. We propose that IgA not only reaches pIgR
    through diffusion, but that αEβ7+ PC dock with E-cadherin-expressing intestinal epithelium to directly relay IgA for transcytosis into
    the intestinal lumen.

    Mucosal Immunology; https://doi.org/10.1038/s41385-021-00439-x

INTRODUCTION                                                                                producer of retinoic acid (RA)11, critical for induction of a gut-
Secretory Immunoglobulin A (SIgA) is critical for the control of the                        homing phenotype, regulatory T cells (Treg) and IgA class-
intestinal microbiota. Therefore, luminal IgA levels are tightly                            switching.12–14 However, the physiologic role of the integrin in
maintained by a sequence of processes that include B cell                                   this DC subset remains unclear, as CD103−/− DC are not impaired
progenitor production at the bone marrow, naïve B cell migration                            on their ability to imprint a gut-homing phenotype to T cells.15
to inductive sites, (e.g., Peyer Patches (PP)), immunoglobulin (Ig)A                        αEβ7 has also been reported in a subset of B cells at the nasal
class-switching in germinal centers, IgA plasmablast egress and                             mucosa and the head and neck.16,17 In the intestine, by contrast,
recruitment into intestinal lamina propria (LP), maturation/survival                        neither its expression by cells of the B cell lineage nor its potential
of plasma cells (PC), local IgA production by antibody-secreting                            involvement in IgA luminal transport have been recognized.18
cells (ASC), and polymeric Immunoglobulin receptor (pIgR)-                                  Here, we report on an undescribed subset of terminally-
mediated epithelial transcytosis into the intestinal lumen. Both                            differentiated αEβ7-expressing IgA+ PC that establish direct
integrin β7- and MAdCAM-1-deficient mice exhibit underdeve-                                  contact with E-cadherin/pIgR-expressing IEC. We identify a new
loped PP and an IgA + ASC deficit in the LP, underlining the                                 role for αEβ7 during IgA transcytosis and propose a novel
importance of integrin α4β7:MAdCAM-1 interactions for naïve B                               mechanism of direct IgA relay to IEC by PC for its transcytosis
cell migration to PP and intestinal recruitment of IgA plasma-                              into the intestinal lumen.
blasts.1–3 In contrast, the expression and functions of integrin αE
(CD103)β7 appear to be much narrower.
   αEβ7 was first described as the HML-1 antigen generated by                                RESULTS
immunization of mice with human intestinal intraepithelial                                  Fecal IgA is lower in integrin αE-deficient mice despite normal
lymphocytes (IEL).4 Subsequently, the antibodies HML-1 and                                  B cell recruitment, IgA production and increased pIgR mRNA
B-Ly7 were identified to recognize the same molecule: integrin                               expression
αE,5 expressed abundantly on the cell surface of malignant B cells.                         β7-deficient mice (β7−/−) have dual integrins α4β7 and αEβ7
CD103 is widely used as a surface marker for hairy cell leukemia, a                         deficits. IgA ASC are decreased in their intestinal lamina propria.
B cell cancer.6 αEβ7 is expressed by intraepithelial lymphocytes                            This finding is attributable to the absence of α4β7/MAdCAM-1-
(IEL)7 and mediates their interactions with intestinal epithelial cells                     mediated ASC recruitment rather than to the αEβ7 defect, as this
(IEC) via E-cadherin.8,9 A mucosal dendritic cell (DC) subset also                          is also observed in MAdCAM-1-deficient mice1,3. The maintenance
expresses αEβ7.10 This DC subset was later found to be a major                              of luminal secretory (S)IgA levels is dependent on several

1
 Gastroenterology Section, San Diego VA Medical Center, La Jolla Village Drive, San Diego, CA, USA. 2Division of Gastroenterology, Department of Medicine, University of
California San Diego, La Jolla, CA, USA. 3Electron Microscopy Core Facility, Department of Cellular and Molecular Medicine, University of California San Diego, La Jolla, CA, USA.
4
 Microscopy and Histology Core, La Jolla Institute of Allergy and Immunology, La Jolla, CA, USA. 5GI Unit, 3rd Academic Department of Internal Medicine, National and
Kapodistrian University of Athens, Sotiria Hospital, Athens, Greece. ✉email: jriveranieves@ucsd.edu

Received: 11 March 2021 Revised: 9 July 2021 Accepted: 31 July 2021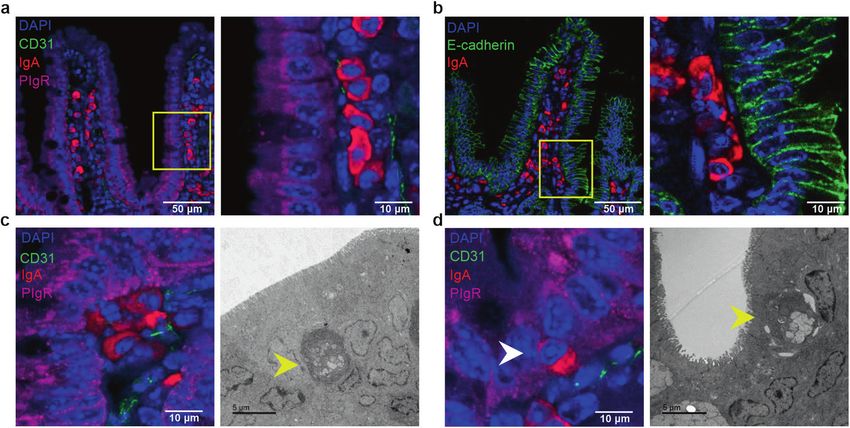
M. Guzman et al.
2
a p < 0.0001 b B6 n.s.
20 p < 0.0001 70 β7–/– n.s.
B6 β7–/–
Fecal IgA (μg/mg protein)
p < 0.0001 104
43 ± 10 9±6
p < 0.0001 αE–/–
60
15 50 PIgR–/– 103
LPMC (%)
0
n.s.
40 10–3
20 ± 7 24 ± 4
10 αE–/– PIgR–/–
CD19
30 10
4
46 ± 10 47 ± 10
5 20
103
10 0
10–3
20 ± 7 25 ± 3
4 5 4 5
0 10 10 0 10 10
B6 β7–/– αE –/– PIgR –/– CD3 CD19 CD3
c
B6 β7–/– αE–/– 50 μm
DAPI E-cadherin IgA
d e f
1234567890();,:
107 105
–/– 15 2.5
B6 β7
LP IgA (μg/mg protein)
p < 0.01
Relative IgA expression
LP IgA+ cells (count)
4
10
p < 0.001 2.0
106 n.s. 0
10 n.s.
10-4 25 ± 6 28 ± 8 1.5
p < 0.01 105
n.s.
αE–/– PIgR–/–
CD19
1.0
105 10
4
5
0
0.5
10
-4
24 ± 4 30 ± 4
4 5 6 4 5 6
0 10 10 10 0 10 10 10
B6 β7–/– αE –/– PIgR–/– IgA B6 β7–/– αE –/– PIgR–/– B6 β7–/– αE –/–
B6 –/–
g n.s. h p < 0.01 i αE
PIgR expression (IntDen × 105)
12 p < 0.01 8
Relative PIgR expression
p < 0.0001
6
8
4
4
2
50 μm
B6 β7–/– αE –/– PIgR–/– B6 αE –/– DAPI PIgR
j k 10
5
l IgA–/–
p < 0.001 B6 αE –/–
BC+)
p < 0.0001
60 RAG–/–
4
10
αE–/–
fecal bacteria (% SYBR
B6
Counts
0
FSC-A
40 51% 30% 51%
5
10
IgA–/– RAG–/–
20 10
4 30%
0
0.4% 0.9%
IgA+
5
0 10
αE–/– IgA–/– RAG–/–
0 105 0 105
B6 IgA IgA
processes that include: 1. IgA plasmablast recruitment, 2. local IgA composition of their ileal LP. CD19+ B cells were decreased only
production and 3. pIgR-mediated transcytosis. We measured fecal in the LP of β7−/−, but not in αE−/− mice. By contrast, the
SIgA as a surrogate indicator of the integrity of these processes in percentage of CD3+ T cells was uniformly unaffected (Fig. 1b),
C57BL6 (B6), β7−/− and αE−/− mice, using pIgR-deficient mice suggesting alternate integrin use by T cells for intestinal
(pIgR−/−) as controls. Unexpectedly, not only β7−/− but also αE−/− recruitment. Immunofluorescence (IF) confirmed impaired IgA+
mice had lower fecal IgA than B6 mice (Fig. 1a). To exclude a ASC recruitment only in β7−/− mice but not in αE−/− mice (Fig. 1c).
recruitment deficit, we analyzed the mononuclear cell The T and B cell composition of the spleen and mesenteric lymph
Mucosal Immunology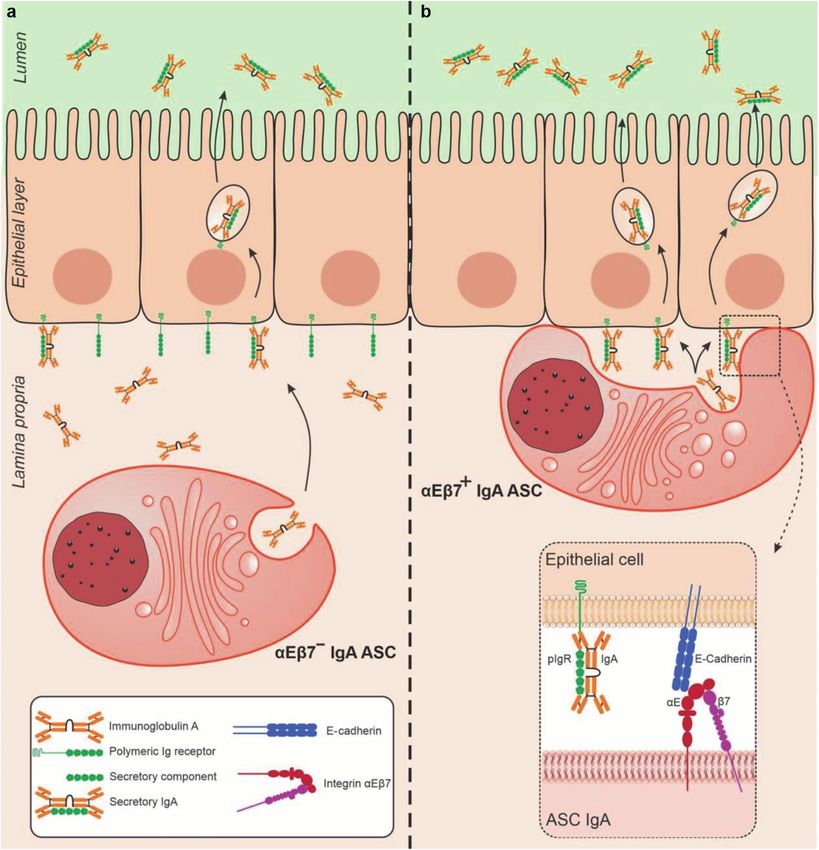
M. Guzman et al.
3
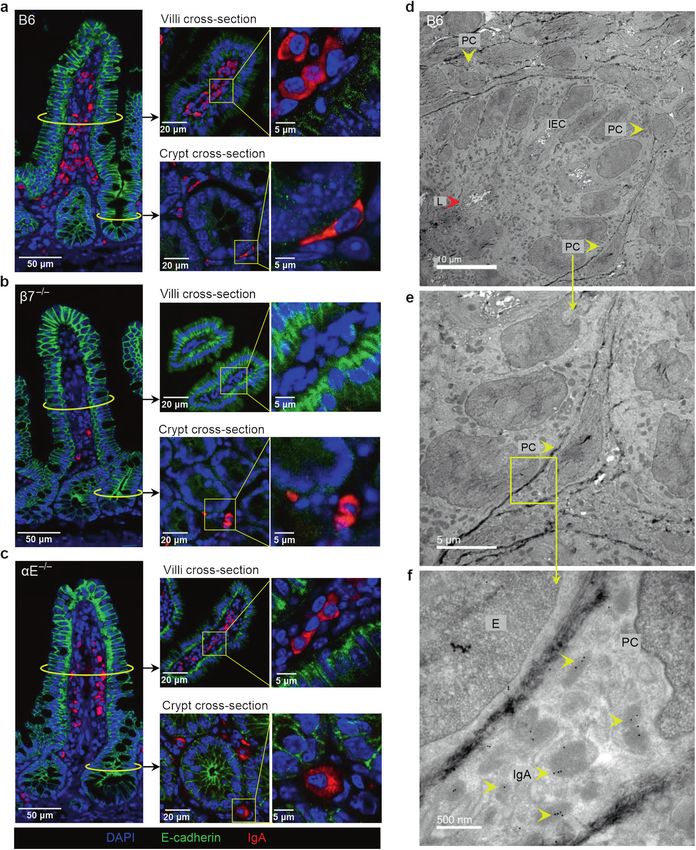
Fig. 1 Integrin αE deficiency leads to a fecal IgA deficit despite normal B cell recruitment, IgA production and increased pIgR mRNA
expression. a Fecal IgA levels measured by ELISA in C57BL/6 (WT), Itgb7−/− (β7−/−), Itgae−/− (αE−/−) and pIgR-deficient (pIgR−/−) mice.
b Percentage of CD3+ and CD19+ cells within the ileal LP of indicated strains and representative contour plots of indicated cell subsets gated
on live, single cellular events. c IF staining of IgA + ASC and E-cadherin, representative coronal images of terminal ileum (TI). d Absolute
numbers and representative dot plots of IgA + ASCs in lamina propria. e LP IgA levels measured by ELISA of indicated strains (f) ileal IgA
mRNA transcripts in ilea of indicated mice (g) pIgR mRNA expression in ileum of indicated mice. h Relative pIgR fluorescence intensity
expressed as integrated density (IntDent, see “Methods”) per villi and (i) representative IF images (j) Percentage of IgA-coated fecal bacteria
measured by flow cytometry and (j, k, l) representative plots and histograms of IgA coating of indicated mouse strains. Each data point (mean
± SD) represent a single mouse with n ≥ 5 from 2 or 3 independent experiments. Statistical significance determined using two-way ANOVA
with Dunnett’s multiple comparisons test.
nodes (MLN) was not different between any strain, in support of As observed with β7−/− or αE−/− mice, pIgR expression was higher in
an intestinal-specific B cell recruitment deficit in β7−/− mice ilea of mice transferred with either β7−/− or αE−/− B cells (both with
(Supplementary Fig. 1a, b). Absolute counts of IgA+, IgD+ and luminal IgA deficits) (Fig. 2g), but not in those receiving B6 B cells. The
IgM+ ASC were also lower only in β7−/− mice, as shown previously percentage of B and T cells in the spleen and MLN of RAG−/− mice
for IgA+ ASC1 (Fig. 1d, Supplementary Fig. 1c, d). Thus, all ASC reconstituted with either β7−/− or αE−/− donor cells was normal, as
were reduced in LP of β7−/− mice, not only IgA+ ASC. were the percentages of CD4+ T cells in both the LP and periphery
We then evaluated whether defective local IgA production (Supplementary Fig. 2a–c), confirming effective T and B cell
could account for the luminal IgA deficit. IgA levels within the reconstitution. Thus, our results show that β7−/− B cells, but not
intestinal LP was similar between B6, β7−/− and αE−/− mice αE−/− B cells were impaired in their ability to migrate, populate the LP
(Fig. 1e), whereas pIgR−/− mice had higher levels, as reported or IgA class-switch. Yet, the luminal SIgA deficit persisted. Further-
previously.19 CD19+ B cells from all strains also showed equal more, by utilizing an experimental system in which only B cells lack
ability to IgA class-switch ex vivo (Supplementary Fig. 1e, f). Given the integrin, we exclude a shortfall of RA-producing CD103+ DC as
the remarkable ability of β7−/− mice to maintain luminal SIgA to a the cause for the lower fecal SIgA in β7−/− and αE−/− mice.
level comparable to that of αE−/− mice, despite their marked
recruitment deficit, we examined their IgA mRNA transcripts. A subset of IgA + ASC expressed αEβ7 and had ultrastructural
These were higher in β7−/− mice, suggesting that IgA + ASC may and transcriptional profiles consistent with that of terminally-
sense and adapt to the luminal IgA deficit by enhancing their differentiated plasma cells
production of IgA (Fig. 1f). Surface αEβ7 protein expression on a subset of CD19neg IgA + ASC
As all intraluminal IgA is produced locally and transcytosed by was confirmed by flow cytometry in C57BL6 mice, which
pIgR, we excluded a pIgR deficit as an explanation for the low additionally allowed sorting of ileal LP B cell lineage cells, based
luminal IgA by quantifying ileal pIgR mRNA transcripts.20 Transcripts on CD19, surface IgA expression and co-expression of integrin
were actually higher in both β7−/− and αE−/− mice, compared with subunits αE and β7. We identified 4 main subsets: subset(s) 1
B6 and pIgR−/− mice (Fig. 1g). pIgR upregulation is a second [CD19 + IgAneg], s2 [class switched CD19+ IgA+ plasmablasts], s3
mechanism through which these strains maintain luminal IgA levels. [CD19negIgA+ αEβ7neg PC], and s4 [CD19negIgA+ αEβ7pos PC]
We confirmed PIgR protein overexpression by IF (Fig. 1h, i). (Fig. 3a). S1 was mostly IgD + and a third also IgM positive,
Increased fluorescent signal was quantified in an unbiased fashion suggesting that they were in earlier stages of differentiation
using Fiji ImageJ software. The product of the area and mean (Fig. 3b) and likely originating from inducible lymphoid follicles
intensity (Int Den) were recorded for B6 and αE−/− mice (Fig. 1h). (ILF). Ultrastructurally, transmission electron microscopy (TEM)
Finally, to begin to understand possible in vivo implications of a showed that their nucleocytoplasmic ratio decreased progres-
potential αE-dependent transcytosis defect, we compared fecal sively from s1 through s4(αEβ7+). The latter had abundant rough
bacterial IgA coating in αE−/− and B6 mice, using bacteria from endoplasmic reticulum (RER) and low nucleo:cytoplasmic ratio,
IgA−/− and RAG−/− mice as controls. We observed a significant consistent with terminal differentiation (Fig. 3c, d).
decrease in bacterial IgA coating in stool of αE−/− mice (Fig. 1j, k, i). mRNA was extracted from cell subsets sorted as in Fig. 3a and
Taken together, these findings demonstrate that the fecal IgA their transcriptomic profiles analyzed by RNA-seq (Fig. 3e).
deficit in αE−/− mice could not be explained by impaired B cell/IgA The expression of B cell-related genes representative of distinct
ASC recruitment, local IgA production, IgA class switching nor pIgR stages of B cell maturation23 is shown. Overall, gene expression
expression. Instead, integrin αEβ7 appeared to play an unappre- changed the most upon IgA class switching (CD19+ (s1, 2) vs.
ciated role for the maintenance of luminal SIgA levels and bacterial CD19negIgA + (s3, 4)). IgA class-switched (s3,4) lacked CD19,
IgA coating. known to be shed upon class switching. Similarly, they lacked
other surface proteins that are lost with maturation, such as CD38
Transfer of αE-deficient B cells to RAG−/− mice recapitulated (lost in mouse PC, not human) and CD20. The CD79a and CD79b
the luminal IgA deficit, excluding an αEβ7+ dendritic proteins form a dimer associated with membrane-bound immu-
cell-derived retinoic acid deficit as a cause noglobulin, constituting the B cell receptor (BCR), which dis-
In 1993 a subset of intestinal DC were found to express integrin appears in the later stages of PC differentiation. Along those lines
αEβ7.10 These were later shown to produce RA11, an important factor the costimulatory molecule CD40 on B cells interacts with the
for imprinting a gut-homing (CCR9, α4β7) and regulatory T cell (Treg) CD40L during antigen presentation. The absence of
phenotypes on lymphocytes and for IgA class-switching in ASC.12 To CD40 supports that these cells no longer present antigen, as
examine whether the luminal IgA deficit in αE−/− and β7−/− mice expected for professional PC. Consistent with a PC identity they
could be related to the absence of CD103+ DC and impaired RA expressed syndecan-1 (CD138), a classic marker of mature ASC
synthesis, we co-transferred B6 CD4+ T cells along with CD19+ B cells that binds to extracellular matrix components, integrins, pro-
from B6 (controls), β7−/− or αE−/− B cells into RAG−/− mice, which survival cytokines and chemokines. The B220 gene (Ptprc) which
have an intact DC/RA system21,22 (Fig. 2a). As observed in donor mice, like CD19 is often shed by most mature PC was present at the
fecal SIgA was lower in recipients of β7−/− and αE−/− B cells (Fig. 2b). mRNA but not at the protein level by flow cytometry (not shown).
ELISA, flow cytometry and confocal microscopy analysis showed that Interestingly both IgA+ subsets possess transcripts for IgGFC
LP IgA and IgA + ASC were lower only in mice receiving β7−/− B cells, binding protein (FCGBP), a characteristic secretory product of
reflective a B cell recruitment deficit only in the latter strain (Fig. 2c–f)). most mucin-producing cells including Goblet cells. The molecular
Mucosal Immunology
M. Guzman et al.
4
a RAG–/– b c
Control 15 5 n.s.
B6 CD4+ p < 0.001
Fecal IgA (μg/mg protein)
p < 0.001
LP IgA (μg/mg protein)
B6 CD19+ p < 0.0001 4
10
β7–/– Fecal IgA Flow 3
B6 CD4+ IF
6 weeks qPCR 2
β7–/– CD19+ 5
1
αE–/–
B6 CD4+
αE–/– CD19+ RAG–/– B6 β7–/– αE–/– RAG–/– B6 β7–/– αE–/–
d
B6 β7–/– αE–/–
DAPI E-cadherin IgA
e f g 15 p < 0.01
25 n.s.
Relative PIgR expression
p < 0.001 p < 0.001
20 10
5
B6 β7–/– αE –/–
e 14 1 5 1 12 1 10
LP IgA+ (%)
15
CD19
104
10 5
0
5 69 16 86 8 72 15
0 105 10
6
0 105 6
10 0 105 10
6
IgA
B6 β7–/– αE–/– RAG–/– B6 β7–/– αE–/–
Fig. 2 αE-deficient B cells are unable to reconstitute luminal IgA despite normal recruitment, local Ig production and increased PIgR
expression. a Experimental design of adoptive transfers. b Fecal IgA levels measured by ELISA. c LP IgA levels of indicated strains measured by
ELISA. d IF staining of IgA + ASC and E-cadherin (representative coronal TI images) of indicated strains. e Percentage of IgA+ cells within the
ilea of indicated mouse strains and (f) representative contours plots. g Ileal pIgR mRNA expression of RAG−/− mice transferred with B cells of
indicated strains (mean ± SD, n = 6 to 12 mice from 3 independent experiments, significance determined using ANOVA, followed by Tukey’s
multiple comparison test.
function of FCGBP has not been elucidated in detail, but it is likely Certain transcription factors expressed by αEβ7+ PC include
to regulate pathogen attachment and the clearing of microorgan- Regulator of plasma cell differentiation Prdm1 (Blimp1)24,25 and
isms. Predictably, both s3 and 4 no longer possess transcripts for Irf4, essential for the generation of PC. Their function in mature PC
activation-induced cytidine deaminase (AID, Aicda), an enzyme remains poorly understood. X-box binding protein 1 (Xbp1), also
that mediates somatic hypermutation and class-switch recombi- expressed by IgA + ASC regulates PC differentiation, whereas
nation. AID is strongly expressed in s2 (CD19+ IgA+) which are Zbtb20 promotes PC differentiation and longevity.26 Subsets 1
actively class-switching. and 2 expressed Pax5 and Bcl6; genes expressed by germinal
αEβ7+ PC (s4) additionally possess transcripts for integrin β4 which center B cells27, suggesting that they may originate from inducible
would allow these cells to bind to laminin. They also expressed gut lymphoid follicles within the intestine.28
homing chemokine receptors: CCR9 and CCR10, suggesting they are Several molecules that promote long-term survival are also
intestinal-specific. These receptors are involved in epithelial interac- expressed by both IgA+ ASC (s3,4). These include CD28 (receptor
tions and both of their ligands (CCL25, CCL28) are produced by ileal for CD80/86) and myeloid leukemia cell differentiation protein
and colonic epithelial cells. Conversely, they lack S1PR1 and CCR7 (MCL-1), both enhance survival through the inhibition of
(expressed by immature B cells), suggesting that they are tissue apopotosis. Tnfrsf17, which encodes for B cell maturation antigen
residents and do not travel to blood or lymphoid tissues, where their (BCMA is expressed by terminally-differentiated long-lived PC29
respective ligands S1P1 and CCL19/21 are abundant. and recognizes B-cell activating factor (BAFF), which also
Mucosal Immunology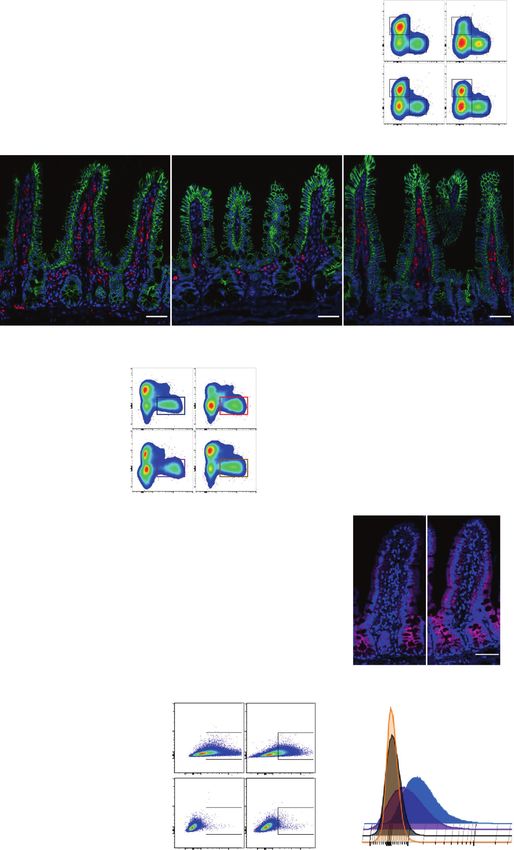
M. Guzman et al.
5
a e
Live lymphocytes CD3 – CD3– CD19– IgA+
1 2 3 4 Gene Protein
80
Integrin β7
1 2 3 Cd19 CD19
4
CD19
Ptprc
CD19
B220
B-cell markers
Cd38 CD38
Sdc1 CD138
Ms4a1 CD20
Cd79a CD79a
CD3 IgA Integrin αE Cd79b CD79b
Aicda AID
1 CD19+ IgA– 2 CD19+ IgA+ Cd40 CD40
– 4 CD19– IgA+ αEβ7+
3 CD19 IgA αEβ7
– + Fcgbp FCGBP
Itgb7 Integrin β7
Itgb4
Integrins
Integrin β4
b Itgae Integrin αE
1 CD19+ IgA– 2 CD19+ IgA+ Itgb1 Integrin β1
10
5
10
5 Itgb2 Integrin β2
Itgal Integrin αL
104 104
Ccr7 CCR7
Migration
CD19
CD19
Ccr9 CCR9
87% IgD+ 32% IgM+ 10% IgD+ 4% IgM+
0 0 Cxcr4 CXCR4
Ccr10 CCR10
0 105 10
6
107 0 105 10
6
0 105 10
6
107 0 105 10
6
S1pr1 S1PR1
IgD IgM IgD IgM Pax5 PAX5
Transcription factors
Bcl6 BCL6
d Ebf1 EBF1
c
Bach2 BACH2
1 2 Irf8 Irf-8
Spi1 SPI-1
Spib SPIB
0.8 p < 0.0005
Prdm1 Blimp-1
Nuclear-cytoplasmic ratio
p < 0.0001
Irf4 Irf4
0.6 Xbp1 XBP1
p = 0.0471
Tnfrsf13b TACI
Tnfrsf13c BAFF-R
0.4
Tnfrsf17 BCMA
3 4 Mki67 Ki-67
Survival
p < 0.0001
0.2 Cd28 CD28
Mcl1 MCL-1
Zbtb20 ZBTB20
1 2 3 4 Slc2a1 GLUT-1
Zbtb32 ZBTB32
Ezh2 EZH2
–1 0 1
Row Z-score
Fig. 3 αEβ7+ B cells are a subset of terminally-differentiated PC in small intestinal lamina propria. a Sorting strategy for intestinal LP B cell
lineage cells. b Representative contours plots of IgD and IgM expression in subsets 1 and 2. c Distinct ultrastructure of subsets (representative
images). d Nucleo-cytoplasmic ratio of subsets (violin plot of median and quartiles, n > 5, from 3 independent experiments, p calculated by
one-way ANOVA with Sidak’s correction). e Heat map of indicated PC-related genes by RNA-seq (2-way ANOVA, up- or down-regulated >2-fold
from 3 independent cell sorts).
promotes survival. The absence of ki67 (MKi67) demonstrate that cadherin-expressing IEC (Fig. 4a, b). Such IgA ASC rarely
they are no longer replicating. localized near the villus tips, where expression of pIgR is low or
absent (Fig. 4a), but rather near the crypt base, where they
IgA ASC align with, contact and/or interdigitate within E- are frequently found in direct contact with IEC (Fig. 4c). In addition,
cadherin/pIgR-expressing ileal epithelium we find certain IgA + ASC that like IEL, intercalate between IEC
Integrin αEβ7 mediates IEL interactions with IEC8,30 via E-cadherin, (Fig. 4d, Supplementary 3a–c) These intraepithelial IgA ASC are
an adhesion molecule expressed on the epithelial basolateral absent in αE−/− mice, suggesting that the integrin is required for
surface.31 Recent intravital microscopy studies have shown that IEL such intraepithelial positioning (Supplementary Fig. 3c).
are not anchored, but in constant movement, interacting with Furthermore, in transversal cuts near the crypt base (crypt cross-
multiple IEC.32 Cells of the B cell lineage are not considered section) of B6 mice we find IgA ASC that flatten against IEC and
to express αEβ7, although some scarce exceptions have acquire a sickled appearance, as to increase their contact surface
been reported.4,33 However, we identify a population of IgA+ with IEC (Fig. 5a). The crypt base is identified by the small luminal
ASC that align themselves in direct contact with pIgR- and E- diameter (Fig. 5d, L = lumen). Although the sickled appearance is
Mucosal Immunology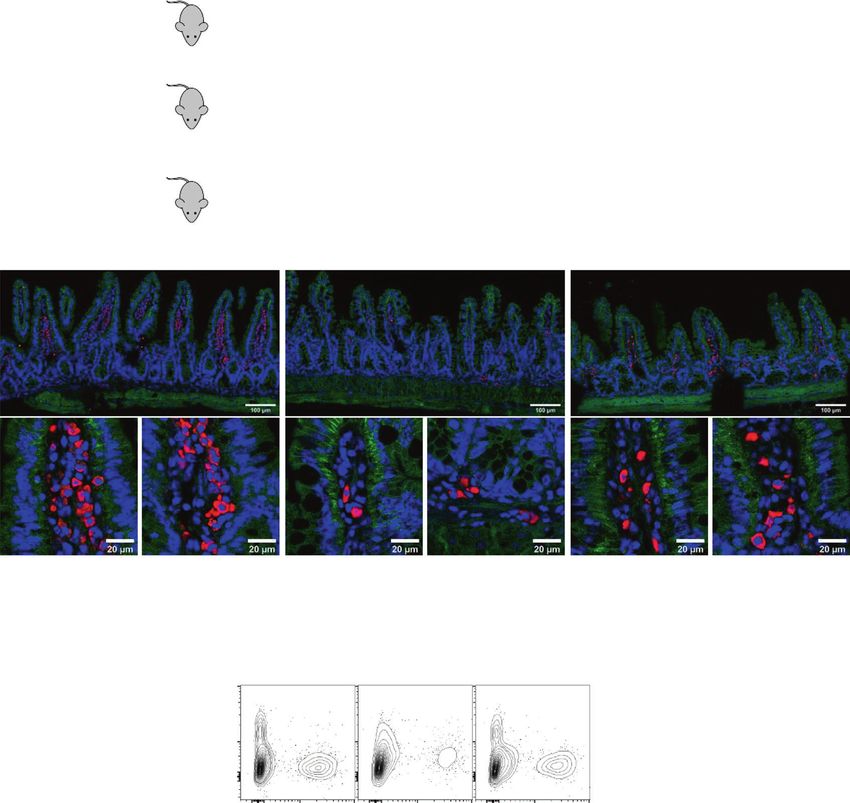
M. Guzman et al.
6

    Fig. 4 IgA ASCs align, contact and/or interdigitate E-cadherin/pIgR-expressing ileal epithelium. a IF staining of IgA + ASC adjacent to pIgR-
    expressing epithelium (representative images). b IgA + ASC adjacent to E-cadherin-expressing epithelium. c, d IF and TEM of IgA + ASC in
    contact and intercalated within pIgR-expressing terminal ileal epithelium (representative images).

    obvious when present (Fig. 5a, crypt cross-section, Supplementary       respiratory tract B cells.16 However, despite αE/CD103 serving as a
    Fig. 4a, b) we defined these cells as >12 µm in length, to count         major diagnostic surface marker of malignant hairy cell leukemia B
    them in an unbiased fashion (Supplementary Fig. 4b). Following          cells,33 the expression of αEβ7 by gut B cell lineage cells has not
    these criteria, we did not find any elongated IgA + ASC in neither       been reported to date.18 Herein, we describe an unreported
    β7−/− nor αE−/− mice (Fig. 5b, c and Supplementary 4a, b, c). By        population of IgA+ ASC that like IEL contact or intercalate within
    contrast round non-adherent IgA + ASC (
M. Guzman et al.
7
Fig. 5 A subset of IgA + ASC acquire and elongated/sickled morphology near the crypt base of B6 mice but not in αE- or β7-deficient
mice. a Round morphology of IgA + ASC in the mid-villous region, whereas a subset of IgA + ASC near the crypt base of B6 mice have an
elongated (sickle-like) morphology (coronal and cross sections at indicated levels). b Absence of IgA + ASC in the mid-villous and near crypt
base regions in β7−/− mice. c Round morphology of IgA + ASC in the mid-villous region and around the crypt base of αE−/− mice. Increasing
magnification of the villous crypt base of B6 mice (d) Three cells (PC) with sickled morphology in contact with IEC (yellow arrowheads) (e)
Higher magnification of an adherent cell with sickled morphology (f) Direct cell to cell contact between IEC and sickled cell with extensive RER
and IgA immunogold particles (representative TEM images, L = lumen, E = epithelial cell).
Mucosal ImmunologyM. Guzman et al.
8
S1PR1. It is possible that these originate from ILF, as these cannot mononuclear cells were isolated from terminal ileum.42 Briefly, tissues
be removed as PP, prior to LPMC extraction. Those CD19+ that were flushed out fecal material with cold phosphate-buffered saline (PBS)
were class switched expressed AID and KI67, suggesting that they (14190-144, Gibco, Carlsbad, CA), Peyer’s patches were removed, and
were still replicating. IgA + ASC which had shed C19 (CD19ne- collected in 30 ml of RPMI-1640 medium (21870-076, Gibco) supplemented
gIgA+
) (subsets 3 and 4) expressed transcripts consistent with with 10% heat-inactivated fetal calf serum (10082-147, Gibco), 10 mM
glutamine,100 U/ml penicillin, 100 μg/ml streptomycin (10378016, Thermo
terminal differentiation,39 such as Blimp-1, syndecan-1 (CD138), Fisher Scientific, Waltham, MA). First, samples were washed three times
Xbp1 and BCMA, while subset 4 also expressed αEβ7. with 1 mM EDTA (GR123, Hoefer, Holliston, MA) in HBSS (14170-112, Gibco)
Thus, we propose that as a late step in PC maturation, a subset for 15 min at room temperature in a shaking incubator and once with HBSS
of terminally-differentiated PC express αEβ7 to directly engage E- without EDTA. Then, intestinal tissue was mechanical dissociated and
cadherin/pIgR-expressing epithelium in a manner reminiscent of enzymatically digested in 20 ml of RPMI-1640 medium containing 10% FBS,
IEL. Direct engagement of PC with IEC may represent an efficient 1.5 mg/ml Collagenase A (C2139, Sigma-Aldrich, St. Louis, MO) and 0.5 mg/
mechanism for direct IgA relay, distinct from the canonical, yet still ml Dispase II (D4693, Sigma-Aldrich) for 30 min at 37˚C and 200 rpm in a
current model proposed by Brandtzaeg, in which ASC release IgA shaking incubator. Following digestion, tissues were strained to yield a
single-cell suspension, centrifuged 10 min at 1500 rpm at 4 °C. For in vitro
into the extracellular milieu to eventually reach pIgR through
stimulation assays, 2.5×10 5 splenocytes were cultured in 96-well U-bottom
diffusion.40 The contribution of dIgA by αEβ7+PC to total luminal plates with or without 50 µg/ml of LPS (00-4976-93, Invitrogen, Carlsbad,
SIgA is difficult to quantify, as this subset may still be present in CA) for 72 h and stained for flow cytometry.
the LP of αE−/− mice contributing to the total IgA that will
passively reach PIgR for transcytosis. Of note, is that even in αE−/−
mice IgA ASC often line themselves along IEC within the villi, Enzyme-linked immunosorbent assay (ELISA)
Fecal pellets were collected in 1 mL of phosphate buffer saline (14190-144,
suggesting that they sense IEC-derived chemoatractants (e.g., Gibco) and vortexed for 10 min. Particulate debris was removed after
CCL25) to approximate IEC. It would appear that proximity to IEC centrifugation at 4000 rpm and at 12,000 rpm for 10 min each. The
may optimize IgA transfer. The dynamics of the process is supernatant was stored at −80 °C. Intestinal lamina propria IgA was
unknown, however we observe IgA ASC that appear to be at obtained by fine mincing 1 cm of ileum in PBS with protease Inhibitor
different stages of IEC engagement, suggesting that this (S8820-20TAB, Sigma, Life Science) followed by homogenization and
might be a sequential process. Whether IEC engagement is final storage at −80 °C. For normalization, total protein concentration of the
or these cells may disengage from one area and move to another soluble fractions was measured by a Coomassie (Bradford) Protein Assay
remains to be ascertained. Given their surface receptor profile, it is Kit (23200, Thermo Fisher Scientific). IgA levels were measured using a
commercial ELISA Kit (88-50450-86, Thermo Fisher Scientific) as per
likely that these cells are tissue residents and do not circulate.
manufacturer’s instructions. Analyte concentrations were determined by
We report on a subset of intestinal IgA + PC that express αEβ7, comparison with standards, by using a standard curve generated as a
we demonstrate an unappreciated physiologic role of the integrin 4-parameter curve fit to determine ELISA kit assay values.
for the maintenance of luminal SIgA and propose an alternate
mechanism for IgA transcytosis. In this αEβ7-dependent model, PC
dock with intestinal IEC and directly transfer their IgA cargo to Flow cytometry
Cells from indicated compartments were suspended in PBS with 1% fetal
pIgR, for transfer to the intestinal lumen (Fig. 6). Whether bovine serum, pre-incubated with anti-mouse CD16/32 (Fc-block, Clone 93,
interference with this unappreciated role for the integrin may be eBiosciences, San Diego, CA) and stained with anti-mouse fluorochrome-
in part responsible for the lower efficacy of etrolizumab compared conjugated antibodies (listed in Table S1). UltraComp eBeads™ Compensa-
with the α4β7-specific agent (i.e., vedolizumab) in ulcerative colitis tion Beads (01-2222-42, Invitrogen) were used for compensation. Acquisition
deserves further consideration. of samples were performed using a Cytek Northern Light cytometer (Cytek,
Fremont, CA). Flow-cytometry data were analyzed using the FLOWJO
software (Tree Star, Ashland, OR).
MATERIALS AND METHODS
Mice Analysis of fecal IgA bacterial coating
C57BL/6 (B6), C57BL/6-Itgb7tm1Cgn (Integrin β7−/−), B6.129S2(C)- Fecal pellets were collected in 1 mL of phosphate buffer saline (14190-144,
Itgaetm1Cmp (Integrin αE−/−), B6.129S7-Rag1tm1Mom/J (Rag1−/−) mice Gibco), vortexed for 10 min, homogenized, and centrifuged at 400 × g to
were purchased from Jackson Laboratories (Bar Harbor, ME). PIgR−/− mice remove large debris. Supernatant was filtered through a sterile 70 μm
were provided by Dr. Charlotte Kaetzel (University of Kentucky). IgA−/− strainer and centrifuged at 8000 × g. The bacterial pellet was resuspended
mice were provided by Dr. Lars Eckmann (San Diego Digestive Diseases in PBS 0.25% BSA with SYTO BC (Thermofisher) and incubated for 30 min
Research Center). All mice were maintained under specific pathogen-free on ice. Then, bacteria were stained with PE anti-mouse IgA (clone: mA-6E1,
conditions and fed with a standard diet and water ad libitum during in vivo 10 μg/ml) for 20 min on ice, washed and resuspended in PBS 0.25% BSA
studies. Animal procedures were in accordance with governmental and with DAPI (Life Technologies) prior to flow cytometry using a low FSC and
institutional guidelines and approved by the Institutional Animal Care and SSC threshold to allow bacterial detection.
Use Committees of the University of California San Diego and the San
Diego VA Medical Center. RNA extraction, cDNA synthesis, and real-time PCR
Total RNA was isolated using RNeasy® Plus Mini kit (QIAGEN, Hilden,
Adoptive transfer studies Germany) and cDNA was synthesized from 2000 ng of total RNA using
CD4+ T from the spleen and MLN of B6 mice and CD19+ B cells from B6, High Capacity cDNA Reverse Transcription Kit (Applied Biosystems, Foster
β7−/− or αE−/− mice were enriched by positive selection with anti-mouse City, CA) on a PTC-200 Thermal Cycler (Marshall Scientific, Hampton, NH).
CD4 microbeads (130-117-043, Miltenyi Biotec, Auburn, CA) or with anti- Pigr gene expression (Assay ID Mm00465049_m1, Thermo Fisher Scientific)
mouse CD19 microbeads (130-121-301, Miltenyi Biotec) respectively, as per was performed using TaqMan® Fast Universal PCR Master Mix (Applied
the manufacturer’s instructions. B6 CD4 + T cells (≥95% purity; 2.5 ×10⁶) Biosystems) and Gapdh gene expression (Assay ID Mm99999915_g1,
were combined with CD19 + B cells from B6, β7−/− or αE−/− mice (≥95% Thermo Fisher Scientific) was amplified as endogenous controls using Step
purity; 2.5 ×10⁶), suspended in 200 µL of PBS and injected intraperitoneally One Plus Instrument (4376600, Applied Biosystems). Relative Pigr gene
into 6-week-old RAG−/− recipients. Tissues were harvested after 6 weeks expression was calculated from reference gene using CT values obtained
once fecal IgA had reached B6 levels. from Applied BioSystems’ StepOne Software (Version v2.3).
The mRNA expression levels of IgA was performed using SYBR®FAST
qPCR kit (cat. #4385612, Applied Biosystems, CA) with thermal conditions
Lymphocyte isolation of 20-s preincubation at 95 °C followed by 40 cycles at 95 °C for 3 s and 60 °
Splenocytes, mesenteric lymph node (MLN) lymphocytes were excised and C for 30 s. Gene expression was calculated using from reference gene using
rendered into a cell suspension by mechanical dissociation and sieving CT values obtained from Applied Biosystems’ StepOne Software (Version
through wire mesh as previously described.41 Lamina propria (LP) v2.3) and using GAPDH as reference gene. The following primers were
Mucosal ImmunologyM. Guzman et al.
9
Fig. 6 Alternate integrin αEβ7-independent and dependent models of IgA transcytosis. a Canonical diffusion model for IgA transcytosis in
which dIgA is secreted by IgA + ASC into the extracellular milieu and diffuses to reach pIgR. b Proposed new model of αEβ7-dependent IgA
transcytosis in which αEβ7 + IgA + ASC dock with IEC to directly relay dIgA to pIgR for transcytosis into the intestinal lumen.
used to quantify transcripts in the tissue samples: immunoglobulin A (IgA) discover/3dpx-012172) and Shandon Plastic Coverplates (72110017,
F: 5ʹCCTAGTGTTTGAGCCCCTAA3ʹ and IgA R: 5ʹGGAAGTGCAGGGATACT Thermo Fisher Scientific). After antigen retrieval slides were blocked in
TTG3ʹ; (GAPDH) F: 5ʹGATTCCACCCATGGCAAATTC3ʹ and GAPDH_R: 5% normal donkey serum, 0.3% Triton X-100 in PBS for 1 h at RT, and
5ʹTGGGATTTCCATTGATGACAAG3ʹ. incubated with primary pIgR antibody in PBS-T (0.1% Tween 20) for 18 h at
4 °C, washed in PBS-T, and stained with an anti-goat secondary for 1 h at
RT. The slides were then washed and incubated for another 18 h at 4 °C
Immunostaining and confocal laser scanning microscopy with either IgA and CD31 or IgA and E-cadherin, washed with PBS-T, and
acquisition stained with secondaries for 1 h at RT. After another wash, they were
Distal ileum (10 cm) samples were opened, fixed in 10% neutral buffered counterstained with Hoechst (H3570, Thermo Fisher Scientific) 1:1000 in
formalin, embedded in paraffin on edge, and cut into 4-μm-thick sections. PBS. The slides were removed from the Freequenza rack and treated with
For immunofluorescence microscopy, sections were deparaffinized, TrueBlack Lipofuscin Autofluorescence Quencher (23007, Biotium, Fre-
rehydrated, and placed in a pressure cooker set to high pressure and mont, CA) 1:20 in 70% reagent alcohol, for 30 sec. The quencher was
heated for 20 min with Tris-EDTA pH 9.0 antigen retrieval buffer. The slides removed, and slides were washed in PBS. Specimens were mounted with
were stained using a 3D-printed Freequenza Rack (https://3dprint.nih.gov/ ProLong Gold Antifade Mountant (P36930, ThermoFisher Scientific) and
Mucosal ImmunologyM. Guzman et al.
10
stored at RT. All antibodies details are listed in Table S2. Image acquisition out by applying two regions of interest (ROIs), one delimiting the total area
was performed with a ZEISS LSM780 confocal microscope (Thornwood, per cell and other delimiting the nuclear area corresponding to each one.
USA) equipped with a 40x/1.3 NA EC Plan-Neofluor oil objective. High-
resolution images were taken through a tile scan. Each square region was
610 µm per side with a pixel size of 0.13 µm.
Bulk RNA-sequencing and analysis
Total cellular RNA was extracted from the 4 sorted populations: CD19+
IgA−, CD19+ IgA+, CD19−IgA+CD103− and CD19−IgA+CD103+ in TRIzol
TEM immunogold labeling reagent (15596018, Invitrogen). RNA library preparation was conducted
For immunoelectron microscopic studies, distal ilea were fixed for 12 h in using a TruSeq RNA Library Prep Kit v2 for Illumina (RS-122-2001, Illumina,
4% PFA in 0.1 M phosphate buffer, pelleted in 10% gelatin and San Diego, CA) according to the manufacturer’s protocols. After quality
cryoprotected by infusion with 2.3 M sucrose overnight at 4 °C. One mm3 assessment, sequencing was carried out on a NovaSeq 6000 (Illumina)
tissue blocks were mounted onto specimen holders and snap frozen in using single-ended 50-bp reads. Quality control of the raw fastq files was
liquid nitrogen. Ultrathin cryosections (70–80 nm) were cut, placed on a 1:1 performed using the software tool FastQC v0.11.3. Sequencing reads were
mixture of 2.3 M sucrose and 2% methyl cellulose (15cp) and transferred trimmed with Trimmomatic v0.36 and aligned with the mouse genome
onto Formvar and carbon-coated copper grids. (GRCm38) using the STAR aligner v2.5.3a. Read quantification was
Tissue grids were placed on 2% gelatin at 37 °C for 20 min, rinsed with performed with RSEM44 v1.3.0 and the M19 Gencode annotation.45 The
0.15 M glycine/PBS and the sections were blocked using 1% cold water R BioConductor packages edgeR and limma were used to implement the
fish-skin gelatin. Ultrathin sections were incubated for 2 h at RT with limma-voom method for differential expression analysis. In brief, lowly
purified rat anti-mouse IgA antibody (Clone C10-3. BD Pharmingen) diluted expressed genes—those not having counts per million (cpm) ≥3 in at least
at 1:500 and rabbit anti-mouse E-Cadherin antibody (Clone 24E10, Cell 3 of the samples—were filtered out and then trimmed mean of M-values
Signaling), washed and followed by an 1 h incubation with 12 nM gold (TMM) normalization was applied. The experimental design was modeled
conjugated goat anti-rat IgG (Jackson ImmunoResearch Inc.) and 16 nm upon condition and batch (~0 + condition + batch). The voom method
gold conjugated goat anti-rabbit IgG (Jackson ImmunoResearch Inc., was employed to model the mean-variance relationship in the log-cpm
Westgrove, PA), diluted 1:20 in 1% BSA/PBS. Sections were post-fixed for 5 values weighted for inter-subject correlations in repeated measures of
min with 1% glutaraldehyde in PBS, washed thoroughly with distilled mice, after which lmFit was used to fit per-gene linear models46. Empirical
water, and then contrasted (10 min in 0.4% uranyl acetate and 1.8% methyl Bayes moderation was applied with the eBayes function. Significance was
cellulose on ice). Grids were viewed using a JEOL 1400plus (JEOL, Peabody, defined by using an adjusted p value cut-off of 0.05 after multiple testing
MA) transmission electron microscope and photographed using a Oneview correction using a moderated t-statistic in limma. Functional enrichment of
4KGatan digital camera (Gatan, Pleasanton, CA). the differentially expressed genes was performed using WebGestalt47
(including GSEA48), GSVA49 and SPIA.50
Quantification of pIgR immunofluorescent signal
Images were processed with ImageJ (Fiji) software.43 To quantify PIgR Statistical analysis
expression, values were obtained individually for the villus-crypt axis using a Results are expressed as mean ± S.D. unless otherwise indicated. One- or
region of interest (ROI). First, free-hand ROI were created by delimiting the two-way analysis of variance with Bonferroni or Dunnett´s post-hoc tests
axis according to DAPI and E-cadherin label. This step was done by a masked were used to compare groups. Significance was set at p < 0.05 and two-
observer (ZM) who was blinded to PIgR IF signal. Then, a macro was used to tailed tests were used in all experiments. Calculations were performed
apply the ROI to the PIgR fluorescent image, the product of the area and using GraphPad Prism version 8 software (GraphPad Software, La Jolla, CA).
mean intensity (Int Den) was recorded and expressed per each high-
resolution image. At least 5 villus-crypt axis per image were analyzed.
REFERENCES
IgA ASC morphology assessment 1. Wagner, N. et al. Critical role for beta7 integrins in formation of the gut-
The length of IgA + ASC was assessed following a semi-automatic method associated lymphoid tissue. Nature 382, 366–370 (1996).
using ImageJ software. Briefly, a binary image was created applying a 2. Schippers, A. et al. beta7 integrin controls immunogenic and tolerogenic mucosal
uniform IgA IF signal threshold to all images, which allowed generation of B cell responses. Clin. Immunol. 144, 87–97 (2012).
an ROI for each IgA cell. Then, a straight line was manually drawn along 3. Schippers, A. et al. Mucosal addressin cell-adhesion molecule-1 controls plasma-
each ROI according to the maximum length of each cell, which cell migration and function in the small intestine of mice. Gastroenterology 137,
automatically provides length in microns. Thirty or more cells were 924–933 (2009).
measured near the pericryptal base region for each mouse strain. The crypt 4. Cerf-Bensussan, N. et al. A monoclonal antibody (HML-1) defining a novel
base was identified by its small luminal space. membrane molecule present on human intestinal lymphocytes. Eur. J. Immunol.
17, 1279–1285 (1987).
5. Schwarting, R., Dienemann, D., Kruschwitz, M., Fritsche, G. & Stein, H. Specificities
Cell sorting of monoclonal antibodies B-ly7 and HML-1 are identical. Blood 75, 320–321
Single-cells suspension of LPMC were depleted of CD3+ cells using CD3ε (1990).
MicroBead Kit (130-094-973, Miltenyi Biotec) and LS columns (130-042-401, 6. Visser, L., Shaw, A., Slupsky, J., Vos, H. & Poppema, S. Monoclonal antibodies
Miltenyi Biotec) and stained with anti-mouse CD19 PerCpCy5.5 (115534, reactive with hairy cell leukemia. Blood 74, 320–325 (1989).
Biolegend, San Diego, CA), anti-mouse CD3 APC-eFluor 780 (47-0032-82, 7. Kilshaw, P. J. & Murant, S. J. A new surface antigen on intraepithelial lymphocytes
Invitrogen), anti-mouse IgA PE (12-4204-83, Invitrogen), anti-mouse CD103 in the intestine. Eur. J. Immunol. 20, 2201–2207 (1990).
APC (17-1031-82, Invitrogen) and anti-mouse Integrin B7 BV421 (564283, 8. Roberts, K. & Kilshaw, P. J. The mucosal T cell integrin alpha M290 beta 7
BD Bioscience, La Jolla, CA) and sorted on a fluorescence‐activated cell recognizes a ligand on mucosal epithelial cell lines. Eur. J. Immunol. 23,
sorter FACSAria (BD Biosciences) using FACSDiva software (BD Biosciences). 1630–1635 (1993).
9. Karecla, P. I., Bowden, S. J., Green, S. J. & Kilshaw, P. J. Recognition of E-cadherin
Transmission electron microscopy and nucleo-cytoplasmic on epithelial cells by the mucosal T cell integrin alpha M290 beta 7 (alpha E beta
7). Eur. J. Immunol. 25, 852–856 (1995).
ratio analysis
10. Kilshaw, P. J. Expression of the mucosal T cell integrin alpha M290 beta 7 by a
Cells were fixed with 2% glut. in 0.10 M cacodylate buffer and further
major subpopulation of dendritic cells in mice. Eur. J. Immunol. 23, 3365–3368
postfixed in 1% OsO4 in 0.1 M cacodylate buffer for 1 h on ice. Cells were
(1993).
stained with 2% uranyl acetate for 1 h on ice, dehydrated in ethanol
11. Iwata, M. et al. Retinoic acid imprints gut-homing specificity on T cells. Immunity
(50–100%) on ice followed by 2 washes with acetone (10 min each) and
21, 527–538 (2004).
embedded with Durcupan (44611, Sigma Aldrich). Sections were cut at 60
12. Mora, J. R. et al. Generation of gut-homing IgA-secreting B cells by intestinal
nm on a Leica UCT ultramicrotome (Wetzlar, Germany), and placed on 300
dendritic cells. Science 314, 1157–1160 (2006).
mesh copper grids. Sections were post-stained with 2% uranyl acetate for
13. Benson, M. J., Pino-Lagos, K., Rosemblatt, M. & Noelle, R. J. All-trans retinoic acid
5 min and Sato’s lead stain for 1 min. Images were obtained by using Jeol
mediates enhanced T reg cell growth, differentiation, and gut homing in the face
1400 plus Transmission Electron Microscope equipped with Gatan digital
of high levels of co-stimulation. J. Exp. Med 204, 1765–1774 (2007).
camera (Peabody, MA). The nucleus/cytoplasm ratio analysis was
14. Mora, J. R. & von Andrian, U. H. Role of retinoic acid in the imprinting of gut-
performed with ImageJ software (Fiji). The calculation was then carried
homing IgA-secreting cells. Semin Immunol. 21, 28–35 (2009).
Mucosal ImmunologyM. Guzman et al.
11
15. Jaensson, E. et al. Small intestinal CD103+ dendritic cells display unique func- 44. Li, B. & Dewey, C. N. RSEM: accurate transcript quantification from RNA-Seq data
tional properties that are conserved between mice and humans. J. Exp. Med 205, with or without a reference genome. BMC Bioinforma. 12, 323 (2011).
2139–2149 (2008). 45. Frankish, A. et al. GENCODE reference annotation for the human and mouse
16. Csencsits, K. L., Walters, N. & Pascual, D. W. Cutting edge: dichotomy of homing genomes. Nucleic Acids Res 47, D766–D773 (2019).
receptor dependence by mucosal effector B cells: alpha(E) versus L-selectin. J. 46. Law, C. W., Chen, Y., Shi, W. & Smyth, G. K. voom: precision weights unlock linear
Immunol. 167, 2441–2445 (2001). model analysis tools for RNA-seq read counts. Genome Biol. 15, R29 (2014).
17. Pascual, D. W., Riccardi, C. & Csencsits-Smith, K. Distal IgA immunity can be 47. Zhang, B., Kirov, S. & Snoddy, J. WebGestalt: an integrated system for exploring
sustained by alphaEbeta7+ B cells in L-selectin-/- mice following oral immuni- gene sets in various biological contexts. Nucleic Acids Res. 33, W741–W748 (2005).
zation. Mucosal Immunol. 1, 68–77 (2008). 48. Subramanian, A. et al. Gene set enrichment analysis: a knowledge-based
18. Schon, M. P. et al. Mucosal T lymphocyte numbers are selectively reduced in approach for interpreting genome-wide expression profiles. Proc. Natl. Acad. Sci.
integrin alpha E (CD103)-deficient mice. J. Immunol. 162, 6641–6649 (1999). USA 102, 15545–15550 (2005).
19. Johansen, F. E. et al. Absence of epithelial immunoglobulin A transport, with 49. Hanzelmann, S., Castelo, R. & Guinney, J. GSVA: gene set variation analysis for
increased mucosal leakiness, in polymeric immunoglobulin receptor/secretory microarray and RNA-seq data. BMC Bioinforma. 14, 7 (2013).
component-deficient mice. J. Exp. Med. 190, 915–922 (1999). 50. Tarca, A. L. et al. A novel signaling pathway impact analysis. Bioinformatics 25,
20. Kaetzel, C. S., Robinson, J. K., Chintalacharuvu, K. R., Vaerman, J. P. & Lamm, M. E. 75–82 (2009).
The polymeric immunoglobulin receptor (secretory component) mediates
transport of immune complexes across epithelial cells: a local defense function
for IgA. Proc. Natl Acad. Sci. USA 88, 8796–8800 (1991). ACKNOWLEDGEMENTS
21. Mombaerts, P. et al. RAG-1-deficient mice have no mature B and T lymphocytes. We thank Joshua D. Boyer and Ying Jones (Electron Microscopy Facility, UCSD—School
Cell 68, 869–877 (1992). of Medicine) for technical assistance. The Flow Cytometry Core Facility (La Jolla Institute
22. Kim, M. H., Taparowsky, E. J. & Kim, C. H. Retinoic acid differentially regulates the for Immunology), UC San Diego IGM Genomics Center and UC San Diego Center for
migration of innate lymphoid cell subsets to the gut. Immunity 43, 107–119 Computational Biology & Bioinformatics are gratefully acknowledged.
(2015).
23. Oracki, S. A., Walker, J. A., Hibbs, M. L., Corcoran, L. M. & Tarlinton, D. M. Plasma
cell development and survival. Immunol. Rev. 237, 140–159 (2010).
24. Shaffer, A. L. et al. Blimp-1 orchestrates plasma cell differentiation by extin- AUTHOR CONTRIBUTIONS
guishing the mature B cell gene expression program. Immunity 17, 51–62 (2002). J.R.-N. supervised the overall project. M.G. and J.R.-N. designed the experiments and
25. Kallies, A. et al. Plasma cell ontogeny defined by quantitative changes in blimp-1 wrote the manuscript. M.G., L.L., S.Y., K.D., N.R.Z. and V.T. performed most of the
expression. J. Exp. Med 200, 967–977 (2004). experiments. C.J.T., Z.M., G.B. and J.R.-N. assisted with analysis of the data. All authors
26. Chevrier, S. et al. The BTB-ZF transcription factor Zbtb20 is driven by Irf4 to contributed to the interpretation of the data as well as proofreading the manuscript.
promote plasma cell differentiation and longevity. J. Exp. Med 211, 827–840
(2014).
27. Nutt, S. L., Taubenheim, N., Hasbold, J., Corcoran, L. M. & Hodgkin, P. D. The FUNDING
genetic network controlling plasma cell differentiation. Semin Immunol. 23, This work was supported by grants from the National Institutes of Health [DK108670,
341–349 (2011). DK118927]; VA Merit BLRD-I01 BX003436; Takeda Pharmaceuticals U.S.A. IISR-2017-
28. Eberl, G. Inducible lymphoid tissues in the adult gut: recapitulation of a fetal 102050 grant to JRN; San Diego Digestive Diseases Research Center [P30 DK120515]
developmental pathway? Nat. Rev. Immunol. 5, 413–420 (2005). and support from Chiba University-UC San Diego Program in Mucosal Immunology,
29. Mesin, L., Di Niro, R., Thompson, K. M., Lundin, K. E. & Sollid, L. M. Long-lived Allergy and Vaccines.
plasma cells from human small intestine biopsies secrete immunoglobulins for
many weeks in vitro. J. Immunol. 187, 2867–2874 (2011).
30. Cepek, K. L., Parker, C. M., Madara, J. L. & Brenner, M. B. Integrin alpha E beta 7 COMPETING INTERESTS
mediates adhesion of T lymphocytes to epithelial cells. J. Immunol. 150, The authors declare no competing interests.
3459–3470 (1993).
31. Dogan, A., Wang, Z. D. & Spencer, J. E-cadherin expression in intestinal epithe-
lium. J. Clin. Pathol. 48, 143–146 (1995).
ADDITIONAL INFORMATION
32. Hoytema van Konijnenburg, D. P. et al. Intestinal epithelial and intraepithelial T
cell crosstalk mediates a dynamic response to infection. Cell 171, 783–794 e713 Supplementary information The online version contains supplementary material
(2017). available at https://doi.org/10.1038/s41385-021-00439-x.
33. Moller, P., Mielke, B. & Moldenhauer, G. Monoclonal antibody HML-1, a marker for
intraepithelial T cells and lymphomas derived thereof, also recognizes hairy cell Correspondence and requests for materials should be addressed to J.R-N.
leukemia and some B-cell lymphomas. Am. J. Pathol. 136, 509–512 (1990).
34. Ghosh, S. et al. Natalizumab for active Crohn’s disease. N. Engl. J. Med 348, 24–32 Reprints and permission information is available at http://www.nature.com/
(2003). reprints
35. Sandborn, W. J. et al. Vedolizumab as induction and maintenance therapy for
Crohn’s disease. N. Engl. J. Med 369, 711–721 (2013). Publisher’s note Springer Nature remains neutral with regard to jurisdictional claims
36. Feagan, B. G. et al. Vedolizumab as induction and maintenance therapy for in published maps and institutional affiliations.
ulcerative colitis. N. Engl. J. Med 369, 699–710 (2013).
37. Perez-Jeldres, T. et al. Cell trafficking interference in inflammatory bowel disease:
therapeutic interventions based on basic pathogenesis concepts. Inflamm. Bowel
Dis. 25, 270–282 (2019).
38. Babbar, A. et al. The compromised mucosal immune system of beta7 integrin- Open Access This article is licensed under a Creative Commons
deficient mice has only minor effects on the fecal microbiota in homeostasis. Attribution 4.0 International License, which permits use, sharing,
Front Microbiol 10, 2284 (2019). adaptation, distribution and reproduction in any medium or format, as long as you give
39. Shi, W. et al. Transcriptional profiling of mouse B cell terminal differentiation appropriate credit to the original author(s) and the source, provide a link to the Creative
defines a signature for antibody-secreting plasma cells. Nat. Immunol. 16, Commons license, and indicate if changes were made. The images or other third party
663–673 (2015). material in this article are included in the article’s Creative Commons license, unless
40. Brandtzaeg, P. Transport models for secretory IgA and secretory IgM. Clin. Exp. indicated otherwise in a credit line to the material. If material is not included in the
Immunol. 44, 221–232 (1981). article’s Creative Commons license and your intended use is not permitted by statutory
41. Karuppuchamy, T. et al. Sphingosine-1-phosphate lyase inhibition alters the S1P regulation or exceeds the permitted use, you will need to obtain permission directly
gradient and ameliorates Crohn’s-like ileitis by suppressing thymocyte matura- from the copyright holder. To view a copy of this license, visit http://creativecommons.
tion. Inflamm. Bowel Dis. 26, 216–228 (2020). org/licenses/by/4.0/.
42. Bamias, G. et al. Proinflammatory effects of TH2 cytokines in a murine model of
chronic small intestinal inflammation. Gastroenterology 128, 654–666 (2005).
This is a U.S. government work and not under copyright protection in the U.S.; foreign
43. Schindelin, J. et al. Fiji: an open-source platform for biological-image analysis. Nat.
copyright protection may apply 2021
Methods 9, 676–682 (2012).
Mucosal ImmunologyYou can also read