High throughput single cell analysis of mitochondrial heteroplasmy in mitochondrial diseases - Nature
←
→
Page content transcription
If your browser does not render page correctly, please read the page content below
www.nature.com/scientificreports
OPEN High throughput single cell analysis
of mitochondrial heteroplasmy
in mitochondrial diseases
Ryotaro Maeda1, Daisuke Kami2, Hideki Maeda1, Akira Shikuma1 & Satoshi Gojo2*
Mitochondrial heteroplasmy, which fundamentally means intracellular heterogeneity of mitochondrial
DNA (mtDNA), has been measured in a group of cells, regardless of intercellular heterogeneity.
Ordinal methods for mitochondrial heteroplasmy cannot discriminate between an intercellular
homogenic population composed of cells with similar intracellular heterogeneity for mtDNA and an
intercellular heterogenic population composed of cells with different rates of mutated mtDNA. A high-
throughput method to determine mitochondrial heteroplasmy in a single cell was developed by using
droplet digital PCR with TaqMan polymerase in this study. This technique revealed that there are three
different cell populations of cultured fibroblasts derived from patients with mitochondrial disease
carrying a mutation in the mtDNA; cells with homoplasmy of either mutated or healthy mtDNA; and
cells mixed with mutated and healthy mtDNA. The presence of intercellular heterogeneity, even in
uniformed cultured fibroblasts, suggests that heterogeneity should exist among different kinds of
cells. The diagnosis of intercellular heterogeneity with respect to mitochondrial heteroplasmy by
this methodology could provide novel insight into developing a treatment strategy for mitochondrial
diseases.
Mitochondrial diseases are a group of genetic heterogenous disorders characterized by dysfunctional mitochon-
dria and currently cannot be cured; only palliative treatment to relieve symptoms are provided to p atients1. Since
the symbiosis of the progenitor of mitochondria and eukaryotes, α-proteobacteria and archaea, respectively, an
array of genes in mitochondria were transferred into the nuclear genome that simultaneously evolved to acquire
a 200,000-fold expansion in the number of g enes2. Either the mutations in the nuclear gene constituting mito-
chondria or in the mitochondrial DNA (mtDNA) manifest mitochondrial diseases, which can affect any organ,
develop at any age, and exhibit different degrees of severity3. Phenotypic variability in the case of a pathological
mutation in mtDNA could be attributed to multiple copies of mtDNA that an individual cell possesses, ranging
from 100,000 copies in an unfertilized oocyte to ~ 100 copies in s perm4. Although a small ratio of the mito-
chondrial genome with pathological mutations is pervasive, there seems to be a threshold, typically 60–80%, to
manifest biochemical m alfunctions4. The mixture of mutated and wild-type genomes is called h eteroplasmy5. The
severity of the diseases correlates with the level of heteroplasmy in the case of protein-coding gene mutations;
an example of this is neurogenic muscle weakness, ataxia and retinitis pigmentosa (NARP), which is caused by
the mutation of MT-ATP6. Heteroplasmy less than 70% does not exhibit a clinical phenotype, and heteroplasmy
ranging from 70 to 90% manifests symptomatic NARP that might remain stable into adult life; extreme hetero-
plasmy of more than 90% develops as Leigh syndrome6. On the other hand, mtDNA mutations in tRNA genes
manifest with high clinical variability, which cannot be explained by h eteroplasmy7.
Given that the mixing rate of healthy and mutant genotypes in a single cell is constant in all cells, the assay
targeting a population accurately portrays the situation of each cell. However, it was reported that the mixing
rates are not constant, and the mutations are even various among neurons8. Recently, intracellular and intercel-
lular mtDNA heteroplasmy, which are termed microheteroplasmy and macroheteroplasmy, respectively, have
been clearly d efined9.
There are many methods to detect genotype DNA sequence variances, including single nucleotide polymor-
phisms (SNPs), which have been utilized to diagnose cancer10, genetic disorders11, and infectious diseases12.
1
Department of Cardiovascular Medicine, Graduate School of Medical Science, Kyoto Prefectural University of
Medicine, 465, Kajii cho, Kamigyo ku, Kyoto 802‑8566, Japan. 2Department of Regenerative Medicine, Graduate
School of Medical Science, Kyoto Prefectural University of Medicine, 465, Kajii cho, Kamigyo ku, Kyoto 802‑8566,
Japan. *email: gojos@koto.kpu‑m.ac.jp
Scientific Reports | (2020) 10:10821 | https://doi.org/10.1038/s41598-020-67686-z 1
Vol.:(0123456789)
www.nature.com/scientificreports/
Amplification refractory mutation system (ARMS) is based on oligonucleotides that have a mismatched 3′ residue
to the template that does not efficiently extend the PCR strand13. ARMS needs only the primer to be designed
with either a 3′-matched or -mismatched end and does not require isotopes, restriction enzymes, sequence reac-
tions, or specialized instruments. The specificity for ARMS primers depends upon the sequence of the t emplate14;
therefore, some modification with additional mismatches upstream to the 3′ end improved the specificity without
reducing the simplicity. Quenching, which is defined as a decrease in the fluorescence intensity of a given fluoro-
phore, is utilized for signal detection in various PCR-based SNP a ssays15. TaqMan quantitative PCR was applied
to detect DNA sequence variance in combination with a sequence-specific p robe16. The oligonucleotide probe,
which possesses both a fluorophore and quencher at the opposite end and exhibits little fluorescence in the aque-
ous phase, is digested by the activity of the 5′ exonuclease of the TaqMan Polymerase in the extension process of
PCR, resulting in emitting fluorescence from the dissociated fluorophore. Multiplex detection of several kinds
of mutations is feasible in a single reaction tube by using different fluorophores17. To detect a quite rare vari-
ant, an array of modifications has been applied to the combination method with primers and probes, and these
include CataCleave18, Scorpion-ARMS19, and PNA-LNA PCR c lamp20, which have a sensitivity of 5%, 1%, and 1%,
respectively. A double-strand DNA fragment has an inherent melting temperature, which is applied to a probe-
based fluorescence melting curve analysis. Using a probe with a fluorophore and a quencher at different ends, the
difference in the differentiating signal with the temperature of a probe-template hybrid are plotted in relation to
temperature, resulting in a discriminated peak that is dependent on the sequence even in a single n ucleotide21.
Third-generation PCR, a digital PCR based on microwell chip and microfluidic techniques, emerged to detect
one target sequence with an analytic system based on the Poisson d istribution22. The droplet digital PCR (ddPCR)
using the water-in-oil droplet technique exhibited a higher sensitivity to distinguish rare mutations with a 0.001%
sensitivity23. It has also been utilized to measure the mitochondrial DNA copy number using eluted nucleotides24
or lysed c ells25. Although these assays claimed to provide single cell resolution by harnessing the limiting dilution,
the results are based upon the hypothesis that all cells possess the same heterogeneity of mtDNA. Although the
abovementioned methodologies have improved the specificity and sensitivity, the results might not accurately
express the situation in each cell but rather be an integration of those in each cell in the population.
Single-cell biology has emerged so rapidly in various fields and has contributed to providing deeper insights
into life science. Single-cell ddPCR (sc-ddPCR), which takes advantage of an intact cell instead of lysed cells
or eluted nucleotides and is executed in a single droplet enclosing a single cell, has been developed by using
a droplet-to-digital device. To examine a deletion in mtDNA, this technology was applied to a single skeletal
muscle cell collected by laser-capture microdissection (LCM) from muscle biopsies26. In ex vivo gene therapy
using hematopoietic stem cells, sc-ddPCR enabled the tracing of gene-modified donor c ells27. In bacteriology,
multiplexed single-cell ddPCR was applied to detect different alleles28. On the other hand, next-generation
sequencing technology opened a new field of single-cell biology, and even within a single mitochondrion, it
revealed heteroplasmy in mtDNA29. In this study, we introduced high-throughput sc-ddPCR as a detection
method for a heteroplasmy within a single cell. This analysis reveals how the mutated mtDNA is truly distributed
in each cell and the genotype with respect to mtDNA in a single cell, not in a population.
Results
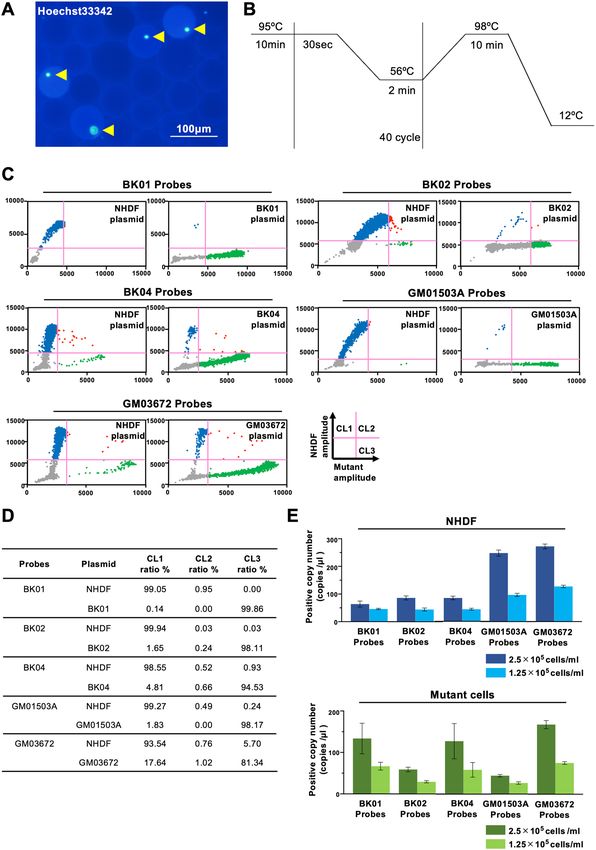
Single nucleotide polymorphism assay in whole cells. We utilized 5 primary fibroblasts derived from
patients with mitochondrial diseases, which are caused by a mutation in mtDNA (Fig. 1A). The TaqMan single
nucleotide polymorphism (SNP) assay was chosen to determine the heteroplasmy in mtDNA of target cells
with respect to simplicity because the same assay is easily adopted for ddPCR. A set of primers was designed to
target the SNP-encompassing region and to amplify 83 bp, 100 bp, 151 bp, 83 bp, and 82 bp sequences for BK01,
BK02, BK04, GM01503A, and GM03672, respectively. To discriminate and quantify healthy genotypes compat-
ible with the Cambridge Reference Sequence (CRS) and mutated mtDNA separately, two TaqMan probes with
either a FAM or VIC fluorescent dye at the 5′ end and a nonfluorescent quencher at the 3′ end were designated
in combination with the minor groove binders (MGBs) to maximize the difference in the melting temperature
in each kind of fibroblast. The amplified sequences were subcloned into a plasmid either to depict the standard
line for quantification of the target sequence in the conventional TaqMan SNP genotyping assay or to draw
threshold lines in the sc-ddPCR assay (Fig. 1B). The mean heteroplasmy from five fibroblasts was 97.1%, 95.5%,
and 97.1% for BK01, BK02, and BK04 (N = 6), respectively, and 100% for both GM01503 and GM03672 (N = 3)
(Fig. 1C, Supplemental Fig. S1). The specificity of each primer–probe set was examined by using NHDFs that
had been verified to possess healthy sequences in the target position by NGS. The heteroplasmy rate in NHDFs
was negligible for all mutant probes.
sc‑ddPCR single cell assay. Droplets were generated by using various concentrations of the cell suspension
so that they included either a single cell or no cells. The concentration of 1 × 10⁵ cells per milliliter was optimal
(Fig. 2A). Normal human dermal fibroblasts (NHDFs), which were sequenced for mtDNA and ensured to have a
compatible sequence to CRS in MT-ND3, MT-ATP6, tRNA for leucin, MT-ND6, and MT-CYB, were utilized as
the control. All five kinds of primer and probe sets for mutations in m3243, m10158, m9185, m14484 and m15257
were designed based on the predicted melting temperature between the probe and template. The optimized PCR
protocol was designed to minimize the nonspecific binding of probes and maximize the fluorescence intensity
(Fig. 2B). To analyze two fluorescence data in a 2-dimensional plot, we designated how to set a quadrant line for
each target sequence by using a plasmid carrying it (Fig. 2C). This plot provides specificity for a probe that is not
for a target template, so the specificities of the probe for BK01, BK02, BK04, GM01503, and GM03672 in combi-
nation with the probe for NHDFs are summarized in Fig. 2D. The threshold lines were validated by the propor-
tional relation between the cell number of the positive signal and the loaded cell number (Fig. 2E).
Scientific Reports | (2020) 10:10821 | https://doi.org/10.1038/s41598-020-67686-z 2
Vol:.(1234567890)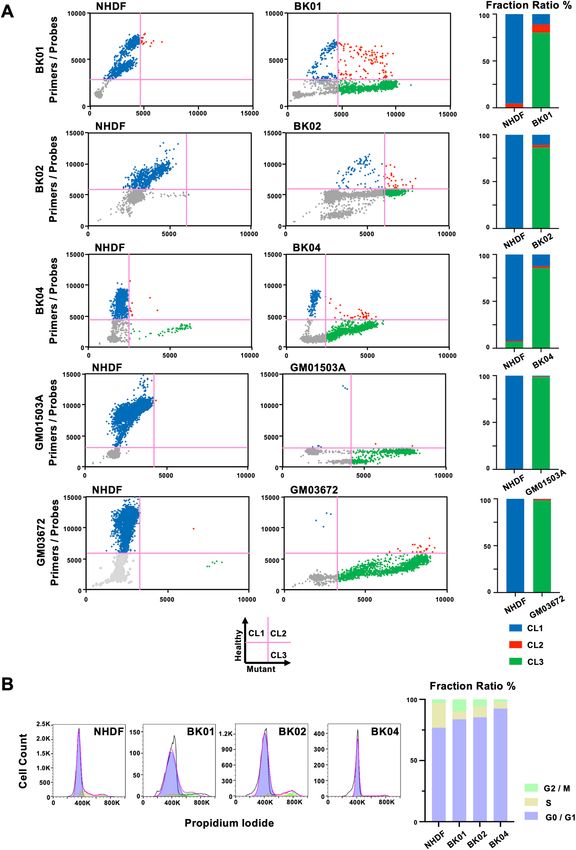
www.nature.com/scientificreports/

                            Figure 1.  (A) Clinical and genetic characteristics of patients from whom primary human dermal fibroblasts
                            have been derived. (B) The set of primers and probes is shown on the amplified fragments in the TaqMan SNP
                            Genotyping Assay. (C) Heteroplasmy rates detected by TaqMan SNP Genotyping Assay in each fibroblast.

Scientific Reports |   (2020) 10:10821 |             https://doi.org/10.1038/s41598-020-67686-z                                          3

                                                                                                                                  Vol.:(0123456789)
www.nature.com/scientificreports/
Scientific Reports | (2020) 10:10821 | https://doi.org/10.1038/s41598-020-67686-z 4
Vol:.(1234567890)www.nature.com/scientificreports/
◀Figure 2. (A) Representative image of droplets containing a single cell. Arrowheads show nuclei of cells dyed
by Hoechst 33342. (B) sc-ddPCR protocol that we used for this work. (C) Threshold line setting for the set of
probes. Threshold lines were set by ddPCR using plasmids carrying a NHDF-specific (healthy) target sequence
(NHDF plasmid) and mutation-specific target sequence (BK01, BK02, BK04, GM01503A, and GM03672
plasmids). (D) Results of ddPCR using plasmids for threshold line setting. (E) Threshold lines validated by the
proportional relations between the cell copy number of the positive signals above the threshold and the loaded
cell number. The upper figure shows the cell copy number of NHDF-specific (healthy) target sequences detected
by each set of probes when encapsulating NHDFs at a concentration of 2.5 × 10⁵/ml or 1.25 × 10⁵/ml. The lower
figure shows the cell copy number of the mutant-specific target sequence detected when encapsulating mutant
cells at a concentration of 2.5 × 10⁵/ml or 1.25 × 10⁵/ml.
We depicted the results in a quadrant format with a healthy signal as the y-axis and a mutant signal as the
x-axis. The quadrant analysis shows cells possessing only healthy mtDNA in the upper left (cluster 1: CL1), cells
possessing both mutant and healthy mtDNA in the upper right quadrant (cluster 2: CL2), and cells possessing
only mutant mtDNA in the lower right quadrant (cluster 3: CL3). The lower left quadrant exhibits droplets
without a cell (Fig. 3A, Supplemental Fig. S2). All SNP assays using sc-ddPCR were performed in triplicate. The
quadrant analysis in BK01 showed that a major part of cells was homoplasmy in the mutant mtDNA plotted in
CL3, but a minor part of cells had two kinds of mtDNA, the mutant and healthy mtDNA, plotted in CL2, which
is the state of a microheteroplasmy (Fig. 3A, upper panel). Moreover, a population of cells constituted solely of
healthy mtDNA existed in cells were considered to be a homogeneous population. BK02 and BK04 contained the
cell population with both the mutant and healthy mtDNA plotted in CL2 at a rate of 2.73% and 1.88%, respec-
tively (Fig. 3A, middle panel). Both GM0503A and GM03672 were homoplasmic of mutant mtDNA (CL3) at
approximately 98.3%, whereas the remnants exhibited either heteroplasmy or homoplasmy of healthy mtDNA
(Fig. 3A, lower panel).
Cell cycle analysis. In the quadrant analysis, there were two distinct fractions in CL1 and CL3, although it
was difficult to judge whether two populations were in CL2 due to small events. Cell cycle analysis revealed that
the fractions of S phase in the three cell lines were less than half that found in NHDFs. The sum of the G2/M and
S phases ranged from 10 to 20% in diseased fibroblasts (Fig. 3B). The ratios of the two fractions were nearly even,
suggesting that the duplicated content of mtDNA might occupy half of the cell cycle.
Discussion
This study provides a high-throughput method to evaluate the heteroplasmy of mtDNA in a single cell, not quan-
titatively, but by the presence or absence of the mutated mtDNA. This sc-ddPCR could reveal the existence of
mtDNA variances as low as 1% frequency in a single cell without cloning steps. The time to complete sc-ddCPR
and analyze its data should be less than a few hours, the running cost for each sample is tens of dollars, and
the procedure in sc-ddPCR is similar to conventional qPCR. Because we harnessed the recombinant plasmid
carrying a target sequence to draw the standard line in the conventional TaqMan SNP genotyping assay, it was
diverted in sc-ddPCR. In the case of independent sc-ddCPR, the target sequence for the threshold line should use
chemically produced oligonucleotides with respect to cost, labor, and time. The existence of the minor popula-
tion of homoplasmy with healthy mtDNA suggests that the patient’s skin might hold fibroblasts with a healthy
homogeneous haplotype of mtDNAs. Moreover, the minority of intracellular heteroplasmy in all fibroblasts could
be suggestive of the development and progression of mitochondrial diseases in a single cell with a life that has
unsolved questions. The heteroplasmy in either dividing cells or nondividing cells changes with time via various
mechanisms, which affect the development and progression of the disease. In the context of cancer, treatment
with anti-cancer drugs targeted to specific molecules along with companion diagnostic immunoassays have been
shown to assist in determining whether different individual treatment regimens are indicated. In the treatment
of mitochondrial diseases, development of similar companion diagnostics is still required30. Although recent
advances in biomarkers for mitochondrial diseases have established the effectiveness of fibroblast growth factor
21 (FGF21)31 and growth/differentiation factor 15 (GDF15)32, the regain of wild-type mtDNA and the removal
of mutation burden in affected cells should be an optimal indicator of a successful cure. Heteroplasmy should
be useful not only for a diagnosis of mitochondrial diseases but also for an estimation of the effectiveness in the
treatment process.
Methods to detect heteroplasmic variations in the mitochondrial genome are divided into two modalities:
next-generation sequencing (NGS) for unrecorded mutations and PCR-based detection for recorded mutations.
A major portion of genomic samples originate from the nucleus (more than 99% of the total DNA), and this
could disturb outcomes in both methods to detect the diversity of the mitochondrial genome. Cesium chloride
density centrifugation was initially utilized for the enrichment of the mitochondrial g enome33. Mitochondrial
isolation with centrifugation34 was examined for the purpose of mitochondrial genome enrichment, which has
not completely prevented contamination of the nuclear genome. The whole mitochondrial genome has been
mapped by either long-range PCR35 or overlapping fragment amplification36, both of which hold clonal amplifica-
tion of errors introduced by polymerase37. Another mitochondrial genome enrichment protocol was introduced
for heteroplasmy research to utilize DNA polymerase of bacteriophage phi29, which possesses strand displace-
ment activity, proof-reading activity and generation of very long synthesis products, resulting in more efficient
amplification of circular DNA than linear D NA38. MitoRS enriched the mitochondrial genome by using phi29,
and the sequence revealed single nucleotide variants at a 1% f requency39. Although methyl-specific endonu-
cleases to delete the nuclear genome that is more methylated than the mitochondrial genome were utilized for
Scientific Reports | (2020) 10:10821 | https://doi.org/10.1038/s41598-020-67686-z 5
Vol.:(0123456789)www.nature.com/scientificreports/
Figure 3. (A) Quadrant analysis of mtDNA heteroplasmy in a single cell and the bar graph expressing the ratio
of each quadrant for each primary fibroblast from patients. (B) FACS analysis of the cell cycle in three primary
fibroblasts from patients, using NHDFs as a control.
Scientific Reports | (2020) 10:10821 | https://doi.org/10.1038/s41598-020-67686-z 6
Vol:.(1234567890)www.nature.com/scientificreports/
mitochondrial genome enrichment40, a significant amount of the nuclear genome could remain, and mitochon-
drial genomes could lose. Another enzymatic digestion specific to the linear nuclear genome, exonuclease V, was
applied to enrich the mitochondrial genome, which offered the ideal library introducing fragments of only the
mitochondrial genome with barcoded adapters to N GS41. The abovementioned procedures are time-consuming,
require a large quantity of samples, and are limited in use, especially being unadaptable to single-cell research.
Although NGS is an essential tool to detect both de novo and recorded mutations for rare genetic diseases,
including mitochondrial diseases42, the presence of nuclear mtDNA homologous sequences (NUMTs) could
hinder the accuracy due to false heteroplasmic variations from N UMTs43. NUMTs have been annotated in the
44
human reference g enome but depend upon an individual sample, and the choice of the reference crucially
impacts the outcomes in detecting heteroplasmic v ariances45. To examine low-level heteroplasmic variations,
how to align the raw reads of the whole genome has been devised by a two-step alignment to eliminate the effects
of NUMTs, reaching the power of detecting heteroplasmy as low as 0.2% in two cell l ines46. Polymorphism ratio
sequencing that utilizes Sanger sequencing technology could not identify heteroplasmic variance less than 5%47.
Duplex sequencing technology that reduces errors by independently tagging and sequencing each of the two
strands of DNA achieved a detection limit of 0.1%48. Single-cell sequencing that was applied to determine mtDNA
mutations in hematopoietic cells was executed following single-cell sorting with flow cytometry and direct two-
step nested PCR amplification without cloning but was unable to recognize signals less than 10%49. Single-cell
cloning and sequencing, where eluted and amplified DNA fragments are cloned into plasmids and transformed
into E. coli, and the positive clones are sequenced, was applied to single neurons and glial cells50. However, the
high biased mutation frequency in replication could not provide the accuracy to reveal rare variances. Currently,
single-cell sequencing remains to be solved for low levels of heteroplasmy variances, and even in conventional
NGS, it is too expensive to generate data for laboratory experiments, such as acquiring them over a time course.
On the other hand, although PCR-based methods can be generally applied and only record sequence variances,
their simplicity, swiftness, and inexpensiveness allow them to be utilized as a useful tool. Amplification refrac-
tory mutation system quantitative PCR that amplifies templates with two allele-specific upstream primers and
one downstream primer demonstrated the same detection limit of 0.1% for duplex sequencing51. Digital PCR
conceptionally emerged from single-molecule PCR, which can discover de novo mutations but cannot recognize
variances less than 7%52, and evolved to droplet digital PCR by combining microfluidics d evices53. Enrichment
of amplified products on magnetic beads in emulsions, called beads, emulsions, amplification and magnetics
systems, improved the detection limit to 0.01%, which are compatible with ddPCR54. Although sc-ddPCR with
dual fluorescence colors for heteroplasmy variances is inferior to ddPCR with respect to sensitivity, ddPCR
that uses eluted genetic materials from pooled cells, which other current sophisticated PCR-based methods for
detecting heteroplasmy, such as CataCleave, Scorpion-ARMS and PNA-LNA PCR clamp, also utilize as initial
material, merely provides average values in a group and might mislead researchers regarding the effects of
mtDNA variances. This sc-ddPCR is a first modality to execute a high-throughput detection system for intercel-
lular heterogeneity, although the extent of intracellular heteroplasmy is not quantified. In this study, the reduced
population of cells with heteroplasmy compared with those with either healthy or mutated mtDNA suggests that
heteroplasmy status might be unstable, although more patients and other kinds of cells should be examined to
confirm this possibility. The quantitative measurement of cells with healthy or mutant homoplasmy, or hetero-
plasmy, could provide cues regarding how mitochondrial DNA replication and segregation are regulated. For
perspective, the next generation of ddPCR technology provided by BioRad will soon be released, being multiplex
with multi-laser excitation and multi-emission detection. In addition to detecting multiple mutations, the new
machine enables the simultaneous detection of phenotypes and genotypes in a single cell, such as mitochondrial
ROS generation, by using dye and mitochondrial heteroplasmy, which may help to characterize mitochondria
in a single cell and help to elucidate not only mitochondrial diseases but also aging processes and tumorigenesis
related to mtDNA mutations.
Materials and methods
Cell culture. Normal human dermal fibroblasts (NHDFs) were obtained from Lonza (Walkersville, MD,
USA). Mitochondrial disease patient-derived skin fibroblasts (BK01/02/04) were kindly provided by KOINO-
BORI Associate Inc., which supports the research for mitochondrial diseases under the approval from the ethical
committees of both our institution and KOINOBORI. In addition, two additional fibroblasts (GM01503A and
GM03672) were obtained from Coriell Institute for Medical Research (Camden, NJ, USA). The clinical char-
acteristics of these primary cells are summarized in Fig. 1A. NHDFs were maintained in Dulbecco’s modified
Eagle’s medium (Thermo Fisher Scientific, Waltham, MA, USA) supplemented with 10% fetal bovine serum
(Thermo Fisher Scientific) and 1% penicillin/streptomycin. BK01 cells were cultured in Fibroblast Basal Medium
(FBM) supplemented with FGM-2 SingleQuots (hFGF-B, insulin, FBS and gentamicin/amphotericin-B) (Lonza,
Walkersville, MD, USA). BK02 and BK04 were cultured in Dulbecco’s modified Eagle’s medium low glucose
(Thermo Fisher Scientific) supplemented with 10% fetal bovine serum (Thermo Fisher Scientific) and 1% peni-
cillin/streptomycin. GM01503A and GM03672 were cultured in Minimum Essential Medium (Thermo Fisher
Scientific) supplemented with 15% fetal bovine serum (Thermo Fisher Scientific), 1% Non-essential Amino
Acid Solution (Thermo Fisher Scientific) and 1% penicillin/streptomycin. All cells were incubated at 37 °C in a
humidified 5% CO2 incubator.
Cell cycle analysis by flow cytometry. Cells were trypsinized, suspended in culture medium, centri-
fuged (1,000 rpm, 5 min) to pellet, and resuspended in PBS. The resuspended cells were added into 4% para-
formaldehyde (FUJIFILM Wako Pure Chemical Corporation, Osaka, Japan) and fixed for at least 15 min at room
temperature. After fixation, the cells were centrifuged (1,500 rpm, 5 min), resuspended in propidium iodide
Scientific Reports | (2020) 10:10821 | https://doi.org/10.1038/s41598-020-67686-z 7
Vol.:(0123456789)www.nature.com/scientificreports/
solution composed of 50 μg/ml propidium iodide, 0.1 mg/ml RNase A, 0.05% Triton X-100 and PBS, and incu-
bated for 40 min at 37 °C. After washing with PBS, the cells were pelleted (1,500 rpm, 5 min), and resuspended
with PBS. The samples were immediately analyzed by flow cytometry. Cell cycle phase distribution was deter-
mined using FlowJo software (Becton, Dickinson and Company, Franklin Lakes, NJ, USA).
Heteroplasmy analysis for mitochondrial DNA mutation. Heteroplasmy of mitochondrial DNA
was determined by TaqMan SNP Genotyping Assay16. Wild-type and mutant allele-specific TaqMan probes and
primers were designed and produced by Thermo Fisher Scientific. The two probes were labeled with different
fluorophores (FAM and VIC) with a quencher attached at the other end. Genomic DNA was extracted from
cells by using NucleoSpin Tissue (Takara Bio Inc., Shiga, Japan). The extracted genomic DNA (100 ng) was used
for quantitative PCR by mixing with the forward and reverse primers, the probes, and the TaqMan Genotyping
Master Mix (Thermo Fisher Scientific) on a CFX connect real-time system (Bio-Rad Laboratories, Inc., Hercu-
les, CA, USA) under the following conditions: 40 cycles of PCR (95 °C for 15 s and 60 °C for 1 min) after the
initial denaturation (95 °C for 10 min). A calibration curve was created by the abovementioned quantitative PCR
using the plasmid of decided copy numbers containing the amplified targeted mtDNA fragments for either wild-
type or mutant sequences. The primers used in this experiment are listed in Fig. 1B.
Single cell droplet digital PCR (sc‑ddPCR). The sc-ddPCR system commenced with the encapsulation
of a single cell into one oil droplet and then proceeded to the PCR step with a set of primers and fluorescent
probes, which are the same as those used in the TaqMan SNP genotyping assay, using TaqMan Polymerase with
the 5′ to 3′ exonuclease, which releases the fluorophore from the probe, followed by the detection of the fluores-
cent signal in the droplets. The PCR mixture consisted of 4 μl resuspended cells at a concentration of 2.5 × 10⁵/
ml or 1.25 × 10⁵/ml, 10 μl 2 × ddPCR Supermix (Bio-Rad), wild-type and mutant allele-specific TaqMan probes
at a concentration of 0.25 μM, primer mixtures at a concentration of 0.9 μM for the target gene, and nuclease-free
water for a final volume of 20 μl. Droplets were generated using the Bio-Rad QX200 system (Bio-Rad) following
the manufacturer’s instructions. The reactions were transferred to a 96-well plate (Eppendorf Corp., Hamburg,
Germany) for the PCRs using a Thermal Cycler (Bio-Rad) under the following conditions: amplification was
carried out at a regular ramp rate of 2.0 °C /s at 95 °C for 10 min followed by 40 cycles of 30 s at 95 °C plus 2 min
at 56 °C. The final enzyme deactivation step occurred at 98 °C for 10 min. The 96-well plate was transferred to a
QX200 Droplet Reader (Bio-Rad), and the number of fluorescent-positive droplets were analyzed. Each droplet
was analyzed individually using a two-color detection system (set to detect FAM and VIC). The fluorescent
droplets were counted to provide an absolute quantification of target mtDNA in digital form using QuantaSoft
software 1.7 (Bio-Rad). We added various numbers of targeted cells to the PCR mix and generated droplets to
ensure single-cell encapsulation. A total of 500 cells per sample were successfully encapsulated into droplets,
and single-cell encapsulation was observed. The threshold line for each fluorescence was determined by separate
experiments, where droplets enclosed a plasmid carrying a target sequence (5,000 copies/a single sample, in
which the majority of the droplets were null while the minority of droplets contained a single copy), instead of a
single cell, and both healthy and mutant probes with different fluorescences were executed for the same ddPCR
protocol as the designated sc-ddPCR protocol. When the results are plotted in 2 dimensions, a quadrant line
is designated for the single positive cluster in the corresponding target-probe combination to provide positive
signals of no more than 1% in the alternative fluorescence at the next quadrant. By drawing the threshold lines,
the specificity for the probe is given as follows: 1-(positive fraction in an alternative fluorescence/all events in
droplets, excluding null droplets, in the corresponding target-probe combination).
Patients characteristics. Five kinds of cells derived from patients diagnosed with a mitochondrial disease
were examined in this study. The characteristics of these cells are summarized in Fig. 1A. These primary fibro-
blasts of the BK series were isolated from the skin biopsies of patients and were established as cultured cells after
informed consent was obtained from all the patients or from a parent or legal guardian if the patient was under
18 years old and was based on the acceptance of the ethical committee from KOINOBORI Associate Inc., which
is a nonprofit organization for mitochondrial diseases in Japan. These cells were provided for our research. This
study was conducted in accordance with relevant guidelines and regulations, and was accepted by the insti-
tutional ethical committee in Kyoto Prefectural University of Medicine (#ERB-C-1010). Two other cell lines,
GM01503 and GM03672, were purchased from Coriell Institute for Medical Research. BK01 was derived from
a 30-year-old female patient with mitochondrial myopathy, encephalopathy, lactic acidosis, and stroke-like epi-
sodes (MELAS), whose culprit is the mutation of A to G in m3243 in the tRNA for leucine. Two other fibroblasts
originated from female patients with Leigh syndrome who were 6 and 1 years of age. One patient (BK02) has
the mutation of T to C in m10158 that is located in the mitochondrially encoded NADH dehydrogenase 3 (MT-
ND3), which constitutes the respiratory chain complex I, also known as NADH dehydrogenase (ubiquinone),
which consists of 37 nuclear and 7 mitochondrially encoded subunits. Another patient (BK04) has the mutation
of T to C in m9185 that is located in the mitochondrially encoded ATP synthase membrane subunit 6, which
encodes the ATP synthase F0 subunit 6 (MT-ATP6), the subunit of the F1F0 ATPase that is also known as com-
plex V, consisting of 14 nuclear and 2 mitochondrial encoded subunits. The inheritance of the proband in BK01
was from her mother, and the mutation of BK02 was de novo. The inheritance of BK04 was not determined.
GM01503 and GM03672 were derived from patients suffering from Leigh syndrome, which was confirmed with
a clinical summary and case history. Because there was no sequence information for either cell line, the whole
mitochondrial genome was sequenced and referenced against the MITOMAP database55. Variant m.14484 T > G
in the MT-ND6 gene in GM01503, which results in the change of the methionine from position 64 to a valine,
could be pathogenic because the change m.14484 T > C (p.Met64Val) has been described as one of the most fre-
Scientific Reports | (2020) 10:10821 | https://doi.org/10.1038/s41598-020-67686-z 8
Vol:.(1234567890)www.nature.com/scientificreports/
quent mutations associated with LHON. Variant m.15257G > A in the CYTB gene, which results in the change of
aspartic acid from position 171 to asparagine, could be causative because the mutation was initially described as
one of the primary mutations of LHON and associated with some mitochondrial diseases. Based on the sequenc-
ing data, both cell lines showed homoplasmy with mutated mtDNA at the abovementioned positions.
Data availability
Raw data are available on request.
Received: 25 December 2019; Accepted: 11 June 2020
References
1. Gorman, G. S. et al. Mitochondrial diseases. Nat. Rev. Dis. Primers 2, 16080. https://doi.org/10.1038/nrdp.2016.80 (2016).
2. Lane, N. & Martin, W. The energetics of genome complexity. Nature 467, 929–934. https://doi.org/10.1038/nature09486 (2010).
3. Lightowlers, R. N., Taylor, R. W. & Turnbull, D. M. Mutations causing mitochondrial disease: What is new and what challenges
remain?. Science 349, 1494–1499 (2015).
4. Stewart, J. B. & Chinnery, P. F. The dynamics of mitochondrial DNA heteroplasmy: implications for human health and disease.
Nat. Rev. Genet. 16, 530–542. https://doi.org/10.1038/nrg3966 (2015).
5. Holt, I. J., Harding, A. E. & Morgan-Hughes, J. A. Deletions of muscle mitochondrial DNA in patients with mitochondrial myo-
pathies. Nature 331, 717–719. https://doi.org/10.1038/331717a0 (1988).
6. Tatuch, Y. et al. Heteroplasmic mtDNA mutation (T–G) at 8993 can cause Leigh disease when the percentage of abnormal mtDNA
is high. Am. J. Hum. Genet. 50, 852–858 (1992).
7. Nunnari, J. & Suomalainen, A. Mitochondria: in sickness and in health. Cell 148, 1145–1159. https://doi.org/10.1016/j.
cell.2012.02.035 (2012).
8. Bender, A. et al. High levels of mitochondrial DNA deletions in substantia nigra neurons in aging and Parkinson disease. Nat.
Genet. 38, 515–517. https://doi.org/10.1038/ng1769 (2006).
9. Aryaman, J., Johnston, I. G. & Jones, N. S. Mitochondrial heterogeneity. Front. Genet. 9, 718. https://doi.org/10.3389/fgene
.2018.00718(2018).
10. Angulo, B., Lopez-Rios, F. & Gonzalez, D. A new generation of companion diagnostics: cobas BRAF, KRAS and EGFR mutation
detection tests. Expert Rev. Mol. Diagn. 14, 517–524. https://doi.org/10.1586/14737159.2014.910120 (2014).
11. Urata, M. et al. High-sensitivity detection of the A3243G mutation of mitochondrial DNA by a combination of allele-specific
PCR and peptide nucleic acid-directed PCR clamping. Clin. Chem. 50, 2045–2051. https://doi.org/10.1373/clinchem.2004.03376
1 (2004).
12. Payungporn, S., Tangkijvanich, P., Jantaradsamee, P., Theamboonlers, A. & Poovorawan, Y. Simultaneous quantitation and geno-
typing of hepatitis B virus by real-time PCR and melting curve analysis. J. Virol. Methods 120, 131–140. https://doi.org/10.1016/j.
jviromet.2004.04.012 (2004).
13. Newton, C. R. et al. Analysis of any point mutation in DNA. The amplification refractory mutation system (ARMS). Nucleic Acids
Res. 17, 2503–2516. https://doi.org/10.1093/nar/17.7.2503 (1989).
14. Huang, M.-M., Arnheim, N. & Goodman, M. F. Extension of base mispairs by Taq DNA polymerase: implications for single
nucleotide discrimination in PCR. Nucleic Acids Res. 20, 4567–4573. https://doi.org/10.1093/nar/20.17.4567 (1992).
15. Gibson, N. J. The use of real-time PCR methods in DNA sequence variation analysis. Clin. Chim. Acta 363, 32–47. https://doi.
org/10.1016/j.cccn.2005.06.022 (2006).
16. Holland, P. M., Abramson, R. D., Watson, R. & Gelfand, D. H. Detection of specific polymerase chain reaction product by utilizing
the 5′ → 3′ exonuclease activity of Thermus aquaticus DNA polymerase. Proc. Natl. Acad. Sci. 88, 7276. https://doi.org/10.1073/
pnas.88.16.7276 (1991).
17. Nurmi, J., Ylikoski, A., Soukka, T., Karp, M. & Lövgren, T. A new label technology for the detection of specific polymerase chain
reaction products in a closed tube. Nucleic Acids Res. 28, e28 (2000).
18. Harvey, J. J. et al. Characterization and applications of CataCleave probe in real-time detection assays. Anal. Biochem. 333, 246–255.
https://doi.org/10.1016/j.ab.2004.05.037 (2004).
19. Whitcombe, D., Theaker, J., Guy, S. P., Brown, T. & Little, S. Detection of PCR products using self-probing amplicons and fluores-
cence. Nat. Biotechnol. 17, 804–807. https://doi.org/10.1038/11751 (1999).
20. Zhang, S. et al. Ultrasensitive and quantitative detection of EGFR mutations in plasma samples from patients with non-small-cell
lung cancer using a dual PNA clamping-mediated LNA–PNA PCR clamp. Analyst 144, 1718–1724 (2019).
21. Huang, Q. et al. Multiplex fluorescence melting curve analysis for mutation detection with dual-labeled, self-quenched probes.
PLoS ONE 6, e19206. https://doi.org/10.1371/journal.pone.0019206 (2011).
22. Huggett, J. F. et al. The digital MIQE guidelines: minimum information for publication of quantitative digital PCR experiments.
Clin. Chem. 59, 892. https://doi.org/10.1373/clinchem.2013.206375 (2013).
23. Watanabe, M. et al. Ultra-sensitive detection of the pretreatment EGFR T790M mutation in non-small cell lung cancer patients
with an EGFR-activating mutation using droplet digital PCR. Clin. Cancer Res. 21, 3552. https://doi.org/10.1158/1078-0432.CCR-
14-2151 (2015).
24. Li, B. et al. Droplet digital PCR shows the D-loop to be an error prone locus for mitochondrial DNA copy number determination.
Sci. Rep. 8, 11392. https://doi.org/10.1038/s41598-018-29621-1 (2018).
25. O’Hara, R. et al. Quantitative mitochondrial DNA copy number determination using droplet digital PCR with single cell resolu-
tion. Genome Res. https://doi.org/10.1101/gr.250480.119 (2019).
26. Trifunov, S. et al. Clonal expansion of mtDNA deletions: different disease models assessed by digital droplet PCR in single muscle
cells. Sci. Rep. https://doi.org/10.1038/s41598-018-30143-z (2018).
27. Igarashi, Y. et al. Single cell-based vector tracing in patients with ADA-SCID treated with stem cell gene therapy. Mol. Ther. Methods
Clin. Dev. 6, 8–16 (2017).
28. Machado, T. S. et al. Real-time PCR quantification of heteroplasmy in a mouse model with mitochondrial DNA of C57BL/6 and
NZB/BINJ strains. PLoS ONE 10, e0133650. https://doi.org/10.1371/journal.pone.0133650 (2015).
29. Morris, J. et al. Pervasive within-mitochondrion single-nucleotide variant heteroplasmy as revealed by single-mitochondrion
sequencing. Cell Rep. 21, 2706–2713. https://doi.org/10.1016/j.celrep.2017.11.031 (2017).
30. Jørgensen, J. T. Companion and complementary diagnostics: clinical and regulatory perspectives. Trends Cancer 2, 706–712 (2016).
31. Suomalainen, A. et al. FGF-21 as a biomarker for muscle-manifesting mitochondrial respiratory chain deficiencies: a diagnostic
study. Lancet Neurol. 10, 806–818. https://doi.org/10.1016/s1474-4422(11)70155-7 (2011).
32. Yatsuga, S. et al. Growth differentiation factor 15 as a useful biomarker for mitochondrial disorders. Ann. Neurol. 78, 814–823.
https://doi.org/10.1002/ana.24506 (2015).
33. Tobler, H. & Gut, C. Mitochondrial DNA from 4-cell stages of Ascaris lumbricoides. J. Cell Sci. 16, 593–601 (1974).
Scientific Reports | (2020) 10:10821 | https://doi.org/10.1038/s41598-020-67686-z 9
Vol.:(0123456789)www.nature.com/scientificreports/
34. Lang, B. F. & Burger, G. Purification of mitochondrial and plastid DNA. Nat Protoc. 2, 652–660. https://doi.org/10.1038/nprot
.2007.58 (2007).
35. Maricic, T., Whitten, M. & Paabo, S. Multiplexed DNA sequence capture of mitochondrial genomes using PCR products. PLoS
ONE 5, e14004. https://doi.org/10.1371/journal.pone.0014004 (2010).
36. He, Y. et al. Heteroplasmic mitochondrial DNA mutations in normal and tumour cells. Nature 464, 610–614. https://doi.
org/10.1038/nature08802 (2010).
37. Aird, D. et al. Analyzing and minimizing PCR amplification bias in Illumina sequencing libraries. Genome Biol. 12, R18 (2011).
38. Johne, R., Muller, H., Rector, A., van Ranst, M. & Stevens, H. Rolling-circle amplification of viral DNA genomes using phi29
polymerase. Trends Microbiol. 17, 205–211. https://doi.org/10.1016/j.tim.2009.02.004 (2009).
39. Marquis, J. et al. MitoRS, a method for high throughput, sensitive, and accurate detection of mitochondrial DNA heteroplasmy.
BMC Genom. 18, 326. https://doi.org/10.1186/s12864-017-3695-5 (2017).
40. McKernan, K. J. et al. Expanded genetic codes in next generation sequencing enable decontamination and mitochondrial enrich-
ment. PLoS ONE 9, e96492. https://doi.org/10.1371/journal.pone.0096492 (2014).
41. Jayaprakash, A. D. et al. Stable heteroplasmy at the single-cell level is facilitated by intercellular exchange of mtDNA. Nucleic Acids
Res. 43, 2177–2187. https://doi.org/10.1093/nar/gkv052 (2015).
42. Ouwehand, W. H. Whole-genome sequencing of rare disease patients in a national healthcare system. bioRxiv, 507244 (2020).
43. Albayrak, L. et al. The ability of human nuclear DNA to cause false positive low-abundance heteroplasmy calls varies across the
mitochondrial genome. BMC Genom. 17, 1017. https://doi.org/10.1186/s12864-016-3375-x (2016).
44. Calabrese, F. M., Simone, D. & Attimonelli, M. Primates and mouse NumtS in the UCSC genome browser. BMC Bioinform. 13,
S15 (2012).
45. Santibanez-Koref, M. et al. Assessing mitochondrial heteroplasmy using next generation sequencing: a note of caution. Mitochon-
drion 46, 302–306. https://doi.org/10.1016/j.mito.2018.08.003 (2019).
46. Duan, M. et al. Evaluating heteroplasmic variations of the mitochondrial genome from whole genome sequencing data. Gene 699,
145–154. https://doi.org/10.1016/j.gene.2019.03.016 (2019).
47. Blazej, R. G., Paegel, B. M. & Mathies, R. A. Polymorphism ratio sequencing: a new approach for single nucleotide polymorphism
discovery and genotyping. Genome Res. 13, 287–293. https://doi.org/10.1101/gr.396203 (2003).
48. Schmitt, M. W. et al. Detection of ultra-rare mutations by next-generation sequencing. Proc. Natl. Acad. Sci. U. S. A. 109, 14508–
14513. https://doi.org/10.1073/pnas.1208715109 (2012).
49. Yao, Y. G. et al. Mitochondrial DNA sequence variation in single cells from leukemia patients. Blood 109, 756–762. https://doi.
org/10.1182/blood-2006-01-011007 (2007).
50. Cantuti-Castelvetri, I. et al. Somatic mitochondrial DNA mutations in single neurons and glia. Neurobiol. Aging 26, 1343–1355
(2005).
51. Bai, R. K. & Wong, L. J. Detection and quantification of heteroplasmic mutant mitochondrial DNA by real-time amplification
refractory mutation system quantitative PCR analysis: a single-step approach. Clin. Chem. 50, 996–1001. https://doi.org/10.1373/
clinchem.2004.031153 (2004).
52. Osborne, A., Reis, A. H., Bach, L. & Wangh, L. J. Single-molecule LATE-PCR analysis of human mitochondrial genomic sequence
variations. PLoS ONE 4, e5636. https://doi.org/10.1371/journal.pone.0005636 (2009).
53. Leng, X., Zhang, W., Wang, C., Cui, L. & Yang, C. J. Agarose droplet microfluidics for highly parallel and efficient single molecule
emulsion PCR. Lab Chip 10, 2841–2843. https://doi.org/10.1039/C0LC00145G (2010).
54. Chen, W. W. et al. BEAMing and droplet digital PCR analysis of mutant IDH1 mRNA in glioma patient serum and cerebrospinal
fluid extracellular vesicles. Mol. Ther. Nucleic Acids 2, e109. https://doi.org/10.1038/mtna.2013.28 (2013).
55. Brandon, M. C. et al. MITOMAP: a human mitochondrial genome database–2004 update. Nucleic Acids Res. 33, D611-613. https
://doi.org/10.1093/nar/gki079 (2005).
Acknowledgements
The present work was technically supported by Bio-Rad Laboratories, Inc. This research was performed by a
research collaborative grant from IMEL Biotherapeutics, Inc.
Author contributions
S.G. designed the research; R.M. performed all experiments; R.M., D.K., H.M., and A.S. analyzed and discussed
the data; and R.M. and S.G. wrote the paper.
Competing interests
S.G. and D.K. received a research collaborative grant from IMEL Biotherapeutics, Inc.. R.M., H.M. and A.S. have
no competing interests.
Additional information
Supplementary information is available for this paper at https://doi.org/10.1038/s41598-020-67686-z.
Correspondence and requests for materials should be addressed to S.G.
Reprints and permissions information is available at www.nature.com/reprints.
Publisher’s note Springer Nature remains neutral with regard to jurisdictional claims in published maps and
institutional affiliations.
Open Access This article is licensed under a Creative Commons Attribution 4.0 International
License, which permits use, sharing, adaptation, distribution and reproduction in any medium or
format, as long as you give appropriate credit to the original author(s) and the source, provide a link to the
Creative Commons license, and indicate if changes were made. The images or other third party material in this
article are included in the article’s Creative Commons license, unless indicated otherwise in a credit line to the
material. If material is not included in the article’s Creative Commons license and your intended use is not
permitted by statutory regulation or exceeds the permitted use, you will need to obtain permission directly from
the copyright holder. To view a copy of this license, visit http://creativecommons.org/licenses/by/4.0/.
© The Author(s) 2020
Scientific Reports | (2020) 10:10821 | https://doi.org/10.1038/s41598-020-67686-z 10
Vol:.(1234567890)You can also read