The cooling signature of basal crevasses in a hard-bedded region of the Greenland Ice Sheet - The Cryosphere
←
→
Page content transcription
If your browser does not render page correctly, please read the page content below

The Cryosphere, 15, 897–907, 2021
https://doi.org/10.5194/tc-15-897-2021
© Author(s) 2021. This work is distributed under
the Creative Commons Attribution 4.0 License.

The cooling signature of basal crevasses in a hard-bedded region of
the Greenland Ice Sheet
Ian E. McDowell1,3 , Neil F. Humphrey1 , Joel T. Harper2 , and Toby W. Meierbachtol2
1 Department of Geology and Geophysics, University of Wyoming, Laramie, Wyoming, 82071, USA
2 Department of Geosciences, University of Montana, Missoula, Montana, 59812, USA
3 Graduate Program of Hydrologic Sciences, University of Nevada, Reno, Nevada, 89557, USA

Correspondence: Ian E. McDowell (ian.mcdowell@nevada.unr.edu)

Received: 21 July 2020 – Discussion started: 17 August 2020
Revised: 21 December 2020 – Accepted: 19 January 2021 – Published: 19 February 2021

Abstract. Temperature sensors installed in a grid of nine full-   1   Introduction
depth boreholes drilled in the southwestern ablation zone of
the Greenland Ice Sheet recorded cooling in discrete sections     Rates of ice deformation and the onset of basal sliding are
of ice over time within the lowest third of the ice column in     regulated by the thermal regime of ice sheets (Hooke, 1981;
most boreholes. Rates of temperature change outpace cool-         Weertman, 1957), which makes ice temperature an important
ing expected from vertical conduction alone. Additionally,        physical variable to be measured in the field and modeled to
observed temperature profiles deviate significantly from the      determine current and future ice motion. As ice moves from
site-average thermal profile that is shaped by all thermome-      the central divide towards the margins, heat is conducted into
chanical processes upstream. These deviations imply recent,       the ice column from the surface and basal boundaries and is
localized changes to the basal thermal state in the boreholes.    introduced through sources such as energy released by in-
Although numerous heat sources exist to add energy and            ternal deformation and refreezing of meltwater (Cuffey and
warm ice as it moves from the central divide towards the mar-     Paterson, 2010).
gin such as strain heat from internal deformation, latent heat       Mechanisms of heat transfer and heat sources in Green-
from refreezing meltwater, and the conduction of geothermal       land’s ablation zone have been investigated by comparing
heat across the ice–bedrock interface, identifying heat sinks     sparsely collected temperature profiles to output from ther-
proves more difficult. After eliminating possible mechanisms      momechanical models (e.g., Iken et al., 1993; Funk et al.,
that could cause cooling, we find that the observed cooling is    1994; Lüthi et al., 2002; Harrington et al., 2015; Lüthi et al.,
a manifestation of previous warming in near-basal ice. Ther-      2015; Poinar et al., 2017). When attempting to replicate the
mal decay after latent heat is released from freezing water       vertical temperature structure, models consistently produced
in basal crevasses is the most likely mechanism resulting in      ice temperatures that are lower than collected temperatures.
the transient evolution of temperature and the vertical ther-     Previous modeling and observational studies highlight the
mal structure observed at our site. We argue basal crevasses      appreciable influence of refreezing meltwater as a source of
are a viable englacial heat source in the basal ice of Green-     latent heat in Greenland’s ablation zone (e.g., Phillips et al.,
land’s ablation zone and may have a controlling influence on      2013; Harrington et al., 2015; Lüthi et al., 2015; Poinar et al.,
the temperature structure of the near-basal ice.                  2017; Seguinot et al., 2020; Thomsen et al., 1991). Outside
                                                                  of Greenland, observations of englacial warming from latent
                                                                  heat sources have been demonstrated as early as the 1970s
                                                                  (Jarvis and Clarke, 1974).
                                                                     Here we investigate heat transfer processes using an exten-
                                                                  sive dataset collected from over 300 temperature sensors em-
                                                                  placed in a grid of nine full-depth boreholes in southwestern
                                                                  Greenland. Our data provided sub-daily continuous records

Published by Copernicus Publications on behalf of the European Geosciences Union.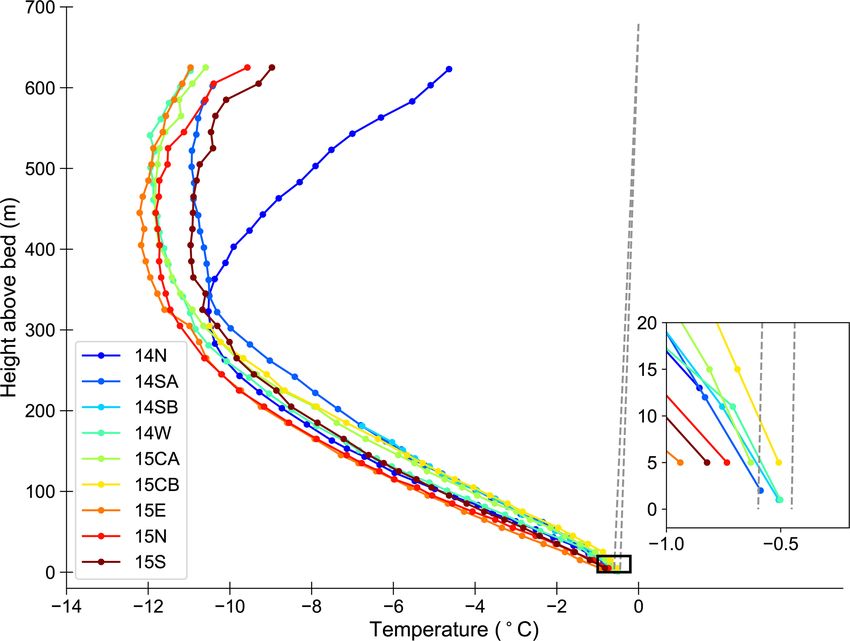
898                                                                   I. E. McDowell et al.: The cooling signature of basal crevasses

                                                                          the remaining 4 % (Maier et al., 2019). Airborne radar
                                                                          measurements indicated that the bed elevation increases
                                                                          slightly from east to west across the site such that the ice
                                                                          flowed up a minor reverse bed slope (Paden et al., 2014).

                                                                          2.2   Data collection

                                                                          A hot water drill was used to melt boreholes ∼ 10 cm in di-
                                                                          ameter through the full depth of the ice column. Cat-5 ca-
                                                                          bles instrumented with TMP102 temperature sensors with
                                                                          12-bit analog-to-digital converters were installed in the bore-
                                                                          holes after drilling and logged with a custom data logger
                                                                          at the surface. Each temperature sensor was controlled by
                                                                          a separate downhole microprocessor that ensured the sensor
Figure 1. Map of the field location showing the layout of the nine        was powered only as minimally required to obtain a read-
boreholes (blue dots) and the five GPS stations (black triangles).        ing. The paired microprocessor handled all digital communi-
Borehole nomenclature is determined by the year that they were            cations, power control, and data processing to minimize er-
drilled and the direction from the center borehole and GPS station.
                                                                          rors caused by self-heating. Sensors were spaced every 10 m
The boreholes are located ∼ 33 km from the margin of Issunguata
                                                                          in the lowest 150 m of the ice column and every 20 m for
Sermia outlet glacier shown in a Landsat 8 image taken in July 2014
in the upper right inset. The location in southwestern Greenland is       the remainder of the depth. The uncalibrated accuracy of
shown in the lower inset, and boreholes are plotted on a WorldView-       the sensors was 0.5 ◦ C, and the resolution was 0.0625 ◦ C.
2 image from July 2012 (© DigitalGlobe, Inc. 2011).                       We performed a freezing-point calibration prior to complete
                                                                          borehole freeze-up using a Clausius–Clapeyron gradient of
                                                                          −7 × 10⁻⁸ ◦ C Pa−1 (Cuffey and Paterson, 2010). However,
of ice temperature over a 2–3-year period, longer than many               due to uncertainty in the Clausius–Clapeyron slope given dis-
similar temperature time series datasets. The high temporal               solved air and impurities within the ice and the ambient pres-
and spatial resolution allowed us to examine how the verti-               sure at the time of calibration, we are confident in the sen-
cal thermal structure evolves in both time and space during               sors’ accuracy to approximately 0.5 ◦ C. Data loggers at the
the study period. Our continuous record of englacial temper-              ice surface recorded temperature readings every 4 h between
atures enabled us to identify dominant drivers of heat flow at            the date the borehole was drilled in either July 2014 or July
our field location.                                                       2015 and the end of the data collection period in July 2017.
                                                                          Each temperature measurement that the sensor records was
                                                                          an average of 64 temperature readings, which was then reg-
2     Methods                                                             istered at the nearest resolution step of the sensor.
                                                                             Our data allowed us to examine both the vertical temper-
2.1    Field site
                                                                          ature field within the ice column and the temporal changes
Nine boreholes were drilled in the southwestern portion of                in temperature. The temperature of a hot-water-drilled bore-
the Greenland Ice Sheet in a sector that discharges in the                hole decays towards the ambient ice temperature over time.
land-terminating outlet glacier, Issunguata Sermia. The field             After 1 year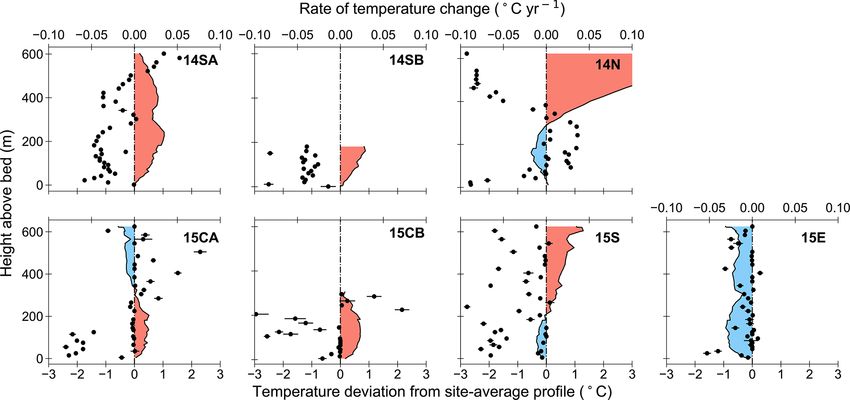
I. E. McDowell et al.: The cooling signature of basal crevasses                                                                899

   We also neglected the first year of measured temperatures
in the temporal records of temperature change to eliminate
the drilling disturbance. After this time, the measurements of
temperature in the environment isolated from electrical noise
resulted in a time series of temperature changes that is mostly
noise-free and at the absolute limit of the sensor’s resolution.
The data were cleaned of the few readings recording more
than ±2 resolution steps from the preceding and succeed-
ing measurements, since extreme jumps were likely caused
by digital transmission errors between the sensor and data
logger at the surface. Although englacial temperatures likely
vary smoothly over time, the digital representation from sen-
sor data shows temperatures changing over time in a stair-
stepping pattern. Since the temporal temperature variations
are small in relation to the sensor resolution, the dataset is
highly characterized by this stepped behavior (Fig. S1).
   We determined the rate of temperature change recorded by        Figure 2. Temperature profiles for each borehole plotted with re-
a sensor using a least-squares regression of the data recorded     spect to each sensor’s height above the bed. Sensor locations are
over time. Often the first and last digital steps of this record   marked with points, and temperatures between sensors are linearly
                                                                   interpolated. Dashed lines indicate the range of pressure melting
had fewer entries recorded due to the restrictions of the sam-
                                                                   temperatures given the various Clausius–Clapeyron gradients pre-
pling window. Linearly regressing our stepped data to de-          sented in Cuffey and Paterson (2010). The black box indicates the
termine the rate of change of temperature required careful         extent of the inset showing temperatures in the lowest 20 m.
treatment to prevent a biased estimate from truncated obser-
vation periods. Assuming that temperature change is close
to linear with time, we expected that with a longer record,           Rates of temperature change are generally a function of
the sensor would record approximately the same number of           position in the ice column (Fig. 3). We captured a clear cool-
readings at each resolution step. Short data lengths occur-        ing signature in the lowest third of the ice column in most
ring at either the beginning or end of the records were likely     boreholes, with some boreholes warming or cooling in loca-
truncated by the restricted time period of our study. To cor-      tions outside of this region. Most boreholes cool at a rate of
rect for our restricted sampling time, we padded the first and     a few hundredths of a degree Celsius per year in the lowest
last steps in our data to match the length of a fully recorded     portion of the ice column. Only five full-depth profiles are
resolution step. This was performed by copying the required        shown, as temperature sensors in boreholes 15N and 14W
length of data from a full resolution step and pre- or post-       failed for most of the study period. Boreholes 15CB and
appending it to the truncated data, while equating the tem-        14SB were only instrumented in the lowest portion of the
peratures. This procedure is illustrated in Fig. S2, which also    ice column.
shows the difference in derived rates of temperature change           While the observed temporal temperature changes are
over time (Supplement).                                            small, we believe the trends are a real signal and not an ar-
                                                                   tifact of sensor drift or random noise. Analog-to-digital sys-
                                                                   tems can exhibit both noise and drift over time; however, the
3   Results
                                                                   expected magnitude of drift or aging is approximately an or-
The vertical temperature field collected from the nine bore-       der of magnitude less than our observed trends. In addition,
holes 1 year after temperature sensors were installed contains     the coherence and lack of obvious bias in the data gives us
a cold central core with temperatures increasing towards the       confidence. We observe coherent sections of ice that cool (the
surface and the bed (Fig. 2). Two boreholes were only in-          bottom of 14SA, 14N, and 15CA) while other portions warm
strumented with temperature sensors in the lowest half of the      (top of 15CA and 14SA). Additionally, borehole pairs 14SA,
ice column. Temperatures are lowest in approximately the           14SB and 15CA, 15CB are located within 10 m of each other
middle of the ice column, ranging from ∼ −12 to −10 ◦ C,           and show similar rates and extent of cooling over time, estab-
and increase to ∼ −11 to −4.5 ◦ C at the surface. Temper-          lishing repeatability and viability of our measurements and
atures also increase towards the bed, reaching temperatures        methods.
that range from approximately −0.9 to −0.5 ◦ C. To estab-
lish a depth reference for sensor comparison, and since we
are most interested in near-basal ice temperatures, we have        4   Discussion
plotted temperature profiles with respect to height above the
                                                                   We focus on observed basal cooling, since cooling of ice near
bed.
                                                                   the bed is enigmatic. Multiple heat sources are available to

https://doi.org/10.5194/tc-15-897-2021                                                      The Cryosphere, 15, 897–907, 2021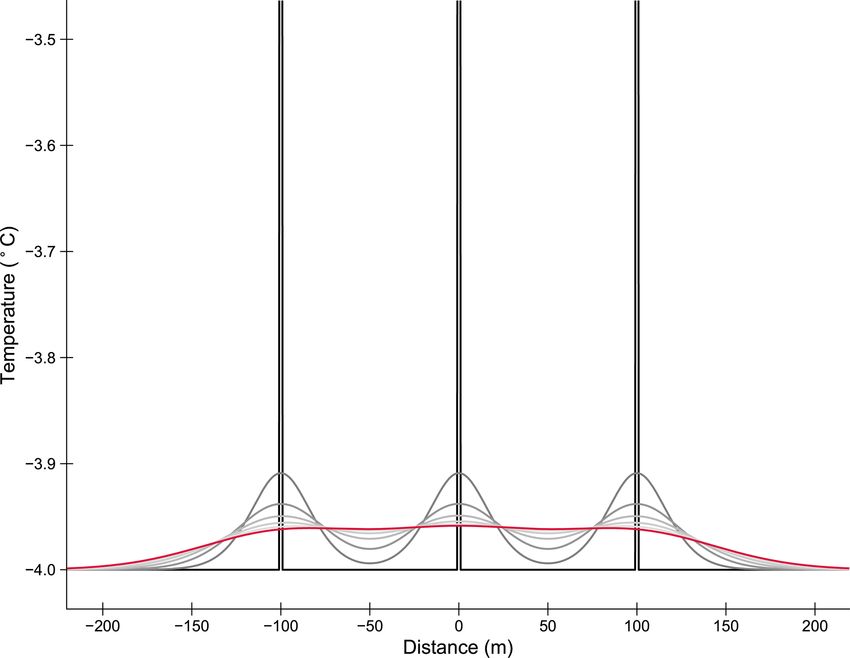
900                                                                 I. E. McDowell et al.: The cooling signature of basal crevasses

Figure 3. Rates of temperature changes for each borehole plotted against each sensor’s height above the bed. Boreholes drilled in 2014
show trends between July 2015 and July 2017, while temperature trends in boreholes drilled in 2015 represent temperature changes observed
between July 2016 and July 2017. Error bars indicate 2 standard errors from the mean rate, determined by the linear regression.

warm ice as it flows from the interior towards the margins.             nomial to facilitate comparison between the changes in tem-
Heat sinks, however, are not obvious, other than vertical ther-         perature expected from collected profiles.
mal conduction from the relatively warm ice at the bed into                Comparison of our data and expected temperature changes
the cold central core. We proceed by investigating the poten-           from the analytical diffusion equation (Eq. 1) indicates the
tial causes of cooling in the lower part of the ice column.             curvatures in our temperature profiles cannot produce the ob-
                                                                        served temporal changes of temperature over time through
4.1   Diffusive cooling driven by the observed static                   diffusive vertical heat flow alone. To illustrate the discrepan-
      temperature field                                                 cies between calculated temperature changes caused by verti-
                                                                        cal thermal diffusion and the observed temporal temperature
We compare the magnitude of observed cooling over time                  change, we calculate the additional sources or sinks of heat
to the temporal temperature changes that would be produced              required throughout the ice column to sustain the observed
from purely vertical thermal diffusion given the shapes of              temperature change through time. Figure 4 presents a vertical
our collected temperature profiles. We use the 1-D thermal              distribution of the required Q from the thermal diffusion cal-
diffusion equation in the vertical dimension:                           culations to produce the recorded temperature changes. Al-
                                                                        though there is considerable variability, all boreholes require
∂T   ∂ 2T Q (z, t)
   =κ 2 +          ,                                          (1)       additional heat sinks within portions of the lowest half of the
∂t   ∂z    ρC                                                           ice column, demonstrating that cooling near the bed cannot
where T is temperature, and t is time; κ, ρ, and C are respec-          result from vertical thermal conduction alone.
tively the thermal diffusivity, density, and specific heat capac-          In addition, we also highlight regions of the tempera-
ity of ice. Table S1 contains the constants used in this study.         ture profiles that are not only warming or cooling anoma-
We set the source or sink term, Q, to zero, assuming only               lously, but that may be warmer or cooler than would be ex-
thermal diffusion occurs for the following calculations. The            pected given the average vertical temperature field at our
spatial second derivative is derived from our observed tem-             site. The shape of the site-averaged temperature profile re-
perature profile. The temperature data have small amounts of            sults from ice integrating changes in boundary conditions
noise as well as calibration offsets between sensors. Deriva-           and all upstream thermomechanical processes. Any deviation
tives of real data, with any noise or error, tend to amplify            from this averaged profile within each collected temperature
the noise. To reduce noise levels and focus on the large-scale          profile will highlight thermal regions that reflect changes ei-
characteristics, we smooth the profiles using a fifth-degree            ther to the local boundary conditions or to heat sources or
polynomial. We choose a fifth-degree polynomial because it              sinks. These changes must have occurred recently for sen-
smooths over sharp kinks within the profile from calibration            sors within the closely spaced boreholes to capture tempera-
errors while maintaining the original curvature, particularly           ture fields that do not match the average vertical temperature
the negative concavity of the temperature profiles observed             field at the site.
near the bed. The full-depth observed rates of temperature                 Discrepancies between each collected profile and the site-
change in Fig. 3 are also smoothed using a fifth-degree poly-           average temperature profile are shown in Fig. 5. Generally,

The Cryosphere, 15, 897–907, 2021                                                            https://doi.org/10.5194/tc-15-897-2021
I. E. McDowell et al.: The cooling signature of basal crevasses 901
Figure 4. Additional heat fluxes required to maintain observed rates of temperature change if the collected static temperature profiles evolve
through vertical thermal conduction over time. The dashed line indicates the switch between a required heat source or sink.
there are positive deviations within the lowest portion of the our site, with an even smaller temperate layer upstream. This
ice column where there is a clear signal of cooling in bore- process cannot explain cooling outside of this small area near
holes 14SA, 14SB, 14N, 15CA, and 15CB, showing temper- the bed.
atures in the lowest portion of these boreholes are higher than
those in the site-average profile and cool over time. Encour- 4.2.2 Basal refreezing from a thinning ice column
agingly for this analysis, the temperatures in the upper half of
the 14N and 15CA profiles are warmer than the site-average The ice sheet thins slightly along flow at our field site; the
profile, and cooling occurs over time. While the pattern of bed elevation increases while the surface elevation remains
temporal temperature change in boreholes 15S and 15E is not relatively constant. With a lower ice overburden pressure, the
as clear, 15E is colder throughout the full-ice depth than the pressure melting temperature increases (Cuffey and Paterson,
mean thermal profile, but this borehole is also where sensors 2010). Any interstitial water present in the ice would then be
record the most warming throughout the profile. Spatially, colder than the new melting temperature and would refreeze.
the southeast portion of our field site does not have a cooling Lüthi et al. (2002) estimated the water content of the tem-
signature in relatively warm ice near the bed, which is evi- perate layer of ice near the bed of Jakobshavn Isbræ has a
dent throughout the other boreholes that have time series of moisture content of ∼ 1 %. However, refreezing releases la-
temperature measurements. tent heat into the surrounding ice, resulting in warming rather
than cooling. Because the temperate layer is confined adja-
4.2 Possible heat sinks cent to the bed, this process would also be localized.
Pervasive cooling in the lowest portion of boreholes where 4.2.3 Downward advection of the cold central core
ice is warmer than the site-average profile in some, but not
all, of our borehole data is enigmatic, since multiple heat All full-depth temperature profiles display a characteristic
sources exist near the bed, but identifying heat sinks is prob- cold central core (Fig. 2). Vertical compression caused by
lematic. In addition, the non-uniform nature of cooling near longitudinal and transverse extension or basal melting could
the bed requires explanation. We discuss several possible shift the cold ice downwards, causing temperatures in the
heat sinks below. lowest 100 m to decrease. Our sensors would fail to detect
this cooling because they are mechanically coupled to the
4.2.1 Melting in basal temperate ice same package of ice through time after the borehole freezes.
The sensors move with the ice and continue to record tem-
Ice near the bed at our field site is at the calculated pres- perature of the same section of ice through time.
sure melting temperature (Fig. 2). Some melting can occur Alternatively, vertically compressing ice would steepen
in this temperate ice as the pressure field varies due to ice thermal gradients and facilitate higher rates of heat flow into
flow, and transient increases in pressure decrease the melting the cold core. With an average surface vertical strain rate of
point. Melting may contribute to cooling near the bed as heat −0.0043 yr−1 at our site (Maier et al., 2019), the change in
is needed for the phase change. However, ice only reaches the temperature gradient would result in temperature changes
the pressure melting temperature in the lowest ∼ 5–10 m at orders of magnitude lower than observed.
https://doi.org/10.5194/tc-15-897-2021 The Cryosphere, 15, 897–907, 2021902 I. E. McDowell et al.: The cooling signature of basal crevasses
Figure 5. Rates of temperature change for each borehole (black dots) plotted with temperature deviations within each borehole from the
site-average temperature profile. Red shaded regions indicate that the collected static profile is warmer than the site-average profile, and blue
shaded regions show the static profile is colder than the site-average profile. Error bars on the calculated rates are the same as in Fig. 3.
4.2.4 Long-term changes in boundary conditions 4.2.5 Changes in ice motion
Variations in the boundary temperatures will propagate into
the interior of the ice column. Here we address several of The interior ice sheet, which is frozen to the bed, moves
the most likely boundary temperature changes to assess how largely by internal deformation and accumulates dissipated
they could affect the temporal evolution of the ice at our site. heat near the bed where strain rates are highest. Ice at our
The Little Ice Age in Greenland occurred approximately site moves primarily by basal sliding (Maier et al., 2019)
500–200 years ago, and surface temperatures were ∼ 0.5 ◦ C and this strain heat source is negligible, although frictional
colder than present (Dahl-Jensen et al., 1998). Scaling the heating still exists at the base. Downstream from the region
e-folding time and length-scale of 1-D thermal diffusion de- where this transition from deformation to sliding occurs, the
scribed in Eq. (1) is useful for examining the thermal influ- ice near the bed would lose the strain-derived thermal en-
ence of a heat source and is approximated based on the ex- ergy and would cool as the heat diffused upward into the cold
ponential behavior of the solution to the partial-differential core. Although the location of the upstream transition from
equation. The length, δ, at which surface temperatures have a frozen to thawed bed conducive to basal sliding is not pre-
significantly decayed is proportional to the square root of cisely known, it is on the order of 200 km up-glacier from our
thermal diffusivity (κ) and time (t): field site (MacGregor et al., 2016), which translates to sev-
√ eral thousand years for ice flow. Any heat anomalies would
δ = κt. (2) have decayed using Eq. (2). Additionally, we have shown
that the shape of the temperature profiles that would result
The length scale for changes in surface temperatures dur- from previously accumulated strain heat near the base will
ing the Little Ice Age 500 years ago is ∼ 130 m, which sug- not produce the magnitude of observed cooling from vertical
gests hardly any thermal signature from the surface boundary thermal conduction alone. An additional heat sink must be
exists below ∼ 400 m depth. required.
Equation (2) also provides an estimate of the timescale Although the frozen-to-sliding transition is probably the
of diffusion, illustrating changes in ice temperature from the largest change to the strain heating term, analysis by Meier-
end of the last interglacial period would have diffused away bachtol et al. (2016) shows a strong change in the basal
through the entire ice column after ∼ 12 000 years. shear stress regime approximately 75 km upstream of our
The most significant thermal change to the basal bound- site, where the basal shear stress decreases down-flow by
ary is the transition from frozen to temperate, which occurs a factor of 2. Again Eq. (2) illustrates that the thermal im-
upstream of our site. This change introduces a warmer basal pact is negligible at our site, especially since the bulk of the
boundary relatively recently in terms of the ice flow; how- strain, and therefore strain heating, occurs close to the basal
ever, this would create a region of colder ice near the bed boundary, which forms a fixed boundary condition at a short
that is being warmed by conduction from the warm bed, not length scale for heat flow. However, this analysis indicates
cooled as we observe. that variations in the basal boundary stress state can cause
The Cryosphere, 15, 897–907, 2021 https://doi.org/10.5194/tc-15-897-2021I. E. McDowell et al.: The cooling signature of basal crevasses 903
minor heating or cooling if strain, and therefore dissipated into the cold ice. The refreezing of this injected water re-
heat, is removed or reduced. We cannot completely eliminate leases heat into the surrounding ice. Accurately modeling the
this process, since basal conditions are not well known. thermal disturbance created by a basal crevasse is hampered
by our lack of knowledge of these features within grounded
4.3 Thermal decay from basal crevasses glaciers and ice sheets, since they have only been directly ob-
served under mountain glaciers (Harper et al., 2010). Exten-
With the lack of obvious heat sinks, we investigate the pos- sive basal crevasse fields have been identified based on strong
sibility that the observed cooling in the lower depths of the hyperbolic reflections in radar surveys near the base of float-
ice occurs as thermal decay after latent heat is released from ing ice shelves (e.g., Jezek and Bentley, 1983; McGrath et
freezing water. Temporally and spatially uniform heating by al., 2012; Luckman et al., 2012) and in ice streams that were
refreezing of disseminated water would not lead to our ob- once a part of relict ice shelves (Catania et al., 2005). How-
servations, since horizontal thermal diffusion would not oc- ever, the base environment of ice shelves is different than that
cur in laterally extensive sections of isothermal ice. However, of grounded glaciers and ice sheets, with conditions charac-
widely spatially separated transient heating events, such as terized by deviatoric tensile stresses and basal water pres-
dispersed basal crevasses or moulins, only warm ice locally, sures at ice overburden pressure that are conducive for basal
leaving significant regions of colder, unheated ice to facilitate crevasse formation (Weertman, 1980), while tidal flexing at
horizontal diffusion. Heat flow along horizontal temperature the grounding line also contributes to the formation and spac-
gradients allows the warmed ice to cool back to ambient tem- ing of basal crevasses within floating ice (Jezek and Bentley,
perature. Since heat would flow horizontally, not vertically, 1983).
the temperature changes would not be revealed by our verti- We do not attempt detailed modeling of the thermal dis-
cal thermal diffusion calculations governed by the shape of turbance of basal crevasses at our field site, but we can ap-
the temperature profiles. proximate the thermal disturbance created by a single or
A similar pattern of cooling in ice warmer than the site- by multiple basal crevasses to compare with our data. One-
average thermal profile is found in the upper portion of 14N dimensional thermal modeling in ice surrounding a crevasse
(Fig. 4). Hills et al. (2017) discussed the thermal anomaly requires knowledge of the width of the crevasse and the pres-
exhibited in borehole 14N; the authors recognized the rela- ence of other nearby crevasses, since closely spaced water-
tively high temperatures of ice in the upper portion of the filled crevasses greatly reduce the refreezing rate (Jarvis and
borehole when compared to others in the grid (Fig. 2) and Clarke, 1974). In addition, even the refreezing problem is
noticed that temperature sensors recorded decreasing temper- complicated by the Stefan boundary condition as the thick-
atures over time. Hills et al. (2017) attributed this localized ness of the crevasse is reduced by refreezing (Carslaw and
thermal anomaly to a refrozen crevasse that was observed on Jaeger, 1959). We are interested in the thermal behavior of
the ice surface nearby. The lowest 100 m of ice in boreholes ice in the region of a basal crevasse at times much longer
14SA, 14N, and 15CA exhibits nearly identical thermal char- than the crevasse remained open, so we model the crevasse
acteristics to the uppermost portion of 14N: ice is warmer as an instantaneous planar heat source, considering only the
than the site-average profile and it cools through time. total latent heat released during the refreezing. We examine
Basal crevasses can have a thermal influence on discrete the thermal disturbance at a long timescale in the half-space
but large regions of ice. Because these fractures are distinct adjacent to the crevasse using an analytic solution presented
features, the fact that we do not see a clear cooling signature by Carslaw and Jaeger (1959):
in relatively warm ice throughout the base of the ice column
at our site is not surprising. Slight warming in cold ice in Q −l 2
T (l, t) = 1
e 4κt . (3)
borehole 15E and no clear signal in borehole 15S provide ev- 2ρC(π κt) 2
idence that the ice is being affected by a thermal process that
is not distributed in nature. Here T is temperature; l is the linear distance away from
Multiple fractures can open similar to crevasses at the sur- the heat source; t is the time that has passed since the heat
face, and their growth is likely vertically restricted above the was released; Q is the amount of heat released per unit area
bed due to the cold, stiff central core of the ice column which of the plane; and ρ, C, and κ are respectively the density,
reduces fracture propagation. Therefore, these features only specific heat capacity, and thermal diffusivity of ice.
affect the lower portion of the ice column. Additionally, basal We assume a crevasse thickness of 1 m, matching the
crevasses likely are not simple planar features; strong de- upper limit of previously observed basal crevasse widths
formational gradients near the bed can alter their shape and (Harper et al., 2010). The release of heat initiates a wave of
cause them to intersect more recently formed crevasses. Al- thermal energy propagating away from the source (Fig. 6a).
though basal crevasses may be more complex than an en The diffusion of the warming front causes ice temperature
echelon arrangement of vertical fractures, for simple mod- to increase before cooling asymptotically back to the ambi-
eling we focus on the thermal disturbance by basal crevasses ent ice temperature (Fig. 6b). After the crevasse refreezes,
that allow the influx of a plane of water from the bed up the remaining period of warming is short compared to the
https://doi.org/10.5194/tc-15-897-2021 The Cryosphere, 15, 897–907, 2021904 I. E. McDowell et al.: The cooling signature of basal crevasses
timescale of cooling; thus the likelihood of temperature sen- tion illustrates the warming that occurs due to the release of
sors installed in a previously crevassed area recording warm- latent heat immediately as the crevasse completely refreezes,
ing is low. To compare this theoretical result with our data, followed by dispersed cooling surrounding the crevasses over
we average the rates of cooling observed in the lowest 100 m time (Fig. 7). Given negative heat fluxes are required in the
of the boreholes and show the range of these averages in lowest portion of all boreholes (Fig. 4) to create observed
Fig. 6c. The theoretical curves depend strongly on the orig- cooling, thermal energy likely diffuses away from our field
inal size of the crevasse and on the distance away from the site in three dimensions, which would result in cooling that
crevasse; however, we have chosen values that show that this we have not captured in our vertical 1-D diffusion calcula-
process can produce rates of cooling of the same magnitude tions. It is plausible that boreholes intersect these regions of
as observed in the borehole array. ice that have been thermally altered by basal crevassing.
It is tempting to estimate the time since water-filled basal Moulins are unlikely to create the observed thermal obser-
crevasses were formed using our extensive temperature data. vations. While the internal architecture of moulins is likely
However, such an attempt is under-constrained since simi- complex, as a simple model, we conceptualize moulins as
lar thermal signatures could be produced by many crevasse linear pipes that release thermal energy from the surface
geometries and arrangements in time and space. Instead we to the bed because of how these features are manifested at
examine the same crevassing scenario above as a baseline the surface. Cooling in relatively warm ice is not observed
to investigate the amount of time elapsed since refreezing to throughout the entire ice column in each borehole, which we
produce observed cooling rates given various distances be- would expect to see from a linear heat source extending over
tween boreholes and hypothetical crevasses. Equation (3) is the full ice depth. Moulins have been shown to migrate hor-
solved for a range of time and linear distances from the heat izontally with depth (Holmund, 1988), which could possibly
source, and rates of temperature change over time are calcu- avoid this objection; however, numerous moulins would be
lated. Equivalent rates of cooling could be produced from the needed to generate the cooling we observe in multiple bore-
dissipation of thermal energy released by a refrozen crevasse holes. In the ablation zone surrounding Issunguata Sermia,
after approximately 20–30 years if the boreholes directly in- active moulins have a mean density of 0.1 per square kilo-
tersect the crevasse. The time elapsed is less if the boreholes meter (Smith et al., 2015), and Catania and Neumann (2010)
do not intersect the refrozen crevasse. Although speculative, found relict moulins to be spaced ∼ 1 km apart, which sug-
it is interesting that using a timescale of 10–30 years, assum- gests that it is unlikely that multiple moulins have thermally
ing an ice velocity of 100 m yr−1 , the ice currently at our field altered the instrumented block of ice with a surface area of
site would have been 1–3 km up-glacier, which is a location ∼ 0.125 km2 .
of current surface crevasses and a significant change in slope.
Basal water pressures at or above ice overburden pres-
sure promote the growth of basal crevasses tens of meters 5 Implications
above the bed (van der Veen, 1998). Longitudinal extension
further facilitates crevassing at distances over 100 m above The existence of basal crevasses has not been widely consid-
the bed (van der Veen, 1998). Subglacial water pressures in ered outside of alpine or tidally influenced settings; however,
Greenland’s ablation zone have consistently been measured these features likely impact the bulk water storage, basal
at or near ice overburden pressure (e.g., Iken et al., 1993; water flow, and ice rheology in Greenland’s ablation zone.
Meierbachtol et al., 2013; Andrews et al., 2014; Ryser et al., Harrington et al. (2015) examined full-depth ice tempera-
2014; van de Wal et al., 2015; Doyle et al., 2018) and have ture data collected in boreholes at a site down-glacier, but on
peaked at ∼ 1.15 times the ice overburden pressure at our the same flow line as this study, and found temperate layer
field location (Wright et al., 2016). Longitudinal extension, growth could not be reproduced by thermal modeling incor-
while not temporally or spatially prevalent, may result from porating strain heat and longitudinal compression. The au-
ice flow over uneven bed topography or spatial changes in thors suggest basal crevasses allow latent heat to be released
basal friction. Additionally, observed stick–slip behavior and well above the bed and create the thick temperate layer.
hydraulic jacking from rapid delivery of surface meltwater The lack of a thick basal temperate layer indicates the
through passive seismic surveys could provide another mech- transient thermal influence of basal crevasses. Ice viscosity
anism for basal crevasse formation (Moore et al., 2013). is highly temperature dependent; thus basal crevasses could
It is unlikely that a single basal crevasse is responsi- create regions of enhanced deformation, although previous
ble for the cooling that we observe at the field site. More observations in Greenland have shown that deformation rates
plausibly, the ice at our field site was fractured by multi- in temperate ice are often lower than theory predicts (e.g.,
ple crevasses up-glacier. We cannot precisely determine the Ryser et al., 2014; Doyle et al., 2018; Maier et al., 2019).
number or spacing of crevasses; however, a 1-D modeling In addition, water content in basal temperate ice also influ-
analysis shows that three 1 m thick refrozen crevasses would ences rates of glacial ice deformation. A previous study at the
lead to dispersed cooling over a large area of the bed after down-glacier site found a higher water content in the basal
20–30 years (Supplement). The 1-D temperature field evolu- temperate ice layer revealed by ground-based radar than is
The Cryosphere, 15, 897–907, 2021 https://doi.org/10.5194/tc-15-897-2021I. E. McDowell et al.: The cooling signature of basal crevasses 905
Figure 6. (a) Modeled changes in temperature after a crevasse 1 m wide refreezes. Darker colors show earlier times. Dashed line indicates
a distance 20 m from the crevasse, for which temperatures and temporal rates of temperature change are shown in (b) and (c). (b) Changes
in temperature over time 20 m away from the basal crevasse. (c) Corresponding rates of temperature change for (b). The blue shaded region
shows the range of averaged rates of cooling in the lowest 100 m of the boreholes.
plex three-dimensional crossing water flow paths (Huzur-
bazar and Humphrey, 2008). These features have the poten-
tial to modulate subglacial discharge and efficiently transfer
water through the subglacial drainage system.
6 Conclusions
Temperature measurements that began 1 year after sensor in-
stallation in nine boreholes and span 2–3 years show that ice
cools in the lowest portion of the ice column, with all bore-
holes displaying cooling within the lowest third of the ice
column. The main thermal sink is conduction of heat from
this region up into the cold central core of the ice. Vertical
diffusion calculations show this cooling to be insufficient to
explain our data. In addition, the lowest section of ice in some
boreholes is warmer than the mean thermal profile at our field
Figure 7. Evolution of a synthetic 1-D temperature field from basal site, which suggests relatively recent and localized changes
crevasses spaced 100 m apart. Temperatures are plotted every 5
to the boundary conditions or near-basal heat sources. The
years, and older temperature fields are shaded darker shades of grey.
observed cooling regions of the boreholes are often the same
The red line shows the temperature field 30 years after refreezing.
Distinct crevasses can cause cooling over large regions of the bed. regions of ice that are warmer than the site-average profile.
After eliminating various potential heat sinks, we conclude
the observed thermal anomalies are created by the cooling of
basal ice that has been previously warmed by basal crevass-
used in modeling studies (Brown et al., 2017). While unable ing occurring upstream of our observation site. Latent heat
to detect macro-spaces for bulk water storage in the radar- released by refrozen basal crevasses locally warms ice near
grams, the authors speculated that basal crevasses provide the bed, but the effects are distributed as thermal energy prop-
macro-spaces for water storage based on the thermal evi- agates outwards, resulting in dispersed cooling at rates of the
dence from Harrington et al. (2015), which results in the high same magnitude as our observations. Our results provide ad-
water content observed. ditional thermal evidence for the existence of basal crevasses
Although basal crevasses have only been directly observed in Greenland’s ablation zone, which has strong relevance for
in alpine settings, their existence under the Greenland Ice the temperature-dependent rheology of the basal ice and in-
Sheet has strong implications for the basal hydrology. Basal triguing implications for the complexity of the basal hydro-
crevasses have been observed creating englacial water flow logic system.
above the bed (Harper et al., 2010) and even allowing com-
https://doi.org/10.5194/tc-15-897-2021 The Cryosphere, 15, 897–907, 2021906 I. E. McDowell et al.: The cooling signature of basal crevasses
Data availability. Temperature measurements used in this paper Directly from the Greenland Ice Sheet, Science, 282, 268–271,
are available at https://doi.org/10.15786/20.500.11919/7147 (Mc- https://doi.org/10.1126/science.282.5387.268, 1998.
Dowell et al., 2020) Doyle, S. H., Hubbard, B., Christoffersen, P., Young, T. J., Hofstede,
C., Bougamont, M., Box, J. E., and Hubbard, A.: Physical condi-
tions of fast glacier flow: 1. measurements from boreholes drilled
Supplement. The supplement related to this article is available on- to the bed of Store Glacier, West Greenland, J. Geophys. Res.-
line at: https://doi.org/10.5194/tc-15-897-2021-supplement. Earth, 123, 324–348, https://doi.org/10.1002/2017JF004529,
2018.
Funk, M., Echelmeyer, K., and Iken, A.: Mechanisms of fast
Author contributions. NFH, JTH, and TWM designed the field flow in Jakobshavns Isbræ, West Greenland: Part II. Mod-
study and installed temperature sensors. IEM performed the analy- eling of englacial temperatures, J. Glaciol., 40, 569–585,
sis and wrote the manuscript with contributions from all co-authors. https://doi.org/10.3189/S0022143000012466, 1994.
Harper, J. T., Bradford, J. H., Humphrey, N. F., and Meier-
bachtol, T. W.: Vertical extension of the subglacial
drainage system into basal crevasses, Nature, 467, 579–582,
Competing interests. The authors declare that they have no conflict
https://doi.org/10.1038/nature09398, 2010.
of interest.
Harper, J. T., Humphrey, N. F., Meierbachtol, T. W., Graly,
J. A., and Fischer, U. H.: Borehole measurements indicate
hard bed conditions, Kangerlussuaq sector, western Green-
Acknowledgements. We thank Megan Thompson-Munson for her land Ice Sheet, J. Geophys. Res.-Earth, 122, 1605–1618,
helpful discussions throughout this project. We are grateful to Mar- https://doi.org/10.1002/2017JF004201, 2017.
tin Lüthi and Samuel Doyle for their reviews that significantly im- Harrington, J. A., Humphrey, N. F., and Harper, J. T.: Tem-
proved the quality of this paper and to Ginny Catania, who served perature distribution and thermal anomalies along a flow-
as the scientific editor. line of the Greenland ice sheet, Ann. Glaciol., 56, 98–104,
https://doi.org/10.3189/2015AoG70A945, 2015.
Hills, B. H., Harper, J. T., Humphrey, N. F., and Meierbachtol, T. W.:
Financial support. This research has been supported by the Na- Measured horizontal temperature gradients constrain heat trans-
tional Science Foundation, Office of Polar Programs (grant nos. fer mechanisms in Greenland ice, Geophys. Res. Lett., 44, 9778–
1203451 and 0909495). 9785, https://doi.org/10.1002/2017GL074917, 2017.
Hills, B. H., Harper, J. T., Meierbachtol, T. W., Johnson, J. V.,
Humphrey, N. F., and Wright, P. J.: Processes influencing heat
Review statement. This paper was edited by Ginny Catania and re- transfer in the near-surface ice of Greenland’s ablation zone, The
viewed by Martin Lüthi and Samuel Doyle. Cryosphere, 12, 3215–3227, https://doi.org/10.5194/tc-12-3215-
2018, 2018.
Holmund, P.: Internal geometry and evolution of moulins,
Storglaciaren, Sweden, J. Glaciol., 34, 242–248,
References https://doi.org/10.3189/S0022143000032305, 1988.
Hooke, R. L.: Flow law for polycrystalline ice in glaciers:
Andrews, L. C., Catania, G. A., Hoffman, M. J., Gulley, comparison of theoretical predictions, laboratory data, and
J. D., Lüthi, M. P., Ryser, C., Hawley, R. L., and Neu- field measurements, Rev. Geophys. Space. Ge., 19, 664–672,
mann, T. A.: Direct observations of evolving subglacial https://doi.org/10.1029/RG019i004p00664, 1981.
drainage beneath the Greenland Ice Sheet, Nature, 514, 80–83, Humphrey, N. and Echelmeyer, K.: Hot-water drilling and
https://doi.org/10.1038/nature13796, 2014. bore-hole closure in cold ice, J. Glaciol., 36, 287–298,
Brown, J., Harper, J., and Humphrey, N.: Liquid water content in ice https://doi.org/10.3189/002214390793701354, 1990.
estimated through a full-depth ground radar profile and borehole Huzurbazar, S. and Humphrey, N. F.: Functional cluster-
measurements in western Greenland, The Cryosphere, 11, 669– ing of time series: An insight into length scales in sub-
679, https://doi.org/10.5194/tc-11-669-2017, 2017. glacial water flow, Water Resour. Res., 44, W11420,
Carslaw, H. S. and Jaeger, J. C.: Conduction of Heat in Solids, 2nd https://doi.org/10.1029/2007WR006612, 2008.
edition, Clarendon Press, Oxford, England, 1959. Iken, A., Echelmeyer, K., Harrison, W., and Funk, M.:
Catania, G. A. and Neumann, T. A.: Persistent englacial drainage Mechanisms of fast flow in Jakobshavns Isbrae, West
features in the Greenland Ice Sheet, Geophys. Res. Lett., 37, Greenland: Part I. Measurements of temperature and
L02501, https://doi.org/10.1029/2009GL041108, 2010. water level in deep boreholes, J. Glaciol., 39, 15–25,
Catania, G. A., Conway, H., Raymond, C. F., and Scambos, T. A.: https://doi.org/10.3189/S0022143000015689, 1993.
Surface morphology and internal layer stratigraphy in the down- Jarvis, G. T. and Clarke, G. K. C.: Thermal effects of crevassing
stream end of Kamb Ice Stream, West Antarctica, J. Glaciol., 51, on Steele Glacier, Yukon Territory, Canada, J. Glaciol., 13, 243–
423–431, https://doi.org/10.3189/172756505781829142, 2005. 254, https://doi.org/10.3189/S0022143000023054, 1974.
Cuffey, K. M. and Paterson, W. S. B.: The Physics of Glaciers, Aca- Jezek, K. C. and Bentley, C. R.: Field Studies of Bottom Crevasses
demic Press, Burlington, Massachusetts, USA, 2010. in the Ross Ice Shelf, Antarctica, J. Glaciol., 29, 118–126,
Dahl-Jensen, D., Mosegaard, K., Gundestrup, N., Clow, G. D., https://doi.org/10.3189/S0022143000005189, 1983.
Johnsen, S. J., Hansen, A. W., and Balling, N.: Past Temperatures
The Cryosphere, 15, 897–907, 2021 https://doi.org/10.5194/tc-15-897-2021I. E. McDowell et al.: The cooling signature of basal crevasses 907 Luckman, A., Jansen, D., Kulessa, B., King, E. C., Sammonds, P., Poinar, K., Joughin, I., Lenaerts, J. T. M., and Van Den Broeke, and Benn, D. I.: Basal crevasses in Larsen C Ice Shelf and impli- M. R.: Englacial latent-heat transfer has limited influence on cations for their global abundance, The Cryosphere, 6, 113–123, seaward ice flux in western Greenland, J. Glaciol., 63, 1–16, https://doi.org/10.5194/tc-6-113-2012, 2012. https://doi.org/10.1017/jog.2016.103, 2017. Lüthi, M., Funk, M., Iken, A., Gogineni, S., and Truffer, M.: Mech- Ryser, C., Lüthi, M. P., Andrews, L. C., Catania, G. A., anisms of fast flow in Jakobshavn Isbrae, West Greenland: Part Funk, M., Hawley, R., Hoffman, M., and Neumann, T. A.: III. Measurements of ice deformation, temperature and cross- Caterpillar-like ice motion in the ablation zone of the Green- borehole conductivity in boreholes to the bedrock, J. Glaciol., 48, land ice sheet, J. Geophys. Res.-Earth, 119, 2258–2271, 369–385, https://doi.org/10.3189/172756502781831322, 2002. https://doi.org/10.1002/2013JF003067, 2014. Lüthi, M. P., Ryser, C., Andrews, L. C., Catania, G. A., Funk, M., Ryser, C., Lüthi, M. P., Andrews, L. C., Hoffman, M. J., Cata- Hawley, R. L., Hoffman, M. J., and Neumann, T. A.: Heat sources nia, G. A., Hawley, R. L., Neumann, T. A., and Kristensen, within the Greenland Ice Sheet: dissipation, temperate paleo- S. S.: Sustained high basal motion of the Greenland ice sheet firn and cryo-hydrologic warming, The Cryosphere, 9, 245–253, revealed by borehole deformation, J. Glaciol., 60, 647–660, https://doi.org/10.5194/tc-9-245-2015, 2015. https://doi.org/10.3189/2014JoG13J196, 2014. MacGregor, J. A., Fahnestock, M. A., Catania, G. A., As- Seguinot, J., Funk, M., Bauder, A., Wyder, T., Senn, C., and chwanden, A., Clow, G. D., Colgan, W. T., Gogineni, S. P., Sugiyama, S.: Englacial warming indicates deep crevassing Morlighem, M., Nowicki, S. M. J., Paden, J. D., Price, S. F., in Bowdoin Glacier, Greenland, Front. Earth Sci., 8, 65, and Seroussi, H.: A synthesis of the basal thermal state of the https://doi.org/10.3389/feart.2020.00065, 2020. Greenland Ice Sheet, J. Geophys. Res.-Earth, 121, 1328–1350, Smith, L. C., Chu, V. W., Yang, K., Gleason, C. J., Pitcher, L. H., https://doi.org/10.1002/2015JF003803, 2016. Rennermalm, A. K., Legleiter, C. J., Behar, A. E., Overstreet, B. Maier, N., Humphrey, N., Harper, J., and Meierbachtol, T.: Sliding T., Moustafa, S. E., Tedesco, M., Forster, R. R., LeWinter, A. L., dominates slow-flowing margin regions, Greenland Ice Sheet, Finnegan, D. C., Sheng, Y., and Balog, J.: Efficient meltwater Sci. Adv., 5, eaaw5406, https://doi.org/10.1126/sciadv.aaw5406, drainage through supraglacial streams and rivers on the south- 2019. west Greenland ice sheet, P. Natl. Acad. Sci. USA, 112, 1001– McDowell, I., Humphrey, N., Harper, J., and Meierbachtol T.: Full- 1006, https://doi.org/10.1073/pnas.1413024112, 2015. depth ice temperature measurements from southwestern Green- Thomsen, H. H., Olesen, O., Braithwaite, R. J., and Boggild, C.: Ice land’s ablation zone, 2015–2017, Mountain Scholar Dataset, drilling and mass balance at Pakitsoq, Jakobshavn, central West https://doi.org/10.15786/20.500.11919/7147, 2020. Greenland, Report 152, Grønlands Geologiske Undersøgelse, McGrath, D., Steffen, K., Scambos, T., Rajaram, H., Casassa, Copenhagen, Denmark, 80–84, 1991. G., and Lagos, J. L. R.: Basal crevasses and associated sur- van der Veen, C. J.: Fracture mechanics approach to penetration of face crevassing on the Larsen C ice shelf, Antarctica, and bottom crevasses on glaciers, Cold Reg. Sci. Technol., 27, 213– their role in ice-shelf instability, Ann. Glaciol., 53, 10–18, 223, https://doi.org/10.1016/S0165-232X(98)00006-8, 1998. https://doi.org/10.3189/2012AoG60A005, 2012. van de Wal, R. S. W., Smeets, C. J. P. P., Boot, W., Stoffelen, M., van Meierbachtol, T., Harper, J., and Humphrey, N.: Basal Kampen, R., Doyle, S. H., Wilhelms, F., van den Broeke, M. R., drainage system response to increasing surface melt Reijmer, C. H., Oerlemans, J., and Hubbard, A.: Self-regulation on the Greenland Ice Sheet, Science, 341, 777–779, of ice flow varies across the ablation area in south-west Green- https://doi.org/10.1126/science.1235905, 2013. land, The Cryosphere, 9, 603–611, https://doi.org/10.5194/tc-9- Meierbachtol, T., Harper, J., and Johnson, J.: Force balance along 603-2015, 2015. Isunnguata Sermia, West Greenland, Front. Earth Sci., 4, 87, Weertman, J.: On the sliding of glaciers, J. Glaciol., 3, 33–38, https://doi.org/10.3389/feart.2016.00087, 2016. https://doi.org/10.3189/S0022143000024709, 1957. Moore, P. L., Winberry, J. P., Iverson, N. R., Christianson, K. A., Weertman, J.: Bottom crevasses, J. Glaciol., 25, 185–188, Anandakrishnan, S., Jackson, M., Mathison, M. E., and Cohen, https://doi.org/10.3189/S0022143000010418, 1980. D.: Glacier slip and seismicity induced by surface melt, Geology, Wright, P. J., Harper, J. T., Humphrey, N. F., and Meier- 41, 1247–1250, https://doi.org/10.1130/G34760.1, 2013. bachtol, T. W.: Measured basal water pressure variability Paden, J., Li, J., Leuschen, C., Rodriguez-Morales, F., and of the western Greenland Ice Sheet: Implications for hy- Hale, R.: IceBridge MCoRDS L1B Geolocated Radar draulic potential, J. Geophys. Res.-Earth, 121, 1134–1147, Echo Strength Profiles, Version 2, NASA National Snow https://doi.org/10.1002/2016JF003819, 2016. and Ice Data Center Distributed Active Archive Center, https://doi.org/10.5067/90S1XZRBAX5N, 2014. Phillips, T., Rajaram, H., Colgan, W., Steffen, K., and Abdalati, W.: Evaluation of cryo-hydrologic warming as an explanation for in- creased ice velocities in the wet snow zone, Sermeq Avannarleq, West Greenland, J. Geophys. Res.-Earth Surf., 118, 1241–1256, https://doi.org/10.1002/jgrf.20079, 2013. https://doi.org/10.5194/tc-15-897-2021 The Cryosphere, 15, 897–907, 2021
You can also read