Amylose starch with no detectable branching developed through DNA free CRISPR Cas9 mediated mutagenesis of two starch branching enzymes in potato ...
←
→
Page content transcription
If your browser does not render page correctly, please read the page content below
www.nature.com/scientificreports
OPEN Amylose starch with no detectable
branching developed
through DNA‑free CRISPR‑Cas9
mediated mutagenesis of two
starch branching enzymes
in potato
Xue Zhao1,5, Shishanthi Jayarathna1,5, Helle Turesson2, Ann‑Sofie Fält2, Gustav Nestor1,
Matías N. González3,4, Niklas Olsson2, Mirela Beganovic2, Per Hofvander2,
Roger Andersson1 & Mariette Andersson2*
DNA-free genome editing was used to induce mutations in one or two branching enzyme genes (Sbe)
in tetraploid potato to develop starch with an increased amylose ratio and elongated amylopectin
chains. By using ribonucleoprotein (RNP) transfection of potato protoplasts, a mutation frequency
up to 72% was achieved. The large variation of mutations was grouped as follows: Group 1 lines with
all alleles of Sbe1 mutated, Group 2 lines with all alleles of Sbe1 as well as two to three alleles of
Sbe2 mutated and Group 3 lines having all alleles of both genes mutated. Starch from lines in Group
3 was found to be essentially free of amylopectin with no detectable branching and a chain length
(CL) distribution where not only the major amylopectin fraction but also the shortest amylose chains
were lost. Surprisingly, the starch still formed granules in a low-ordered crystalline structure. Starch
from lines of Group 2 had an increased CL with a higher proportion of intermediate-sized chains, an
altered granule phenotype but a crystalline structure in the granules similar to wild-type starch. Minor
changes in CL could also be detected for the Group 1 starches when studied at a higher resolution.
Genome editing in plants has opened up new possibilities, both in terms of research and development of crops
with novel traits beneficial for human health or the environment. The method can be used to create knockouts
of enzymatic functions, which in many cases has been difficult to achieve with traditional genetic engineering
methods, e.g. RNAi. Protocols for genome editing through CRISPR-Cas9 have been successfully established for
inducing mutations in p otato1. In addition, using transient approaches for genome editing of potato is possible,
which is a big advantage when plants free of recombinant DNA are desired. A transient approach has a clear
benefit for highly heterozygous clonally propagated crops like potato, since segregation through seed generations
is more or less i mpossible2.
Potato is an important, high-yielding, nutritious and starch-rich staple c rop3. Starch is composed of glucose
units linearly linked by α(1 → 4) glycosidic bonds and branched by α(1 → 6) bonds. Starch is generally depos-
ited as highly ordered granules directed by the highly branched amylopectin molecule with the addition of the
essentially linear molecule amylose to a ratio of approximately 4:14. In food products, the high amylose content
and the long chains of amylopectin contribute to formation of resistant starch and relate to a low glycaemic index
(GI) after intake5,6. By increasing the average chain length of potato starch, a starch with health benefits can be
developed. The increased chain length can yield resistant starch (RS) leading to a low GI and concur health
1
Department of Molecular Sciences, Swedish University of Agricultural Sciences, Box 7015, 750 07 Uppsala,
Sweden. 2Department of Plant Breeding, Swedish University of Agricultural Sciences, P.O. Box 101,
23053 Alnarp, Sweden. 3Consejo Nacional de Investigaciones Científicas Y Técnicas, (C1425FQB), Buenos
Aires, Argentina. 4Laboratorio de Agrobiotecnología, IPADS (INTA - CONICET), Ruta 226, Km 73.5,
B7620 Balcarce, Argentina. 5These authors contributed equally: Xue Zhao and Shishanthi Jayarathna. *email:
mariette.andersson@slu.se
Scientific Reports | (2021) 11:4311 | https://doi.org/10.1038/s41598-021-83462-z 1
Vol.:(0123456789)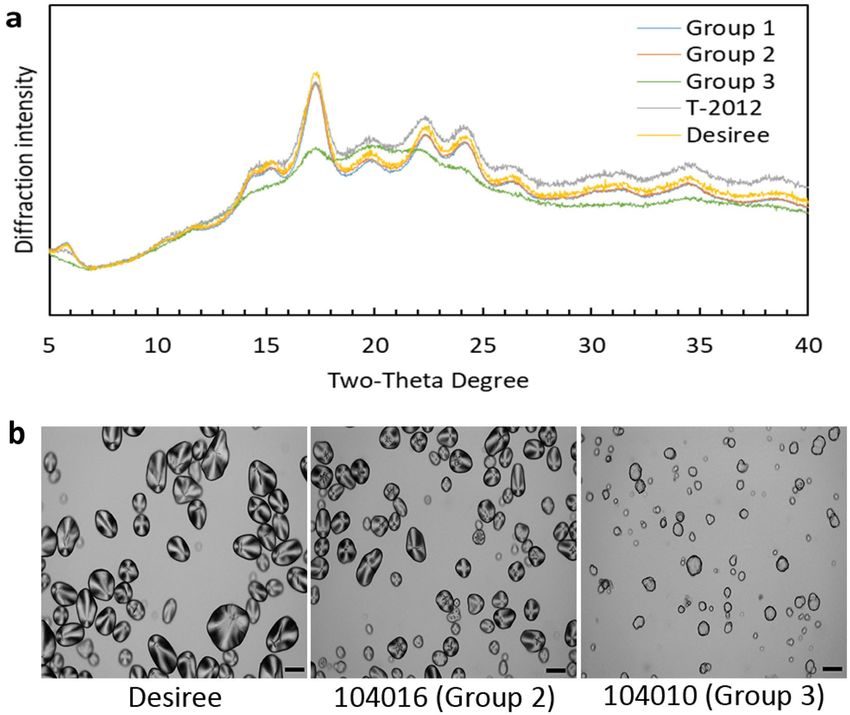
www.nature.com/scientificreports/
benefits by promoting the growth of healthy gut flora, and lowering both the caloric intake and cholesterol levels
in the b lood5. The long-chain quality of starch also creates beneficial properties as a raw material for producing
bioplastic films7, which in the future might replace some of the fossil-based plastics produced today.
The research and development of potatoes with novel starch qualities has been ongoing for a long time.
Potatoes that synthesise solely amylopectin starch have been developed by eliminating granule-bound starch
synthase (GBSS) activity through traditional mutagenesis, antisense, RNAi and most recently CRISPR-Cas98–11.
The development of potatoes with a high ratio of amylose starch and/or altered starch chain length distribution
has been achieved by targeting two starch branching enzymes (SBEs) using traditional gene silencing technolo-
gies and recently genome editing12–14. A very high amylose starch content was found synthesised at the expense
of total starch content and plant d evelopment15. Based on those results and the fact that, so far, no potato studies
have resulted in pure amylose starch, it could be speculated that the presence of a fraction of amylopectin in
potato starch is essential for plant development. In contrast, barley with suppressed activity of three SBEs (SBEI,
SBEIIa and SBEIIb) was found to have an amylose-only starch in the endosperm16. In that study, the high amylose
content only had a minor impact on grain yield and starch content.
In a recent study by Tuncel et al.14, CRISPR-Cas9 was used to target the two SBEs in potato. Lines with muta-
tions in Sbe1 or Sbe2 alone or in combination were developed using either traditional Agrobacterium-mediated
transformation or PEG-mediated protoplast transfection with vector DNA. In that study, lines mutated in Sbe1
were not found affected in their starch structure, while tuber cells from Sbe2 mutated lines displayed an increased
number of granules. One line had a strong reduction in both SBEs, resulting in starch with an altered granule
phenotype, longer amylopectin chains and a degree of branching that was reduced by half.
Other crops have also been targeted for developing high-amylose starch genotypes using genome editing, such
as rice and sweet potato. Rice was subjected to mutagenesis in the respective Sbe genes through CRISPR-Cas9 and
Agrobacterium-mediated transformation17. In that study, mutations in the Sbe1 gene did not result in any major
changes in the starch compared to the parental variety, while mutations in Sbe2 led to a starch with increased
amylose content from ca. 15 to 25% and an amylopectin chain-length distribution which shifted towards longer
chains17. Similar results were obtained on sweet potato mutated in Sbe2, with an increase in amylose content
from ca. 27 to 40%18.
In this study, we used a previously established CRISPR-Cas9 RNP-method to induce mutations in Sbe1 indi-
vidually and Sbe1–Sbe2 simultaneously in potato. By using genome editing to induce mutations in all eight Sbe
alleles, we were able to develop, for the first time, a unique potato starch essentially lacking branching. We further
investigated the effects of this starch as well as starches with altered amylopectin structure on plant development
and starch granular structure and phenotype.
Results
Sbe1 and Sbe2 targeted mutagenesis and genotyping of regenerated potato lines. Sbe1 was
targeted alone or in combination with Sbe2 in the potato variety Desiree (Supplementary Fig. S1). Dual sgR-
NAs named BE1T3, BE1T4 (Sbe1) and BE2T3 and BE2T4 (Sbe2) (Supplementary Fig. S1c) were preassembled
with Cas9 and transfected to potato protoplasts as ribonucleprotein complexes (RNPs). In the single gene target
experiment, 221 regenerated shoots were analysed using high-resolution fragment analysis (HRFA), while in the
stacking gene target experiment, 68 regenerated lines were analysed. The experiments had a mutation frequency
of 52% and 72% respectively, calculated based on the number of lines where at least one allele was mutated (Sup-
plementary Table S2). Thirteen lines were selected for further study and genotyped using Sanger sequencing to
confirm the insertions/deletions (indels) size and to investigate the genomic structure of the mutations (Table 1).
Based on the number and combination of alleles mutated, the lines were divided into three groups: five lines had
mutations in all four alleles of Sbe1, 82007, 82050, 82079, 104011 and 104032 (Group 1), six lines had four-allele
mutations in Sbe1 combined with two to three alleles mutated in Sbe2, 104001, 104005, 104006, 104016, 104018
and 104034 (Group 2) and two lines, 104010 and 104023, had all eight alleles mutated (Group 3). Both lines in
Group 3 contained in-frame indels in the Sbe1 and/or Sbe2 mutated alleles (Table 1, Supplementary Table S3).
Sanger sequencing results were in line with the results from the HRFA except for large indels, where a 1 bp
difference could occasionally be noted (Table 1). The majority of the lines had at least one allele with a large
deletion in Sbe1 due to dual sgRNA mediated cuts, but only one of them, 104005, had a large deletion in all four
alleles. The frequency of large deletions due to dual cuts was considerably lower in Sbe2. In alleles with muta-
tions not corresponding to a predicted large deletion, indels could be found at both target sites of the sgRNA
pair (Table 1). No indels could be observed in one of the alleles of the BE2T4 target region, which had a 1 bp
mismatch directly adjacent the protospacer adjacent motif (PAM) site (Supplementary Fig. S1c).
Yield, dry matter, tuber phenotype and sprouting of greenhouse‑grown tubers. The thirteen
selected lines were grown in a greenhouse until senescence. As comparators during the greenhouse trial and
subsequent analyses, the parental variety Desiree and a high-amylose RNAi line T-2012 were included.
Tubers from the Group 3 lines were clearly reduced in size and had a significant total tuber yield drag per
plant of 60–80% compared to the parental variety (Supplementary Fig. S2b,c and S3d,e). Further conclusions
concerning the number of tubers, total tuber yield per plant and average tuber weight cannot be drawn since the
results fluctuated considerably between the lines and biological replicates (Supplementary Fig. S2a–c).
Tuber phenotype was unaffected in Group 1 lines compared to the parental variety (Supplementary Fig. S3a,g),
while tubers in the Group 2 lines had some additional buddings detected (Supplementary Fig. S3b,c). The most
dramatic phenotypical differences compared to parental variety were found in the Group 3 lines, where tubers
were small and elongated with numerous additional buddings from the main tuber (Supplementary Fig. S3d,e).
Tubers from the Group 3 lines had a significant decrease in dry matter content (Supplementary Fig. S2d), a
Scientific Reports | (2021) 11:4311 | https://doi.org/10.1038/s41598-021-83462-z 2
Vol:.(1234567890)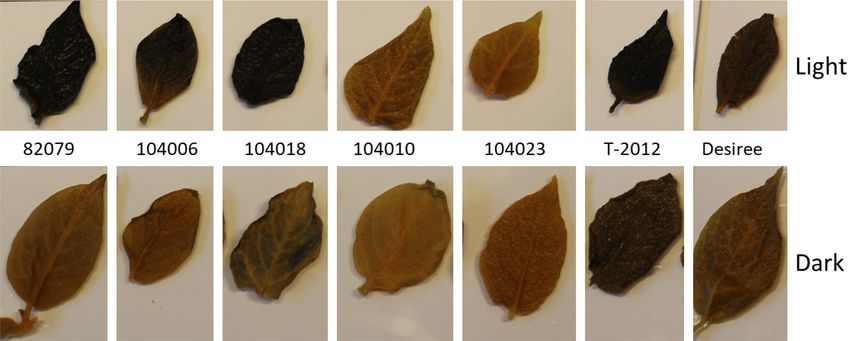
www.nature.com/scientificreports/
Size of indels confirmed by Sanger sequencing (results from HRFA in brackets)
Group Line Sbe1 Sbe2
82007 -38a/-3¥,a/ + 70a (-38/-3/ + 70) 0¤ (0)
a a a ¥,a,e
82050 -22 /-1 / + 38 / + 165 (-22/ -1/ + 38/ + 166) 0¤ (0)
a a,e
Group 1 82079 -1 / + 47 (-1/ + 47) 0¤ (0)
a,b a
104011 -94 /-4 (-95/-4) 0¤ (0)
a,b a,b
104032 -55 / + 26 (-56/ + 26) 0¤ (0)
a,b ¥,a,b
104001 -94 / + 3 (-95/ + 3) -129¥,c,d/-3¥,c,d/-1c/0¤ (-130/-3/-1/0)
104005 -93¥,a,b/-92,a,b (-94/-93) -10d/-4c,d/0¤ (-10/-4/0)
104006 -92a,b/-5a,b/-1a (-92/-5/-1) -11d/-1 d/0¤ (-11/-1/0)
Group 2
104016 -93¥,a,b/-4a,b (-94/-4) -2c/0¤/ + 6¥,d (-2/0/ + 6)
104018 -93¥,a,b/-23a,b/-17a/ + 153¥,a,b (-94/-23/-17/ + 153) -1c/0¤/ + 104c,d (-1/0/ + 105)
104034 -94a,b /-93¥,a,b /-5a,b / + 60¥,a,b (-95/-94/-5/ + 60) -8c,d/-6¥,c,d/0¤ (-8/-6/0)
104010 -5a,b/ + 92a,b/ + 123¥,a,b (-5/ + 93/ + 122) -2d/-1c/ + 48¥,c,d/ + 194c,d (-2/-1/ + 48/ + 195)
Group 3 a,b ¥,a,b a,b a,b
104023 -92 /-3 / + 13 / + 251 (-92/-3/ + 13/ + 252) -127c,d/-9¥,c,d/-5c,d (-128/-9/-5)
Table 1. Size of indels in respective line analysed with Sanger sequencing and HRFA (in brackets), where “0”
indicates the wild type allele fragment size, “–” represents a deletion and “ + ” represents an insertion. Less than
four different indels indicates that at least two alleles share the same genetic context. Lack of “0” means no wild
type allele remaining in the line. Group 1 represents lines mutated in all four alleles of Sbe1; Group 2 represents
lines mutated in all four alleles of Sbe1 and two to three alleles in Sbe2; Group 3 represents lines mutated in
all alleles of both Sbe1 and Sbe2. ¤ Wild type alleles. ¥ In-frame indels. a Indels at BE1T3 target site, b Indels at
BE1T4 target site, c Indels at BE2T3 target site and d Indels at BE2T4 target site. e Insert origination from vector
used for in vitro transcription.
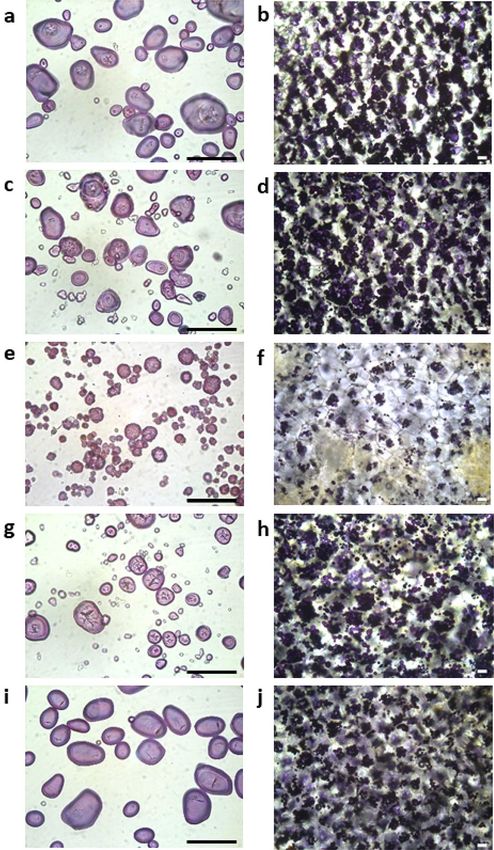
consequence of smaller and decreased number of starch granules in the tuber cells (Fig. 6f) compared to the
comparators and lines from Group 1 and 2 (Fig. 6b,d,h,j). The dry matter content of the tubers from Group 1
and 2 was not significantly different from the parental variety (Supplementary Fig. S2d).
Sprouting of harvested tubers was studied after five months in cold storage. Tubers from all lines already had
sprouts initiated at the end of the cold storage period, which continued to develop further at room temperature
with no major differences among the lines (Supplementary Fig. S4).
Amylose content and chain‑length distribution of tuber starch. Starch was isolated from tubers
harvested from the thirteen mutated lines and their comparators. Starch quality and structure was studied using
several methods. Based on an enzymatic method, the amylose content was found to be 98% in both lines in
Group 3 (Fig. 1). No significant increase in amylose could be found for lines in Groups 1 and 2 compared to the
parental variety (25% amylose), while the RNAi line T-2012 showed an amylose content of 40%. The amylose
content was also measured using a colorimetric method, which was found to be more influenced by variations
in the chain length distribution of the amylopectin molecule but overestimating the amylose ratios (Fig. 1b).
This method yielded an amylose content of 159–168% in the lines of Group 3. An intermediate amylose content
between 40 and 48% was measured in the Group 2 lines. The majority of the lines in Group 1 was found to be
ranging from 31 to 35%, which was somewhat lower than for the parental variety having an amylose content
of 38%. An exception was line 104032 in Group 1, which was determined to have a 45% amylose content. The
amylose content of the RNAi line was measured to be 87%, which is close to the originally published results of
89% for T-2012 using the same colorimetric method.
High-performance size exclusion chromatography (HPSEC) and high-performance anion exchange chroma-
tography (HPAEC) were used to investigate the chain-length distribution of debranched starches. In the HPSEC
analysis, the debranched starch samples of Group 1 lines showed a similar chain-length distribution pattern as
the parental variety (Fig. 2) but with slightly different amounts for different fractions of amylose. An exception
was line 104032, whose chain-length distribution pattern was close to the Group 2 starches (Supplementary
Fig. S5). Based on calculations using MALLS, it could be seen that the molecular weight at around 13 mL is in the
order of 100,000 g/mol (Supplementary Fig. S6). The molecular weight of amylose generally ranges from about
80,000 to about 1,000,000 g/mol19, which indicates that the fraction eluted before an elution volume of 13 mL
is the major amylose fraction and the fraction eluted after an elution volume of 13 mL is the major amylopectin
fraction. Three peaks were eluted between 11 and 13 mL in the starch from the parental variety, which may
correspond to three different chain lengths of amylose and are referred as long, intermediate and short-chain
amylose fractions hereafter.
Substantial changes to the chain-length distribution pattern, both in the amylose and amylopectin fractions,
could be observed for the lines of Group 2 and Group 3 compared to the parental variety (Fig. 2). The peak, which
may correspond to the intermediate amylose, is smaller for the lines in Group 2. Alterations in the chain-length
distribution were most prominent in Group 3 where the amylopectin fraction between the elution volume of
13 mL and 15 mL was absent and compensated by clearly elevated fractions of amylose. However, compared to
the parental variety, these lines lacked the population that may correspond to the short-chain amylose fraction.
Scientific Reports | (2021) 11:4311 | https://doi.org/10.1038/s41598-021-83462-z 3
Vol.:(0123456789)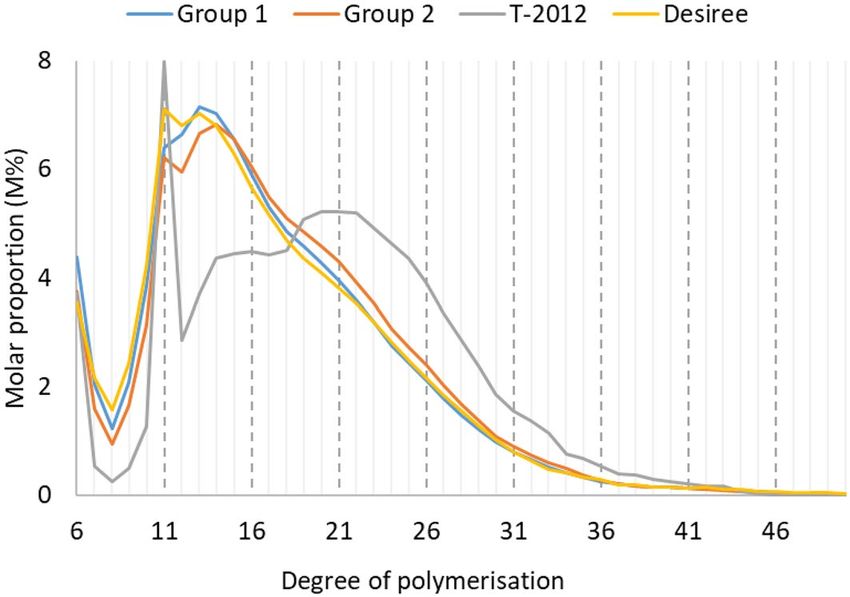
www.nature.com/scientificreports/
a b
180 180
* *
160 160
140 140
Amylose content (%) Enzymatic assay
Amylose content (%) Colorimetric assay
120 120
100 * * 100
*
80 80
60 60
*
40 40
20
* * 20
0 0
Desiree
104006
104010
T-2012
82007
82050
82079
104011
104032
104001
104005
104016
104018
104034
104023
Dersiree
104011
104032
104001
104005
104006
104016
104018
104034
104010
104023
T-2012
82007
82050
82079
Group 1 Group 2 Group 3 Group 1 Group 2 Group 3
Figure 1. Amylose content of extracted starches measured using a. enzymatic assay and b. colorimetric assay.
The results are a mean of two technical replicates, error bar represents standard deviation (s.d.). Values that
differ from the parental variety Desiree by Dunnett’s test (P < 0.05) are marked with *.
Moreover, an extra peak appeared at an elution volume of 15.4 mL, which in theory represents a short-chain
amylopectin fraction (DP > 6). However, it was not possible to observe any peak for maltodextrins (DP > 6) from
the HPAEC analysis for the starches from Group 3. This limits the possibility that the extra peak is associated with
a short-chain amylopectin fraction. The T-2012 RNAi-line had a chain-length distribution pattern that differs
from all other lines with an altered amylopectin chain-length distribution and an elevated fraction of amylose
or amylose-like long glucan chains (Fig. 2).
The molar proportion distribution of different chain lengths of starch from the potato lines, analysed by
HPAEC, is given in Fig. 3. Starch from Desiree showed a pattern where there is a predominant broad peak of
chains spanning the DP ~ 9–33 range, with a shoulder at DP11 and a slight increase of chains from DP18 (Fig. 3).
Starch from T-2012, however had a very different pattern of the chain length distribution, where there was a large
decrease in short chains of DP7–10, a high and sharp peak of chain at DP11, and less chains of DP12–18 and
more chains of DP19–42 than the other samples (Fig. 3). The proportion of chain lengths of DP ≥ 43 was very
low for all the potato lines. Starch from Group 1 lines was very similar to the parental variety in the chain length
distribution of long chains of DP > 33, with increased abundance of moderately sized chains of DP12–21 and
reduced number of short chains of DP7–11 and intermediate-sized chains of DP22–33 (Fig. 3, Supplementary
Fig S7a). The biggest effect was observed with an increase in the proportion of chains at DP6 (Supplementary
Fig. S7a). In the starch from lines in Group 2, there was a decline in the proportion of short chains of DP ≤ 13,
and an increase in those of the intermediated-sized chains of DP14–33 and, effects on chains of DP > 33 were not
pronounced compared to the parental variety (Fig. 3, Supplementary Fig. S7b). There was no peak detected for
debranched amylopectin chains from the HPAEC analysis for the starches from Group 3. Amylose is essentially
Scientific Reports | (2021) 11:4311 | https://doi.org/10.1038/s41598-021-83462-z 4
Vol:.(1234567890)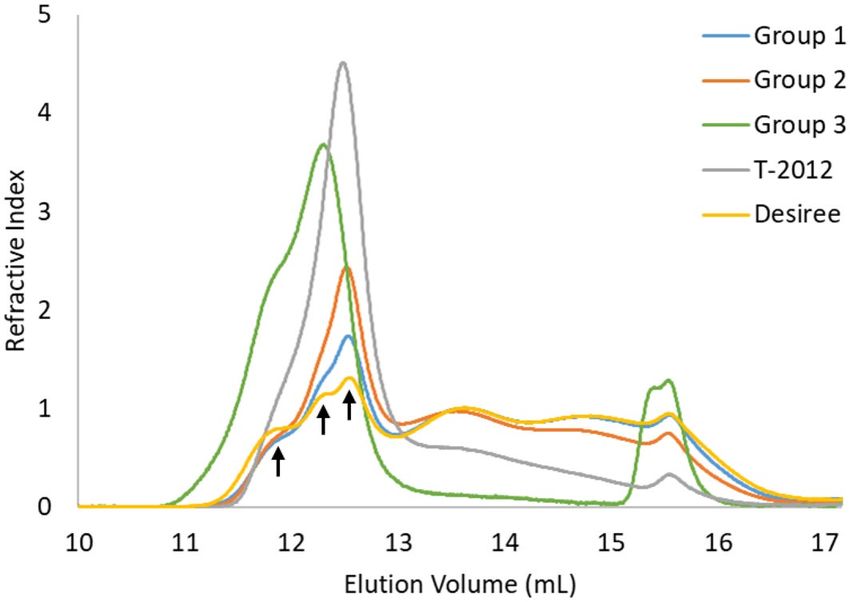
www.nature.com/scientificreports/
Figure 2. Chain-length distribution of debranched starches from the potato lines after normalisation for
the peak area, analysed with HPSEC. The averages of the potato lines from Groups 1, 2 and 3 are shown. The
parental variety Desiree and the high-amylose line T-2012 were included for comparison. The arrows from
left to right point out the three populations of amylose chains, i.e. long, intermediate, and short chain amylose
fraction, respectively. Software used is ASTRA software version 4.70.07 (wyatt.com/products/software/astra.
html, Wyatt Technology Corp., Santa Barbara, CA).
Figure 3. Chain-length distribution of debranched starches on a relative molar basis (M%) with degree of
polymerization (DP) 6–50, based on HPAEC analysis with averages of potato lines from Groups 1 and 2. No
peak was detected for the starches from Group 3. The parental variety Desiree and the high-amylose line T-2012
were included for comparison.
long linear molecule which was beyond the separation range of HPAEC, and the chain-length distribution from
the HPAEC analysis did not account the chains originating from the amylose fraction (Fig. 3).
Degree of branching of Group 3 starches. The degree of branching (DB) was analysed using NMR
spectroscopy on starch from lines in Group 3 and the parental variety Desiree. At the branching point, the
anomeric proton at the α(1 → 6)-linkage has a different chemical shift compared to other anomeric protons and
can thus be used for quantification of the DB. Neither starch from line 104010 nor 104023 showed any detect-
able branching (< 0.1%), whereas the starch from Desiree showed a DB of 3.0% (Fig. 4). Similarly, the amount of
terminal residues was markedly different, with the non-reducing end H4 yielding a clear signal from the Desiree
starch but a very weak signal from the Group 3 starches (Fig. 4).
Crystalline type and molecular order of the starch granules. As displayed in Fig. 5, most of the
potato lines showed the B-type X-ray diffraction pattern20 with diffraction peaks at 15° (broad), 17° (strong) and
a doublet at 22–24° 2θ, which is the common pattern for the tuber starches. However, the X-ray diffraction pat-
Scientific Reports | (2021) 11:4311 | https://doi.org/10.1038/s41598-021-83462-z 5
Vol.:(0123456789)www.nature.com/scientificreports/
Figure 4. 1H NMR spectra of starch from the Group 3 lines (a) 104010 and (b) 104023, and from (c) the
parental variety Desiree. Glucose H1 at the α(1 → 4)-linkage (H1) and at the α(1 → 6)-linkage (H1′) are assigned
as well as H4 of non-reducing end terminal residues (H4-t). Traces of EDTA and Tris are highlighted with
asterisks.
tern and the diffraction intensities of the Group 3 lines differed from the other lines. A decrease in the diffraction
intensity for most of the peaks was observed in the Group 3 lines when compared to the other lines. However, it
was still possible to observe all the major diffraction peaks that correspond to B type starches (Fig. 5a). Moreover,
the starch from Group 3 did not show Maltese crosses in the starch granules under polarised light, as was found
in starch from the parental variety Desiree or 104016 (Fig. 5b).
Starch granule phenotype. Starch stained with iodine and studied with light microscopy revealed that
the granular phenotype was affected in all lines but at different levels. Starch from lines in Group 1 were most
similar to starch granules from the parental variety, oval in shape but with a minor truncation in the core
(Fig. 6a). The truncated core became even more pronounced in starch from the lines in Group 2 and had more
irregularly shaped granules (Fig. 6c), where several of the granules had a similar phenotype as the RNAi line
(Fig. 6g). Granules from the lines in Group 3 were most affected as compared to the parental line and found to
have a spherical multi-lobed phenotype (Fig. 6e,i).
Greenhouse study of green biomass and transitory starch. The green biomass was measured at
three time points: four, ten and fifteen weeks after planting. Five mutated lines and the RNAi line were measured
relatively the parental variety: 82079 (Group 1), 104006 and 104018 (Group 2), 104010 and 104023 (Group 3)
and T-2012 (RNAi) (Fig. 7a, Supplementary Fig. S8). After four weeks, the parental variety had the highest bio-
mass, lines from Group 1 and 2 the second highest and lines from Group 3 the lowest. After ten weeks, all plants
had a similar biomass, while after fifteen weeks, the lines from Group 3 had the highest biomass and had passed
all other lines in growth. The parental variety plants had started to wither at time point three, which affected
the biomass, most likely due to a heavy aphid infection and pest control treatment. Therefore, the values of the
mutated lines as compared to the parental variety at time point three are overestimated, but still useful for com-
parison between the mutated lines.
Leaf tissue from the top shoots harvested at ten weeks after planting was stained with iodine after a light
and dark period. As can be seen in Fig. 7b, the lines from Group 3 had no staining, showing a deficiency in
transitory starch synthesis during the light period, while lines from Group 1 and 2 were similar to T-2012 and
the parental variety (Fig. 7b). The lines from Group 1, 2 and 3 had the expected lack of transitory starch after
the dark period. An exception was T-2012, which still stained after the dark period. It can be speculated that
the granular structure of the leaf starch affects accessibility of the starch degrading enzymes, however, further
studies are needed to elucidate the cause.
Scientific Reports | (2021) 11:4311 | https://doi.org/10.1038/s41598-021-83462-z 6
Vol:.(1234567890)www.nature.com/scientificreports/
Figure 5. X-ray diffraction patterns and polarised light microscopy of potato lines from Groups 1, 2, and 3.
(a) Average diffraction intensity for each group. The parental variety Desiree and the high-amylose line T-2012
were included for comparison. (b) Images of selected potato starches using polarised light microscopy. Scale
bar = 40 µm.
Discussion
The number of alleles mutated, and the genomic structure of mutations induced in Sbe1 and Sbe2 of potato had a
major impact on the starch quality. To develop a starch with a significant increase in chain lengths corresponding
to the amylose fraction, mutations in all alleles of both genes were needed (Group 3). The lines from Group 3
were found to have starch with a reduced degree of branching from 3.0% in the control to below the detection
limit of 0.1% and no amylopectin could be detected when analysed by HPAEC. Notably, the lines from Group 3
had at least one allele with an in-frame mutation in one or both of Sbe1 and Sbe2. In a study by Tuncel et al.14, the
quantity of the SBEs was reduced but not absent in lines with in-frame deletions in the Sbe genes. These proteins
could, even with a potential loss of activity, be of importance for starch synthesis to occur. The situation has not
been thoroughly investigated in potato, but several studies in cereals have shown that enzymes involved in the
synthesis of starch molecules and organisation into granules are active as c omplexes21–23. The remaining fraction
of SBEI and SBEII in our lines from Group 3 might be crucial to maintaining protein–protein interactions and
keeping other enzymes, such as soluble starch synthases, active.
Using the applied genome-editing method, we were not able to mimic the starch qualities of high-amylose
potatoes that were previously developed by transgenic gene i nhibition7,12,15. In our study, lines with full knockout
of SBEI together with two to three mutated Sbe2 alleles (Group 2) only had a minor effect on the amylose content.
None of the Group 2 lines were found to have the same increased amylose content or the very large fraction of
intermediate sized chains like the starch structure found in the RNAi line T-2012 included in this study, which
seem to be common among high-amylose potato starches achieved by reduced transcript levels. In a previous
study, using antisense to inhibit both SBEs, a reduction of branching enzyme activity to less than 1% was found in
tubers with starch containing more than 50% amylose12. Hence, the presence of one or two Sbe2 wild type alleles
is enough for the tubers to produce starch close to wild type levels of amylopectin.The chain length distribution
of debranched starches suggests that the targeted mutagenesis of Sbe1 with or without Sbe2 had different effects
on starch structure, which has also been shown in other s tudies14,24–28. This is believed to be due to different
activities of the potato SBE i soforms25 affecting the amylopectin s tructure29. Simultaneous suppression of SBEs
in potato has been shown to induce drastic effects on starch structure12,14,15. Consistent with these findings, our
HPSEC results for debranched starch from Groups 2 and 3 showed a loss of the short-chain amylopectin fraction
Scientific Reports | (2021) 11:4311 | https://doi.org/10.1038/s41598-021-83462-z 7
Vol.:(0123456789)www.nature.com/scientificreports/
Figure 6. Starch granules (left images) and thin sliced tuber tissue (right images) stained with iodine and
visualised under light microscope. (a,b) 82079 (Group 1) (c,d) 104018 (Group 2) (e,f) 104010 (Group 3). (g,h)
RNAi line T-2012. (i,j) parental variety Desiree. Scale bar = 100 µm.
and elevated fractions of amylose. Accordingly, a decreased number of short chains of DP ≤ 13 and an increased
proportion of intermediate-sized chains (DP14–33) were observed for starch from Group 2 by HPAEC analysis.
Many studies on cereals have reported that suppression of SBEI alone has either no detectable effect or only
a minor effect on starch s tructure30. Also previous studies in potato, antisense suppression of SBEI did not affect
the amylose content or the chain length distribution of the amylopectin30. This is in line with our HPSEC results
for Group 1 starches, which showed a similar chain length distribution of amylopectin fraction in relation to the
parental variety. One exception is line 104032, which can be found similar in structure to the Group 2 starches. It
can be speculated that this line might be a chimera or having one Sbe2 allele with a very large deletion that was
not amplified during the genomic analyses. Even though several attempts were made to elucidate that, only wild
type alleles were found using HRFA and Sanger sequencing. When studying the starches from lines in Group 1
with higher resolution using HPAEC, an altered chain-length distribution was found, indicating that a complete
knockout of SBEI alone influenced the starch structure somewhat. Moreover, light microscopy of stained starch
granules from Group 1 lines revealed a minor truncation in the core of the granules.
X-ray diffraction of starch correlates with crystalline organisation of double helixes in a starch granule, while
the crystallinity of granular starches is mostly attributed to the amylopectin fraction20. Thus, the significant loss
of the amylopectin fraction in the Group 3 starches might be the reason for the considerably decreased X-ray
diffraction pattern of the starches from Group 3. Moreover, the level of crystallinity has an inverse relationship
Scientific Reports | (2021) 11:4311 | https://doi.org/10.1038/s41598-021-83462-z 8
Vol:.(1234567890)www.nature.com/scientificreports/
a Green biomass in relation to parental variety
64
32
16
8
4
2
1
0.5 Time point 1 Time point 2 Time point 3
0.25
0.125
82079 104006 104018 104010
104023 T2012 Desiree
b
Figure 7. Transitory starch and green biomass of plants grown in greenhouse. Lines analysed are; 82079 (Group
1), 104006 (Group 2), 104018 (Group 2), 104010 (Group 3), 104023 (Group 3), T-2012 and parental variety
Desiree. (a) Green biomass measured with low-cost RGB imaging phenotyping lab using digiCamControl
(digiCamControl v2,1,2, http://www.digicamcontrol.com) and Easy Leaf Area. All lines are normalised to the
parental variety Desiree, which is set to 1. The results are a mean of three biological replicates. Note that the
vertical axis has a logarithmic scale. (b) Leaf tissue of top shoots harvested after a light (top row) and dark
period (bottom row) stained with iodine.
to the amylose c ontent31. Hence, the high-amylose feature of the potatoes from Group 3 might also contribute
to the lower degree of crystallinity in the potato lines. However, the high-amylose potato starch in line T-2012,
produced by RNAi, did not show a difference in the X-ray diffraction pattern compared to the parental variety.
Maltese crosses in starch granules generally indicate a higher degree of ordered structure in granules with
molecules arranged in a radial p attern32. It is known that the apparent intensity of the birefringence is not only
affected by the degree of crystallinity and granule thickness but also by the orientation of the crystallites33.
Therefore, the complete loss of Maltese crosses in the starch from Group 3 could be attributed to a deviation in
the orientation of the crystallites from its radial arrangement. The results from X-ray diffraction, polarised light
microscopy and NMR spectroscopy revealed a type of starch that has the ability to organise into granules with
a poorly ordered amylose crystalline arrangement, even with the considerable loss of the amylopectin fraction.
These results are also in agreement with the study of amylose-only barley starch16.
Lines from Group 3 had a significantly decreased tuber yield, tuber size and tuber dry matter content. In a
previous study of high-amylose potato lines grown in the field for several years, plants were found to be stunted
in growth15. It was speculated that the gene inhibitions could also have an effect on diurnal starch, which might
have led to a depletion in the energy turnover, or that an increase in sugars in the plant might disturb other
metabolic processes. In this study, the development of the Group 3 lines was supressed during the first period after
planting but those lines developed a higher green biomass than lines from Groups 1 and 2 up until senescence;
despite that, the transitory starch was clearly decreased after a light period. One hypothesis could be that once
tuber initiation occurs and throughout the tuber development phase, the low efficiency of channelling sugars
into long-term storage as tuber starch is instead redistributed to produce green biomass.
Scientific Reports | (2021) 11:4311 | https://doi.org/10.1038/s41598-021-83462-z 9
Vol.:(0123456789)www.nature.com/scientificreports/
To our knowledge, this is the first time potato starch with no detectable branching has been developed and
studied. It highlights the expanded knowledge we can gain from using genome editing to study enzymatic func-
tions and consequences of the loss of enzymatic activities on biosynthesis and plant products. This study has
also raised new questions, for example, how can the self-organisation of starch into granules occur even with
complete absence of branching, or are they simple molecular aggregates?
Material and methods
Design of targets. Genomic DNA was extracted from Desiree leaf tissue using the Gene Jet Plant Genomic
DNA purification Mini Kit (Thermo Fisher Scientific, Waltham, MA) and sequenced through the Illumina
TruSeq PCR-free library preparation (average fragment size 350 bp) and Illumina HiSeqX (PE 2 × 150 bp)
(National Genomics Infrastructure, Stockholm, Sweden). Targets were selected in regions of exon 5 in Sbe1
(GenBank accession no. NW_006238958.1:c2098376-2090439) and in exon 3 in Sbe2 (GenBank accession no.
NW_006238947.1: c2592132-2611729) using CRISPR RGEN Tools (http://www.rgenome.net/cas-designer) and
a previously available guide design tool (http://crispr.mit.edu/). Double sgRNA targets were selected for each
gene and named BE1T3 and BE1T4 as well as BE2T3 and BE2T4 (Fig. S1). All sgRNAs were designed to target
allelic homologous regions, except for BE2T4 which had a mismatch at the first bp prior PAM in one of the four
alleles.
Mutagenesis and genotyping. Mutations were induced in Solanum tuberosum L. cultivar Desiree
through PEG-mediated protoplast transfection of RNPs. In vitro propagation, protoplast isolation, regeneration
and mutation screening and characterisation were performed as described in Andersson et al.11. Transfection
of RNPs to isolated protoplasts was done essentially as described in Andersson et al.35 using 5 ug in vitro tran-
scribed RNA preassembled with 5 ug Cas9 per target (Thermo Fisher Scientific, Waltham, MA) for lines named
82- or 0.1 nmol synthetically produced crRNA preassembled with 5 ug Cas9 per target (IDT, Coralville, IA,
USA) for lines named 104-.
The transfection conditions were 40% PEG and 30 min incubation time. Care was taken to only pick one
shoot from each calli. High-resolution fragment analysis (HRFA) was performed as previously described11 by
multiplexing primers SBE1f.-HEX and SBE1_r with SBE2_3f.-FAM and stbe2exonr and screening for mutations
in both genes simultaneously. Sanger sequencing (Eurofins Genomics, Ebersberg, Germany) was performed
using unlabelled primers of SBE1f.-HEX and SBE1_r, SBE2_3f.-FAM and stbe2exonr as well as stbe2exonr and
Stbe2exonf (Supplementary Table S1).
Greenhouse cultivation. Thirteen genome edited lines, the parental variety Desiree and one RNAi line,
T-2012 from the parental variety Dinamo developed in a previous s tudy7, were grown in a greenhouse. In vitro
cuttings of the lines were planted in soil (Yrkesplantjord, SW Horto, Hammenhög, Sweden) in three to five
biological replicates in 7.5 L pots and cultivated under controlled greenhouse conditions: 16-h day length,
18/15 °C day/night temperature, supplementary light intensity up to approximately 200 µmol s−1 m−2 photons,
60% relative humidity. The lines were grown for 5 months between 13 December and 21 May and were regularly
fertilised with SW Bouyant RikaS 7-1-5 + mikro (SWHorto, Hammenhög, Sweden).
Starch isolation, dry matter and amylose measurement. Starch was extracted from tubers har-
vested after senescence according to Larsson et al.34 with a minor modification where the time for sedimenta-
tion after extraction and each buffer washing steps were performed overnight to secure that small granules
were retained. Dry matter content was measured on freshly harvested tubers as previously described35. Amylose
content was measured on isolated starch using both an enzymatic assay and a colorimetric assay. The enzymatic
assay was made using an amylose/amylopectin kit (Megazyme, Bray, Co, Ireland) according to the supplier’s
instructions. The colorimetric method was based on iodine complex formation stabilized with trichloroacetic
acid. The amylose content was analyzed according to Chrastil36 with minor modification. After solubilisation of
starch with Urea-dimethylsulphoxide (UDMSO) according to Morrison and L aignelet37, 25 µL of sample was
transferred to each of two test tubes. 5 mL 0.5% trichloroacetic acid and 50 µL 0.01 N KI-I2 solution were directly
added for 30 min incubation at 25 °C before the absorbance measurement. A standard curve (R2 = 0.999) was
developed using waxy potato starch (Lyckeby starch AB, Kristianstad, Sweden) and potato amylose standard
(type III, Sigma Chemical Co., MO, USA) with varying amylose contents of 0%, 25%, 50%, 75% and 100%. All
samples were analyzed in duplicate and results are reported as average values with standard deviation (SD) based
on total starch content.
Starch structural analysis. Starch samples solubilised in UDMSO (0.6 M urea in 90% DMSO) were used
for chain-length distribution analysis by high-performance size exclusion chromatography (HPSEC) and high-
performance anion exchange chromatography (HPAEC) as previously described38–40. The starch samples were
debranched with isoamylase from Pseudomonas sp (EC 3.2.1.68, 500 U/mL, Megazyme, Wicklow, Ireland) and
pullulanase M1 from Klebsiella planticola (EC 3.2.1.41, 700 U/mL, Megazyme, Wicklow, Ireland) before both
analyses. The enzymes were desalted and ten-fold diluted using acetate buffer (0.01 M, pH 5.0) before applied
for debranching.
For HPSEC, 300 μL each enzyme and 400 μL distilled water was mixed with 500 μL solubilised starch sam-
ple for debranching overnight at 40 °C. For HPAEC, 60 μL each enzyme and 880 μL distilled water and 400 μL
sodium-acetate buffer (0.01 M, pH 5.0) was mixed with 100 μL solubilised starch sample for debranching over-
night at 40 °C. For both HPSEC and HPAEC, the samples were boiled for 10 min after debranching to terminate
the enzyme reaction and then filtered through a 0.45 μm nylon filter before analysis.
Scientific Reports | (2021) 11:4311 | https://doi.org/10.1038/s41598-021-83462-z 10
Vol:.(1234567890)www.nature.com/scientificreports/
The HPSEC was performed as described in Andersson et al.41 with minor modifications. The HPSEC system
has two serially connected OHpak SB-802.5 HQ columns with a guard column (Shodex, Showa Denko KK,
Miniato, Japan) kept at 35 °C. The eluent was 0.1 M NaNO3, containing 0.02% NaN3 with a flow rate of 0.5 mL/
min. The HPSEC is equipped with refractive index (RI) detector (Wyatt Technology Corp., Santa Barbara, CA)
and multiple-angle laser light scattering detector (MALLS; Dawn DSP equipped with a He–Ne laser at 632.8 nm,
Wyatt Technology Corp., Santa Barbara, CA). Data for molecular-weight determinations were analysed using
ASTRA software version 4.70.07 (wyatt.com/products/software/astra.html, Wyatt Technology Corp., Santa Bar-
bara, CA) based on a dn/dc of 0.14741. The angular fit was based on the Debye p rocedure41. The HPSEC columns
were calibrated with Dextran T2000, Dextran T500, maltoheptaose, maltopentaose, maltotriose, and glucose
(Supplementary Fig. S9). Results are given as the average of two replicates and the total area of HPSEC chroma-
tograms were normalized between elution volume 10 mL and 17 mL, after which maltopentaose, maltotriose,
and glucose were eluted (Supplementary Fig. S9).
The HPAEC (Series 4500i, Dionex Corp., Sunnyvale, CA, USA) coupled with a BioLC gradient pump and a
pulsed amperometric detector (PAD) was used in this study. Separation was performed on a CarboPac PA-100
(4 × 250 mm) analytical column (Dionex, Sunnyvale USA) equipped with a guard column. The elution was per-
formed at 25 °C with a flow rate of 1 mL/min and injection volume of 25 μL using 0.15 M NaOH (A) and 0.50 M
NaOAc + 0.15 M NaOH (B) with the following gradient: 0–15 min, 15–28% eluent B; 15–45 min, 28–55% B;
45–75 min, 55–70% B; and 75–80 min 70–15% B (return to the start mixture). The column was equilibrated with
15% eluent B for 15 min between runs. The PAD response was converted to molar percentage and n ormalised38.
All results are given as the average of two replicates.
NMR spectroscopy. Starch from the parental variety and the Group 3 lines were analysed by NMR for
degree of branching according to Tizzotti, et al.42. Starch samples (10 mg) were dissolved by heating in deuter-
ated dimethyl sulfoxide (DMSO-d6; 600 µL) with the addition of deuterated trifluoroacetic acid (TFA-d1; 10 µL)
prior to NMR analysis to avoid spectral interference with hydroxyl protons. 1H NMR spectra were recorded on
a Bruker Avance III 600 MHz spectrometer using a 5 mm broadband observe detection SmartProbe. Spectra
were acquired at 50 °C using 128 scans and a relaxation delay of 12 s and were processed with TopSpin 3.6. The
degree of branching was measured as the ratio I1−6/(I1−6 + I1−4), where I1−6 is the integrated signal at 4.77 ppm and
I1−4 is the integrated signal at 5.12 ppm, corresponding to H1 of glucose at the α(1 → 6) and α(1 → 4)-linkages,
respectively.
X‑ray diffraction patterns. The method for X-ray diffraction analysis has been previously described5.
Starch X-ray patterns were identified using a PANalytical X’Pert alpha1 powder X-ray diffractometer in Theta-
2Theta geometry, and coupled with a focusing Johansson Ge monochromator producing pure Cu-Kα1 radiation
(λ = 1.54060 Å). The starches were spread onto 1.5^2 c m2 Si wafers. The scanning region of the diffraction angle
(2θ) was from 5° to 40°.
Polarised light microscopic analysis of starch granules. Starch dispersions (0.5 mL, 50 mg/mL) in
distilled water were freshly prepared. One drop (25 μL) of each starch dispersion was taken for microstruc-
tural analysis5 using a light microscope (Leica DMLB, Wetzlar, Germany) equipped with an infinity X-32 digital
camera (DeltaPix, Samourn, Denmark). The images of starch granules were captured at a 20 × objective under
polarised light to compare the birefringence of starch granules from lines from Group 3, 104016 (from Group
2) and the parental variety.
Starch granule phenotyping. Starch granule distribution and phenotype was studied by staining thin
tuber discs and purified starch granules with Lugol’s solution. The results were visualised with a light micro-
scope (LeicaDMLB, Leica Microsystems, Wetzlar, Germany) and documented with an assembled camera (Leica
DFC450C, Leica Microsystems, Wetzlar, Germany).
Green biomass phenotyping. Green biomass of five of the mutated lines, 82079, 104006, 104018, 104010,
104023 as well as Desiree and T-2012, were studied in a greenhouse. The plants were grown between 7 October
and 22 January under the same growth conditions as described above.
Green biomass was measured at four, ten and fifteen weeks after planting using a low-cost RGB imaging phe-
notyping lab published by Armoniene et al.35. The plants were placed on a rotating disc and images were taken
as side views with a standard camera (Canon 1300D, Canon, USA) tethered to the software digiCamControl
v2,1,2 (http://www.digicamcontrol.com)43. Four photos were taken of each plant and three biological replicates
covering 360º of the plants. The images were processed using Easy Leaf Area44.
Top leaves were harvested at week 10, decoloured by boiling in 80% EtOH and stained with 50% Lugol’s
solution.
Sprouting. Harvested greenhouse grown potatoes were stored in the dark at 6 ℃ for five months before
being incubated at 22 ℃ for 3 months. Sprout development was studied through naked eye observation once a
week.
Scientific Reports | (2021) 11:4311 | https://doi.org/10.1038/s41598-021-83462-z 11
Vol.:(0123456789)www.nature.com/scientificreports/
Received: 20 May 2020; Accepted: 29 January 2021
References
1. Nadakuduti, S. S., Starker, C. G., Voytas, D. F., Buell, C. R. & Douches, D. S. Genome Editing in Potato with CRISPR/Cas9. In Plant
Genome Editing with CRISPR Systems. Methods in Molecular Biology Vol. 1917 (ed. Qi, Y.) (Humana Press, New York, 2019).
2. Nadakuduti, S. S., Buell, C. R., Voytas, D. F., Starker, C. G. & Douches, D. S. Genome editing for crop improvement: applica-
tions in clonally propagated polyploids with a focus on potato (Solanum tuberosum L.). Front. Plant Sci. https://doi.org/10.3389/
fpls.2018.01607(2018).
3. Birch, P. R. J. et al. Crops that feed the world 8: potato—are the trends of increased global production sustainable?. Food Secur. 4,
477–508. https://doi.org/10.1007/s12571-012-0220-1 (2012).
4. Zeeman, S. C., Kossmann, J. & Smith, A. M. Starch: its metabolism, evolution, and biotechnological modification in plants. Annu.
Rev. Plant Biol. 61, 209–234. https://doi.org/10.1146/annurev-arplant-042809-112301 (2010).
5. Zhao, X., Andersson, M. & Andersson, R. Resistant starch and other dietary fiber components in tubers from a high-amylose
potato. Food Chem. 251, 58–63. https://doi.org/10.1016/j.foodchem.2018.01.028 (2018).
6. Lehmann, U. & Robin, F. Slowly digestible starch: its structure and health implications—a review. Trends Food Sci. Technol. 18,
346–355. https://doi.org/10.1016/j.tifs.2007.02.009 (2007).
7. Menzel, C. et al. Improved material properties of solution-cast starch films: effect of varying amylopectin structure and amylose
content of starch from genetically modified potatoes. Carbohyd. Polym. 130, 388–397. https: //doi.org/10.1016/j.carbpo l.2015.05.024
(2015).
8. Jacobsen, E., Ramanna, M. S., Huigen, D. J. & Sawor, Z. Introduction of an amylose-free (amf) mutant into breeding of cultivated
potato, solanum-tuberosum l. Euphytica 53, 247–253. https://doi.org/10.1007/bf00023276 (1991).
9. Visser, R. G. F. et al. Inhibition of the expression of the gene for granule-bound starch synthase in potato by antisense constructs.
Mol. Gen. Genet. 225, 289–296. https://doi.org/10.1007/bf00269861 (1991).
10. Andersson, M. et al. A novel selection system for potato transformation using a mutated AHAS gene. Plant Cell Rep. 22, 261–267.
https://doi.org/10.1007/s00299-003-0684-8 (2003).
11. Andersson, M. et al. Efficient targeted multiallelic mutagenesis in tetraploid potato (Solanum tuberosum) by transient CRISPR-
Cas9 expression in protoplasts. Plant Cell Rep. 36, 117–128. https://doi.org/10.1007/s00299-016-2062-3 (2017).
12. Schwall, G. P. et al. Production of very-high-amylose potato starch by inhibition of SBE A and B. Nat. Biotechnol. 18, 551–554
(2000).
13. Andersson, M. et al. Targeted gene suppression by RNA interference: an efficient method for production of high-amylose potato
lines. J. Biotechnol. 123, 137–148. https://doi.org/10.1016/j.jbiotec.2005.11.001 (2006).
14. Tuncel, A. et al. Cas9-mediated mutagenesis of potato starch-branching enzymes generates a range of tuber starch phenotypes.
Plant Biotechnol. J. 17, 2259–2271. https://doi.org/10.1111/pbi.13137 (2019).
15. Hofvander, P., Andersson, M., Larsson, C. T. & Larsson, H. Field performance and starch characteristics of high-amylose pota-
toes obtained by antisense gene targeting of two branching enzymes. Plant Biotechnol. J. 2, 311–320. https://doi.org/10.111
1/j.1467-7652.2004.00073.x (2004).
16. Carciofi, M. et al. Concerted suppression of all starch branching enzyme genes in barley produces amylose-only starch granules.
BMC Plant Biol. https://doi.org/10.1186/1471-2229-12-223 (2012).
17. Sun, Y. W. et al. Generation of high-amylose rice through CRISPR/Cas9-mediated targeted mutagenesis of starch branching
enzymes. Front. Plant Sci. https://doi.org/10.3389/fpls.2017.00298 (2017).
18. Wang, H. X. et al. CRISPR/Cas9-based mutagenesis of starch biosynthetic genes in sweet potato (ipomoea batatas) for the improve-
ment of starch quality. Int. J. Mol. Sci. https://doi.org/10.3390/ijms20194702 (2019).
19. Delcour, J. A. H. Chapter 2 Starch in (3rd ed.) Principles of Cereal Science and Technology 33–55 (AACC International Press, Min-
nesota, 2010).
20. 20Hizukuri, S., Abe, J.-i. & Hanashiro, I. in A-C. Eliasson (Eds.), Carbohydrates in food, 2nd edition 363–365 (CRC Press, Boca
Raton, FL, USA, 2006).
21. Tetlow, I. J. et al. Analysis of protein complexes in wheat amyloplasts reveals functional interactions among starch biosynthetic
enzymes. Plant Physiol. 146, 1878–1891. https://doi.org/10.1104/pp.108.116244 (2008).
22. Tetlow, I. J. et al. Protein phosphorylation in amyloplasts regulates starch branching enzyme activity and protein-protein interac-
tions. Plant Cell 16, 694–708. https://doi.org/10.1105/tpc.017400 (2004).
23. Helle, S. et al. Proteome analysis of potato starch reveals the presence of new starch metabolic proteins as well as multiple protease
inhibitors. Front. Plant Sci. https://doi.org/10.3389/fpls.2018.00746 (2018).
24. Brummell, D. A. et al. Overexpression of STARCH BRANCHING ENZYME II increases short-chain branching of amylopectin
and alters the physicochemical properties of starch from potato tuber. BMC Biotechnol. https: //doi.org/10.1186/s12896 -015-0143-y
(2015).
25. Rydberg, U., Andersson, L., Andersson, R., Aman, P. & Larsson, H. Comparison of starch branching enzyme I and II from potato.
Eur. J. Biochem. 268, 6140–6145. https://doi.org/10.1046/j.0014-2956.2001.02568.x (2001).
26. Andersson, L. et al. Characterisation of the in vitro products of potato starch branching enzymes I and II. Carbohydr. Polym. 50,
249–257. https://doi.org/10.1016/S0144-8617(02)00059-0 (2002).
27. Andersson, L., Rydberg, U., Larsson, H., Andersson, R. & Aman, P. Preparation and characterisation of linear dextrins and their
use as substrates in in vitro studies of starch branching enzymes. Carbohydr. Polym. 47, 53–58. https://doi.org/10.1016/S0144
-8617(01)00162-X (2002).
28. Blennow, A. et al. Structure function relationships of transgenic starches with engineered phosphate substitution and starch
branching. Int. J. Biol. Macromol. 36, 159–168. https://doi.org/10.1016/j.ijbiomac.2005.05.006 (2005).
29. Kossmann, J. & Lloyd, J. Understanding and influencing starch biochemistry. Crit. Rev. Plant Sci. 19, 171–226. https://doi.
org/10.1016/S0735-2689(00)80002-7 (2000).
30. Safford, R. et al. Consequences of antisense RNA inhibition of starch branching enzyme activity on properties of potato starch.
Carbohyd. Polym. 35, 155–168. https://doi.org/10.1016/s0144-8617(97)00249-x (1998).
31. Cheetham, N. W. H. & Tao, L. P. Variation in crystalline type with amylose content in maize starch granules: an X-ray powder
diffraction study. Carbohydr. Polym. 36, 277–284. https://doi.org/10.1016/S0144-8617(98)00007-1 (1998).
32. Bertoft, E. Understanding starch structure: recent progress. Agronomy Basel https://doi.org/10.3390/agronomy7030056 (2017).
33. French, D. Chapter VII—Organization of Starch Granules. In Starch: Chemistry and Technology 2nd edn (eds Whistler, R. L. et al.)
183–247 (Academic Press, London, 1984).
34. Larsson, C. T. et al. Three isoforms of starch synthase and two isoforms of branching enzyme are present in potato tuber starch.
Plant Sci. 117, 9–16. https://doi.org/10.1016/0168-9452(96)04408-1 (1996).
35. Andersson, M. et al. Inhibition of plastid PPase and NTT leads to major changes in starch and tuber formation in potato. J. Exp.
Bot. 69, 1913–1924. https://doi.org/10.1093/jxb/ery051 (2018).
36. Chrastil, J. Improved colorimetric determination of amylose in starches or flours. Carbohydr. Res. 159, 154–158. https://doi.
org/10.1016/s0008-6215(00)90013-2 (1987).
Scientific Reports | (2021) 11:4311 | https://doi.org/10.1038/s41598-021-83462-z 12
Vol:.(1234567890)www.nature.com/scientificreports/
37. Morrison, W. R. & Laignelet, B. An improved colorimetric procedure for determining apparent and total amylose in cereal and
other starches. J. Cereal Sci. 1, 9–20. https://doi.org/10.1016/s0733-5210(83)80004-6 (1983).
38. Koch, K., Andersson, R. & Aman, P. Quantitative analysis of amylopectin unit chains by means of high-performance anion-
exchange chromatography with pulsed amperometric detection. J. Chromatogr. A 800, 199–206 (1998).
39. Zhu, F., Bertoft, E. & Seetharaman, K. Characterization of internal structure of maize starch without amylose and amylopectin
separation. Carbohydr. Polym. 97, 475–481. https://doi.org/10.1016/j.carbpol.2013.04.092 (2013).
40. Kallman, A. et al. Starch structure in developing barley endosperm. Int. J. Biol. Macromol. 81, 730–735. https://doi.org/10.1016/j.
ijbiomac.2015.09.013 (2015).
41. Andersson, R., Fransson, G., Tietjen, M. & Åman, P. Content and molecular-weight distribution of dietary fiber components in
whole-grain rye flour and bread. J. Agric. Food Chem. 57, 2004–2008. https://doi.org/10.1021/jf801280f (2009).
42. Tizzotti, M. J., Sweedman, M. C., Tang, D., Schaefer, C. & Gilbert, R. G. New 1H NMR procedure for the characterization of native
and modified food-grade starches. J. Agric. Food Chem. 59, 6913–6919. https://doi.org/10.1021/jf201209z (2011).
43. Armoniene, R., Odilbekov, F., Vivekanand, V. & Chawade, A. Affordable imaging lab for noninvasive analysis of biomass and early
vigour in cereal crops. Biomed. Res. Int. https://doi.org/10.1155/2018/5713158 (2018).
44. Easlon, H. M. & Bloom, A. J. Easy leaf area: Automated digital image analysis for rapid and accurate measurement of leaf area.
Appl. Plant Sci. https://doi.org/10.3732/apps.1400033 (2014).
Acknowledgements
We wish to thank Dhananjay Kumar and Aakash Chawade for their support with phenotyping of the green
biomass. This work was supported by The Swedish Foundation for Strategic Environmental Research MISTRA,
The Swedish Governmental Research program Trees and Crops for the Future (TC4F), Formas, a Swedish govern-
ment research council for sustainable development (2018-01459) and Lyckeby Research Foundation (Stiftelsen
Stärkelsen Forskning Utveckling).
Author contributions
M.A., R.A and P.H. conceived and designed research. M.A., X.Z., S.J., H.T., A-S.F, G.N., M.G., N.O. and M.B.
designed and conducted experiments. M.A., X.Z., S.J. and G.N. wrote the manuscript. All authors read, edited
and approved the manuscript.
Funding
Open Access funding provided by Swedish University of Agricultural Sciences.
Competing interests
The authors declare no competing interests.
Additional information
Supplementary Information The online version contains supplementary material available at https://doi.
org/10.1038/s41598-021-83462-z.
Correspondence and requests for materials should be addressed to M.A.
Reprints and permissions information is available at www.nature.com/reprints.
Publisher’s note Springer Nature remains neutral with regard to jurisdictional claims in published maps and
institutional affiliations.
Open Access This article is licensed under a Creative Commons Attribution 4.0 International
License, which permits use, sharing, adaptation, distribution and reproduction in any medium or
format, as long as you give appropriate credit to the original author(s) and the source, provide a link to the
Creative Commons licence, and indicate if changes were made. The images or other third party material in this
article are included in the article’s Creative Commons licence, unless indicated otherwise in a credit line to the
material. If material is not included in the article’s Creative Commons licence and your intended use is not
permitted by statutory regulation or exceeds the permitted use, you will need to obtain permission directly from
the copyright holder. To view a copy of this licence, visit http://creativecommons.org/licenses/by/4.0/.
© The Author(s) 2021
Scientific Reports | (2021) 11:4311 | https://doi.org/10.1038/s41598-021-83462-z 13
Vol.:(0123456789)You can also read