5 March 2019 - Metlifecare
←
→
Page content transcription
If your browser does not render page correctly, please read the page content below

5 March 2019

CONTENTS

                                   COMPANY OVERVIEW
                                   First Half Financial Highlights                   04

                                   First Half Operating Highlights                   05

                                   Chair and CEO Performance and Strategy Review     06

                                   INTERIM GROUP FINANCIAL STATEMENTS
                                   Consolidated Statement of Comprehensive Income    20

                                   Consolidated Statement of Movements in Equity     21

                                   Consolidated Balance Sheet                        22

                                   Consolidated Cash Flow Statement                  23

                                   Notes to the Interim Group Financial Statements   24

                                   Independent Review Report                         36

                                   DIRECTORY
                                   Metlifecare Directory                             38

    We are continuing to achieve   Metlifecare Villages                              40

     high levels of occupancy
     and strong price growth,
        demonstrating the
         competitiveness
     of Metlifecare’s offering.
             Kim Ellis, Chair

2                                                                                         3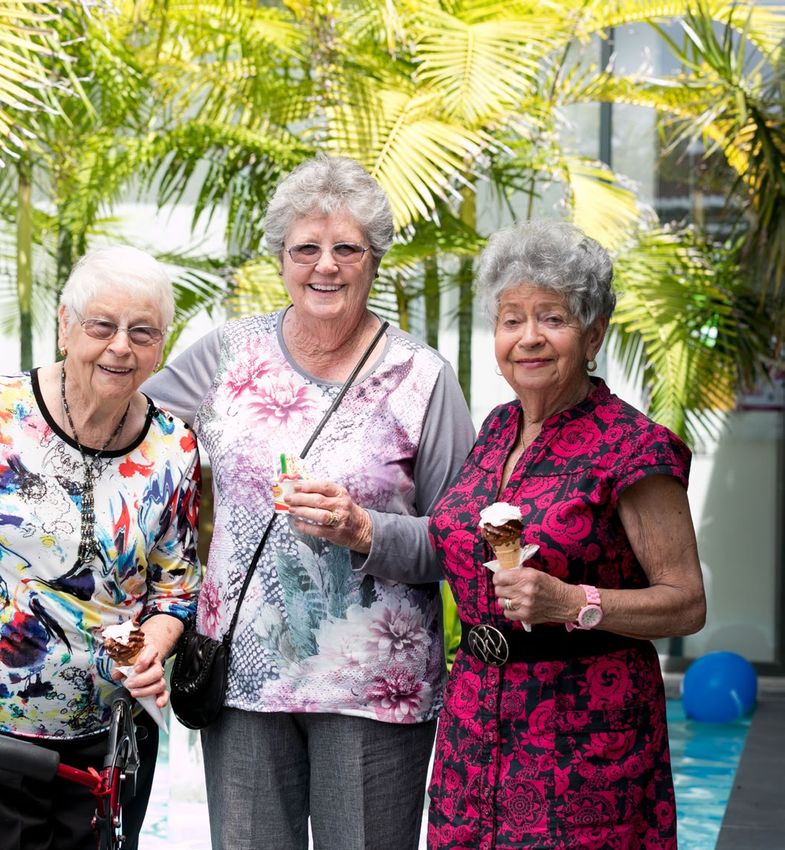
1
          FIRST HALF                                                                                                                                                               FIRST HALF
          FINANCIAL                                                                                                                                                  OPERATING
          HIGHLIGHTS                                                                             100%
                                                                                                 of care homes audited
                                                                                                                         Development site
                                                                                                                            acquired
                                                                                                                                                                     HIGHLIGHTS

                                                                                                                                             16%
                                                                                                  achieved 3 or 4 year
                                                                                                      certification2
           Net Profit
           After Tax                            $24.5m                                                                                        Increase in ORA
                                                                                                                                                applications

           Underlying Profit
           Before Tax1                          $41.7m
           Underlying
           Operating
           Cash Flow1
                                                $20.0m
           Total Assets
                                                $3.4b                                                                         New Zealand Aged Care
                                                                                                                                Association Awards
                                                                                                                                                                                  Development margin

                                                                                                                         WINNER
                                                                                                                                                                                  on new homes sold

                                                $6.97
                                                                                                                                                                                  23%
           Net Assets
           per Share
                                                                                                                               Jackson Van Interiors
                                                                                                                                  Built & Grown
                                                                                                                                Environment Award
           Embedded Value
           per Unit1                            $279k
                                                                                                                                                             Average new
                                                                                                 Total homes sold

                                                                                                 226
                                                                                                                                                          home selling price up

           Interim Dividend
                                                3.75c                       per
                                                                            share                                                                               11%
                                                                                                                                                                Average resale
    1. These are non-GAAP measures. The definitions of these and other non-GAAP                                                                                    price up

                                                                                                                                                                  7%
       financial measures in this report can be found on p38 of the 1H19 results presentation.
       A copy of the 1H19 results presentation can be found on www.metlifecare.co.nz/
       investor-centre/investor-presentations.

    2. Ministry of Health Certification. Excludes new Pinesong village care suites.                                                                                                    Hibiscus Coast Village
                                                                                                                                                                                                   new café

4                                                                                                                                                                                                               5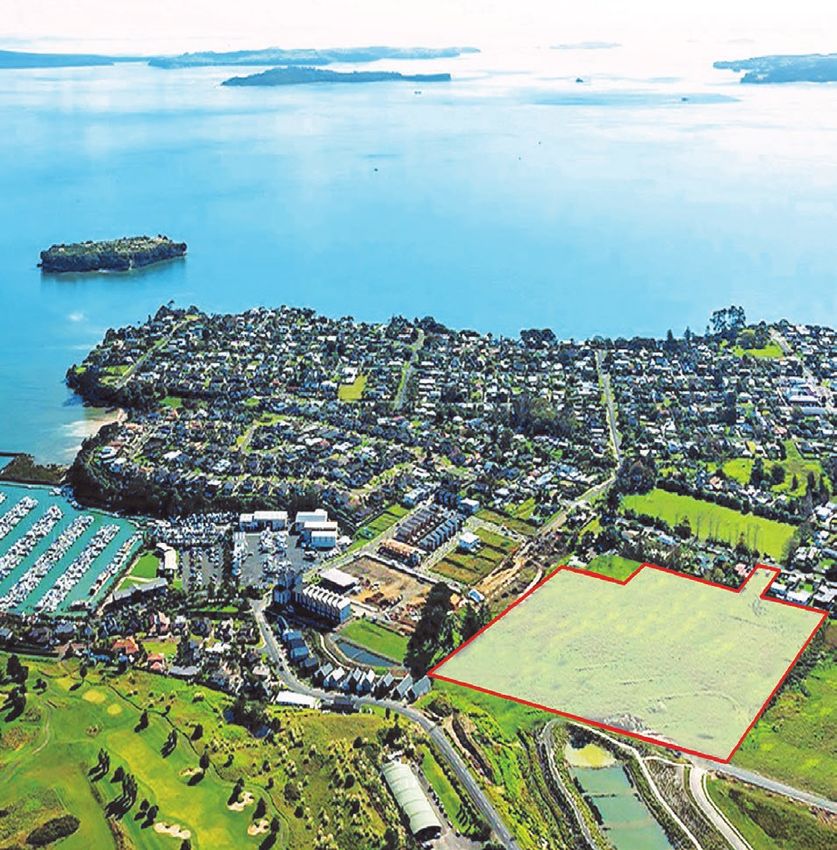
Underlying Profit Before Tax ($m)
CHAIR & CEO PERFORMANCE
1H
Looking further out, we are making good 2H
87.2
AND STRATEGY REVIEW
progress with the construction of new villages 82.0
in the fast-growing areas of Beachlands, East 66.1
Auckland and Orion Point, Hobsonville; both 52.4 51.0
43.4
of which are scheduled to open in 2020. 32.6
26.4
32.1
Glen Sowry Kim Ellis FINANCIAL REVIEW 38.6 41.7
33.5 36.2
CEO Chair 26.0
A solid operating performance in the six-
month period to 31 December 2018 lifted FY15 FY16 FY17 FY18 1H19
underlying profit before tax to a record $41.7
million, 15% higher than the same period last Net Assets per Share
year. Revenue increased by 21% to $68.6
million, driven primarily by higher realised $6.97
resales gains and development margins and $6.64
increased care revenue. $6.05
These gains were partially offset by increased $4.85
investment in property and maintenance,
“Our selling prices are higher employee costs and a non-cash $3.92
impairment3 related to two new care homes
significantly higher than a year
currently under construction. 1H15 1H16 1H17 1H18 1H19
ago and we are consistently
outperforming both broader Underlying operating cash flow increased by
Embedded Value ($m)
10% to $20.0 million during the period under
market price growth and our DMF
review.
Welcome to valuations.” the prices assumed
Resale Gain
While the fair value of Metlifecare’s
Metlifecare’s interim in the group’s
investment properties grew by $29.6 million 737
report for the first half of CBRE valuations. This 736
during the period, this growth has eased 661
the 2019 financial year. is a positive reflection of the
relative to previous years with moderating 405
strength and desirability of Metlifecare’s 283
Your Board is pleased to report an improved housing market price growth. Accordingly, 398
brand, the ongoing investment in our village 325 362
operating result for the six months to 31 reported net profit after tax, which includes 271 297
environments and the quality experience
December 2018, driven by increased sales the non-realised fair value increase in the
enjoyed by our residents. 1H15 1H16 1H17 1H18 1H19
volumes and realised margins, and strong company’s assets, was $24.5 million, 57%
demand for our villages. Our expansion programme has continued lower than last year’s $56.3 million.4
Dividend History
at pace, with a strong focus this year on our
In the first half we continued our focus The value of the company’s total assets at
care offering. In July 2018 we opened our Interim Dividend cps Final Dividend cps Full Year Dividend cps
on improving Metlifecare’s operating balance date was $3.4 billion, 11% higher than
newest care home at Pinesong Village in 10.00
performance and investing in the future. last year. Net assets per share were $6.97, 5%
Titirangi, with a further two new care homes 8.05
As you will see, we have delivered on both higher than last year.
to be completed in the Bay of Plenty later this 6.75
counts.
year. We also look forward to welcoming the 5.75 5.80
4.50
While the housing market has moderated as first residents to our new Gulf Rise village on 4.00
3.00
expected, our selling prices are substantially Auckland’s Hibiscus Coast, as well as opening
3 Refer Note 2.2 of the Interim Group Financial Statements. 3.75
higher than a year ago and we are consistently 3.25
two new apartment buildings at Greenwich 4 All percentage changes are in relation to the prior comparable 1.50 1.75 2.25
outperforming both market price growth and Gardens on Auckland’s North Shore. NTA PER period (six months to 31 December 2017) unless otherwise
stated. FY15 FY16 FY17 FY18 FY19
SHARE
6 7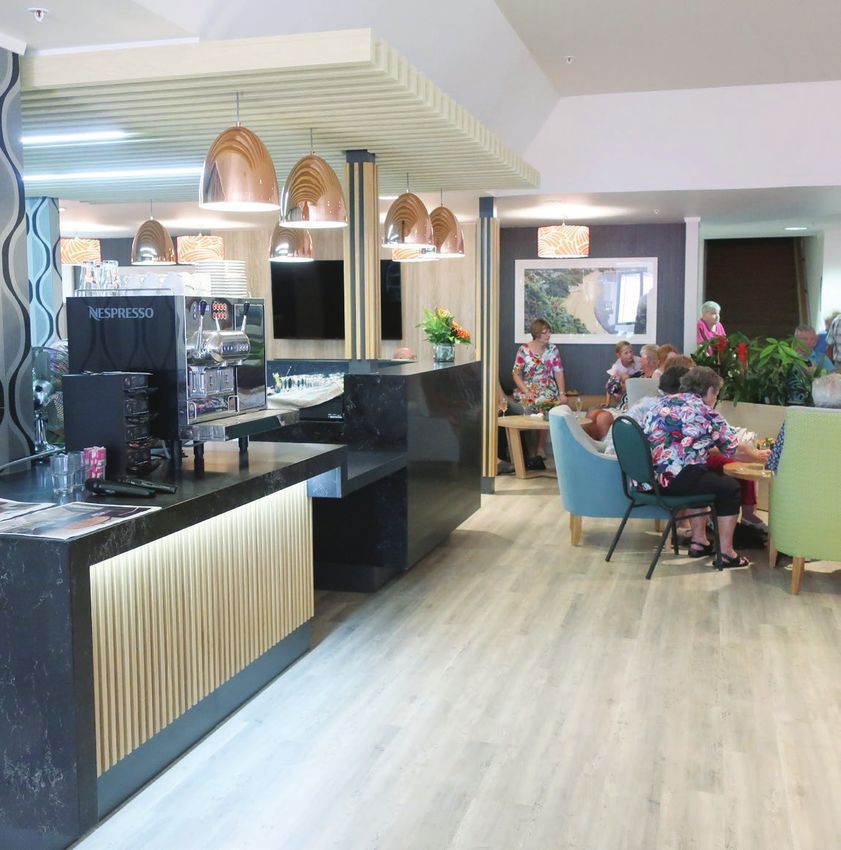
PERFORMANCE AND STRATEGY REVIEW CONTINUED

    Metlifecare settled 170 resales of occupation     balance date was $254.8 million and gearing
                                                                                                                                                                FINANCIAL SUMMARY                 1H FY19   1H FY18   % CHANGE           FY18
    right agreements during the period, up 13%        (net debt as a percentage of net debt plus
    on last year, with a further 77 homes under       equity) was 15%, retaining capacity to fund
                                                                                                                                                            Underlying profit before tax ($m)      41.7      36.2       15%              87.2
    contract at balance date. The average             ongoing growth.
    selling price per resale rose 7% to $572,000,                                                                                                               Net profit after tax ($m)          24.5      56.3       -57%             125.1
                                                      In December 2018 the company completed
    clearly outperforming the markets in which                                                                                                            Underlying operating cash flow ($m)      20.0      18.2       10%              54.7
                                                      a review of its funding structure for the next
    Metlifecare operates. These increases drove
                                                      phase of accelerated growth, resulting in the                                                                  Dividend (cps)                3.75      3.25       15%             10.00
    a 21% lift in realised resales gains to $32.1
                                                      company’s bank debt facility being increased
    million.                                                                                                                                                        Total assets ($b)              3.42      3.09        11%             3.29
                                                      to $450 million. A retail bond issue is also
    Sales of new homes completed late in FY18         being explored with the purpose of replacing                                                       Fair value movement during period ($m)    29.6      59.8       -51%             135.3
    were pleasing, with 56 new occupation             a portion of the bank debt to provide diversity
                                                                                                                                                                    Total equity ($b)              1.49       1.41       5%              1.48
    right agreements settled during the period;       of funding and tenor, subject to market
    70% higher than last year. An additional          conditions.                                                                                                    Net debt ($m)                 254.8     141.4      80%             140.8

                                                                                                                                                                   Debt equity ratio               15%        9%        6ppts             9%
               Development Margin                                           Realised Resale Gain
                                                                                                                                                            Net tangible assets per share ($)      6.97      6.63        5%              6.93
              $m          %                                             Realised Resale Gain         Gain per Settlement

                                                            35                                                              200
                                                                                                                                                            Embedded value per unit ($000)          279       277        1%               281
                                      29.9%                                                                          189
                                                            30                                           177

                                                                                                                                  $000 per Setttlement
                                              23.0%         25                                 151                          150
      20.8%
                                                            20                  111
                              16.9%
                                                       $m

                                                                                                                     32.1   100
                                                            15                                          26.5
                   11.8%                                         74                        24.4
                                               9.3          10                 21.6
                                                                                                                            50
                                                                                                                                                                                                                                Artist’s impression
                                                                 14.1
       3.4          7.1        9.6    6.2                    5
                                                                                                                                                                                                                                Edgewater Village
                                                            0                                                               0
       1H15        1H16       1H17    1H18    1H19               1H15          1H16        1H17         1H18        1H19

    50 homes were under contract at balance           DIVIDEND
    date. The average selling price increased         Consistent with Metlifecare’s commitment to
    by 11% to $723,000, generating an average         pay out 30% to 50% of underlying operating
    development margin of 23%. The total              cash flows, the Board has declared an interim
    realised development margin was $9.3 million,     dividend of 3.75 cents per share for the six-
    50% higher than last year.                        month period ended 31 December 2018. The
                                                      dividend is unimputed and will be paid on 22
    Metlifecare’s balance sheet continues to be
                                                      March 2019, with a record date of 15 March
    one of its key strengths. In the period under
                                                      2019.
    review, more than $140 million was invested
    in land purchases, village development and
    reinvestment projects, and care homes from
    borrowings and operating cash. Net debt at

8                                                                                                                                                                                                                                                     9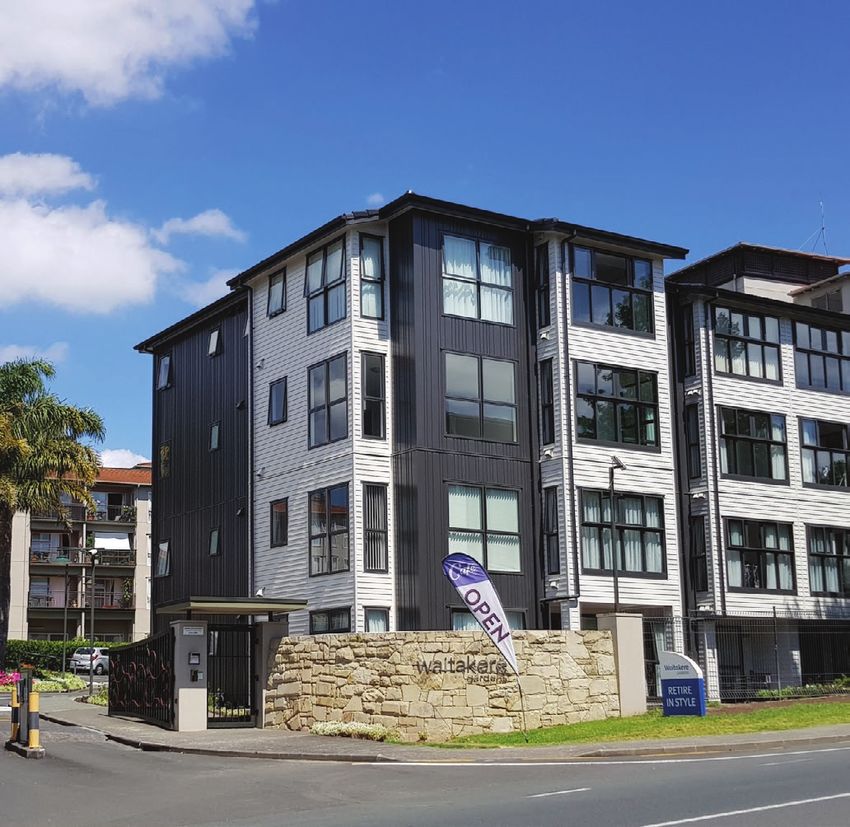
PERFORMANCE AND STRATEGY REVIEW CONTINUED

     ACCELERATED

     GROWTH
     DEVELOPMENT
     MOMENTUM CONTINUES
     FY19 PROGRAMME ON TRACK                          personalisation and socialisation for our
                                                      residents.
     Metlifecare’s development programme is on
     track to deliver the target of 215 new homes     FUTURE TARGETED GROWTH
                                                                                                           Development of
     and care beds for the full financial year.
                                                      Metlifecare’s development programme
                                                                                                           our new village
     While the programme is heavily weighted
     to the second half, the first six months saw
                                                      will continue in the FY20 year, with the             at Beachlands
                                                      planned opening of the first stages at
     the completion of Pinesong Village’s new
     care home, where 20 care suites and care
                                                      the new Beachlands and Orion Point                    is under way
                                                      (Hobsonville) villages; new stages at
     apartments now provide hospital and rest
                                                      Greenwich Gardens; apartments, village
     home level care, as well as nine new villas at
                                                      amenities and a care home at Gulf Rise;
     Papamoa Beach Village.
                                                      and the village regeneration project at
     The remainder of the year’s construction         Edgewater Village which will ultimately
     programme includes the Puriri and Manuka         include new apartments, village amenities
     buildings at Greenwich Gardens; new villas       and a care home.
     at Papamoa Beach and Crestwood villages;
                                                      The pace of development will be flexible,
     new care homes at Papamoa Beach
                                                      ensuring delivery can be adapted to
     Village and The Avenues; and 55 villas and
                                                      match changing market conditions.
     apartments at Metlifecare’s new Gulf Rise
     village, on Auckland’s Hibiscus Coast.
                                                      EXPANSION OF BOTANY VILLAGE
     We look forward to welcoming the first           The purchase of additional land from
     residents to Gulf Rise, our first ‘next-         the Pakuranga Golf Club in October 2018
     generation’ village. This village will           has enhanced Metlifecare’s development
     showcase an entirely new approach to             pipeline, increasing the total area for
     retirement living where village facilities       the future Botany village by more than
     connect with the local neighbourhood             40% and providing greater golf course
     and integrate our residents within their         frontage and views for the village. The
     community.                                       highly desirable and tranquil site in the   ENGAGING WITH THE BEACHLANDS COMMUNITY
     A further milestone will be the opening of       heart of East Auckland will now deliver
                                                                                                  Proactive community engagement and consultation has been an important feature of our design
     Metlifecare’s first dementia care centre         around 200 independent living villas and
                                                                                                  and consenting process, including a series of neighbourhood meetings to invite input from local
     at Papamoa Beach Village, featuring              apartments and a 40-bed homestead-          residents. This feedback has been incorporated into aspects of our design and planning and will
     our existing award-winning ‘homestead’           style care home.                            ensure that the new village becomes a welcome addition to the Pohutukawa Coast community.
     design which enables a greater level of

10                                                                                                                                                                                                  11
Rosecourt building at
     PERFORMANCE AND STRATEGY REVIEW CONTINUED
                                                                                                                  Waitakere Gardens

     COMMERCIAL                                                                      “The additional value...

     INTENSITY
                                                                                       is already evident in
                                                                                       projects such as the
                                                                                        recently upgraded
                                                                                      Rosecourt building at
     INTELLIGENT                                                                       Waitakere Gardens,
     VILLAGE                                                                         significantly enhancing
                                                                                     the village environment
     INVESTMENT                                                                       and its marketability.”
     Metlifecare’s strong resales            the village environment and its
     performance – in both sales             marketability. Other housing
     volumes and selling prices - reflects   upgrades are currently in various
     the high, ongoing demand for our        stages of implementation at our
     villages. Through careful, targeted     Coastal Villas, Dannemora Gardens,
     investment, we are ensuring they        Greenwood Park and Pinesong
     remain competitive and relevant         villages.
     for our residents’ future needs and
                                             Minimising disruption to residents
     expectations.
                                             remains a priority for this
                                             programme. We are pleased that
     ADDING VALUE
                                             we have been able to ensure all
     Metlifecare’s village remediation
                                             villages remain fully functional
     and regeneration programme, in
                                             and that residents can remain
     which several villages are being
                                             living within their own village while
     modernised and future-proofed,
                                             renovations are under way.
     remains on track for completion
     by mid-2023. The $62 million            UPGRADING AMENITIES
     total investment, which includes
                                             The FY19 programme also includes
     the advancement of planned
                                             the upgrade of several village
     preventative maintenance and
                                             communal amenities. Residents
     significant betterment, is already
                                             recently celebrated the newly
     reflected in Metlifecare’s CBRE
                                             renovated café and bar areas at our
     valuation, and represents 4% of
                                             Hibiscus Coast and Kapiti Villages,
     Metlifecare’s net assets or 29 cents
                                             which will provide increased
     per share.
                                             opportunities for village and family
     The additional value being created      events as well as significantly
     through this programme is already       enhancing the look and desirability
     evident in projects such as the         of these villages.
     recently upgraded Rosecourt
     building at Waitakere Gardens,
     which has significantly enhanced

12                                                                                                                                      13
PERFORMANCE AND STRATEGY REVIEW CONTINUED

     CUSTOMER

     EXPERIENCE
     ENHANCING VILLAGE LIFE
     CARE GOING FROM STRENGTH TO                        as best in class at the New Zealand Aged Care
     STRENGTH                                           Association Awards in September 2018 when
     The high quality of Metlifecare’s living           it received the Jackson Van Interiors Built
     environments, resident experience and care is      and Grown Environment award, as well as
     ensuring continued high levels of occupancy        achieving four years’ certification at its first full
     of 97% for our villages and 95% in our care        audit after opening. Greenwich Gardens has
     homes.                                             become the exemplar for all our future care
                                                        homes, which will adopt the same model of
     Metlifecare’s care expansion continues at
                                                        care.
     pace with the opening of our new Pinesong
     care home in July 2018, and another two            AN HOLISTIC APPROACH TO WELLBEING
     new care homes at Papamoa Beach and
                                                        In September 2018 Metlifecare was proud
     The Avenues, Tauranga scheduled to open
     in August 2019. Our excellent quality of care
                                                        to launch phase one of a new wellbeing                            BUCK’S BACK!
                                                        programme, ‘Your Best You’ at Greenwich
     is highlighted through external audits - all                                                                  ‘Your Best You’ came alive
                                                        Gardens village, led by our Wellness
     our established care homes have three or
                                                        Ambassador Wayne ‘Buck’ Shelford. The                     at Greenwich Gardens, with
     four-year Ministry of Health certification, with
     around two-thirds having received the gold-
                                                        programme is a joint initiative between                   our Wellness Ambassador,
                                                        Metlifecare and AUT (Auckland University of
     standard four-year certification.
                                                        Technology) which aims to boost physical,
                                                                                                                    legendary All Black Buck
     Premium care revenue showed a significant          social and cognitive wellbeing.                          Shelford being put through his
     increase on last year as new residents and
                                                        ‘Your Best You’ incorporates six dimensions               paces. Developed with AUT,
     their families recognised the benefits of
     Metlifecare’s resident-directed care approach,
                                                        of wellbeing - physical, social, emotional,                 the programme embodies
                                                        vocational, intellectual and spiritual.
     which empowers residents to live the way                                                                   Metlifecare’s commitment to our
                                                        Consistent with Metlifecare’s resident-led
     they want, in a home-like, non-institutional
                                                        approach, the innovative programme is                          residents’ wellbeing.
     environment. Existing and prospective village
                                                        designed to be tailored to the unique needs
     residents also appreciate the flexibility of
                                                        of each village and its residents. Metlifecare
     choice we offer with different care homes
                                                        is applying the learnings from phase one to
     available across our network, providing
                                                        further refine the programme for a company-
     options at the time they may need care.
                                                        wide launch, planned for later in 2019.
     Metlifecare’s innovative homestead-style care
     home at Greenwich Gardens was recognised

14                                                                                                                                                15
Note: Models used to protect residents’ privacy
     PERFORMANCE AND STRATEGY REVIEW CONTINUED

     PEOPLE                                     OUTLOOK
     We acknowledge and thank the entire        Metlifecare is well positioned for a
     team at Metlifecare for the way they       solid second half performance, with
     bring to life our values of respect,       selling prices continuing to show
     passion, teamwork and integrity, and       growth, and ongoing high levels
     enhance the quality of our residents’      of occupancy and demand in our
     lives on a daily basis.                    villages and care homes. In keeping
                                                with the trend of previous years,
     The benefits of Metlifecare’s industry-
                                                volumes for sales of existing and new
     leading investment in its people are
                                                homes are expected to be slightly
     increasingly evident. With village
                                                weighted to the second half reflecting
     and care staff having the opportunity
                                                market seasonality.
     to participate in our learning and
     development programmes, we are             Our flexible growth strategy is well
     seeing increased skill levels, enhanced    on track, with planning under way
     outcomes for our residents, and            for the next phase of accelerated
     importantly, staff are appropriately       development in FY20. This growth
     rewarded for qualifications gained.        will continue to be supported by our
     Staff retention continues to improve,      strong balance sheet, with low gearing
     and we are attracting high calibre         and attractive options in front of us to
     people whose values align with ours.       ensure an optimal funding structure.

     The company’s health and safety            We will continue to invest in care,
     performance also continues to              resident programmes and the
     improve, with a strong health and          betterment of our housing and
     safety culture embedded within             amenities to ensure the quality of
     the organisation and its contractor        our villages continues to delight our
     partners. During the period,               existing residents and attract new
     Metlifecare reported its lowest            residents.
     annual total ACC claims in five years
     (for the 2018 levy year) and has                                                                              “We have watched
     adopted the Accredited Employer                                                                             your new pod concept
     programme which, in the event of
                                                                                                                     become a huge
     injury, will enable better support and                                                 “How can I thank
                                                                                                                 success. Coming from
     management of injured staff.                                                            the staff enough
                                                Kim Ellis                                                        a different care home,
     We are excited to be launching a new       Chair                                        for their upmost
     staff wellbeing programme at the                                                                              the difference was
                                                                                               compassion,
     same time as we introduce ‘Your Best                                                                             phenomenal”
     You’ at our villages, giving everyone at
                                                                                           understanding and
                                                                                                                  Family member of Care resident,
     Metlifecare the opportunity to be at                                                     care for Mum”             Greenwich Gardens
     their best through the dimensions of
                                                Glen Sowry
     wellbeing.                                 CEO

16                                                                                                                                                                17
Crestwood Village

         INTERIM
     GROUP FINANCIAL
       STATEMENTS
     FOR THE HALF YEAR ENDED
         31 DECEMBER 2018

18                                            19
Consolidated Statement of Comprehensive Income Consolidated Statement of Movements in Equity
Consolidated Statement of Comprehensive Income Consolidated Statement of Movements in Equity
For the half year ended 31 December 2018 For the half year ended 31 December 2018
For the half year ended 31 December 2018 For the half year ended 31 December 2018
Half year ended Half year ended Employee
31 December 31 December Share
Contributed Retained Hedging Revaluation Scheme Total
2018 2017 *
$000 Equity Earnings Reserve Reserve Reserve Equity
$000 Note Unaudited Unaudited
Half year ended 31 December 2017
Income Balance at 1 July 2017 (audited) 306,895 1,055,906 - 7,009 378 1,370,188
Operating revenue 2.1 61,942 56,476 Changes in accounting policies * - 87 - - - 87
Other income 6.2 6,500 - Restated balance at 1 July 2017 306,895 1,055,993 - 7,009 378 1,370,275
Interest income 132 83
Comprehensive income
Total income 68,574 56,559 Profit for the period * - 56,343 - - - 56,343
Change in fair value of investment properties 3.1 29,579 59,775 Other comprehensive loss - - - - - -
Total comprehensive income - 56,343 - - - 56,343
Share of (loss)/profit arising from joint venture, net of tax (459) 783
Employee share scheme - - - - 57 57
Expenses Transfer from employee share
66 - - - (66) -
Employee costs (26,500) (23,840) scheme reserve on vesting
Property costs 2.2 (14,732) (12,532) Dividends paid to shareholders - (12,354) - - - (12,354)
Other expenses 2.2 (14,960) (12,865) Balance at 31 December 2017 (unaudited) 306,961 1,099,982 - 7,009 369 1,414,321
Residents’ share of capital gains (1,576) (2,454)
Depreciation and impairment 2.2 (9,933) (1,930) Half year ended 31 December 2018
Amortisation (319) (315) Balance at 1 July 2018 (audited) 307,024 1,162,055 (313) 7,050 459 1,476,275
Finance costs (1,314) (120) Changes in accounting policies * - 148 - - - 148
Restated balance at 1 July 2018 307,024 1,162,203 (313) 7,050 459 1,476,423
Total expenses (69,334) (54,056)
Profit before income tax 28,360 63,061 Comprehensive income / (loss)
Income tax expense (3,909) (6,718) Profit for the period - 24,451 - - - 24,451
Profit for the period 24,451 56,343 Other comprehensive loss - - (266) - - (266)
Total comprehensive income / (loss) - 24,451 (266) - - 24,185
Other comprehensive income Employee share scheme - - - - 189 189
Items that may be reclassified subsequently to profit or loss: Transfer from employee share
113 - - - (113) -
Loss on cash flow hedges (266) - scheme reserve on vesting
Other comprehensive loss, net of tax (266) - Dividends paid to shareholders - (14,386) - - - (14,386)
Total comprehensive income 24,185 56,343 Balance at 31 December 2018 (unaudited) 307,137 1,172,268 (579) 7,050 535 1,486,411
* See note 5 for details about restatements for changes in accounting policies.
Profit attributable to shareholders of the parent company 24,451 56,343 The above consolidated statement of movements in equity should be read in conjunction with the accompanying notes.
Total comprehensive income attributable to shareholders of the
24,185 56,343
parent company
Profit per share for profit attributable to the equity holders of the
company during the period
Basic (cents) 11.5 26.5
Diluted (cents) 11.5 26.4
* See note 5 for details about restatements for changes in accounting policies.
The above consolidated statement of comprehensive income should be read in conjunction with the accompanying notes.
3
4
20 21Consolidated Balance Sheet
Consolidated
As at 31 DecemberBalance
2018 Sheet Consolidated Cash
Consolidated Cash Flow Flow Statement
Statement
As at 31 December 2018 For thehalf
For the half
yearyear
endedended 31 December
31 December 2018 2018
Half year ended Half year ended
31 December 30 June 31 December
31 December 31 December
2018 2018 * 2017 * 2018 2017 *
$000 Note Unaudited Audited Unaudited $000 Unaudited Unaudited
Cash flows from operating activities
Assets
Receipts from residents for management fees, village and care fees 50,046 43,854
Cash and cash equivalents 2,357 16,298 2,768 Receipts from residents for sale of new refundable occupation right agreements 37,376 20,273
Receipts from residents for resale of refundable occupation right agreements 100,952 80,690
Trade receivables and other assets 31,540 20,870 10,357
Payments to residents for refundable occupation right agreements (79,248) (54,211)
Property, plant and equipment 50,497 54,769 54,677 Payments to suppliers and employees (59,814) (53,060)
Intangible assets 1,189 1,206 1,252 Net GST received 497 970
Investment properties 3.1 3,320,140 3,190,840 3,007,323 Interest received 83 31
Investment in joint venture 10,396 10,929 9,981 Interest paid (1,522) (122)
Total assets 3,416,119 3,294,912 3,086,358 Net buyback costs for off-market units associated with regeneration and
(977) (11,093)
remediation
Liabilities Net cash inflow from operating activities 47,393 27,332
Cash flows from investing activities
Trade and other payables 31,984 72,034 26,523 Net advances to joint venture (508) (136)
Derivative financial instruments 805 434 - Dividends received from joint venture - 625
Interest bearing liabilities 4.2 256,567 156,787 143,884 Payments for property, plant and equipment (4,703) (5,981)
Deferred management fees 121,875 116,953 111,349 Payments for intangibles (302) (110)
Payments for investment properties (138,243) (75,612)
Refundable occupation right agreements 1,397,507 1,355,108 1,280,934
Capitalised interest paid (3,296) (2,398)
Deferred tax liability 120,970 117,173 109,347
Net cash outflow from investing activities (147,052) (83,612)
Total liabilities 1,929,708 1,818,489 1,672,037
Cash flows from financing activities
Dividends paid (14,386) (12,354)
Net assets 1,486,411 1,476,423 1,414,321 Net proceeds from borrowings 100,293 68,639
Principal payments of lease liabilities (189) (170)
Equity Net cash inflow from financing activities 85,718 56,115
Contributed equity 4.1 307,137 307,024 306,961 Net decrease in cash and cash equivalents (13,941) (165)
Reserves 7,006 7,196 7,378 Cash and cash equivalents at the beginning of the period 16,298 2,933
Retained earnings 1,172,268 1,162,203 1,099,982 Cash and cash equivalents at the end of the period 2,357 2,768
Total equity 1,486,411 1,476,423 1,414,321
Reconciliation of Profit after Tax with Cash Inflow from Operating Activities
* See note 5 for details about restatements for changes in accounting policies. $000
Profit after tax 24,451 56,343
Adjustments for:
Change in fair value of investment properties (29,579) (59,775)
The Interim Group Financial Statements presented are signed for and on behalf of Metlifecare Limited Change in the fair value of residents' share of capital gains 1,576 2,454
and were authorised for issue on 25 February 2019. Employee share scheme 189 57
Depreciation and impairment 9,933 1,930
Amortisation 319 315
Deferred tax expense 3,892 6,707
Loss on disposal of property, plant and equipment 23 5
Share of loss/(profit) arising from joint venture, net of tax 459 (783)
Changes in working capital relating to operating activities:
Trade receivables and other assets (5,969) (731)
Trade and other payables (3,639) (2,650)
K. R. Ellis A. B. Ryan Deferred management fees 4,915 5,167
Chair Director Refundable occupation right agreements 40,823 18,293
25 February 2019 25 February 2019 Net cash inflow from operating activities 47,393 27,332
* See note 5 for details about restatements for changes in accounting policies.
The above consolidated cash flow statement should be read in conjunction with the accompanying notes.
The above consolidated balance sheet should be read in conjunction with the accompanying notes.
5
6
22 23Notes to
Notes tothe
theInterim Group
Interim Financial
Group Statements
Financial Statements Notes to
Notes tothe
theInterim Group
Interim Financial
Group Statements
Financial Statements
1 GENERAL INFORMATION 1 GENERAL INFORMATION (continued)
1.1 Reporting entity 1.4 New Accounting Standards
Metlifecare Limited ("the Company") and its subsidiaries (together "the Group") own and operate retirement The Group adopted all mandatory new and amended NZ IFRS Standards and Interpretations during the period
villages in New Zealand. Metlifecare Limited is a limited liability company, incorporated and domiciled in New including NZ IFRS 9 Financial Instruments and NZ IFRS 15 Revenue from Contracts with Customers, with no
Zealand. The address of its registered office is Level 4, 20 Kent Street, Newmarket, Auckland 1023. The material impact on the accounting policies or disclosures of the Group. The Group elected to early adopt NZ
interim group financial statements are for the consolidated group comprising Metlifecare Limited and its IFRS 16 Leases from 1 July 2018. The impact of the changes in accounting policies on adoption of this new
subsidiaries (together "the Group"). standard is summarised in note 5.
The Group is designated as a 'for profit' entity for financial reporting purposes.
NZ IFRS 9 Financial Instruments replaces the guidance in NZ IAS 39 for the recognition, classification and
These financial statements have been approved for issue by the Board of Directors on 25 February 2019. measurement of financial assets and financial liabilities, derecognition of financial instruments, impairment of
1.2 Going concern financial assets and hedge accounting.
In approving these interim group financial statements for issue the directors have considered and concluded NZ IFRS 9 establishes three primary measurement categories for financial assets: amortised cost, fair value
that in the absence of any unanticipated deterioration of the Group's operating performance the Group will through other comprehensive income and fair value through profit or loss. The basis of classification depends
continue to meet all obligations under the funding facilities, including compliance with financial covenants and on the entity's business model and the contractual cash flow characteristics of the financial asset. Trade and
maintaining sufficient levels of liquidity. On this basis, the directors believe it remains appropriate that the other receivables, and cash and cash equivalents that were previously classified as loans and other receivables
interim group financial statements have been prepared under the going concern convention. under NZ IAS 39 are now classified at amortised cost.
1.3 Basis of preparation Impairment of financial assets is assessed based on the expected credit loss model under NZ IFRS 9. The Group
Metlifecare Limited is a company registered under the Companies Act 1993 and is a FMC Reporting Entity in has applied the simplified approach permitted under NZ IFRS 9, which requires expected lifetime losses to be
terms of Part 7 of the Financial Markets Conduct Act 2013. The Company is also listed on the NZX Main Board recognised from initial recognition of trade receivables. Expected lifetime losses have been measured by
(NZX) and the Australian Securities Exchange (ASX) as a Foreign Exempt Listing. The interim group financial reviewing trade receivables based on type of debtor and days since resident departure. Application of the new
statements have been prepared in accordance with the requirements of the NZX listing rules and where impairment model has not had a material impact on the carrying value of expected credit losses and no
required, the ASX listing rules. adjustments have been made to the opening impairment provision balance.
These interim group financial statements for the half year reporting period ended 31 December 2018 have The hedge accounting requirements of NZ IAS 39 will continue to be applied to existing derivative financial
been prepared in accordance with New Zealand Generally Accepted Accounting Practice (NZ GAAP). They instruments in designated hedging relationships on transition.
comply with New Zealand Equivalent to International Accounting Standard 34 and International Accounting NZ IFRS 15 Revenue from Contracts with Customers requires revenue recognition that depicts the transfer of
Standard 34 Interim Financial Reporting. promised goods or services to customers in an amount that reflects the consideration to which the entity
The interim group financial statements do not include all the notes of the type normally included in the annual expects to be entitled to, in exchange for those goods or services.
financial statements. Accordingly, these interim group financial statements are to be read in conjunction with Adoption of NZ IFRS 15 has not had a material impact on the recognition or measurement of revenue by the
the annual financial statements for the year ended 30 June 2018, prepared in accordance with New Zealand Group. Rest home, hospital and service fees, and village fees will continue to be recognised on an accrual basis
Equivalents to International Financial Reporting Standards and International Financial Reporting Standards. at the point in time the goods or services are provided.
The interim group financial statements for the six months ended 31 December 2018 and comparatives for the The following is noted in relation to the main revenue streams:
six months ended 31 December 2017 are unaudited. The interim group financial statements are presented in - Rest home, hospital and service fee charges are governed by care admission agreements between
New Zealand Dollars ($), which is the Group's functional and presentation currency. All financial information individual care residents and Metlifecare. Fees are charged based on a daily rate, which reflects the point
has been presented in thousands, unless stated otherwise. in time the goods or services are provided to the care resident;
- Village fees are detailed within each village resident’s occupation right agreement and relate to the
The consolidated balance sheet for the Group is presented on the liquidity basis where the assets and
operating costs of the village. Fees are charged on a weekly basis reflecting the period a resident has
liabilities are presented in the order of their liquidity.
occupied a unit or serviced apartment.
Where necessary, certain comparative information has been reclassified in order to conform to changes in
presentation in the current period.
2 OPERATING PERFORMANCE
All accounting policies that materially affect the measurement of the consolidated statement of
comprehensive income, the consolidated balance sheet and the consolidated cash flow statement have been 2.1 Operating Revenue
applied on a basis consistent with those used in the audited financial statements for the year ended 30 June Half year ended Half year ended
2018, except for the adoption of new and amended standards as summarised in note 5. 31 December 31 December
2018 2017
$000 Unaudited Unaudited
Management fees 27,036 25,705
Rest home, hospital and service fees and village fees 32,946 29,153
Other operating revenue 1,960 1,618
61,942 56,476
7 8
24 25Notes totothe
Notes Interim
the Group
Interim Financial
Group Statements
Financial Statements Notes totothe
Notes Interim
the Group
Interim Financial
Group Statements
Financial Statements
2 OPERATING PERFORMANCE (continued) 2 OPERATING PERFORMANCE (continued)
2.2 Expenses 2.3 Underlying Profit before taxation
Half year ended Half year ended Half year ended Half year ended
31 December 31 December 31 December 31 December
2018 2017 2018 2017
$000 Unaudited Unaudited $000 Unaudited Unaudited
Profit before income tax includes the following expenses: Profit for the period 24,451 56,343
Less non-recurring items:
Property costs Other income - settlement receivable (6,500) -
Utilities and other property costs 6,393 6,093 Profit for the period excluding non-recurring items 17,951 56,343
Repairs and maintenance on investment properties 7,778 5,988 Less:
Repairs and maintenance on property, plant, furniture and equipment 561 451 Change in fair value of investment properties (29,579) (59,775)
Total property costs 14,732 12,532 Add:
Impairment of property, plant and equipment 7,986 209
Depreciation and impairment
Realised resale gains 32,147 26,479
Depreciation expense 1,947 1,721
Realised development margin 9,252 6,180
Impairment of care homes
Tax expense 3,909 6,718
The Avenues 4,702 209
Underlying Profit before taxation 41,666 36,154
Papamoa Beach 3,284 -
Total depreciation and impairment 9,933 1,930 Underlying Profit before taxation, is a non-GAAP financial measure. Retirement village operators may present
Underlying Profit as an alternative profit measure to assist with measuring operating and development
Other expenses
performance. As this is a non-GAAP financial measure, there are likely to be inconsistencies in the calculation
Resident costs 3,415 3,248
of this alternative performance measure with other retirement village operators.
Marketing and promotion 3,840 2,653
Other employment costs 1,644 1,484 Underlying Profit before taxation, calculated consistently year-on-year, is determined from the net profit
Communication costs 1,500 1,376 after tax of the Group adjusted for the impact of the following:
Other (no items of individual significance) 4,521 4,036 (a) Non-recurring items: those items that do not relate to the ordinary activities and are not expected to
recur with regularity.
Fees paid to PricewaterhouseCoopers New Zealand - Other income - settlement receivable: refer to note 6.2 for further details.
Review of interim group financial statements 40 40
(b) Change in fair value of investment properties: unrealised non-cash valuation changes (refer to note 3.1).
Debt and treasury advisory services 114 -
(c) Impairment of property, plant and equipment: impairment associated with care home valuation changes
Strategic procurement advisory services - 23
Tax compliance services - 5 are excluded as the Group is in the business of owning and operating care homes, not constructing the
Total fees paid to PricewaterhouseCoopers New Zealand 154 68 asset for resale (refer to note 2.2).
Debt and treasury advisory services costs capitalised (114) - (d) Realised resale gains: the realised increase in value from the resale of occupation right agreements
Total expensed fees for PricewaterhouseCoopers New Zealand 40 68 during the period. Realised resale gains are a measure of the cash generated from increases in selling
Total other expenses 14,960 12,865 prices of occupation right agreements to incoming residents, less cash amounts paid to vacated residents
for repayment of refundable occupation right agreements from the pre-existing portfolio recognised at
The Avenues and Papamoa Beach care homes are expected to complete in June 2019. Impairment losses the date of settlement. The reported measure allows for amounts payable to the vacated resident at
recognised in the period ended 31 December 2018 represent the impairment based on costs incurred to date balance date on units that have been resettled in the year.
and the expected valuation at completion. (e) Realised development margin: represents the development margins delivered from the first time sale of
A reduction in the value of land related to The Avenues care home resulted in an impairment loss of $0.2m in occupation right agreements. Realised development margin is the margin obtained on settlement from
the period ended 31 December 2017. the first time sale of an occupation right agreement following the development of the unit. The margin
calculation is based on the actual selling price of individual units settled during the period and includes
Other employment costs include staff related costs such as staff training, uniforms and commissions on sales. the following costs:
Other expenses include Directors' fees. During the period ended 31 December 2018, $378,000 of Directors' - directly attributable construction costs;
fees were paid (2017: $364,000). This includes the amount of any GST incurred that is not recoverable from - a prorata apportionment of land on the basis of the historical cost or purchase price of the land;
- a prorata share of infrastructure costs specific to a stage;
the taxation authority.
- non-recoverable GST; and
- capitalised interest to the date of completion on costs attributed to the unit.
Margins are calculated based on when a stage is completed.
Construction costs, land and infrastructure, non-recoverable GST and capitalised interest associated with
common areas (including management offices), amenities and any care homes are excluded from the
costs above when the development margin is calculated.
(f) Tax expense: the impact of current and deferred taxation is removed.
9 10
26 27Notes to
Notes tothe
theInterim Group
Interim Financial
Group Statements
Financial Statements Notes to
Notes tothe
theInterim Group
Interim Financial
Group Statements
Financial Statements
3 INVESTMENT PROPERTY AND OTHER ASSETS 3 INVESTMENT PROPERTY AND OTHER ASSETS (continued)
3.1 Investment Properties 3.1 Investment Properties (continued)
Half year ended Year ended Half year ended Development land
31 December 30 June 31 December Development land is comprised of a standalone title and/or part of the principal site. Where the development
2018 2018 2017 land is a standalone title, CBRE has ascribed a value which can be captured independently, if desired, from the
$000 Unaudited Audited Unaudited overall village. Where the development land is part of the principal site, CBRE has identified if there is
Opening balance 3,190,840 2,890,939 2,890,939 potential, be it planned or economic, to expand the village and has assessed a value accordingly. This latter
Capitalised subsequent expenditure 99,744 166,837 56,609 value, whilst identified as surplus land value, cannot be independently captured.
Investment properties under development transferred to As a general rule, CBRE has treated units in the early stages of construction, land with approvals and other
- (1,353) -
property, plant and equipment vacant land clearly identified for future development as land for development in its highest and best use.
Investment properties disposed of (23) (839) -
Change in fair value recognised during the period 29,579 135,256 59,775 Retirement villages under development measured at cost
Closing balance 3,320,140 3,190,840 3,007,323 Where the staged development still requires substantial work such that practical completion will not be
achieved at or close to balance date, or the fair value of investment properties under development cannot be
Investment properties are categorised as follows:
reliably determined at this point in time, it is carried at cost less any impairment. Impairment is determined
by considering the value of work in progress and management's estimate of the asset value on completion.
31 December 30 June 31 December
2018 2018 2017 Retirement villages measured at fair value
$000 Unaudited Audited Unaudited
To assess the market value of the Group's interest in a retirement village, CBRE has undertaken a cash flow
Development land measured at fair value 155,914 122,987 86,969 analysis to derive a net present value. As the fair value of investment properties is determined using inputs
Retirement villages under development measured at cost 80,120 36,551 74,450 that are significant and unobservable, the Group has categorised investment properties as Level 3 under the
Retirement villages measured at fair value 3,084,106 3,031,302 2,845,904 fair value hierarchy in accordance with NZ IFRS 13 Fair Value Measurement. The following significant
Total investment properties 3,320,140 3,190,840 3,007,323 assumptions have been used to determine the fair value:
Investment properties 31 December 30 June 31 December
Investment properties include completed freehold land and buildings, freehold development land and Unobservable Input 2018 2018 2017
buildings under development comprising independent living units and apartments, serviced apartments and
Nominal growth rate - anticipated annual property price
common facilities, provided for use by residents under the terms of the occupation right agreement. 0% - 3.5% 0% - 3.5% 0% - 3.5%
growth over the cash flow period 0 - 5 years
Investment properties are held for long-term yields.
Nominal compound growth rate - anticipated annual
Valuation processes 2.6% - 3.1% 2.6% - 3.1% 2.6% - 3.1%
property price growth over the cash flow period > 5 years
CBRE Limited (CBRE) undertook the valuation of investment properties for all the reporting periods presented. Pre-tax discount rate 12.5% - 15.0% 12.5% - 15.0% 12.5% - 15.5%
CBRE's principal valuer, Michael Gunn, is an independent registered valuer and associate of the New Zealand
The occupancy period is a significant component of the CBRE valuation and is driven from a Monte Carlo
Institute of Valuers and is appropriately qualified and experienced in valuing retirement village properties in
simulation. The simulations are dependent on the demographic profile of the village (age and gender of
New Zealand. The Group verifies all major inputs to the independent valuation reports. The fair value as
residents) and the reason for departing a unit. The resulting stabilised departing occupancy period is an
determined by CBRE is adjusted for assets and liabilities already recognised in the balance sheet which are
estimate of the long run occupancy term for residents. An increase in the stabilised departing occupancy
also reflected in the discounted cash flow model.
period will have a negative impact on the valuation and a decrease in the stabilised departing occupancy will
The movement in the carrying value of investment properties, net of disposals and additions to investment
have a positive impact on the valuation.
properties is recognised as a fair value movement in the statement of comprehensive income.
CBRE performed a "roll forward" of the valuation that was completed at 30 June 2018 for the period from 1 The valuation calculates the expected cash flows for a 20 year period with stabilised departing occupancy set
July 2018 to 31 December 2018. This involved the Group confirming the movements in the sales, resales and out below.
repurchases of occupation right agreements during the period, an assessment by the valuer of the general
31 December 30 June 31 December
market conditions and the provisions of the impact of the changes where appropriate on the completed value
Stabilised departing occupancy - years 2018 2018 2017
of investment properties. The "roll forward" provides an assessment by the valuer of the financial impact of
the changes for the six month period since the most recent full valuation. CBRE will perform a full valuation as Serviced apartments 3.8 - 4.9 4.0 - 4.9 3.8 - 4.7
at 30 June 2019. Independent living units and apartments 6.4 - 8.9 6.7 - 9.0 6.7 - 8.8
11 12
28 29Notes to
Notes tothe
theInterim Group
Interim Financial
Group Statements
Financial Statements Notes to
Notes tothe
theInterim Group
Interim Financial
Group Statements
Financial Statements
3 INVESTMENT PROPERTY AND OTHER ASSETS (continued) 4 SHAREHOLDERS' EQUITY AND FUNDING
3.1 Investment Properties (continued) 4.1 Contributed Equity
The CBRE valuation also includes within the forecast cash flows the Group's expected costs relating to any Half year ended Year ended Half year ended
known or anticipated remediation works. The estimate of the gross cash flows included for remediation works 31 December 30 June 31 December
is $47.3m over a five year period (30 June 2018: $44.1m over a five year period; 31 December 2017: $47.4m 2018 2018 2017
over a six year period). The increase in the allowance for remediation works reflects further investigative work Shares Unaudited Audited Unaudited
conducted over the period across the portfolio and updated estimates of the remaining cost of the required Issued and fully paid up capital
works. The estimates are based on currently available information.
Balance at beginning of the period 213,132,290 213,005,909 213,005,909
Shares issued net of transactions costs 172,432 126,381 126,381
CBRE has also included within its forecast cash flows the Group's expected costs associated with seismic
Balance at end of period 213,304,722 213,132,290 213,132,290
strengthening works of $1.4m (30 June 2018: $1.4m; 31 December 2017: $1.4m).
Other relevant information All ordinary shares are authorised and rank equally with one vote attached to each fully paid ordinary
share. The shares have no par value.
The valuation of investment properties is adjusted for cash flows relating to refundable occupation right
Treasury shares at 31 December 2018 of 522,928 (30 June 2018: 397,028; 31 December 2017: 420,401)
agreements, residents' share of capital gains, deferred management fees and management fees receivable
relate to shares issued under the senior executive share plan that are held on trust by the Group. These
which are already recognised separately on the balance sheet and also reflected in the cash flow model. A
shares are accounted for as treasury shares by the Group until such time as they are cancelled or vest to
reconciliation between the valuation amount and the amount recognised on the balance sheet as investment
members of the senior executive team.
properties is as follows:
Half year ended Year ended Half year ended
31 December 30 June 31 December 31 December 30 June 31 December
2018 2018 2017 2018 2018 2017
$000 Unaudited Audited Unaudited $000 Unaudited Audited Unaudited
Development land measured at fair value 155,914 122,987 86,969 Issued and fully paid up capital
Retirement villages under development measured at cost 80,120 36,551 74,450
Retirement villages measured at fair value 1,556,450 1,447,356 Balance at beginning of the period 307,024 306,895 306,895
1,553,533
Shares issued 113 129 66
Investment properties at valuation 1,789,567 1,715,988 1,608,775
Balance at end of period 307,137 307,024 306,961
Plus: Refundable occupation right agreements 1,779,037 1,713,214 1,617,846
Plus: Residents' share of capital gains 35,163 35,465 34,722 31 December 30 June 31 December
Plus: Deferred management fees 121,875 116,953 111,349 2018 2018 2017
Less: Management fees receivable (397,797) (381,408) (361,859) Net tangible assets per share Unaudited Audited Unaudited
Less: Occupation right agreement receivables (7,705) (9,372) (3,510) Net tangible assets per share (basic) $6.97 $6.93 $6.63
Total investment properties 3,320,140 3,190,840 3,007,323
Borrowing costs of $3.3m (30 June 2018: $5.5m; 31 December 2017: $2.2m) arising from financing specifically 4.2 Interest Bearing Liabilities
entered into for the construction of investment properties under development were capitalised during the
31 December 30 June 31 December
year. Average capitalisation rates of 3.57% pa (30 June 2018: 3.55% pa; 31 December 2017: 3.50% pa) were
2018 2018 2017
used, representing the borrowing costs of the loans used to finance the projects.
$000 Unaudited Audited Unaudited
Bank loans 254,961 154,668 141,541
Capitalised debt costs (632) (308) (317)
254,329 154,360 141,224
Lease Liability 2,238 2,427 2,660
Total interest bearing liabilities 256,567 156,787 143,884
The bank loans comprise the Core Revolving Credit Facility, Development Facility and Working Capital
Facility, effective 8 March 2012 as amended from time to time as detailed below.
13 14
30 31Notes to
Notes tothe
theInterim Group
Interim Financial
Group Statements
Financial Statements Notes to
Notes tothe
theInterim Group
Interim Financial
Group Statements
Financial Statements
4 SHAREHOLDERS' EQUITY AND FUNDING (continued) 5 CHANGES IN ACCOUNTING POLICIES (continued)
4.2 Interest Bearing Liabilities (continued) 5.1 NZ IFRS 16 Leases (continued)
On 20 December 2018 the bank facilities were renegotiated and extended. The maturities of the Core (b) Adjustments recognised on adoption of NZ IFRS 16
Revolving Credit Facility of $175m (30 June 2018: $175m; 31 December 2017: $175m) and the Development
Facility of $275m (30 June 2018: $175m; 31 December 2017: $175m) are detailed below. At 30 June 2018 and On adoption of NZ IFRS 16, the Group has recognised a right-of-use asset within property, plant and
31 December 2017, a Working Capital Facility of $2.0m was available, repayable on demand and undrawn. equipment and a corresponding lease liability within interest bearing liabilities in relation to leases which had
previously been classified as operating leases under the principles of NZ IAS 17 Leases, except where the
Proceeds from the sale of units that are funded from the Development Facility are required to be repaid
recognition exemptions were applied to short-term leases and leases of low-value assets. The liabilities were
against the Development Facility.
measured at the present value of the remaining lease payments, discounted at a rate of 7.5%. This is an
31 December 31 December 30 June 31 December estimated discount rate based on similar assets with similar tenure in proximity to the office premises. At 31
2018 2018 2018 2017 December 2018, a right-of-use asset of $1.9m and a corresponding lease liability of $2.2m has been
$000 Facility Limit Unaudited Audited Unaudited recognised.
175,000 Occupation right agreements confer the right to occupancy of a unit or serviced apartment and are
Core Facility 123,333 15,000 52,000
Development Facility 275,000 131,628 139,668 89,541 considered leases under NZ IFRS 16. On adoption of NZ IFRS 16, the Group has recognised an adjustment for
Total 450,000 254,961 154,668 141,541 recognition of management fees relating to transfers from an independent living unit or apartment to
another independent living unit or apartment or a serviced apartment, deferring the management fees
historically recognised into later periods. Management fee revenue will continue to be recognised on a
Contractual maturity and drawn amounts
83,333 straight-line basis in the statement of comprehensive income over the average expected length of stay of
Between one and two years 83,333 70,333 83,333
Between two and three years 141,667 141,667 61,333 56,208 residents. As a result, investment properties and deferred management fees have been impacted.
More than three years 225,000 29,961 23,002 2,000
1 July
Total 450,000 254,961 154,668 141,541
$000 2017
Operating lease commitments disclosed as at 30 June 2017 2,823
5 CHANGES IN ACCOUNTING POLICIES
5.1 NZ IFRS 16 Leases Discounted at the date of initial application 2,101
Add: finance lease liabilities recognised as at 30 June 2017 102
The Group has elected to early adopt NZ IFRS 16 Leases with a date of initial application of 1 July 2018. NZ Add: adjustment for lease variations 724
IFRS 16 has been adopted using the full retrospective approach, as permitted under the specific transition (Less): low-value and short-term leases recognised on a straight-line basis as expense (47)
provisions in the standard. Where presented in these interim group financial statements, comparatives for the Lease liability recognised as at 1 July 2017 2,880
year ended 30 June 2018 and 31 December 2017, and the opening balance sheet at 1 July 2017, have been
restated. The impact of the adoption of NZ IFRS 16 on the Group's consolidated balance sheet, consolidated statement
of comprehensive income and consolidated cash flow statement for those comparatives presented within the
(a) New accounting policy with effect from 1 July 2018 interim group financial statements, including the opening balance sheet at 1 July 2017, are presented below.
The following tables show the adjustments recognised for each individual line item. Line items that were not
The Group leases support office premises and various property, plant and equipment under non-cancellable
affected by the changes have not been included.
operating lease agreements. The leases reflect normal commercial arrangements with varying terms,
escalation clauses and renewal rights. Consolidated Balance Sheet
At the inception of a contract, the Group assesses whether a contract is, or contains, a lease. A contract is, or 30 June 31 December 1 July
contains, a lease if the contract conveys the right to control the use of an identified asset for a period of time $000 2018 2017 2017
in exchange for consideration.
Right-of-use assets are capitalised at the commencement date of the lease and comprise the initial lease Property, plant and equipment Increase 2,042 2,234 2,425
liability, plus any initial indirect costs incurred and restoration costs, less any lease incentives received. The Investment properties Increase 1,900 1,595 1,570
right-of-use asset is depreciated over the shorter of the asset's useful life and the lease term on a straight-line Total assets Increase 3,942 3,829 3,995
basis.
Lease liabilities are measured based on the present value of the fixed and variable lease payments, less any Interest bearing liabilities Increase 2,427 2,608 2,778
cash lease incentives receivable. Each lease payment is allocated between the liability and finance cost. The Deferred management fees Increase 1,900 1,595 1,570
finance cost is charged to profit or loss over the lease period so as to produce a constant rate of interest on Deferred tax liability Decrease 533 447 440
the remaining balance of the liability for each period. Total liabilities Increase 3,794 3,756 3,908
Payments associated with leases of low-value assets, and for leases with a lease term of 12 months or less are
recognised on a straight-line basis as an expense in profit or loss. Net assets Increase 148 73 87
Retained earnings Increase 148 73 87
Total equity Increase 148 73 87
15 16
32 33Notes to
Notes tothe
theInterim Group
Interim Financial
Group Statements
Financial Statements Notes to
Notes tothe
theInterim Group
Interim Financial
Group Statements
Financial Statements
5 CHANGES IN ACCOUNTING POLICIES (continued) 6 OTHER DISCLOSURES
(b) Adjustments recognised on adoption of NZ IFRS 16 (continued) 6.1 Segment information
Consolidated Statement of Comprehensive Income The Group operates in one operating segment being that of retirement villages. The chief operating decision
Half year ended maker, the Board of Directors, reviews the operating results on a regular basis and makes decisions on
31 December resource allocation based on the review of Group results and cash flows as a whole.
$000 2017 The nature of the products and services provided and the type and class of customers have similar
characteristics within the operating segment.
Operating revenue Increase 25
Total income Increase 25 Information about major customers
Included in total income are operating revenues derived from the New Zealand Government being the
Change in fair value of investment properties Decrease 25 Group's largest single source of income.
The Group derives care fee revenue in respect of eligible Government subsidised aged care residents who
Other expenses Decrease 272 receive rest home or hospital level care. Government aged care subsidies received from the Ministry of Health
Depreciation and impairment Increase 191 included in rest home, hospital and service fees, and villages fees amounted to $6.0m (31 December 2017:
Finance costs Increase 102 $4.7m). There are no other individually significant customers.
Total expenses Increase 21
6.2 Other Income - Settlement Receivable
Profit before income tax Decrease 21
Income tax expense Decrease 7 In December 2018 an agreement was reached for a settlement payment of $6.5m associated with building
Profit for the year Decrease 14 matters on certain buildings. The settlement amount of $6.5m was received in January 2019.
6.3 Contingencies
Total comprehensive income Decrease 14
Contingent liabilities
Profit per share for profit attributable to the equity There are no material contingent liabilities as at 31 December 2018 (30 June 2018: nil; 31 December 2017: nil).
holders
Dilutedof(cents)
the Decrease 0.1
6.4 Commitments
Consolidated Cash Flow Statement 31 December 30 June 31 December
Half year ended 2018 2018 2017
31 December $000 Unaudited Audited Unaudited
$000 2017 Capital commitments
Payments to suppliers and employees Decrease 272 Estimated commitments contracted for at balance date
Interest Paid Increase 102 but not provided for to purchase, construct or develop 90,357 81,732 31,361
investment properties
Net cash inflow from operating activities Decrease 170
90,357 81,732 31,361
Principal payments of lease liabilities Increase 170 6.5 Subsequent Events
Net cash inflow from financing activities Increase 170
On 25 February 2019, the directors approved an unimputed dividend of 3.75 cents per share amounting to
$8.0m. The dividend record date is 15 March 2019 with payment to be made on 22 March 2019.
6.6 Subsidiaries of the Group
On 7 December 2018, the following subsidiaries were amalgamated into Metlifecare Holdings Limited
(previously Vision Senior Living Limited), with no impact on the transactions or balances presented in the
interim group financial statements.
Bay of Plenty Retirement Village Limited Private Life Care Holdings Limited
Metlifecare Merivale Limited Provider Care NZ Limited
Metlifecare Oakwoods Limited Vision (Christchurch) Limited
Metlifecare Wairarapa Limited Vision Senior Living Investments Limited
17 18
34 35You can also read