Get Better Deals by Understanding the Negotiation Practices of Multinational Pharmaceutical Companies - Richard Brown
←
→
Page content transcription
If your browser does not render page correctly, please read the page content below
Get Better Deals by
       Understanding the Negotiation
         Practices of Multinational
        Pharmaceutical Companies

                      Richard Brown
        Consultant, Plexus Ventures LLC, and formerly
Sr. Manager, Corporate Business Development, Eli Lilly and Co.

                                              November 2006      1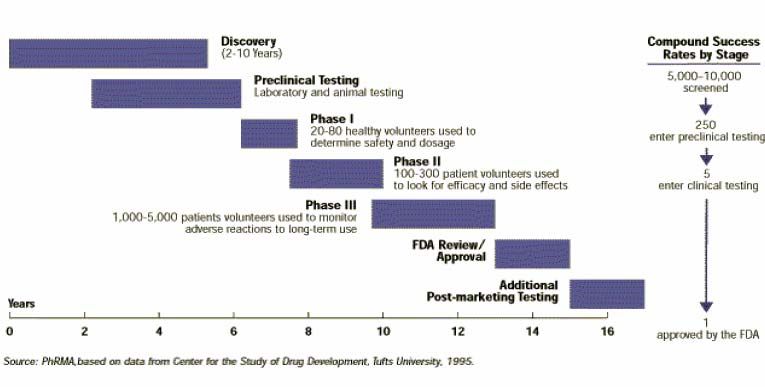
Self-Introduction of Richard Brown
Experience:
                  Consultant and Head, Tokyo Office, Plexus Ventures,
                         January 2006 - Present
                  Sales, Marketing, Business Development and General
                         Management, Eli Lilly & Co., 1979 - 2005
              »    Sales: Medical Representative, District Sales Manager
              »    Marketing: Market Research Manager, Product Manager, New
                   Product Planning & Market Research Director (Lilly Japan), US
                   Contracts and Pricing Director
              »    Business Development: Corporate Business Development
                   Manager, Business Assessment Director
              »    General Management: Managing Director - Russia and CIS
                  Russian Linguist and Economist, Central Intelligence Agency,
                        1974-77

Education:        B.A. in Russian Language & Literature, Dartmouth College
                  MBA in Marketing, Harvard Business School

Summary:          6 Years in Business Development
                  7 Years working in Japan and/or with Japanese
                        Pharmaceutical Companies
                  9 Years in Market Research and Forecasting
                  27 Years in the Pharmaceutical Industry                          2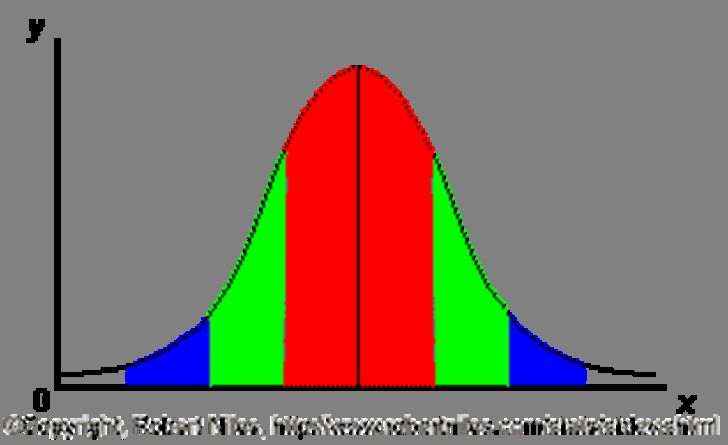
Perspective of a Military Strategist
        之を蹟けて動静の理を知り

        孫子曰く、
        敵の兵力を分散させるためには、まず敵情の把握が必要である。敵
        軍を尾行してその行動基準を割り出し、敵軍の態勢を把握してその
        死活を分ける土地を割り出し、敵軍の置かれている状況を洞察して、
        その利害・得失の計謀を割り出し、また兵力の優勢な所と手薄な所
        とを割り出すのである。

        General Sun Tzu, in Art of War, said:

        “Although the enemy may be stronger in numbers, we may prevent him
        from fighting. Try to discover his plans and the likelihood of their success.

        Rouse him, and learn what makes him active or inactive. Force him to
        reveal himself, so as to find out his vulnerable spots.

        Carefully compare the opposing army with your own, so that you may
        know where strength is abundant and where it is deficient.”1

1
    Art of War by Sun Tsu, Chapter 6, 22-24. Sun Tzu was a general in China in the 6th Century B.C.   3
Negotiation Tools and Techniques
This seminar will:
• reinforce the value of learning the other party’s interests almost as well
as you know your own company’s interests, and how to do this
• describe the Tools (forecasting and valuation models, due diligence
process) and Techniques (negotiation style) which are commonly used
by multinational pharmaceutical companies today
• explain the importance of having a sophisticated and flexible valuation
model prior to the beginning of negotiations, when you are setting your
terms, and continuously as the terms change throughout the negotiation
Negotiations are a typical example of 2-player game in which there is
incomplete information held by each party. According to Game Theory, one
side can gain advantage by learning the opponent’s strategy, the reason for
their past actions and likely future actions, and importantly the way they keep
score (i.e. how they will evaluate their success at the end of the negotiations)
4Agenda
I. Importance of Partnering for Multinational
Pharmaceutical Companies
II. Standard Process for In-Licensing
III. Tools Used for In-Licensing
IV. Techniques Used During Negotiation
V. Implications for Companies Negotiating with
Multinationals
VI. Q&A
5I. Multinational Pharmaceutical Companies
Prioritize Successful Partnering
CEO Jeffrey Kindler: We need to align our organization to today’s markets, so
that we see opportunities quickly and act on them, whether that means
increasing support for successful medicines, entering into co-promotion
and licensing agreements, investing in new technologies, or acquiring new
products and services from outside the company.”
CEO Daniel Vasella: “The key to success in the global pharmaceutical
market lies in the rapid discovery, development, and commercialization of
innovative medicines that fulfill patients’ needs. Successful alliances
contribute to the success of our partners and our own sustainable growth.”
CEO Sidney Taurel: “Successful alliances are more critical than ever to our
strategy. We are working hard to be recognized as the pharmaceutical
industry's premier partner by consistently creating value for our partners
and for Lilly."
CEO: Richard Clark: “At Merck, partnering is an essential component of our
strategy to discover and develop novel medicines that meet major unmet
medical needs.”
6Investment Analysts’ Opinions of
Positive Features
• Largest pharmaceutical company, sales of US$51 billion
• 8 products >US$ 1 billion
• Balanced international sales (48% of sales outside US)
• US$ 22 billion in cash and short-term investments
• New CEO to streamline the organization and increase productivity
• Won recent Lipitor patent suit against Ranbaxy, keeping patent until 2010
Negative Features
• Zocor patent expiry and falling prices will hurt Lipitor sales (“indirect generic”)
• No clear blockbuster in the pipeline (“worst pipeline relative to its size in the
industry”)
• New cholesterol drug, torcetrapib, coming out in very competitive market
• Inhalable insulin, Exubera, faces patent challenges from Novo Nordisk
Even the largest multinationals with enormous resources
need partnerships for growth
Source: Wall Street Journal, 6 Sept. 2006 7History Suggests a Large Pipeline is Need
to Ensure a Steady Flow of Launches
We can apply these success rates to a company’s development
8
portfolio, and predict the number and timing of launchesMany multinationals state an objective to
launch “2-4 new chemical entities per year”
Regulatory Global
Pre-IND Phase 1 Phase 2 Phase 3
Submission Launch 3
Annual
Throughput 28.7 16.1 8.4 4.8 3.3
Years 1 1 3 1.5
2
In Phase
Number of
Pipeline 28.7 16.1 16.8 14.4 5
Compounds
9
>50 clinical phase compounds are needed to deliver 3 NCE’s per year!Agenda
I. Importance of Partnering to Multinational
Pharmaceutical Companies
II. Process Used for In-Licensing
III. Tools Used for In-Licensing
IV. Techniques Used During Negotiation
V. Implications for Companies Negotiating with
Multinationals
10The Negotiator’s View of the In-Licensing
Deal Process
Know What Learn What Resolve Conclude
You Want Other Side Issues in Sustainable
Wants Conflict Agreement
• Understand the asset • Determine why they • Focus attention on the • Establish a clear
of interest and the are seeking a partner, issues and what each governance system and
importance of acquiring and their selection side’s real interests are method for settling
• Identify the internal criteria • Look for ways to disagreements
“champion” of the • Prepare a rationale for resolve issues in a way • Ensure clear
project how your company that benefits both sides disengagement procedure
• Determine the value of meets their criteria; if project fails
the asset listen for any concerns • Transfer knowledge
• Confirm with gained during the
management the negotiation period to the
acceptable terms new team
11In-Licensing Involves a Large Number of
People and Functions
• Scientific or Commercial “Owner” or “Champion” of the Project
• Licensing & Business Development Negotiators
• Marketing Department, including Market Research
• Corporate Finance
• Accounting and Tax
• Manufacturing
• Product Development
• Project Management
• Toxicology
• Clinical Development Planning
• Regulatory
• International Management
• Others
12Companies Need a Clear Process to
Manage In-License Opportunities
• Multinationals continuously monitor many thousands of opportunities
each year
– In 2005, US biotech raised US$17 billion through partnering, primarily
with “Big Pharma”, up from US$ 10 billion in 2004
– In 2005, Merck considered > 4,000 opportunities, reviewed confidential
information under CDAs for >600, and signed 44 agreements
– Since 2000, Pfizer has signed 1600-1800 agreements per year
• Potential opportunities need to be carefully screened so that the
company’s research scientists are not excessively burdened with
licensing activities
• Multinationals need to react quickly to opportunities as they arise,
obtaining review and approval efficiently in their large organizations
• Senior management will often request an explanation when another
company in-licenses a desirable asset
– Was our company aware of the asset?
– Did we try to get it? If not, should we have tried?
A process that brings the right information to the appropriate decision
makers in a timely fashion is essential in a large organization
13Each Multinational Follows a Very Similar
Licensing Process
Find the Asset Evaluate the Asset Get the Asset Ensure Success
Technical/
Commercial
Initial Detailed Due Diligence
Identify Technical Technical/
BMS Opportunities Commercial
Evaluation
Evaluation Contract
Negotiations
Opportunity Alliance
Initiation Doing the Deal
Merck (Negotiation) Management
(Find and (Implementation)
Select)
Technical Due
Diligence
Initial Initial Realize The Value
Get It
Lilly Find It Technical Commercial
(Negotiation)
(Alliance
Evaluation Assessment Management)
Full
Commercial
Reviews/approvals are conducted when Assessment
moving between process steps 14
Sources: Company Websites and Public PresentationsMultinationals “Dedicate” Resources to
Manage the Licensing Process
Example of Licensing Process and Participants
Step 1: Find Step 2: Get Step 3:
the Asset the Asset Realize Value
from the Asset
External Research Group Go/No-Go Corporate Business Dev’t Decision by Alliance Management
Research Strategy Dept decision by Marketing/Market Research senior manage- Project Management
Therapeutic Business Unit senior manage- Corporate Finance/M&A ment whether to
ment to enter in Legal/Contracts approve the
negotiations; Manufacturing anticipated final
key conditions Decision Sciences agreement terms
communicated Patent
Geographic Headquarters
Departments in blue are usually dedicated resources to Business Development and Licensing
The licensing process requires many diverse skills, and multinationals tend
to divide this process so that appropriate functional experts contribute at
each step, and so that senior management is kept informed.
15Process Step 1: Find the Asset
• Staffed by Scientists and Reports to Head of Research
• Periodically receive priorities from each scientific or business group
• Scientific platforms/mechanisms of interest
• Decision based on advancing or replacing internal programs, and
cost of licensing
• Business: compounds that fill gaps in the marketed products portfolio
• Decision based on strategic fit, financial return and risk
• For compounds of interest, “Find the Asset” group coordinates an “Initial
Assessment”, with or without a Confidential Disclosure Agreement
• Project leader contacts originator to learn if compound can be licensed
• Scientists assess the available safety/efficacy data on the compound
• Scientists search for similar compounds from other companies, at all
stages of development (“competitive landscape”)
• Market researchers estimate market size and identifies “critical success
factors” that would drive higher or lower sales
• Patent attorney may do a patent search, if patent has issued
• Chemist estimates relative cost of manufacturing, given structure
Identified compounds need management approval to proceed to the next
phase (“Get the Asset”); tentative approvals are contingent upon a positive
Due Diligence report and suitable contract terms 16Process Step 2: Get the Asset
• Usually led by business people (e.g. marketing, finance), with support from
staff (e.g. legal, accounting)
• Continued Scientific and Commercial Evaluation
• Each contributor to the “Initial Assessment” (in Step 1) updates their
evaluation, based on new information as it becomes available
• Due Diligence is scheduled as early as possible
• Need to understand any gaps in development that will impact
resources and timing
• Required before “binding terms” can be submitted
• Elements of a financial valuation are collected and a financial model is built
• Sales forecast, clinical plan, marketing expenses, cost to manufacture,
etc.
• The most significant drivers of financial return are identified from the
model
• The negotiation team prepares a strategy for securing these value drivers,
meeting the guidelines received from senior management, and
managing risks identified during Due Diligence
The negotiation team will try not to engage in significant discussions with
the originator until the above preparation has been completed (with the
17
possible exception of Due Diligence)Process Step 3: Realize Value from the Asset
• This process officially begins after the agreement has been signed
• Some companies assign “alliance managers” to be involved as early as
the Due Diligence visit, to begin to judge the potential compatibility of the
two companies
• “Realizing the value” is the primary task of the Project Team leader for the
in-licensed compound
• Alliance managers assist the Project Team leader to ensure effective
communication between the companies, resolve misunderstandings
• Alliance managers often advocate the position of the partner to senior
management
The Alliance Management Process is the focus of the December 2006
seminar
18Agenda
I. Importance of Partnering to Multinational
Pharmaceutical Companies
II. Process Used for In-Licensing
III. Tools Used for In-Licensing
IV. Techniques Used During Negotiation
V. Implications for Companies Negotiating with
Multinationals
19Analysis and Planning are Essential Prior to
the Negotiations
算多きは勝ち、算少なきは敗る
そもそもまだ開戦もしないうちから、廟堂で籌策してすでに勝つの
は、五事七計を基準に比較・計算して得られた勝算が、相手よりも
多いからである。
勝算が相手よりも多い側は、実戦でも勝利するし、勝算が相手より
も少ない場合は実戦でも敗北する。
私がこうした比較・計算によって、この戦争の行方を観察するに、
もはや勝算は目に見えている。冑
“The general who wins a battle makes many calculations in his mind before the
battle is fought. The general who loses a battle makes only few calculations
beforehand. Therefore, many calculations lead to victory, and few calculations
to defeat: how much more when no calculations at all are made! It is by
focusing on this point that I can predict who is likely to win or lose.”1
1
Art of War by Sun Tzu, Chapter 1. 20Tools Used for In-Licensing
The essential tools applied to in-licensing projects are:
A. Sales forecasting methodologies
B. Financial valuation models
C. Due diligence assessment process
Increasingly, the tools used for in-licensing are identical to the tools applied to
internal projects. The reasons for this are:
– Senior management asks why the compounds for in-licensing are
evaluated more closely and critically than the compounds developed
internally
– Simultaneous to the growing sophistication of in-licensing tools has
been the emergence of “Portfolio Management” as a discipline, in which
“valuation” and “risk” are key factors
– In-licensed compounds can be smoothly added to the portfolio, since
they have been assessed in the same way as the current compounds
under development; there is reasonable assurance that the in-licensed
compound will be resourced
Full and accurate (to the extent possible) business cases are constructed early
in the in-licensing process – at Step #2 (“Get the Asset”)
– Substantial effort earlier in the process would likely waste the
company’s resources on projects that don’t go forward
21A. Sales Forecasting Methodologies
• Forecasting a compound’s future sales is very difficult, and there is often
little confidence in the forecast’s accuracy
• It is often said, “We know the forecast is wrong; we just don’t know if
it is too high or too low.”
• Often the people doing forecasts have limited experience in
pharmaceutical marketing, and do not have strong credibility to senior
management
• Executives tend to remember when a forecast has been wrong more
often than when the forecast comes close to matching actual sales
• Forecasting methodologies have been changing
• Prescription-based Forecast:
• Starts with prescription or unit volume of drugs for the target
disease, based on historical trends
• Forecasted share of your drug is based on market research (or
“guess”!). This method is widely used because the data is easy to
obtain
• Patient-Flow Forecast: This method has gained popularity because it
simulates the market dynamics
22“Patient Flow” Methodology for Sales
Forecasting
Forecasting sales of “Drug A” which treats a condition affecting elderly people
Forecast Variables Calculations
• Population > 60 years of age No. of people in susceptible age group
(current and projected through 2020)
• Prevalence of condition X % prevalence
= No. of patients with the condition
• Seek treatment for the condition X % visiting physician
= No. of patients consulting physician
• Receive an accurate diagnosis X % accurately diagnosed by physician
= No. of diagnosed patients
• Receive pharmaceutical treatment X % receiving drug therapy
= No. of drug-treated patients
• Receive Drug A X % patient share attained by Drug A
= No. of patients on Drug A
• Compliance with Drug A X Average days on drug (out of 365 days)
= Days of therapy on Drug A
• Reimbursed price less distributor margins X Price per day of therapy
= Total sales of Drug A per year
23Advantages of “Patient Flow” Forecasting
Methodology
Simulates how the market actually works
•Patients become aware of a problem and visit the doctor
•The doctor asks the patient some questions, performs some tests, and
arrives at either a correct or incorrect diagnosis
• Etc.
Market researchers can conduct focused interviews and do desk research to
estimate each of the lines or “nodes” of the Patient Flow model
• Such a forecast can be better defended in front of management, since
there is evidence to support each calculation
Marketing planners can focus on the nodes where drug usage can be most
effectively increased
• for example, if proper diagnosis occurs only 50% of the time, the
company may choose to spend marketing budget on programs that
improve physician awareness and diagnostic skill
• by setting achievable targets for improvement at each node and the
cost of the supporting programs, the planners can select those
“interventions” that will yield the biggest “return on investment”
24Example of Forecasting using the Patient
Flow Methodology – Best Estimate
Calculations Year 20XX
No. of people in susceptible age group 30 million
X % prevalence x 11%
= No. of patients with the condition
X % visiting physician x 70%
= No. of patients consulting physician
X % accurately diagnosed by physician x 65%
= No. of diagnosed patients
X % receiving drug therapy x 70%
= No. of drug-treated patients
X % patient share attained by Drug A x 33%
= No. of patients on Drug A
X Average days on drug (out of 365 days) x 180 days
= Days of therapy on Drug A
X Price per day of therapy x ¥500
= Total sales of Drug A per year ¥ 31 billion
Based on the “best estimate” for each node, the forecast in year 20XX is
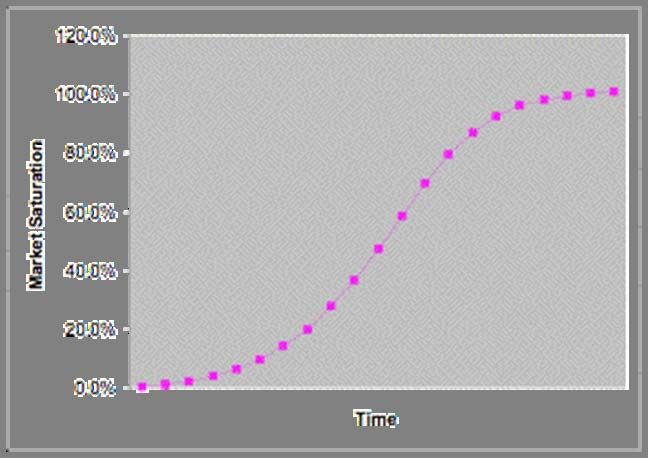
determined to be ¥31 billion 25Typical Sales Forecast Resulting from Using
“Best Estimates” for Each Node, Every Year
Market Share
Time
“S-shaped curves” are the most typical form of pharmaceutical
product launches 26Forecasts Based only on the Best Estimate
Do Not Show Commercial Risk
• In addition to calculating the “best “Best Estimates”
estimate” forecast, many companies have Variable Value
Population (mil.) 35
traditionally calculated “low” and “high” Prevalence 11%
scenarios; these forecasts can be done % Visit Doctor 60%
using a calculator
“3 Scenarios”
• With personal computers and
Variable Low Med High
spreadsheet programs like Excel®, one can
Population (mil.) 33 35 37
do many different scenarios, called “What if” Prevalence (%) 8 11 14
analysis. In “What if” analysis, you change % Visit Doctor (%) 50 60 67
one or more values to see how the result is
affected.
“Probability Distribution”
Population
% Visit MD
• The most current methodologies have a Prevalence
more rational way of representing
uncertainty in a forecast: by defining a
probability distribution for each unknown
variable, and letting a sophisticated
software program such as Crystal Ball®
27
randomly select a valueExample of Forecasting using the Patient
Flow Methodology – 3 Scenarios
Forecast Assumptions in Year 20XX
Best
Calculations
Downside Estimate Upside
No. of people in susceptible age group 28 million 30 million 32 million
X % prevalence x 10% x 11% x 12%
= No. of patients with the condition
X % visiting physician x 70% x 70% x 67%
= No. of patients consulting physician
X % accurately diagnosed by physician x 55% x 65% x 75%
= No. of diagnosed patients
X % receiving drug therapy x 65% x 70% x 80%
= No. of drug-treated patients
X % patient share attained by Drug A x 25% x 33% x 45%
= No. of patients on Drug A
X Average days on drug (out of 365 days) x 160 days x 180 days x 200 days
= Days of therapy on Drug A
X Price per day of therapy x ¥300 x ¥500 x ¥700
= Total sales of Drug A per year ¥ XX billion ¥ YY billion ¥ ZZ billion
28Example of Forecasting using the Patient
Flow Methodology – “Probabilized” Sales
Forecast Assumptions in Year 20XX
Low Medium High How are these numbers used to
1(90/10) (50/50) (10/90) generate a sales forecast –
33 million 35 million 37 million Answer A or Answer B?
x 10% x 11% x 12%
Answer A: multiply all the values in
x 50% x 60% x 67% each column together to determine
the Low, Medium and High sales
x 50% x 65% x 85% forecasts
x 60% x 80% x 90% Answer B: develop a probability
distribution for each variable, by
x 40% x 50% x 60% setting the 90/10, 50/50 and 10/90
values, and run thousands of
x 120 days x 160 days x 220 days
simulations; graph the results, from
x ¥600 x ¥800 x ¥1,200
lowest to highest. This forms a
probability distribution of expected
¥ XX billion ¥ YY billion ¥ ZZ billion
sales outcomes.
1
90/10 means there is a 90% chance that the actual value will exceed this number, and a 10% chance it will be 29
lower than this numberHistogram of Possible Sales Forecasts
from “Crystal Ball” Model
Forecast: Sales of Elderly Medication
3,000 Trials Frequency Chart 20 Outliers
.023 70
.018 52.5
.012 35
.006 17.5
.000 0
0 17.5 30.0 50.0 70.0 80.0
Certainty is 95% that sales will exceed ¥17.5 billion
30Statistical Models Allow One to
“Bracket” the Range of Likely Outcomes
1 s.d. = 68% C.I.
s.d. = standard deviation
C.I. = confidence interval
2 s.d. = 95% C.I.
There is 95% confidence that the actual result will be within the red +
green range of forecasted outcomes 31Deriving Probability Distributions
It is important to properly define the range for each value in the sales forecast
or the compound valuation. Some of the methods that are used include:
• Historical Data, for example:
• population growth/decline data
• length of time spent in Phase 3 trials in your company’s experience
• Survey/Sample Data:
• epidemiological studies of disease prevalence
• Analogous Situations
• % of patients who visit a doctor for similar diseases as the one you
are forecasting
• cost of manufacturing compounds with similar chemical structures as
the one you are valuing
• Expert Opinion
• experts’ estimate of the % of physicians who are capable of
accurately diagnosing the disease
• experts’ opinion of the probability that a compound with a certain
mechanism will result in a positive clinical trial 32Commercially Available Sales Forecasting
Models
To further assist in sales forecasting, particularly in determining what
share of market the new product will achieve, software is available that
contains sales history on many pharmaceutical products. The software
Selects a product uptake curve based on the description of the new
compound compared to past products launched.
Inputs Forecast Variables
• Number of patients receiving pharmaceutical treatment
• Product profile relative to standard of therapy • Population > 60 years of age
• New mode of therapy, or replacement of older therapy (current and projected through 2020)
• Prevalence of condition
• Order of product launch within the therapeutic category
• Relative price to the standard of therapy • Seek treatment for the condition
• Share of promotional “voice” (SOV) among all products
for this disease • Receive an accurate diagnosis
Output • Receive pharmaceutical treatment
• Applies an Uptake Curve for this Disease Category (for Model most
• Receive Drug A
example, dry eye in elderly patients) useful here
• Highlights those attributes of a drug that lead to high • Compliance with Drug A
penetration in the therapeutic category
• R2 (measurement of how closely the regression curve • Reimbursed price less distributor margins
matches the data) usually above 90% - high correlation
Thousands of previously launched products are contained in 33
the analogue database (example: IMS Analogue PlannerTM)B. Financial Valuation Models
Multinationals seek to understand the value of a compound they wish to in-license
as early as possible, despite many unknowns
The starting point is to calculate the net present value (NPV) of the compound,
which is calculated by determining the future cash flows, positive and negative, and
then discounting them by the company’s chosen “discount rate” (also called “hurdle
rate” or “weighted average cost of capital”). The formula is:
N
NPV = Σ Ct where t is the time period, C is the net cash flow,
and r is the discount rate
t=1 (1+r)t
The essential cash flows (+ and -) for a compound still in development include:
– Development expenses: clinical trial costs, physician fees, cost of CT material, etc.
+ Product sales: forecasted units multiplied by the assumed price
– Cost of goods sold (COGS)
– Sales and marketing promotional expenses
– Projected milestone and royalty payments paid by the licensor (“deal terms”
Timing of the cash flows has a large impact on the valuation; key events include:
• the start and duration of Phase 2 and Phase 3 trials
• product launch 34
• patent expirationAs in Sales Forecasting, there are many
Unknowns in Determining a Compound’s Value
• Cost of goods sold (COGS): the manufacturing costs at commercial scale-
up may only be known after final process set in Phase 2 or later
• Sales force promotion: the number of details will depend on the physician
targets, whether specialists or general physicians, and the anticipated level of
competitor promotion. May not be known until Phase 3.
• Timing of regulatory submission and product launch: these depend on the
speed of enrollment in the clinical trials and the review period for the
regulatory authority (MHLW, FDA)
• Probability of the compound successfully completing clinical trials: this will
be decided after each phase, based on the clinical results observed
A sophisticated model of valuation needs to take into account a range of
uncertainty around key variables, in the same way as the sales forecast
deals with uncertainty
35Example of a Net Present Value Calculation
The compound in this example is a pre-clinical asset, licensed in 2004. The
negotiation team has done its analysis and made the following assumptions:
Compound Assumptions
Stage of development: Pre-clinical
Probability of technical success (i.e. launch): 12%
Future development expenditures: $284 million
Launch year 2012
Forecast peak-year sales $808 million
Deal Terms Assumptions
Partner pays all future development expenses
Originator receives following fees:
• Signing Fee $50 million
• Beginning Phase 3 milestone $10 million
• First country launch milestone $40 million
• Royalty on net sales 10%
It often helps to graph the cash flows when calculating the NPV
36Visualizing the Cash Flows in Each Year
No Discounting and No Probabilizing
500
Partner
Originator
400
Cash Flow (US$ Million)
300
200
100
0
-100
-200
2004 2006 2008 2010 2012 2014 2016 2018 2020 2022 2024
The partner appears to receive the vast majority of the asset’s cash flows,
with the revenue in later years easily exceeding early investments
37
Chart reprinted from Pharmaceutical Executive, “Risks and Rewards; How to Protect the Hand You’re Dealt”,
by Joseph Dillon, October, 2005.Discounted Cash Flows in Each Year
(No Probabilizing)
500
500.0
Partner
Originator
400
400.0
Cash Flow (US$ Million)
300
300.0
2004 2006 2008 2010 2012 2014 2016 2018 2020 2022 2024
200
200.0
The partner still appears to receive the majority of the value, but
100
100.0
later years are much smaller due to the ‘time value of money’
Chart reprinted from Pharmaceutical Executive, “Risks and Rewards; How to Protect the Hand You’re Dealt”,
by Joseph 0 Dillon, October, 2005.
0.0
-100
-100.0
The partner still appears to receive the majority of the value, but
later years are much smaller due to the ‘time value of money’
38
Chart reprinted from Pharmaceutical Executive, “Risks and Rewards; How to Protect the Hand You’re Dealt”,
by Joseph Dillon, October, 2005.Net Present Value
Discounted Cash Flow
Partner
Originator
18%
($182 million)
82%
($820 million)
Total NPV = $1.0 Billion (unprobabilized)
On an NPV basis, and assuming the product is launched, the partner
would receive 82% of the compound’s total value
Chart reproduced from Pharmaceutical Executive, “Risks and Rewards; How to 39
Protect the Hand You’re Dealt”, by Joseph Dillon, October, 2005.The Probability is Great that a Current Pre-
Clinical Compound will Fail During Development
120% Probability of Success and Failure by Phase of Development
100%
80%
P robability
Probability of Success
60%
40%
Probability of Failure
20%
0%
Pre-Clinical Phase 1 Phase 2 Phase 3 Registration Launch
Go 59% 52% 57% 70% 90%
Stop 41% 48% 43% 30% 10%
P(Invest) 100% 59% 31% 18% 12%
Chart reproduced from Pharmaceutical Executive, “Risks and Rewards; How to
40
Protect the Hand You’re Dealt”, by Joseph Dillon, October, 2005.How Multinationals Incorporate the
Probability of Development Success/Failure
• NPV is commonly applied to capital investment projects (for example,
building a factory), where there is very low uncertainty and low risk about
whether the investment will be completed
• In pharmaceuticals, there is high uncertainty and high risk in developing a
compound. Development of a compound may be changed or stopped
due to the company’s evaluation of study results or other factors.
• Multinational pharmaceutical companies have begun to apply another
method, called “real options” (“real” means that the assets are real, rather
than financial instruments; “options” means that management has
flexibility to change the initial strategy as information is received), to
better simulate how probabilities and values change based on investment
decisions.
• Decision tree analysis is used to model future activities, possible
outcomes and uncertainties
• Note: Traditional NPV analysis will always undervalue projects that have
high uncertainty and where more information will become available that
could change the investment decision 41Illustration 1: Traditional pNPV
Development successful
Value (NPV) of Launch
project now $1,002 million
12%
-$51 million
Development failed
No launch -$195 million
88%
Making the calculation in this way assumes the company continues to develop
the compound through Phase 3; in reality, the decision whether to proceed in
development may be made many times during development
Source: International Center for Decision and Risk Analysis.
42Example 2: Option-based Probability
Adjustment for Pharmaceutical Projects
Launch NPV
p= 12%
Registration 90%
A $1,002 Mil.
Expected NPV if Phase III invest
option to stop $0 Mil.
Phase II 70%
invest stop p= ½ % B
$5.1 Mil. -$194 Mil.
Phase I 57% 10%
invest stop p= 5%
$108.9 Mil. C -$189 Mil.
52% 30%
Pre-IND
invest stop p=13% D -$81 Mil.
$62.4 Mil.
59% 43%
100% stop
$93 Mil. p=28% -$18 Mil.
$13.6 Mil. E
48%
-$4.5 Mil. stop p=41% F -$4 Mil.
41%
Option value= $144 million
($93 M – ($51 M))
This decision tree shows all likely outcomes during development. Corresponding
to each outcome, there is a probability and an NPV. The expected NPV is the
43
weighted average (probability * NPV) of all the outcomes (A-F).Implications of the “Real Options” View of
Compound Development
• The relatively higher value (pNPV) given to pharmaceutical R&D projects, vs.
low-risk investments, is due to management flexibility to change, and even
discontinue, the investment at each decision point (management requires the
flexibility to discontinue development for any reason)
• Development teams are required to define “critical success factors” for each
study, so that results can be clearly and objectively evaluated compared to
expectations (team cannot wait until results are obtained and then define
success)
• Management reviews occur frequently, whenever new and meaningful data
has been generated, to evaluate results and determine investment priorities
• Management may determine that a compound has not met its critical success
factors, although it may still be a marketable drug; they may decide to return
an in-licensed compound to the originator, or to out-license an internally
discovered compound
Viewing a portfolio of compounds as if it were a portfolio of financial
assets (e.g. stocks or real estate) allows management to “place bets”
where the greatest returns are likely to be realized 44The pNPV Demonstrates that the Partner is
Bearing a Large Part of the Risk
Non-Probabilized NPV
Option-Based Probability-
Adjusted NPV
18%
Partner 38%
Originator
62%
82%
pNPV = $93 Million
NPV = $1.0 Billion
The partner invests considerable resources for development and
makes milestone and other payments to the originator, well before the
product starts to generate sales (if ever)
45C. Due Diligence and its Role in Negotiation
Definition: An evaluation into the details of a potential investment or purchase, in
which all the material facts relevant to the investment or purchase are verified
Purpose, and Importance to the Negotiation:
1. Assess potential risks and benefits,
2. Identify risks that may harm the value of technology, and
3. Develop strategies for overcoming any such risks
Process:
• Licensee assigns internal experts from each relevant functional area, who will
evaluate the originator’s data supporting the claims.
• These experts generate questions that need to be addressed, and all questions
are sent to the originator to assist is gathering the appropriate documents
• Due diligence team arrives to the originator’s “due diligence document room”;
the originator’s experts are present or available to answer questions
Output: Areas are identified where gaps exist between what is expected (based on
stage of development) and what is actually found
46Influence of Due Diligence on the Negotiation
• Due Diligence is viewed as an objective, unbiased evaluation of the
development stage of the target compound; as such, it is very difficult for
either the “champion” within the licensee or especially the negotiation team
to ignore the due diligence findings and recommendations
• The due diligence process can reveal certain characteristics of the licensor
• Degree of openness to discuss issues of the compound (seen as predictor of
future openness and cooperation)
• Thoroughness of documentation to support each essential development step:
optimization, selection, toxicity, human dosing, etc. (whether there is sufficient
evidence to convince the regulatory authorities)
• Capabilities of the preclinical, clinical, project management, regulatory, patent,
process development and other functions of the licensor (to judge whether the
licensee’s resources will be needed to support these activities)
• The licensor’s response to the due diligence report should be constructive
• If some findings are a surprise, make sure you understand the facts that the due
diligence team used to base their findings; correct mistaken assumptions
• The due diligence team may reach negative conclusions from certain findings;
rather than fight these conclusions, try to identify possible solutions (it is unlikely
that the licensee’s management will change their view if the facts didn’t change)
Negotiations that have progressed for months can be halted based on
47
due diligence findings; it is best to schedule it as early as possibleThe NPV Model is an Important and Often
Consulted Guide to the Negotiation Team
• The multinational company is acutely aware of linkages between various
deal terms, because each change made to the terms affects the projected
deal value and deal split
• By running the model with different variables, the negotiation team can
determine the financial impact of each proposed deal structure
• The model allows the negotiation team to focus on those elements that will
deliver the desired value to the company, and trade off elements that don’t
affect value
The NPV model operates as a control panel for guiding the negotiation
48Agenda
I. Importance of Partnering to Multinational
Pharmaceutical Companies
II. Process Used for In-Licensing
III. Tools Used for In-Licensing
IV. Techniques Used During Negotiation
V. Implications for Companies Negotiating with
Multinationals
49Some Differences in Negotiating Style are
Culture-Based
Degree of Formality
• US: quite informal in speech and appearance; use first names
• JPN: business-like and formal; use last names
Face-to-face meetings
• US: happy to use video- or web-conferencing, consider it quick and efficient
• JPN: face-to-face best for building trust and communication easier
Extent of Authority
• US: initial positions and “fall-back” positions pre-established; use of NPV model
allows for immediate effect of each concession
• JPN: movement from present position unlikely during the current negotiation
session; appears that concessions need to be approved by senior management
Awareness of Past Company Interactions
• US: focus on the immediate issues in the current negotiation; new people
representing the company each time
• JPN: memory of previous negotiations; same people likely to be involved
50More Differences in Negotiating Style
Confrontation and Conflict
• US: direct, not highly concerned with effect on other party; challenging
• JPN: more vague expressions, neither “yes” nor “no”, less confrontational
Mealtimes:
• US: opportunity to gain time on the agenda by working through lunch
• JPN: separate time from negotiations to build relationship
Results vs. People:
• US: results more important than maintaining relationships
• JPN: relationships as important as the results; maintain politeness and respect
Negotiation Protocol
• US: low awareness of or sensitivity to formal seating arrangements
• JPN: formal seating arrangement
Silence
• US: not accustomed to silence in a group session; tendency to talk if Japanese
side is silent
• JPN: comfortable with silence
So many books exist on this popular subject that it can be dangerous to
assume that the other party will act in a “culturally stereotypical” way 51Impact of Negotiation Research on
Multinationals’ Behaviors
The Harvard Negotiation Project, founded in 1979, has led research into a
variety of diplomatic and business negotiations. Some of its publications (e.g.
Getting to Yes1) are “required reading” for negotiators and business students.
The basic recommendations from this research are;
1. Separate the people from the problem
• Participants should see themselves as working side by side, attacking the
problem, not each other
2. Focus on interests, not on positions
• Stating positions, such as “we can’t accept anything less than 20% royalties”,
often hides the underlying interests that you are trying to satisfy, and are hard for
the other side to accept
3. Generate a variety of possibilities before deciding what to do
• Stated “positions” tend to be “win-or-lose”, where one side wins and the other
loses; however, “interests” can often be satisfied in a number of ways
4. Insist that resolution of issues be based on some objective standard
• Standards such as “maximizing the value of the asset” or “leveraging the
capabilities of each party” can facilitate resolving disagreements in an efficient
way
52
1
Fisher R and Ury W, Getting to Yes: Negotiating Agreement Without Giving In, 1981.Behaviors that are Associated with
Principled Negotiation
1. Separate the people from the problem
• Write the issue on a flipchart in the room, in the form of a drawing if possible, so
that both parties can “attack” the problem in front of them (and not each other).
2. Focus on interests, not on positions
• Ask the other party why it has taken a certain position; listen for clues as to the
underlying interest or desire that the position represents.
• Use expressions such as, “why is it important for you to obtain ______?”
3. Generate a variety of possibilities before deciding what to do
• Once you have identified the interest of the other party, “brainstorm” with them
other ways they may be able to achieve their objective
• Make sure both sides realize that proposed solutions during brainstorming have
not yet been reviewed or approved by management
• Use expressions such as, “if we could do X, would that be a reasonable
alternative to Position Y?“
4. Insist that resolution of issues be based on some objective standards
• Have a discussion very early in the negotiations regarding “guiding principles” for
the collaboration. Guiding principles should serve to remind the negotiating teams
why the two companies are pursuing the collaboration, and be referred to when
the two sides are deadlocked
• Agree on what basis the deal value will be shared by each party; the concepts of
“value received commensurate to the risk assumed” or “equitable deal split”
53
based on development stage may be introduced at this timeCreating and Claiming Value During a
Negotiation
Creating Value
• An asset’s total value, without including financial terms, is called the “System
Value”, expressed as an eNPV
• “System Value” is the “size of the pie before it is cut” between the parties
• Issues that arise during negotiations can be considered as opportunities to look
for ways to increase value for both parties, rather than “win or lose” contests; this
“cooperative” approach is more often used by multinationals, that the
“competitive” approach
• “System Value” will increase if the two sides can identify opportunities to increase
sales, decrease expenses or reduce time to market (e.g. locate manufacturing in
a low-tax country; conduct a Phase 2/3 trial rather than separate Phase 2 and 3
trials)
Claiming Value
• The process of “cutting the pie”, whether or not the parties were successful in
growing the size of the pie in a cooperative way
• Multinationals keep track of their portion of the pie using the NPV model,
previously described
54Equitable Deal Split
Deal Split
• The portion of the value that each company receives, including payments from
licensee to licensor, expressed as a percentage of the “System Value”
Equitable Deal Split
• Refers to a “fair” split of the “System Value”, based on the amount of risk that
each party is assuming at each future phase of development.
• The actual deal split will be a function of the ability of each negotiation
team and also of the attractiveness of the asset to other bidders
Example “Equitable Deal Split” ranges (% of the pNPV that goes to the
licensee)
Prior to 1st human dose: 80-90%
End of Phase 1: 60-70%
End of Phase 2: 40-50%
End of Phase 3: 20-30%
Deal Splits are never made public, so one cannot identify “comparables”
except from one’s own experience
55Rationale for Progressive Deal Split Ranges
• The originator is entitled to be rewarded for discovering the compound, and for
reducing the uncertainty, or risk, whether the compound will be successfully
developed; the larger the risk reduction prior to licensing-out, the greater the
originator’s share of the value
• The partner needs to be sufficiently financially motivated to take over the
development costs of the compound; setting high deal terms, especially “front-loaded”
payments, reduces the partner’s share of the value and lowers the financial
attractiveness of the project
• The market demand for compounds rises significantly after “proof of concept”
studies have been completed. Multiple companies may wish to bid for late-stage
products, thereby driving up the terms they are willing to pay for access to them
• Early stage compounds are more numerous and their therapeutic benefits may not
yet be proven. These compounds generally do not attract as many bidders, and
therefore the price to access them is not high
Licensees make the conceptual argument for deal splits to be in the “normal range”;
licensors tend to refer to carefully selected “comparable deals” to justify a greater
share of the value
56Example of Terms Adjustments Leading to
an Equitable Deal Split
24%
38%
62% 76%
pNPV = $93 Million pNPV = $93 Million
• In our previous example, • If one moves $45 million of
the licensee receives only the upfront fee to later in
38% of the pNPV, lower development:
than the hypothetical range: - new $10 million milestone
80-90% at beginning of Phase 2
• The upfront fee of $50 - $10 million more to the
million, which is both milestone at Phase 3
immediate and certain, is - $25 million more at
the primary driver of value product launch
going to the originator • The deal split becomes
• The partner sees a pNPV 76% to the partner, or
of $31 million $70 million in pNPV 57Agenda
I. Importance of Partnering to Multinational
Pharmaceutical Companies
II. Process Used for In-Licensing
III. Tools Used for In-Licensing
IV. Techniques Used During Negotiation
V. Implications for Companies Negotiating with
Multinationals
58Implications for Companies Negotiating with
Multinationals
I. Clinical assets, particularly past the “proof of concept” stage, will usually
attract multinationals’ interest
• multinationals constantly seek to replenish and upgrade their pipeline as
compounds fail in development or appear to lose market potential
• even if the multinational has an internal development program in the
same field, it may wish to accelerate the program by acquiring a more
advanced compound
II. Established deal processes require the collection of large quantities of
information about the target compound; once the information has been
analyzed and reviewed with management, the negotiating team will receive
instructions from management regarding what is an “approvable deal”
• prior to the first significant business discussions between the two parties,
the multinational’s negotiation team has prepared in detail a summary of
both the scientific and commercial aspects of the compound, and
received from management a tentative approval to move forward,
provided there are no significant (i.e. negative) findings from Due
Diligence (although this tentative approval is subject to being withdrawn,
if budgets or other circumstances change)
59Implications for Companies Negotiating with
Multinationals (cont.)
III. Highly sophisticated tools (forecasting, valuation, due diligence process) are
used before and/or during the business discussions
• The individuals using these tools need to be trained in both their
operation and the proper interpretation of results
• The cost of developing or acquiring complex forecasting or valuation
tools may appear too great if the number of deals being negotiated per
year is low; however, obtaining a better result during negotiations could
easily outweigh this expense
• In addition, because these tools can be equally valuable for evaluating
and managing the internal portfolio of compounds, it is an investment
that most pharmaceutical companies will probably consider in the future
IV. Multinationals generally adopt a cooperative approach to negotiating, hoping
to build System Value and also to maintain a positive relationship with the
other party
• When claiming value, it is important to understand the impact of trading
off different deal terms
• Companies that have invested in automated valuation models will have
an advantage in rapidly testing various alternatives that maintain
60
expected valueQuestion and Answer Period
Possible Topics from the Audience:
• What functions are normally represented in the Multinational’s
negotiation team
• How are business development teams evaluated by their
management for salary increases and bonuses
• What kind of training do negotiators get prior to entering their first real
negotiation
This is your chance to ask any questions about the Multinational Companies!
61To Learn More About
…contact:
Richard Brown
Head, Tokyo Office
Plexus Ventures LLC
2-8-22-401 Nakane,
Meguro-ku, Tokyo 152-0031
Tel: 03-6279-3570
Fax: 03-6279-3571
Email: richard_brown@plexusventures.com
Web: www.plexusventures.com
62You can also read