MISP 2020 Meat Industry Strategic Plan - including outlook to 2030 - Red Meat Advisory Council
←
→
Page content transcription
If your browser does not render page correctly, please read the page content below
Meat Industry Strategic Plan

MISP 2020
including outlook to 2030

Incorporating

In association with
The Australian
    Red Meat and
    Livestock Industry
    An acclaimed contributor to the Australian community
    and economy:
    • recognised for its environmental credentials
    • respected for its stewardship of livestock

    • rewarded for its quality products

2
1
Contents

    Preamble: An industry-government partnership for whole-of-industry benefit                   3
    Message from the Minister                                                                    4
    Message from the Chairman                                                                    5
    The red meat and livestock industry: an Australian success story                             6
    Structuring our effort – building the plan                                                  14
    Focussing our efforts – core investments                                                    18
        Consumer and community support for the industry’s products and practices                18
        Market growth and diversification for Australian red meat and livestock                 20
        Supply chain integrity and efficiency across our industry                               22
        Productivity and profitability in red meat and livestock enterprises                    24
        Realising the benefits – the foundations for success                                    26
    Monitoring, evaluating and reporting performance                                            28
    Roles and responsibilities across the industry structure                                    29
    Last word                                                                                   31
    Appendices                                                                                  31
        Appendix 1. Organisational responsibilities under the MoU and MISP                      31
        Appendix 2. Benefit:cost ratios 2020 and 2030                                           32

    Index of tables
    Table 1     Key industry statistics                                                          7
    Table 2     Distribution of changes in net industry income by pillar to 2030 (total MISP)   16

    Index of figures
    Figure 1    Integrated strategic plan structure                                              3
    Figure 2    Value of red meat, live export and co-product exports 1995–2014                  7
    Figure 3    Global per capita consumption                                                    8
    Figure 4    Global meat production                                                           9
    Figure 5    Australian real cattle prices                                                   10
    Figure 6    Australian real sheep and goat prices                                           10
    Figure 7    Projected change in the cattle herd and sheep flock                             10
    Figure 8    Forecast baseline growth in industry net income                                 10
    Figure 9    Forecast value of risks and opportunities (by pillar) to 2030*                  12
    Figure 10   Forecast value of risks and opportunities (by supply chain) to 2030*            13
    Figure 11   Core focus areas in developing MISP 2020                                        14
    Figure 12   Industry consultation workshops underpinning MISP 2020                          14
    Figure 13   MISP 2020 framework                                                             16
    Figure 14   Forecast value of risks and opportunities to 2030
                (Consumer and community support investment priorities)                          18
    Figure 15   Forecast value of risks and opportunities to 2030
                (Market growth and diversification investment priorities)                       20
    Figure 16   Forecast value of risks and opportunities to 2030
                (Supply chain integrity and efficiency investment priorities)                   22
    Figure 17   Forecast value of risks and opportunities to 2030
                (Productivity and profitability investment priorities)                          24
    Figure 18   Proposed outline of annual MISP 2020 planning and reporting activities          28
    Figure 19   Architecture and deliniation of key industry roles and responsibilities         29
    Figure 20   Implementation and MER responsibilities                                         30

2
Preamble: An industry-government partnership
for whole-of-industry benefit

The Meat Industry Strategic Plan (MISP) frames the overarching strategic priorities for Australia’s
red meat and livestock industry, comprising the production, processing and live export sectors
of Australia’s beef, sheepmeat and goatmeat supply chains. This strategy has been built with
the direct input of major red meat and livestock co-investors including levy payers, Federal,
State and Territory Departments of Agriculture, CSIRO, the University sector and agribusiness
(including pastoral houses, financial institutions
and the consulting sector).                            Figure 1. Integrated strategic plan structure

As a whole-of-industry strategy, the priorities
                                                                                            MISP 2020
identified in MISP are, by definition, common
to all sectors. MISP defines the ‘what to do’                                                 RMAC
in terms of these priorities. The strategic and
                                                                     CCA          ALFA                                                      BISP
operational details specific to each supply chain
or sector cascade into MISP’s component
                                                                     SCA                        AMIC                              ALEC      SISP
strategies e.g. the Sheepmeat Industry Strategic
Plan (SISP) and Beef Industry Strategic Plan                         GICA                                                                   GISP
(BISP), and in the operating plans of the
industry’s Service Companies.
                                                                            MLA                AMPC                           LiveCorp
                                                                       Production             Processing                      Live export
Now in its fourth iteration, the comprehensive                        sector                   sector                            sector
analysis that underpins the forecast value and
benefits of MISP 2020 has been undertaken                                    POLICY / ADVOCACY             SERVICE DELIVERY

on an economic basis, using modelled changes
in supply (including productivity and production costs) and demand (including price). While
the industry will always have to manage and address qualitative aspects of its operations,
fundamentally all of the probable or possible issues confronting our industry will ultimately
impart quantifiable changes in one or more of these variables.
The economic foundation and objectivity of MISP 2020 is designed to focus all entities
involved in delivering the plan on industry outcomes and organisational performance. This
necessitates a robust commitment to monitoring, evaluation and reporting on the results
of individual and collective investments. Given the significant changes in the structure of
MISP 2020, and the integrated nature of its component supply chain plans (SISP, BISP, etc),
the first year of the plan’s implementation will be one of significant transition, especially in                 The MISP 2020
relation to establishing and reporting against key performance indicators (KPIs). It is expected
that operating budgets will be systematically and progressively aligned with MISP 2020 over                  investment priorities
the course of the 2015-16 financial year, with complete alignment from the start of 2016-17.                     are exclusively
As part of the Australian Government’s commitment to investing in the future of Australian                    focussed on the use
agriculture, our industry is able to raise levies through various points in the supply chain for
                                                                                                               of collective funds,
investment into marketing, research and development. Where invested in R&D, these levies
are matched dollar for dollar by the Australian Government. The unique partnership between                   targeted at areas of
industry and Government provides the financial resources for our industry’s future collective                  known or potential
investment. It should be noted that the modelling for MISP 2020 has accounted for levy
expenditure related to the red meat and livestock industry through Animal Health Australia                    market failure and/
(AHA) and National Residue Survey (NRS) in addition to the industry’s Service Companies.                     or whole-of-industry
Finally, it is important to note that the MISP 2020 investment priorities are exclusively focussed                   benefit.
on the use of collective industry and industry-government funds targeted at areas of known or
potential market failure and/or whole-of-industry benefit. In those areas in which commerce is
operating effectively (i.e. no market failure), on-going – and in some cases, increased – levels
of private sector investment are anticipated. The value generated by these investments should
be viewed as being in addition to that quantified under MISP 2020.

Additional supporting detail is provided in the companion report – MISP 2020 Quantifying the
payoffs from collaborative investment by the red meat industry. This document also supplies detail
at the component commodity and sector level under the same structure.

                                                                                                                                                   3
Message from the Minister

    For many in the red meat sector, 2015 saw the start of a turnaround the likes of which we have
    never seen. Global demand is booming, prices are high and the dollar is low. Favourable conditions
    creating a springboard for the red meat industry to advance and build an even stronger future.
    It is essential that industry takes the lead in understanding its dynamics and setting its own
    direction. It is really pleasing to see an industry uniting right across the value chain to build
    intelligence, gather data, work together and plan how to best use its collective resources to
    improve the profitability of the entire red meat sector.
    Ultimately, the red meat industry’s key output is consumer products. The expectations of
    consumers and communities – in Australia and overseas – in relation to quality, integrity and
    production are on the rise. Traditional roles and processes need to be challenged and market
    expectations must be assessed, understood and clearly communicated. Production decisions
    and investment must be evidence-based, utilising the latest technologies in information
    management, communication and market analysis.
    There are many participants in the red meat value chain and it is a significant result to bring all
    aspects of the production, processing and live export sectors of Australia’s beef, sheepmeat
    and goatmeat supply chain together for this plan. I commend the industry on this achievement.              “I can’t stress
    This is a government that sees and truly appreciates these efforts. We’re equally committed to a             enough the
    prosperous red meat sector. It’s a sector that supports rural and regional communities across the
    country – industry estimates that almost 200,000 people are employed across the supply chain.
                                                                                                               importance of
    We continue to work for better market access opportunities, to support producers who are
                                                                                                            industry investing
    doing it tough, and to increase investment in rural research and development. Through the                 in itself and its
    Agricultural Competitiveness White Paper this government has set out its vision for a more
    profitable agriculture sector – an investment in the future of agriculture to the tune of $4 billion.
                                                                                                             future and that’s
                                                                                                            what this plan is.”
    The White Paper sets aside a further $100 million for the Rural R&D for Profit Programme, to
    fund innovative research partnerships up to 2020-21– this on top of the almost $50 million we
    estimate the government will provide to red meat R&D next financial year. We have also committed
    $13.8 million to develop knowledge on cooperatives, collective bargaining and innovative business
    models as another way of boosting returns for primary industries. We know trade underpins the
    profitability of the red meat sector. That’s why we’ve allocated $30.8 million to boost access to
    premium markets overseas and appoint five new agricultural counsellors in key markets.
    In addition to the three free trade agreements signed with some of our biggest trading partners,
    this government has also brokered access to seven new livestock markets; most recently
    China. We are investing $200 million to protect our biosecurity status – which underpins our
    strong trading position. ABARES recently estimated our biosecurity system saves the average
    Australian farmer up to $17,500 each year in lost profits, and protects producers from threats
    like Foot-and-mouth Disease, which could cost our economy more than $50 billion over a decade.
    The White Paper also delivers historic reforms to Country of Origin Labelling for food to ensure
    that Australian consumers are given accurate information about where their food comes from.
    On top of these investments in the future, we know some red meat producers are struggling
    in the present. Severe drought can place stress and strain on even well prepared and resilient
    producers and communities. That’s why there is a further $2.97 billion available to support
    farmers and rural communities to strengthen drought preparedness and risk management,
    as well as provide in-drought support when times are tough. We see these initiatives as an
    investment in a sector that continues to generate significant wealth for the Australian economy
    – it’s estimated total farm production will hit over $52 billion in 2014-15. But I can’t stress
    enough the importance of industry investing in itself and its future and that’s what this plan is.
    A strong industry is one that is able to harness its resources and work together cooperatively.
    This plan puts the red meat sector in the best possible position to take advantage of available
    opportunities and continue to prosper.
    The Hon Barnaby Joyce MP
    Minister for Agriculture
4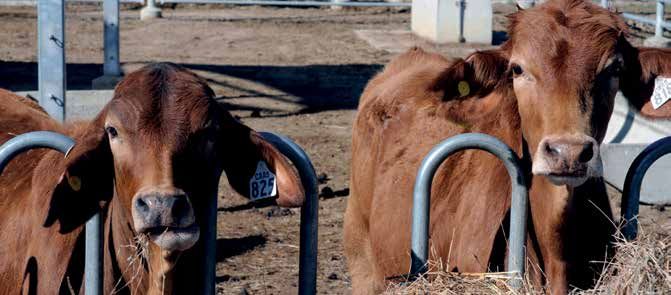
Message from the Chairman

The red meat and livestock industry is one of Australia’s largest and most important industries.
It is an export-oriented industry with an outward-looking global focus. It is proactive, resilient, a
world leader in many areas of the value chain, and a critical contributor to Australian agriculture.
Our industry’s success is vital to the ongoing vibrancy of much of regional and rural Australia,
and indeed the broader Australian economy.
The Red Meat Advisory Council (RMAC) has carriage for the development of the MISP to set
the overarching direction for the industry to 2020, and beyond. Over the next five years, the red
meat and livestock industry will invest more than $1 billion of industry and industry-government
monies into its future success. Where invested in research and development, that investment is
matched dollar-for-dollar by the Australian Government as part of its ongoing commitment to
the success of Australian agriculture in a globally competitive market. This is a key partnership
for our industry.
Beyond its financial investment, the industry will bring the focus and expertise of its people
to bear on some of the biggest issues and opportunities facing the industry. With an annual
turnover in excess of $20 billion, a processing sector ranking as the largest trade-exposed
manufacturing industry in Australia, and a production sector with custody over roughly half of            “Realising the
Australia’s land mass, the industry’s economic credentials and stewardship responsibilities go             opportunities
hand-in-hand.
                                                                                                          framed within
As should be expected from an industry of our size and importance, MISP 2020 is underpinned
by rigorous economic modelling and analysis of information. This has been derived from more
                                                                                                            MISP 2020
than 550 levy payers, industry experts, key stakeholders and community interest groups from              represents the
all sectors, including production, lot-feeding, live export, processing, retailing, research and
                                                                                                          most valuable
development, health and nutrition, education and extension, and State, Territory and Federal
Governments. Collectively, they have been key partners in bringing the strategy to life.                     return on
Importantly MISP 2020 provides comprehensive and quantified direction for industry                       investment we
investment, on a whole-of-industry basis, and the overarching framework for component and                can offer to our
contributing activities at supply chain and sector-specific levels. The economic basis to this
strategy is deliberate – at a time when all industries are facing increasing and/or increasingly
                                                                                                        industry, and the
complex external pressures (seasonal extremes, community scrutiny etc), a sound economic                community more
foundation is arguably even more important to longevity. Indeed, the baseline profitability of our
                                                                                                             broadly.”
industry is a critical component in ensuring our readiness and resilience in the face of future
challenges, and is fundamental to attracting and retaining the ‘best and brightest’ minds within
our workforce and leadership structures.
The potential value of this plan to our industry speaks for itself: if we are successful in
addressing the opportunities we could add almost $7 billion to our industry’s bottom-line by
2030; if we don’t effectively address the risks, we stand to lose just over $6 billion.
Realising the opportunities framed within MISP 2020 represents the most valuable return
on investment we can offer to our industry, and the community more broadly. For the industry
organisations responsible for leading and funding this investment, and for our co-investment
partners, success will require an on-going focus on performance. Above all else, our success
relies on a cultural commitment to co-operation and co-ordination in the delivery of the plan.
Our industry has good reason to be proud of its achievements and its historical success.
Implemented effectively, MISP 2020 will provide a roadmap to see the industry navigate the
challenges, and realise the opportunities, of the future.
Ross Keane
Chairman

                                                                                                                            5
The red meat and livestock industry:
    an Australian success story

    From the six cattle, 44 sheep and 19 goats that arrived with the First Fleet in 1788, the
    livestock and red meat industry has grown into one of Australia’s most valuable industries.
    Today, the direct contribution of the red meat and livestock industry to Australia’s gross
    domestic product is approximately $7 billion, making it a very significant contributor to the
    national economy.
                                                                                                                                     In 2014, by value,
    The red meat industry is Australia’s largest food manufacturer and a substantial employer
    in rural and regional areas, directly employing some 200,000 Australians on-farm, in meat
                                                                                                                                     Australia was the
    processing works and at wholesale and retail. And thousands more are involved in supplying                                         world’s largest
    the industry with services such as transport, supply of merchandise and other professional                                        exporter of beef,
    services.
                                                                                                                                       sheepmeat and
    While a relatively small player in global production terms, the industry nonetheless produces
    around 3% of the world’s beef, 5% of the world’s sheepmeat and 0.5% of global goatmeat                                               goatmeat.
    production. It is on the global export stage that the Australian industry makes a remarkable
    contribution to the world’s need for high quality protein. In 2014, by value, Australia was the
    world’s largest exporter of beef, sheepmeat and goatmeat. By number, Australia was also the
    world’s largest exporter of livestock.
    Likewise, the industry makes a vital contribution to Australia’s overall trade performance, in
    2014-15 generating $16 billion in export earnings and placing the industry in the top five
    Australian export industries.
    The industry also contributes extensively to the nation’s social and environmental objectives.
    As caretakers of around half the continent’s landscape, Australian red meat and livestock
    producers have a vested interest in continually improving sustainable farming practices. Indeed,
    greenhouse gas emissions intensity has been reduced by 14% over the last 30 years while
    red meat production levels have increased by more than 70% over that period. In addition, the
    industry has achieved a 42% reduction in emissions associated with vegetation protection and
    tree planting, and a 65% reduction in water use.

    Global player with strong national presence
    • Australia has about 2% of the world cattle and buffalo inventory, with India,              • Around 200,000 people are employed in the red meat industry,
      Brazil and China taking the top three places                                                 including on-farm production, processing and retail
    • Australia produces 4% of the world’s beef supply                                           • 53,200 are employed in meat processing
    • Australia has about 6% of the world sheep inventory, with China having the                 • 76,800 are employed in farm enterprises with cattle
      most sheep
                                                                                                 • 43,012 are employed in farm enterprises with sheep and lambs
    • Australia produces approximately 8% of the world’s lamb and mutton supply

    The total area operated by farms with beef cattle and lambs and sheep is around 52% of Australia’s land mass.

    Cattle                                                        Sheep                                                         Goats

6
    Sources: ABS Agricultural Commodities 2012-13, MLA 2014, MLA Beef and Sheep Fast Facts, MINTRAC Employment profile of the Australian Meat Industry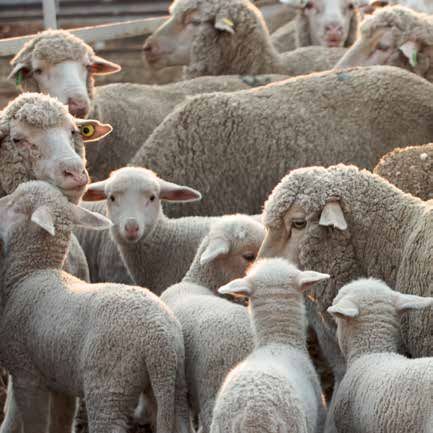
8

                                                                                                       $ billion
                                                                                                                    6

                                                                                                                    4

                                                                                                                    2

                                                                                                                    0
        Market growth                     Supply chain           Productivity
                                                                                                                         1995        2000         2005           2010        2014
             and                          integrity and             and
        diversification                     efficiency           profitability                                           Beef and veal        Sheep / Goatmeat          Live exports
side opportunity

                     Table 1. Key industry statistics (2014 figures unless otherwise stated)            Figure 2. Value of red meat, live export and co-product
                                                                                                        exports 1995–2014
                          Value of export sales (2014-15)*
                                                                                                                   18
                          Red meat
                                                                                                                   16
                            Sheepmeat and goatmeat                                  $2.9 billion
                            Beef and veal                                           $9.0 billion                   14

                            Live export                                             $1.6 billion                   12

                          Co-products                                                                              10

                                                                                                      $ billion
                            Offal                                                   $0.8 billion                    8
                            Hides/skins                                             $1.1 billion
                                                                                                                    6
                            Other                                                   $0.8 billion
                                                                                                                    4
                          TOTAL                                                    $16.1 billion
                                                                                                                    2
                          World ranking for total value of export sales*
                                                                                                                    0
                            Red meat                                                   No. 1                            1995-96     2000-01     2005-06     2010-11        2014-15

side opportunity            Sheepmeat and goatmeat                                     No. 1                             Red meat        Live exports       Co-products
                            Beef and veal                                              No. 1
                          Retail/food service value of domestic sales  #

                            Sheepmeat and goatmeat                                  $1.9 billion
                            Beef and veal                                           $5.9 billion
                          Export/domestic sales proportions (by volume)      #

                            Lamb/mutton/goatmeat                                      70/30
                            Beef and veal                                             75/25
                          Most valuable export markets (2014-15)*
                            United States                                           $4.0 billion
                            Japan                                                   $2.0 billion
                            China                                                   $1.1 billion
                            Korea South                                             $1.1 billion
                            Taiwan                                                  $0.9 billion
                          Herd flock statistics   #

                            Cattle herd size                                        29.1 million
                            Sheep flock size                                        72.6 million
                            Goat flock size (managed)                               0.5 million
                            Beef and veal production                             2.6 million tonnes
                            Sheepmeat and goatmeat production                    0.8 million tonnes
                            Average cattle (cw)                                       277 kg
                            Average lamb (cw)                                         21.9 kg
                     Sources:
                                * GTA, # MLA

                                                                                                                                                                                       7
OUTLOOK TO 2030:
    Significant challenges…and even greater opportunities

    THE OPPORTUNITIES:
    increasing global demand for volume and quality in red meat
    The world’s population is forecast to grow by more than one billion by 2030. Populations in the
    Asia Pacific region are expected to reach 4.6 billion by 2030, an increase of nearly 700 million
    people.
    Globally, real per capita incomes will increase by 60% to 2030. With red meat consumption and
    per capita income being closely related, this translates to an increase in red meat demand of                                                We require
    25% over that period, as well as an increase in demand from markets specifically seeking high                                             concerted focus
    quality red meat and livestock products. These forecasts present an enormous opportunity for
    Australia’s red meat and livestock industry in terms of geographical proximity to key markets,                                               and robust
    and as a recognised supplier of safe, nutritious and ethically-produced products.                                                        systems to support
    Figure 3. Global per capita consumption                                                                                                  greater integration
             20
                                                                                                                                             through
                                                                                                                                                  200 the supply

             18                                                                                                                                     chain.
                                                                                                                                                  180

             16                                                                                                                                                     160

             14                                                                                                                                                     140

                                                                                                                                               million tonnes cwe
             12                                                                                                                                                     120
    kg cwe

             10                                                                                                                                                     100

              8                                                                                                                                                        80

              6                                                                                                                                                        60

              4                                                                                                                                                        40

              2                                                                                                                                                        20

              0                                                                                                                                                            0
                  2000              2005               2010                     2015                2020                2025          2030                                      2000               2005            201

                         Sheepmeat and goatmeat              Beef            Poultry           Pork                                                                                    Sheepmeat and goatmeat      Bee

                                                             350                                                                                                               350

                                                             300                                                                                                               300

                                                             250                                                                                                               250

                                                                                                                                                                               200
                                                  Ac/kg lw

                                                                                                                                                                    Ac/kg lw

                                                             200

                                                             150                                                                                                               150

                                                             100                                                                                                               100

                                                              50                                                                                                               50

                                                                0                                                                                                                0
                                                                    2000        2005         2010        2015       2020       2025   2030                                           2000      2005       2010    2015

                                                                           Grainfed cattle            Grassfed cattle                                                                       Lamb      Mutton and goat

8
THE CHALLENGES:
driving efficiency and integrity through the value chain
Australia’s competitors are on the move:
• Growth in consumption of chicken (29% to 2030) and pork (27%) will continue to outpace
growth in consumption of red meats (16%).
• South American countries will be significant competitors to Australia in a number of beef
markets expected to expand over the next 15 years. It will be critical to maintain a premium
integrity and quality image for Australian red meat in these markets, with this image
underpinned by robust integrity systems that engender complete confidence.
Figure 4. Global meat production
200
180
160
140
million tonnes cwe
120
100
80
60 A productivity
40 challenge
20 continues to face
2030
0
2000 2005 2010 2015 2020 2025 2030 the Australian
Sheepmeat and goatmeat Beef Poultry Pork industry, both
on- and off‑farm.
A productivity challenge continues to face the Australian industry, both on- and off-farm.
Off‑farm costs are consistently higher than all of our major competitors, while on-farm
productivity performance is now below productivity improvements being secured by our major
competitors.
When combined with the forecast background of declining real prices for livestock, the onus
on the production sectors to exhaust existing – and find new – pathways to productivity is
350
arguably stronger than ever before. This is an on-going challenge for our industry.
300
Over many years, our industry has invested in the technologies and systems that have built
250
our reputation as a high-quality, safe, ethical and sustainable producer of red meat and
livestock.
200 Our work and commitment to maintain and improve our integrity systems underpins
Ac/kg lw
our international reputation. Continuing to invest and innovate in this area is fundamental.
150
We require concerted focus and robust systems to support greater integration through the
supply100
chain, especially with respect to increasing the connectivity and responsiveness of our
industry
50to its customers, and the broader community.
The outlook
0 to 2030 points to on-going nominal growth in the value of the Australian red meat
2030 2000 2005 2010 2015 2020 2025 2030
and livestock industry. All other elements being equal, however, the prolonged period of herd
Lamb to offset
rebuilding required Mutton andrecord
the goat cattle slaughter levels of 2014 will limit our industry’s
ability to capitalise on the increase in global demand for red meat products.
9140 140
million tonnes cwe
million tonnes cwe
120 120
100 100
80 80
60 60
40 40
20 20
0 0
2005 2010 2010 2015 2015 2020 2020 2025 2025 2030 2030 2000 2000 2005 2005 2010 2010 2015 2015 2020 2020 202
at and goatmeat
meat Beef Beef
Poultry Poultry
Pork Pork Sheepmeat
Sheepmeat and goatmeatand goatmeat
Beef Beef
Poultry Poultry
Pork Pork
The opportunities out to 2030 are clear but our industry’s ability to realise these opportunities
20 20
will not happen without concerted and consistent effort. Just as these global trends provide
18 18
opportunities for Australia, they also provide opportunities for our competitors. We must be
proactive and pursue the opportunities for our industry relentlessly. 16
We must16 focus on profitability,
quality and integrity in our practices and products, and harness our 14
resources
14 accordingly.
12 12
Figure 5. Australian real cattle prices Figure 6.10Australian real sheep and goat prices
lt cwe
lt cwe
10
350
350 350 8 350 8
300 6 300 6 300
300
250 4 250 4 250
250
2 200 2 200
Ac/kg lw
Ac/kg lw
200
Ac/kg lw
Ac/kg lw
200
0 0 150
2005 150 2010 1502015
2010 2015 2020 2020 2025 2025 2030 2030 150
2000 2000 2005 2005 2010 2010 2015 2015 2020 2020 202
100 Poultry Pork
at meat Beef100 Beef Poultry Pork 100 Sheep100
Sheep
and goat and
meatgoat meat Beef Beef Poultry Poultry Pork Pork
50 50 50
50
0 0 0 0
2000 2000
2005 2005
2010 2010
2015 2015
2020 2020
2025 2025
2030 2030 2000 2000
2005 2005
2010 2010
2015 2015
2020 2020
2025 2025
2030 2030
Grainfed cattle
Grainfed cattle Grassfed cattle
Grassfed cattle Lamb Lamb Mutton and goat
Mutton and goat
Figure 7. Projected change in the cattle herd and sheep flock Figure 8. Forecast baseline growth in net industry income
35 35 100 100 8 8
7 7
30 30 90 90
6 6
million head sheep
million head cattle
million head sheep
million head cattle
25 25 80 80
5 5
$ billion
$ billion
20 20 70 70 4 4
3 3
15 15 60 60
2 2
10 10 50 50
1 1
5 5 40 40 0 0
2000 2000
2005 2005
2010 2010
2015 2015
2020 2020
2025 2025
2030 2030 2013-142013-14
2017-18 2017-18
2021-222021-22
2025-262025-26
2029-302029-30
Cattle (LHS)
Cattle (LHS) Sheep (RHS)
Sheep (RHS) Nominal termsReal terms*
Nominal terms Real terms*
* Baseline* Baseline
growth (netgrowth
industry industry growing
(net income) income) growing in terms
in nominal nominal terms
and ~flatand ~flat
in real in real terms
terms
10Key messages
• The future of the red meat and livestock industry is one of valuable opportunities and
significant threats – neither can be ignored if we are to maintain a sustainable and
competitive presence. There is almost a 50/50 split between the benefits associated with
capitalising on upside opportunities and those associated with mitigating downside risks
(Figures 9 and 10).
• Realising the full economic potential framed within MISP 2020 requires a combination of
actively mitigating risks which could either reduce demand for our products and/or
impose impediments to productivity. We must also capitalise on opportunities associated
with more efficiently supplying and building demand.
• A key to the industry’s success will be our ability to optimise the systems, technologies and
practices within our immediate control. Of increasing importance is our ability to ensure Our industry’s
these elements are used to actively align our practices with consumer and community true competitive
expectations. Such alignment is a two-way street, and necessitates an on-going
commitment to objectivity and transparency in communicating – and building understanding
advantage lies
around – our industry’s activities and performance. in the quality
• We must increase our rate of productivity growth – an irrefutable part of performance and integrity of
in any business. But this focus alone will not get the industry ahead of the curve, nor will it its products and
protect us from increasingly aggressive competition for market share. Our industry’s true
competitive advantage lies in the quality and integrity of its products and systems. systems.
We must accelerate this focus, guarantee its veracity and actively pursue and differentiate
markets that value, and will pay for, these credentials.
• We must identify and implement industry systems that can objectively measure, transfer
and drive product value and integrity throughout the supply chain. This includes the need
for timely and precise communication between our customers and our supply systems.
• We must develop systems and policies to underpin the industry’s need to differentiate
prices according to defined performance against key quality, yield and integrity attributes
(value-based marketing), as assessed by objective measurement and assurance
systems. These endeavours will support the industry to transition from price-averaging
systems, and will require the support of whole-of-supply-chain electronic data exchange
capability, with open and transparent access by all relevant parties.
11• The capability and profitability of our industry are intrinsically linked: a profitable,
resilient industry attracts the ‘best and brightest’ minds; such talent and expertise helps
build profitability and resilience. We must continue to build a performance culture
and business skills throughout our industry. This includes providing and packaging
information and training to support informed and business-oriented decision-making
by all participants, especially in the production sectors.
• We must continue to enhance and ensure the veracity of, our whole-of-supply-chain
quality and integrity systems and aggressively promote these virtues to our customers.
The success of these systems, and indeed a large number of essential investment
We must continue
imperatives, requires a co-ordinated, whole-of-supply chain approach. to enhance
• We must acknowledge that the biggest non-economic challenge facing our industry and ensure the
is cultural change – this is a far greater task than delivering any related technologies. veracity of, our
Our enterprises, supply chains and industry as a whole must engender, support and reward
a business and customer focus. Industry organisations must lead by example in promoting whole-of-supply-
collaboration and transparency across our industry. These are essential operating chain quality and
criteria if we are to fully realise the value on offer in MISP 2020, and if we are to cement
community and consumer – and levy-payer – confidence in the industry.
integrity systems
and aggressively
• Economic modelling indicates that available industry funding is less than that required
to achieve the maximum potential industry benefits associated with the investment promote these
imperatives in MISP 2020. Based on the need to optimise benefits to the industry in-line virtues to our
with the consultative feedback and analysis that underpins this plan, a range of strategic
investment changes are recommended, including: customers.
−− Increased investment in improving information flow and traceability that underpins
business decisions through the supply chain;
−− Increased investment on improving livestock and product assurance and specification
compliance;
−− Reduced investment in marketing and promotion in developed markets; and
−− Re-focussed investment specifically to improve the decision making in farm businesses
to support better farm business performance.
Figure 9. Forecast value of risks and opportunities (by pillar) to 2030*
4.0 1.0
0.5
3.0
0
2.0
-0.5
1.0
-1.0
$ billion
$ billion
0 -1.5
-2.0
-1.0
-2.5
-2.0
-3.0
-3.0
-3.5
-4.0 -4.0
Consumer and Market growth Supply chain Productivity Welfare of the animals
community and efficiency and and within our care
* Relative to the baseline net industry
support diversification integrity profitability
income increase of $48,320 million
Downside risk Upside opp
Downside risk Upside opportunity by 2030 (in 2015 dollars and 5%
real rate of return)
5.0 100 2.5
12 4.0 80
2.0
3.0 60
2.0 40 1.5$
$
-2.0
$
-1.0 -1.0
-2.5
-2.0 -2.0
-3.0
-3.0 -3.0
-3.5
-4.0 -4.0 -4.0
Consumer and Market growth Supply chain Consumer and
Productivity Market growth Welfare ofSupply chain
the animals
community and efficiency and andcommunity and within integrity
our careand
support diversification integrity support
profitability diversification efficiency
Downside risk Upside opp
Downside risk Upside opportunity Downside risk Upside opportunity
Figure 10. Forecast value of risks and opportunities to 2030 (by supply chain)*
5.0 120 100 2.5
4.0 100 80
2.0
3.0 80 60
2.0 60 40 1.5
1.0 40 20
$ billion
$ million
$ million
$ billion
1.0
0 20 0
-1.0 0 -20
0.5
-2.0 -20 -40
-3.0 -40 -60 0
-4.0 -60 -80
-5.0 -80 -100 -0.5
Efficiency and va
Beef / Cattle Sheep / Sheepmeat Goats / Goatmeat Goats / Goatmeat
trade and market a
(right axis)
Downside risk Upside opportunity Downside risk Upside opportunity
Downside risk Upside opp
*Relative to the baseline values (as tabled) for each supply chain by 2030
Baseline net income increases by 2030
$m
Cattle / Beef 32,675
Sheep / Sheepmeat 15,164
Goats / Goatmeat 481
Definitions
‘Baseline’ is the future position that would arise if forecast industry and global trends were realised and current
investment activities were continued. MISP modelling quantifies gains and losses relative to this position.
‘Downside risk’ is the forecast loss in net industry income that would result from loss in demand (including
reduced product price) and/or loss in productivity (including increased input costs) if industry were to completely
disinvest from defensive activities or if industry investment was not successful in mitigating the potential loss.
‘Upside opportunity’ is the forecast additional net industry income that would result from increases in demand
(including increased product price) and/or increases in productivity (including reduced input costs) derived from
active investment to grow and build the industry’s value. Unlike defensive investments aimed at mitigating risk,
these are offensive investments to improve the industry’s reputation and position.
‘Net industry income’ is an economic measure used to accurately describe net income through the entire supply
chain (farm + feedlot + processing + live export sectors). Specifically, ‘net industry income’ equals:
Net income from the farm and feedlot sectors
– namely total livestock receipts less total cash costs (including hired labour wages)
+
Net income from the processing and live export sectors
– namely total revenues less livestock costs and operating costs.
Note: net industry income is not a proxy for individual enterprise profitability
‘Net MISP Benefits’ are the total (net) changes in forecast net industry income derived from investment under
MISP. Net MISP benefits equate to the total value derived from investments to offset ‘downside risk’ and capitalise
on ‘upside opportunity’.
‘Benefit:cost ratio (BCR)’ is a measure of potential investment return for each dollar invested cumulatively over
the full plan period. Importantly, and especially in the context of the MISP economic analyses, BCRs should not be
used as a sole determinant of the industry’s optimal portfolio mix across all investment areas.
13Structuring our effort – building the plan
Setting the foundations
As a strategy that frames over $1 billion in industry and Figure 11. Core focus areas in developing MISP 2020
industry‑government investment over the life of the plan,
MISP 2020 has been developed through careful planning,
consultation and comprehensive economic analysis.
Create Foster
An independent review of the design and industry awareness engagement
performance against the previous strategic plan was
undertaken in 2013. Key recommendations arising from that MISP
review formed the basis of this plan, including: 2020
• The need for increased rigor and objectivity
in identifying key priorities;
Drive Build
• Clear definition and allocation of responsibilities in the commitment ownership
strategy’s implementation; and
• The establishment of key performance indicators
(KPIs) and a dedicated monitoring and evaluation
system to respectively direct and communicate investment Deliver
performance. outcomes
Industry engagement to build ownership
In developing MISP 2020, RMAC co-ordinated and hosted consultation activities across
Australia. This included engaging more than 550 industry and community leaders, levy payers,
co‑investors and service providers – the collective feedback from whom formed the ‘skeleton’
structure of the strategy. To capture grassroots input into the strategic direction of the industry,
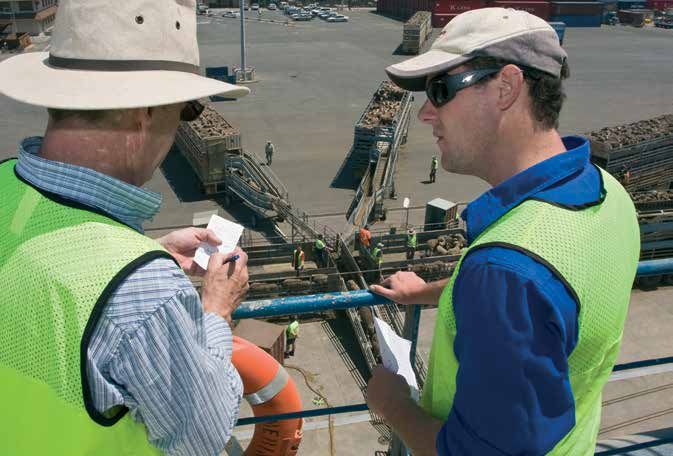
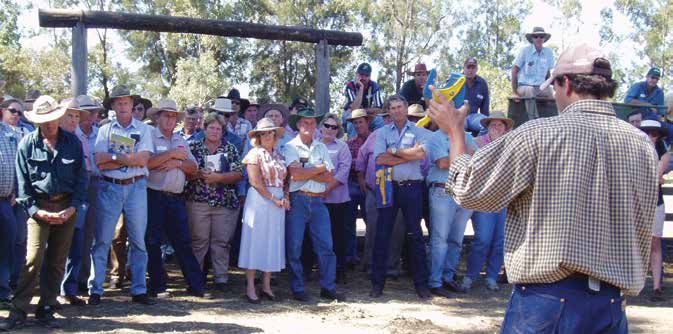
these activities included twelve regionally-based workshops specifically engaging producers,
processors and exporters of Australian red meat and livestock.
Nine teams of technical experts (comprising more than 120 subject specialists) were then
convened to quantify and refine a portfolio of strategic priorities, and to develop investment
imperatives and quantify their costs and benefits in delivering against this structure. These
discussions formed the basis of inputs to comprehensive economic modelling.
Figure 12. Industry consultation workshops underpinning MISP 2020
Who was consulted?
550+ participants
at 20 workshops
Producers
Processors
Live exporters
Technical specialists
Community groups
14Quantifying the potential – investing for optimum returns
to the industry
The development of MISP 2020 is underpinned by a level of objectivity and economic modelling
that has been absent since the development of the industry’s first plan in 1996. The modelling
activities that form the foundation of this plan have been provided by the Centre for International
Economics (CIE), an independent consultancy that specialises in economic analysis.
The modelling methods used in identifying the key investment areas under MISP 2020 are highly
sophisticated and specifically designed to account for the significant inter-relationships between The modelling
our industry’s sectors. In addition, the methods used to determine the key investment priorities
for the industry are capable of accounting for effectively any situation that causes changes in
methods used in
the levels of demand and/or efficiency of supply for Australian red meat and livestock. As such, identifying the
factors that may not have a readily identifiable economic basis (like changes in community key investment
support for our industry) can be assessed in terms of their relative economic importance.
areas under MISP
Importantly, the approach used to identify the relative payoffs of various investments for
the red meat and livestock industry as a whole has been additionally used to quantify the 2020 are highly
respective economic value to each sector of industry. As such, these outputs now provide sophisticated
an unprecedented level of detail to inform the development of individual industry and
sector‑specific investments to be undertaken during the course of MISP 2020.
and specifically
designed to account
The adage “you can’t manage what you can’t measure” is no less applicable to a whole-of-
industry strategic plan than it is in business. In an industry as large as ours, quantifying baseline for the significant
and target performance in a meaningful way does present some challenges – as such, parts of inter-relationships
the reporting platform for MISP 2020 will be developed over time.
between our
Wherever possible, the targets within MISP 2020 have been defined in a ‘SMART’ format –
“specific, measurable, achievable, realistic and time-bound”. In some areas, such measures do industry’s sectors.
not currently exist, especially at a whole-of-industry level – these are identified in the KPI tables
that follow (page 19 onwards). In these cases, efforts have been made to identify the focus of
suitable measures; these will be developed in the first year of the plan’s implementation.
MISP 2020 does not seek to frame each and every possible mechanism by which to pursue
the industry’s priorities; rather, it frames those imperatives that have been found to have, on an
economic basis, the most significant impact on the industry’s priorities. The linkages that are
evident between sectors and between priorities highlight the advantage to pursuing these in a
collective and co-ordinated way.
15Figure 13. MISP 2020 framework
CONSUMER AND MARKET GROWTH AND
COMMUNITY SUPPORT DIVERSIFICATION
LEADERSHIP AND COLLABORATIVE CULTURE
Welfare of the animals within our care Stewardship of environmental resources Red Efficiency and value in
meat in trade and market access
a healthy
diet
BUILDING INDUSTRY CAPABILITY
Continuous Minimising Minimising Minimising Sustainable Adapting Positioning Reducing Reducing
improvement risk and the impact industry management to climate red meat as economic technical
of animal impact of of endemic impact of the natural variability a preferred barriers to barriers to
welfare emergency disease on the resource component trade trade
disease environment base in a healthy
diet
PROMOTING AND PROTECTING OUR INDUSTRY
Table 2. Distribution of changes in net industry income* by pillar to 2030 (total MISP)
Downside Upside
PILLAR Baseline Net MISP benefits
risk opportunity
$m $m $m $m BCR
Consumer and community support -3,898 220 4,118 13.4
Market growth and diversification -277 2,966 3,192 5.4
48,320
Supply chain efficiency and integrity -2,086 1,361 3,447 6.4
Productivity and profitability 0 2,113 2,113 6.9
TOTAL PLAN 48,320 -6,211 6,660 12,871 7.4
* Refer to page 13 for definitions
16SUPPLY CHAIN EFFICIENCY PRODUCTIVITY
AND INTEGRITY AND PROFITABILITY
Marketing and promoting Australian red meat Optimising product quality Guaranteeing Production efficiency in Processing Live export
and livestock and cost efficiency product and farms and feedlots productivity productivity
systems
integrity
Marketing Marketing Marketing Improving Improving Livestock Decision Increasing Increasing Improving
and and and quality and efficiencies and product support to livestock access to, livestock
promotion – promotion promotion compliance in regulation, assurance improve productivity and the performance
developing – developed – domestic via infrastructure through farming through new efficiency of, in export
export export market enhanced and logistics integrated businesses research labour operations
markets markets supply chain integrity
information systems
17Focussing our efforts – core investments
CONSUMER AND COMMUNITY SUPPORT FOR THE INDUSTRY’S PRODUCTS AND
PRACTICES
Improving the way we operate to gain consumer and community support for our industry,
our activities and our products.
Key issues
• Overall public interest in animal welfare, environmental impact and dietary nutrition is increasing. Major overseas
customers and segments of the Australian community are recognising the increasing public interest in these areas and
are responding accordingly.
• There is an opportunity and a need for industry to improve the level and consistency of our engagement with the
community in setting welfare and environmental standards.
• Vigilance in disease control (for both exotic and endemic diseases) remains critical to improving welfare. For the most
part, this also translates to economic benefits.
Addressing the issues
To be achieved through three priority areas and seven imperatives:
• Welfare of the animals within our care
−− Continuous improvement of animal welfare
−− Minimising risk and impact of emergency disease
−− Minimising the impact of endemic disease
• Stewardship of environmental resources
−− Minimising industry impact on the environment
−− Sustainable management of the natural resource base
−− Adapting to climate variability
• Red meat in a healthy diet
−− Positioning red meat as a preferred component in a healthy diet
Industry benefits on successful achievement of objectives
• By 2020: the estimated total gain is $0.72 billion with a BCR 6:1
• By 2030: avoiding potential accumulated losses of $3.90 billion and gaining an additional $0.22 billion in benefits –
a total gain of $4.12 billion with a BCR 13:1
Figure 14. Forecast value of risks and opportunities to 2030
(Consumer and community support investment priorities)*
1.0
0.5
0
-0.5
-1.0
$ billion
-1.5
-2.0
-2.5
-3.0
-3.5
-4.0 * Relative to the baseline net industry
Welfare of the animals Stewardship of Red meat in a
income increase of $48,320 million
within our care environmental resources healthy diet
by 2030 (in 2015 dollars and 5%
Downside risk Upside opportunity real rate of return)
18Key Performance Indicators and supporting industry objectives to be achieved
PILLAR PRIORITY IMPERATIVE
Title KPI Title KPI Title Objectives to be achieved
• Active alignment of farm animal welfare practices and
community expectations
• Indicators of animal welfare developed along the entire
Continuous livestock supply chain
improvement of animal • Monitoring and reporting framework established to
welfare identify problems, enable corrective actions and capture
improvements
• Effective communication of changes in the industry’s animal
Increase in community welfare outcomes, engendering community support
Welfare of the support for industry
animals within animal welfare • NLIS traceability results in simulation exercises meet agreed
our care practices on 2015 standards
baseline Minimising risk and • R&D vaccines are available to meet relevant strains of FMD,
impact of emergency and other relevant emergency diseases
disease • Preparedness plans for an emergency disease outbreak are
maintained and regularly tested, including communications
CONSUMER AND COMMUNITY SUPPORT
Consumer and community support index*
readiness
• Vaccines and other measures are developed to reduce
Minimising the impact costs of endemic diseases, including ticks in cattle and
of endemic disease parasites in sheep, by $50 million by 2020 and $250 million
by 2030
• Participate in global partnerships to conduct R&D that
provides technical solutions to convert 25% of the energy
lost in methane emissions into gains in animal productivity
Minimising industry by 2030 with demonstrable progress towards this goal by
impact on the 2020
environment
• Develop new methodologies under Carbon Farming
Maintenance Initiatives to capture revenue from carbon credits of $30
or increase in million by 2020 and $80 million by 2030
Stewardship of
community support
environmental • Alignment of NRM practices with community expectations
for the industry’s Sustainable
resources • R&D results in savings in industry costs due to weeds and
environmental management of the
stewardship practices natural resource base feral animals of at least $50 million by 2020 and $150
million by 2030
• R&D into improved livestock and pasture genetics, and
improved climate forecasting, provides technical solutions
Adapting to climate
to mitigate 80% of the potential productivity falls due to
variability
climate change (-3.5% by 2020 and -5.2% by 2030),
particularly in the southern beef and sheepmeat industries
Continued
consumer and health
Positioning red meat as • Government policy and health professionals continue to
Red meat in a professional support
a preferred component support the inclusion of red meat three to four times per
healthy diet for red meat as a
in a healthy diet week consistent with the Australian Dietary Guidelines
preferred component
of a healthy diet
* To be developed
19MARKET GROWTH AND DIVERSIFICATION FOR AUSTRALIAN RED MEAT AND LIVESTOCK
Gaining competitive access to global markets with customer and consumer preference for our
products based on quality and integrity systems.
Key issues
• We are an export industry and must be focussed on reducing barriers to trade. There are opportunities to build on past
progress, particularly recent FTAs with key trading partners. The expectation is for substantial further progress in reducing
economic barriers over the next five years.
• As economic barriers fall, there will likely be an increase in technical barriers for both meat and live animals – currently
costing $1.3 billion annually – that will require a greater proportion of market access effort over the life of this plan.
• Marketing and promotion in export markets will focus on developing markets and the industry’s underpinning quality
and safety systems. Commercial parties should undertake the lion’s share of effort in developed export markets –
again underpinned by industry quality and safety systems.
Addressing the issues
To be1.0achieved through two priority areas and five imperatives:
• 0.5
Efficiency and value in trade and market access
−−0 Reducing economic barriers to trade
-0.5
−− Reducing technical barriers to trade
-1.0
• Marketing and promoting Australian red meat and livestock
$ billion
-1.5
−− Marketing and promotion – developing export markets
-2.0
−− Marketing and promotion – developed export markets
-2.5
−−
-3.0 Marketing and promotion – domestic market
-3.5
Industry benefits on successful achievement of objectives
-4.0
• Welfare
By 2020: the of the animals
estimated Stewardship
total gain is $1 billion of
with a BCR 4:1 Red meat in a
within our care environmental resources healthy diet
• By 2030:Downside
industry
riskcan avoid
Upsidepotential
opportunityaccumulated losses of $0.23 billion and gain an additional $2.97 billion in benefits
– a total gain of $3.19 billion with a BCR 5:1
Figure 15. Forecast value of risks and opportunities to 2030
(Market growth and diversification investment priorities)*
100 2.5
80
2.0
60
40 1.5
20
$ billion
$ million
1.0
0
-20
0.5
-40
-60 0
-80
-100 -0.5
Efficiency and value in Marketing and promoting * Relative to the baseline net industry
trade and market access Australian red meat and livestock income increase of $48,320 million
by 2030 (in 2015 dollars and 5%
Downside risk Upside opportunity real rate of return)
20Key Performance Indicators and supporting industry objectives to be achieved
PILLAR PRIORITY IMPERATIVE
Title KPI Title KPI Title Objectives to be achieved
• Through progress in reducing economic barriers to trade, new
Reducing
market opportunities are made available worth $50 million by
New market economic barriers
2020 and $750 million by 2030 with stakeholders satisfied with
Efficiency and opportunities are to trade
service providers’ contribution to these results
value in trade made available
Maintain or increase in the real value of red meat sales (domestic and export)
and market worth $150 million • Through progress in reducing technical barriers to trade new
access by 2020 and market opportunities are made available or cost savings achieved
Reducing technical
$1 billion by 2030 worth $100 million by 2020 and $250 million by 2030 with
barriers to trade
stakeholders satisfied with service providers’ contribution to these
results
MARKET GROWTH AND DIVERSIFICATION
• Surveys demonstrate that the trade (importers, retailers, food
service operators) in developed and developing export markets is
Marketing and prepared to pay a price premium for Australian red meat compared
promotion – to other import competitors based on perceptions of food safety,
• Improved developing export integrity and quality
and live exports
consumer attitude markets • Australian red meat exporters are highly supportive of industry
(weighted marketing activities in developed and developing export markets,
by market as revealed by surveys
expenditure)
Marketing towards • Surveys demonstrate that importers, supermarkets and mid to high
and Australian end food service operators in developed and developing export
Marketing and markets have an increased awareness and understanding of MSA
promoting red meat and
promotion –
Australian livestock • Demonstrated independent evidence that industry marketing
developed export
red meat and markets efforts in developing export markets are providing a return to
• Increase in
livestock Australian livestock producers of $6 for every dollar of expenditure
wholesale
and $3 for every dollar of expenditure in developed markets
red meat and
livestock demand • Increased sales impact from promotional campaigns (domestic
index* market)
Marketing and • Positive shifts in consumer attitudes to beef and lamb (domestic
promotion – market)
domestic market • Demonstrated evidence that industry marketing efforts are
providing a return to Australian livestock producers of $2.50 for
every dollar of expenditure (domestic market)
* To be developed
21SUPPLY CHAIN EFFICIENCY AND INTEGRITY ACROSS OUR INDUSTRY
Enhancing and ensuring the integrity of our whole of supply chain quality/integrity systems and paying
all sectors in the supply chain on objective performance.
Key issues
• We must identify and develop industry systems that objectively measure key quality and integrity specifications in all
sectors of the supply chain and our industry language must incorporate these changes on an ongoing basis.
• We must differentiate prices received based on delivering performance against key quality and integrity specifications
(value based marketing), underpinned by systems that provide an incentive to innovate.
• We must have a whole of supply chain electronic data exchange capability that supports our industry specification, quality
and integrity systems with open and transparent access by all relevant parties.
• We must ensure our integrity systems deliver the products that we promise.
Addressing
1.5 the issues
To be
1.3achieved through two priority areas and three imperatives:
• Optimising
1.1 product quality and cost efficiency
− − Improving quality and compliance via enhanced supply chain information
0.9
−− Improving efficiencies in regulation, infrastructure and logistics
$ billion
0.7
• Guaranteeing
0.5
product and systems integrity
−− Livestock and product assurance through integrated integrity systems
0.3
Industry
0.1 benefits on successful achievement of objectives
• By
-0.1 2020: the estimated total gain is $0.44 billion with a BCR 2:1
Production efficiency in Processing productivity Live export productivity#
• By 2030: industry
farms andcan avoid potential accumulated losses of $2.09 billion and gain an additional $1.36 billion in benefits
feedlots
– a totalDownside
gain of risk
$3.45 billion
Upside with a BCR 6:1
opportunity
Figure 16. Forecast value of risks and opportunities to 2030
(Supply chain efficiency and integrity investment priorities)*
1.5
100
80
1.0
60
40 0.5
20
$ billion
$ million
0
0
-20
-0.5
-40
-60 -1.0
-80
-100 -1.5
Optimising product qualilty Guaranteeing product and * Relative to the baseline net industry
and cost efficiency systems integrity income increase of $48,320 million
by 2030 (in 2015 dollars and 5%
Downside risk Upside opportunity real rate of return)
22Key Performance Indicators and supporting industry objectives to be achieved
PILLAR PRIORITY IMPERATIVE
Title KPI Title KPI Title Objectives to be achieved
• Quantified improvement • Changes are implemented to the meat and livestock
in MSA-graded specification language to achieve improved alignment through
carcases: the supply chain with end user requirements
– Increase • Tools are developed to provide objective and accurate
beef MSA Index measurement of all key attributes included in the meat
language
• 2 MSA points
Improving quality • MSA research results are available in key beef export markets
SUPPLY CHAIN EFFICIENCY AND INTEGRITY
by 2020
and compliance via to underpin market development
• 5 MSA points
Supply efficiency and integrity index*
Optimising enhanced supply • Performance against key quality, yield and integrity attributes
by 2030
product chain information is made available across the entire supply chain, packaged to
– Improve
quality facilitate optimal business decisions
sheepmeat quality
and cost • Commercial supply chains implement payment options that
efficiency • 2 MSA points
reflect real value differences across key attributes
by 2020
• Accurate and timely industry wide statistical information,
• 6 MSA points
analysis and forecasts are made available to the satisfaction of
by 2030
stakeholders to facilitate optimal decision making
• By 2030: 35% of all Improving
Australian cattle and • Industry analysis and representational activities result in annual
efficiencies
sheep supplied direct- savings being achieved of $10 million through reducing
in regulation,
to-works are paid on a regulatory burden or addressing infrastructure or logistical
infrastructure and
quality and yield basis bottlenecks
logistics
• As technological advances become available and as customer
Guaranteeing Livestock and requirements change, ongoing development of red meat
• Industry standards for and livestock integrity systems occurs to the satisfaction of
product and product assurance
compliance are met at stakeholders
systems through integrated
all times
integrity integrity systems • Integrity systems along the entire supply chain are capable of
being electronically based and are fully integrated by 2020
* To be developed
23You can also read