2020 Asset Management Plan Update - www.topenergy.co.nz - Top Energy
←
→
Page content transcription
If your browser does not render page correctly, please read the page content below
2020
     Asset Management Plan
                   Update

www.topenergy.co.nz
INTRODUCTION

Introduction
It gives me great pleasure to present this Update to Top Energy’s 2019 Network Asset Management Plan (AMP).
Our 2020 AMP Update has been prepared in compliance with the Commerce Commission’s Electricity
Distribution Information Disclosure Determination 2012 and includes updated regulatory schedules to cover the
planning period commencing on 1 April 2020 and ending on 31 March 2030 (FYE 2021-30). It also documents
material changes to the asset management strategies, levels of service, network development and lifecycle asset
management plans described in our 2019 AMP and confirms that the strategies unchanged from our 2019 AMP
are still appropriate. It is not a stand-alone document and should be read in conjunction with our 2019 AMP.
The 2019 AMP, as updated by this 2020 AMP Update, remains the core asset management planning and
operations document for our electricity transmission and distribution network. It details our planned
inspection, maintenance and capital replacement strategies for the next ten years, as well as the targeted
service levels that we plan to deliver to our customers.
This is an exciting time for the Top Energy Group. Construction of the fourth generating unit (OEC4) at our
Ngawha geothermal power station is well underway and we are on track to commission this unit in October
2020, eight months earlier than originally planned. We also have consent to construct a fifth unit (OEC5), and
in the event that we decide to proceed, it could be commissioned by late 2025. If this expansion is completed,
the generating capacity of the power station will increase from its current 25MW to more than 88MW and all
of the electricity requirements for the Far North would be generated within our supply area. This would enable
us to develop a more sustainable, cost-efficient infrastructure that provides higher-value services to our
consumers. It should protect our consumers from the impact of rising transmission charges since, with the
expansion of Ngawha, our transmission connection will primarily be used to export energy south and we expect
the cost of this connection to be paid by the users of this exported energy.
We are also pleased that the Electricity Authority has exempted the new Ngawha units from the cross-
ownership requirements of the Electricity Industry Act 2010 to allow the new generation unit to be embedded
in our network rather than directly connected to the national transmission grid. This will avoid the construction
of additional assets that would have provided no clear technical benefit and will consequently reduce the cost
of electricity to consumers.
Our Board has approved a Strategy Map for the Top Energy Group, which sets out the Group’s mission, vision
and values, and underpins everything that we do. Each operating division within the Group has developed its
own strategic vision, which interprets the Group’s mission and vision for the business unit’s activities and
delivers on the Group’s core values and high-level corporate objectives.
Top Energy Networks’ mission is: To provide a safe, secure, reliable, and fairly priced supply of electricity to
consumers in the Far North. Its vision is to: Enable consumers to take greater control over their business and
home energy supply needs by developing secure; two-way energy flow; load information and management
solutions.
Our ten-year asset management strategy through to FYE 2030 has been developed in accordance with this
mission and vision and, being mindful of our corporate values and objectives, has addressed a range of strategic
challenges. These include:
•   Providing a secure supply to the North. We have now installed sufficient diesel generation in the Kaitaia
    area to supply all small-use consumers during maintenance shutdowns of the 110kV Kaikohe-Kaitaia line.
    When construction of the 110kV circuit between Wiroa and Kaitaia is completed in FYE 2030, supply to the
    north will become fully secure and we will be able to supply consumers in the Far North with renewable
    energy sourced from Ngawha under all reasonable network contingencies.
•   Connection of the expanded Ngawha power station. We are constructing a new 110kV line to deliver the
    power generated by the OEC4 unit at Ngawha to our 110kV switchyard at Kaikohe substation. In the event
    that OEC5 is commissioned in 2025 we will have upgraded the injection voltage at Wiroa to 110kV, so the
    power station will be fully embedded into our network by being directly connected to both Kaikohe and
    Wiroa.
•   Improvement in supply reliability. Protection upgrades completed in FYE2017 have substantially reduced
    the impact of 33kV subtransmission network faults on supply reliability. Our reliability improvement
    initiatives are now focusing on our 11kV distribution network. We have set ourselves a target of improving

                                                            1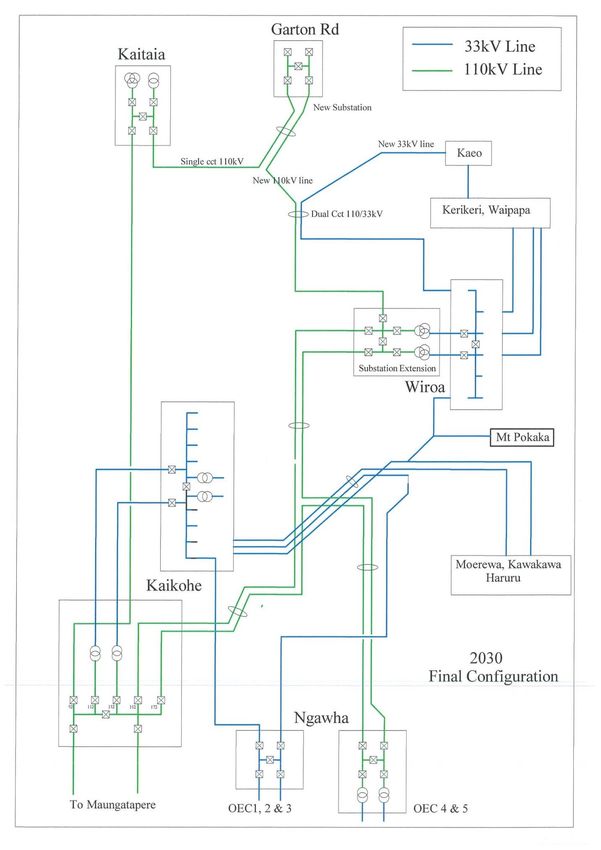
INTRODUCTION

    our supply reliability to a level comparable to that reported by similar rural New Zealand distribution
    businesses by the end of this AMP planning period and have developed a comprehensive reliability
    improvement plan to achieve this.
•   Maintenance. We are transitioning from a largely age based process for prioritising maintenance and asset
    renewals to one based on the use of industry-standard asset health indicators. Asset health is a function of
    both asset condition, determined by our asset inspection programme, and asset criticality, which reflects
    the consequences of an in-service asset failure. This will over time lead to better targeting of our
    maintenance expenditure and a reduction in the SAIDI impact of faults due to asset failures.
•   Meeting the challenges of new technology. We have installed an Advanced Distribution Management
    System (ADMS) that uses the latest available technology. When fully implemented, this will significantly
    increase the level of automation in our management of network outages and increase worker and public
    safety by reducing the risk of operator error. It will also be used to optimise the use of the diesel generation
    that we have added to our network. Over time, the system will be further developed to ensure that we are
    well positioned to embrace emerging technologies that are starting to change the face of our industry, for
    the benefit of all our stakeholders.
Our response to these and other challenges is further described in our corporate video, Top Energy – Energy of
the Future which can be viewed on our website http://www.topenergy.co.nz.
The Commerce Commission has released its new price-quality path for the FYE 2021-25 regulatory period. This
imposes a revenue cap rather than a price cap, which provides us with more certainty that we will have the
resources to implement our network development plan. It also relaxes constraints on the impact of planned
interruptions, which gives us more flexibility in planning maintenance work on the 11kV network. While we are
now at the point where we do not need to interrupt supply to undertake maintenance work on our 33kV
networks, we still need to interrupt supply to localised areas when undertaking 11kV network maintenance.
Consumers have advance warning of planned interruptions and in our consumer surveys they have indicated
tolerance of an increased number of planned interruptions in return for the development of a more reliable
network. Over the FYE 2021-25 regulatory period, we expect to be able to increase the level of maintenance on
the 11kV network without increasing the overall impact of planned interruptions above historic levels.
Uncertainty remains in other components of the regulatory environment. In particular:
•    The Electricity Authority has still to grant an exemption for the new and existing diesel generation units
     from the cross-ownership requirements of the Electricity Industry Act 2010. This exemption has been
     applied for; however, until it is granted, we will be unable to run the installed generation across the
     northern part of our network, which will significantly decrease the reliability of supply to these consumers.
     We estimate that we will require eight planned shutdowns per annum of between eight and ten hours per
     shutdown.
•    The Electricity Authority has still to finalize its review of transmission pricing. Its current proposal has
     indicated a significant increase in transmission prices for consumers in the north of the country. The
     expanded Ngawha power station will significantly reduce the extent that electricity consumed in our supply
     area is generated south of Auckland and we expect that this should protect our consumers from much of
     this increase. We remain opposed to the changes proposed by the Electricity Authority.
•    The Electricity Authority is also requiring electricity distribution businesses to develop more cost reflective
     pricing policies. We are currently trialing new time-of-use tariffs and we are planning to review our pricing
     structures further in FYE 2021 and will need to take account of the outcomes of these trials and reviews.
•    Industry response to the challenge of emerging technologies remains a source of debate, focused largely
     on the extent to which EDBs can recover the costs on implementing new technologies from regulated
     revenue. The FYE 2021-25 price-quality path decision has done little to clarify this issue.
We will keep a watching brief on these developments and their potential impact on our consumers and provide
updates in subsequent AMPs.
Since FYE2010 we have put significant investment into the network and the value of our regulatory asset base
(RAB), which was approximately $128 million in 2010, is expected to exceed $280 million by the end of FYE 2021.
Over this period our annual capital expenditure has been significantly greater than depreciation. Since FYE 2015
our depreciation has averaged $8.5 million per annum while our average annual capex has exceeded
$17.7 million. During the current year (FYE 2020) our capital expenditure, which includes the construction of a

                                                             2
INTRODUCTION
new 110kV line to connect the expanded Ngawha power station to our network, the installation of additional
diesel generation in the Kaitaia area and the rebuilding of the Omanaia substation, is expected to be exceed
$39 million. The difference between capital expenditure and depreciation has been funded by increasing prices
to the limit allowed by our regulatory price path and significantly increasing debt. This investment has allowed
us to resolve the security of supply issue on our 110kV and 33kV networks and significantly improve the
resilience of our network. Looking forward over the period FYE 2021 to FYE 2030, we plan to continue to invest;
however, we cannot increase prices above the new price path, and we have no further debt capacity, so we will
have capital constraints. We are still working through the impact of these constraints and these are expected
to be included in our full AMP next year. What is clear is that we cannot continue to make such significant
investments in the network.
Our Board and Management are confident that we can still improve service outcomes to levels comparable to
those experienced by consumers supplied by similar rural networks within New Zealand and we will therefore
focus on achieving a price-quality balance that is affordable and in the best interests of the communities that
we serve.
In addition to the development of the network assets, we continue to develop the safety and asset management
culture within Top Energy. We actively participate in industry safety initiatives, which require staff engagement
at all levels and have the added benefit of sharing participant’s experiences from across the industry. To
succeed, the Company and all staff must maintain a proactive role in training, competency, peer support and
guidance, and monitoring industry issues.
We hope that you find this Asset Management Plan Update a succinct summary of the material changes to our
2019 AMP. We welcome your feedback on the update or any other aspect of Top Energy’s business and
performance. Feedback can be provided through the Top Energy website at
http://www.topenergy.co.nz/contact-us-feedback.shtml or emailed to info@topenergy.co.nz.
Russell Shaw
Chief Executive, Top Energy Ltd
3TABLE OF CONTENTS
Table of Contents
Table of Contents............................................................................................................................................ 4
Executive Summary ........................................................................................................................................ 5
1. Asset Management Strategy and Delivery............................................................................................... 7
2. Supply Reliability .................................................................................................................................... 8
2.1 Unplanned Interruptions ........................................................................................................................ 8
2.1.1 Network Resilience to Storms ..................................................................................................... 10
2.2 Planned Interruptions) ......................................................................................................................... 11
3. Network Development .......................................................................................................................... 13
3.1 Connection of Ngawha Power Station ................................................................................................. 13
3.2 Diesel Generation) ............................................................................................................................... 13
3.3 Distribution Network Reconfigurations) .............................................................................................. 14
3.4 Innovation Pilot Projects) ..................................................................................................................... 16
3.5 Solar Penetration ................................................................................................................................. 16
4. Lifecycle Asset Management ................................................................................................................. 18
4.1 Proactive Asset Renewals .................................................................................................................... 18
4.2 Vegetation Management..................................................................................................................... 20
5. Appendices ........................................................................................................................................... 23
Appendix A – Asset Management Plan Schedules ....................................................................................... 23
6. .................................................................................................................................................................. 25
Appendix B – Certification for Year Beginning Disclosures.......................................................................... 25
4EXECUTIVE SUMMARY
Executive Summary
Purpose
This AMP Update documents changes to the asset management strategies set out in our 2019 AMP. Furthermore,
it records the outcome of an internal review that confirms that: (i) apart from the documented changes; the network
development plan set out in the 2019 AMP remains appropriately aligned with our internal targets for improving
our network reliability; (ii) our network maintenance strategies will ensure that our network assets remain fit for
purpose and (iii) no material changes to the network development and maintenance budgets are needed.
Supply Reliability
In resetting Top Energy’s price-quality path for the FYE 2021-25 regulatory period, the Commerce Commission has
set separate quality standards for planned and unplanned interruptions and has revised the way in which unplanned
interruptions are normalised for quality assessment. We have reviewed our internal SAIDI and SAIFI targets in the
light of these changes and replaced the targets in the 2019 AMP with separate targets for planned and unplanned
interruptions.
Our new unplanned SAIDI and SAIFI targets are numerically the same as the unplanned interruption components of
the targets in the 2019 AMP. However, in measuring our performance against these targets, we will normalise our
raw performance using the Commission’s revised normalisation methodology.
We have set new SAIDI and SAIFI targets for planned interruptions at a level where the consumer impact will be the
same, on average, as the impact experienced over the ten-year period FYE 2010-19. While we have now reached a
point where there is little need to schedule planned interruptions for maintenance work on our 110kV and 33kV
network, setting targets based on the average historic impact of planned interruption across all voltages will allow
us more flexibility in maintaining our 11kV distribution network, without subjecting consumers to a higher level of
planned interruptions than they have historically experienced.
Our strategy for reducing the impact of unplanned interruptions has not changed, and by the end of the planning
period we still expect to be able to deliver a level of reliability comparable to that provided by similar rural electricity
distribution businesses.
Network Development
The following adjustments have been made to the network development plan set out in the 2019 AMP. There are
no material changes to our forecast capital expenditure over the planning period as a result of these adjustments.
Network reconfigurations described in the 2019 AMP that are designed to improve the resilience of our 11kV
distribution network to faults will proceed.
Connection of Ngawha Power Station
The Electricity Authority has granted us an exemption that allows the Ngawha Power Station expansion to be
embedded in our network rather than be directly connected to the Transpower grid at Kaikohe. This has not
changed the connection of the first new unit (OEC4) but, should a second new unit be constructed, one outgoing
110kV circuit will be directly connected to Kaikohe and the second to Wiroa.
Diesel Generation
We no longer plan to deploy diesel generation at remote locations across our 11kV network. The generation that
we proposed to deploy remotely is now being installed at Omanaia and Pukenui substations, which both have only
one transformer and one incoming circuit. This change has no budgetary implications.
Innovation Pilot Projects
Following the release of the Commission’s default price path decision for the regulatory period beginning on 1 April
2020, we are reviewing our approach to trialling new technologies and, pending the outcome of this review, have
decided not to proceed with the innovation pilot projects identified in the 2019 AMP. Meanwhile we are focussing
our efforts on customising our new ADMS system in order to fully utilise its potential to improve the effectiveness
of our control room operation as we develop our capability as a Distribution System Operator.
5EXECUTIVE SUMMARY
Lifecycle Asset Management
Proactive Asset Renewal
The asset condition analysis included in our 2019 AMP did not take asset criticality into account. We have reviewed
the asset renewal programme set out in our 2019 AMP and after a risk assessment are satisfied that no assets known
to have a high risk of failing in service are critical to the performance of our network. A change to our asset renewal
strategy to accelerate the replacement of non-critical assets known to be in poor condition would divert funds from
the renewal of more critical assets and could limit the rate at which we can improve supply reliability. We note that
the SAIDI impact of faults due to assets failing in service has progressively reduced from a high of 229.8 minutes in
FYE 2014 to 66.5 minutes in FYE 2019.
Vegetation Management
We have reviewed our approach to vegetation management since the SAIDI impact of vegetation faults has trended
upwards since FYE 2013. Our review has found that while the SAIDI impact has trended up, the SAIFI impact has
trended down. The upward SAIDI trend is due to the number of vegetation faults located in remote network
locations and therefore taking longer to fix. We will continue to monitor our expenditure on vegetation
management and review whether our vegetation management strategy strikes the right balance in the attention
we give to different parts of the network. Our approach is reliant on tree owners playing their part in managing
vegetation and we will be monitoring this closely. If this does not occur, then we will be reviewing future spend
levels. We are fully engaged with the Ministry of Business, Innovation and Employment’s review of the Electricity
(Hazards from Trees) Regulations 2003 to clarify where responsibilities lie.
6ASSET MANAGEMENT STRATEGY AND DELIVERY
1. Asset Management Strategy and Delivery
We strive to continually improve the manner in which we operate, to achieve our strategic business objective, while
at the same time complying with all relevant legislation and providing a safe working environment for our staff.
However, there are no material changes to the Asset Management Maturity Assessment (AMMAT) presented in
Schedule 13 of our 2019 AMP. We have therefore not included a revised schedule in this AMP Update.
This AMP Update covers the ten-year planning period 1 April 2020 to 31 March 2030 and was approved by our Board
of Directors on 31 March 2020.
Figure 1.1 compares our capital expenditure forecast for the planning period with that forecast in our 2019 AMP
and Figure 1.2 provides a similar comparison for our forecast network operations and maintenance expenditure
(excluding system operations and network support and business support expenditure).The figures show that there
are no material changes to the forecast network capital expenditure, apart from a small inflation adjustment.
$30,000
Forecast Expenditure ($000)
$25,000
$20,000
$15,000
2020 AMP Update
$10,000 2019 AMP
$5,000
$0
2021
2022
2023
2024
2025
2026
2027
2028
2029
2030
FYE
Figure 1.1: Comparison of Network Capital Expenditure Forecast with 2019 AMP (constant prices)
As can be seen from Figure 1.2, there is no material change to our network operational expenditure forecast apart
from a small inflation adjustment.
7,000
Forecast Network Maintenance
6,000
Expenditure ($000)
5,000
4,000
3,000 2020 AMP Update
2,000 2019 AMP
1,000
0
2023
2021
2022
2024
2025
2026
2027
2028
2029
2030
2031
FYE
Figure 1.2: Comparison of Network Capital Expenditure Forecast with 2019 AMP (constant prices)
7SUPPLY RELIABILITY
2. Supply Reliability
Summary
In resetting Top Energy’s price-quality path for the FYE 2021-25 regulatory period, the Commerce Commission has
set separate quality standards for planned and unplanned interruptions and has revised the way in which unplanned
interruptions are normalised for quality assessment. We have reviewed our internal SAIDI and SAIFI targets in the
light of these changes and replaced the targets in the 2019 AMP with separate targets for planned and unplanned
interruptions.
Our new unplanned SAIDI and SAIFI targets are numerically the same as the unplanned interruption components of
the targets in the 2019 AMP. However, in measuring our performance against these targets, we will normalise our
raw performance using the Commission’s revised normalisation methodology.
We have set new SAIDI and SAIFI targets for planned interruptions at a level where the consumer impact will be the
same, on average, as the impact experienced over the ten-year period FYE 2010-19. While we have now reached a
point where there is little need to schedule planned interruptions for maintenance work on our 33kV network, setting
targets based on the average historic impact of planned interruption across all voltages will allow us more flexibility
in maintaining our 11kV distribution network, without subjecting consumers to a higher level of planned interruptions
than they have historically experienced.
Our strategy for reducing the impact of unplanned interruptions has not changed and by the end of the planning
period we still expect to be able to deliver a level of reliability comparable to that provided by similar rural electricity
distribution businesses. In particular, our reliability improvement strategy includes increasing the resilience of our
11kV network to major storm events by optimising our operational response to such events and continuing to
implement a more resilient network design.
2.1 Unplanned
For internal management purposes, we measure and report supply reliability using normalised SAIDI and SAIFI
measures, which are lower than the actual reliability experienced by our consumers. We use the normalisation
methodology specified by the Commerce Commission for assessing compliance with our regulatory price-quality
path. However, our internal reliability targets are more stringent than the limits specified by the Commission
because the Commission’s limits are set to ensure that we maintain reliability at historic levels, whereas our asset
management objective is to progressively improve the reliability of the supply that we provide to our consumers.
We believe that reporting reliability against a normalised, rather than an actual, measure is more meaningful since
normalisation reduces the impact of severe weather events. While such events adversely affect the reliability of the
supply experienced by our consumers, their frequency and severity are outside our control. In reducing the
sensitivity of the measure to the volatility of the external environment, the normalised measure provides a better
reflection of underlying network reliability.
On 27 November 2019, the Commission set Top Energy’s default price-quality path for the third regulatory period
(DPP3), which starts on 1 April 2020 to and runs to 31 March 2025, and revised the quality limits with which we must
comply. For DPP3 the Commission has:
• set separate reliability limits for planned and unplanned interruptions. For the current regulatory period,
which ends on 31 March 2020, the Commission set a single SAIDI and single SAIFI limit, with each limit
incorporating both planned and unplanned interruptions;
• changed the basis for normalizing unplanned interruptions from a calendar day to a rolling 24-hour period.
Under the DPP2 normalization methodology, the Commission specified a boundary value and the maximum
SAIDI and SAIFI impact of any calendar day was limited to the boundary value. Under the revised approach
the Commission’s boundary value limits the SAIDI and SAIFI over any 24-hour period, rather than a calendar
day. Over a measurement year, the DPP3 normalization approach will report a lower normalized SAIDI and
SAIFI than the DPP2 methodology for the same raw network performance.
Consistent with the Commission’s decision to set separate limits for planned and unplanned reliability, we have now
set separate internal targets for the impact of planned and unplanned interruptions. Notwithstanding the
normalisation change, in setting our unplanned SAIDI and SAIFI targets we have not adjusted the unplanned
8SUPPLY RELIABILITY
components of the SAIDI and SAIFI targets and these remain unchanged as presented in Table 4.2 of the 2019 AMP.
These are shown in Table 2.1.
FYE 2021 2022 2023 2024 2025 2026 2027 2028 2029 2030
Normalised Unplanned SAIDI
Unplanned 110kV - - - - - - - - - -
Unplanned 33kV 29 28 27 26 25 24 23 22 21 20
Unplanned 11kV 225 218 210 203 195 188 180 173 163 157
Total 254 246 237 229 220 212 203 195 186 177
Normalised Unplanned SAIFI
Unplanned 110kV - - - - - - - - - -
Unplanned 33kV 0.50 0.50 0.50 0.50 0.50 0.50 0.50 0.50 0.50 0.50
Unplanned 11kV 2.53 2.48 2.41 2.36 2.29 2.24 2.17 2.11 2.05 2.00
Total 3.03 2.98 2.91 2.86 2.79 2.74 2.67 2.61 2.55 2.50
Table 2.1: Internal Consumer Service Level Targets
As the revised approach to normalisation returns a lower normalised measure for the same raw performance, the
targets in Table 2.1 reflect a marginally lower level of reliability than the targets in the 2019 AMP. We decided not
to adjust the 2019 AMP targets to reflect the change in normalisation for the following reasons:
• Since we introduced our network development plan in FYE 2010, the only years where we have bettered
our internal reliability targets have been FYE 2013 and FYE 2019, both years in which the weather was
unusually benign. Furthermore, we are trending toward not meeting our internal reliability target for the
current year (FYE 2020). This suggests that the buffer that we have incorporated into our historic targets
to account for weather volatility has not been sufficient.
• For this analysis we have normalized our historic service levels using the DPP3 methodology for every year
since FYE2009, as shown in Figures 2.1 and 2.2. The figures show a trend of improving reliability, which
reflects the effectiveness of our network development plan. The targets in Table 2.1 are a continuation of
this trend, as shown in Figures 2.1 and 2.2, and reflect the expected impact of our ongoing network
development. With our targeted level of improvement, we anticipate that our raw network reliability will
be comparable to that of similar rural EDB networks such as those of Eastland Energy and The Lines
Company by the end of the planning period.
Unplanned SAIDI
500
450
400
350
Normalised SAIDI
300
250 Actual
200 Target
150 DPP3 Limit
100 Average FYE 2010-19
50
0
FYE 2009
FYE 2010
FYE 2011
FYE 2012
FYE 2013
FYE 2014
FYE 2015
FYE 2016
FYE 2017
FYE 2018
FYE 2019
FYE 2020
FYE 2021
FYE 2022
FYE 2023
FYE 2024
FYE 2025
FYE 2026
FYE 2027
FYE 2028
FYE 2029
FYE 2030
Year
Figure 2.1: Actual and Targeted SAIDI
9SUPPLY RELIABILITY
Unplanned SAIFI
6
5
4
Normalised SAIFI
3 Actual
Target
2 DPP3 Limit
Average FYE 2010-19
1
0
FYE 2010
FYE 2011
FYE 2012
FYE 2023
FYE 2024
FYE 2025
FYE 2009
FYE 2013
FYE 2014
FYE 2015
FYE 2016
FYE 2017
FYE 2018
FYE 2019
FYE 2020
FYE 2021
FYE 2022
FYE 2026
FYE 2027
FYE 2028
FYE 2029
FYE 2030
Year
Figure 2.2: Actual and Targeted SAIFI
Our strategy for reducing unplanned 33kV SAIDI includes the refurbishment of the 33kV line to Omanaia, which is
planned to be undertaken during FYE 2021 and FYE 2022 at a cost of $0.86 million and the now completed
installation of generation at Omanaia and Pukenui, which are both single transformer substations supplied by a
single incoming circuit. These generators will reduce the duration of interruptions caused by faults on these
incoming circuits but will not prevent the interruptions from occurring as the generators will only be started after
an interruption has occurred. We expect further incremental reductions in SAIDI over the planning period as we
improve our fault response and become more experienced in the utilisation of our Advanced Distribution
Management System (ADMS). We are also increasing our expenditure on the replacement of assets known to be
approaching the end of their economic life, as discussed in Section 4.1.
2.1.1 Network Resilience to Storms
Our network development plan has increased the resilience of our 110kV and 33kV networks through the installation
of backup diesel generation and the installation of upgraded protection on the 33kV network so that in most cases
supply is uninterrupted following a fault. Increasing the resilience of the 11kV distribution network is more difficult
due to the radial network design and the higher storm exposure due to the significantly greater circuit lengths. To
increase the resilience of the 11kV network we are focusing on reducing the number of customers affected by a fault
and developing a network that can be quickly reconfigured after a fault occurs to restore supply to most consumers
before the fault is repaired.
Reducing the number of customers affected by a fault is most effectively achieved by reducing the number of
consumers connected to a distribution feeder and we have achieved this in the north-east seaboard through the
installation of new zone substations at Kerikeri and Kameo. Our capital expenditure forecast also provides for the
installation by FYE2022 of a second feeder to supply consumers on the Russell peninsula – this means that only half
the consumers on the peninsula will experience a supply interruption following a single fault. On long feeders the
number of affected consumers can be reduced by the installation of automatic reclosers along the feeder to prevent
consumers close to the source being interrupted by a remote fault. We have almost 120 reclosers on our network
including those that protect single wire earth return (SWER) lines. Many of our spur lines are now fused at the point
of connection to the main feeder backbones to prevent faults on the spur affecting the whole feeder.
Rapid restoration of supply prior to the repair of a fault can be achieved through the installation of interconnections
between adjacent feeders and through the installation of remote-controlled switches in the field so that switching
can be done remotely from the control room rather than locally at site. We now have a total of 250 remote control
switches throughout our network we have provided $0.6 million for the installation of additional switches during
the planning period. Our capital expenditure forecast also includes the installation of five new feeder
interconnections at a total cost of $5.9 million. These are discussed in Section 3.3.
10SUPPLY RELIABILITY
We also have documented operational procedures in place to optimise our response to major storm events. During
such an event our capacity to respond is limited and so we need to prioritise our response. Our first priority to
ensure that the network is safe, our second is to restore supply to as many consumers as possible and only then do
we focus on the repair/remediation and stabilisation of network and consumer assets.
In preparing for a pending significant weather event, we monitor weather watches and warnings issued by
Metservice to assess the potential impact on our network. We issue capability statement forms to our supporting
teams including our PhonePlus call centre, Top Energy Contracting Services, Stores and Procurement. These
statement lists are used to confirm their expected event response resource availability. If it appears that a severe
weather event is likely, then representatives from these teams attend a pre event briefing and coordination meeting.
The meetings purpose is to establish any expected shortfall in our response capabilities and identify options to
address or minimise the impact of any resource or response limitations.
If the storm develops into a major event that exceeds our normal response capability, a “Full Response”, as defined
in the Top Energy Emergency Preparedness Plan (EPP) is declared. This puts the business on a major event footing
where all planned and unnecessary work is suspended to allow full resourcing of the storm response, utilising all
appropriate business resources.
Staff welfare and fatigue during such events are managed to ensure we can maintain a viable resource throughout
the event. The Human Resources team, the Fault Supervisor and after-hours Fault Coordinators have the
responsibility of this task, with support from the Network Controllers and the Duty Manager. Leadership and
management during these events are managed by the business’ operational managers and their teams with the out-
of-hours support provided by the Rostered Duty Management team.
Public enquiries during events are handled by the normal resources and existing processes that are in place i.e.
PhonePlus, complaints process, the Outage Centre and the outage app etc. Media enquiries during major events are
handled and released in accordance with the Top Energy Media Protocol, with support from our media consultancy
provider.
2.2 Planned Interruptions
As noted in Section 2.1.1, our 11kV distribution network is of a radial design, like that of most ECBs, and when an
element of the network fails or is de-energised, supply to downstream consumers is interrupted. WorkSafe New
Zealand’s current position is that work should generally not be undertaken on live electrical equipment. Working
within these constraints, we will be unable to increase the maintenance of our 11kV distribution network above the
current level without increasing the number of planned 11kV network interruptions.
While planned interruptions are disruptive to consumers, they are less so than unplanned interruptions, because
consumers are given advance notice of the interruption and can plan accordingly. With generation installed at
Kaitaia, Omanaia, Pukenui and Taipa, planned interruptions should now normally only be required for work on the
11kV distribution network1.
For DPP3, the Commission has not set an annual limit for the impact of planned interruptions but has set aggregated
planned SAIDI and SAIFI limits for the whole regulatory period. As compliance will only be assessed at the end of
the period, EDBs are free to use up this allowance at any time over the period. Our limit is 1,905.36 SAIDI minutes
and 7.63 interruptions (SAIFI), which is calculated as three times our average annual planned SAIDI and SAIFI over
the FY 2010-19 period aggregated for five years.
For internal management purposes we have set rounded annual planned SAIDI and SAIFI targets equal to our average
performance over the FY 2010-19 period2. Given that there should be little need for planned interruptions on our
transmission and subtransmission network, this will allow us to increase our level of maintenance on the 11kV
1
The one exception to this is the Junken Nissho mill. Insufficient generation has been installed at Kaitaia to
supply the mill during an outage of the 110kV Kaikohe-Kaitaia line. An arrangement is in place with the
customer to ensure the mill is shut down during a planned interruption of this line.
2
These are rounded down values. The reliability incentive scheme has a planned SAIDI component with a
target SAIDI of 127.02. This is the neutral level, for which no reward or payment will apply.
11SUPPLY RELIABILITY
network without increasing our consumers’ exposure to planned interruptions above historic levels. These targets
are shown in Table 2.2. Assuming the SAIDI target is met, the aggregate SAIDI impact of planned interruptions over
the DPP3 regulatory period will be 625 minutes, less than one third of the 1,905.36 minutes set by the Commission.
FYE 2021 2022 2023 2024 2025 2026 2027 2028 2029 2030
Planned SAIDI 125 125 125 125 125 125 125 125 125 125
Planned SAIFI 0.5 0.5 0.5 0.5 0.5 0.5 0.5 0.5 0.5 0.5
Table 2.2: Targets for the Impact of Planned Interruptions
12NETWORK DEVELOPMENT
3. Network Development
3.1 Connection of Ngawha Power Station
Summary
The Electricity Authority has granted us an exemption that allows the Ngawha Power Station to be embedded in our
network rather than be directly connected to the Transpower grid. This has resulted in changes to the development
of our 110kV network in the southern area from the plan set out in our 2019 AMP. These changes have no budgetary
implications.
Stage 1 of the Ngawha power station expansion (referred to internally as OEC4 as it will be the 4 th generator at the
site) is on track for commissioning in 2020 and will increase the generation capacity of the power station by 31.8MW.
There is an option for a 5th and final generator (OEC5) to be built, and if were to proceed, it could be commissioned
by late 2025.
In October 2019, the Electricity Authority granted Top Energy an exemption from the cross-ownership provisions of
the Electricity Industry Act 2010, which means that we can now embed the new Ngawha generators within our
network, rather than being required to connect them directly to the transmission grid at the Kaikohe grid exit point.
We now plan that the expansion to the power station will form part of a 110kV loop circuit connecting Kaikohe and
Wiroa, as shown in Figure 3.1. The loop will comprise the two circuits of the existing double circuit line between
Kaikohe and Wiroa and a new double circuit 110kV spur line to the power station, presently under construction. As
the new line will now be part of our shared transmission network rather than an asset dedicated to the power
station, once commissioned it will be included in Top Energy Networks’ regulatory asset base.
Initially OEC4 will connect directly to a new line bay in the Kaikohe 110kV switchyard through a single 110kV circuit
utilising the new line and part of one circuit of the existing Wiroa line. The loop arrangement would be implemented
after OEC5 was commissioned or after a 110/33kV substation at Wiroa is commissioned.
The development plan in the 2019 AMP included the replacement in FYE 2023 of the smaller 30MVA transformer at
Kaikohe with a new 40/60MVA unit that would be connected by a tee connection to the existing Kaikohe-Kaitaia
110kV line, to free up a bay in the 110kV switchyard. We have now decided to install a new 110kV line bay in the
Kaikohe switchyard and leave the existing transformer in place.
Apart from these near-term adjustments, there have been few changes to the network development plan set out in
the 2019 AMP. In particular, our capital expenditure forecast still provides for the completion of the Wiroa-Kaitaia
110kV line by FYE 2030.
3.2 Diesel Generation
Summary
We no longer plan to deploy diesel generation at remote locations across our 11kV network as indicated in our 2019
AMP. The generation that we proposed to deploy remotely will now be installed at Omanaia and Pukenui substations,
which both have only one transformer and one incoming circuit. This change has no budgetary implications.
As part of our strategy for security of supply, the 2019 AMP set out our plan to purchase 12 new generators being a
mix of 1MW and 500kW machines, in addition to the three that had already been purchased and installed at our
Kaitaia depot. It was envisaged that eight generators would be installed at a new generator farm at Bonnetts Rd,
west of Kaitaia, three at our Kaitaia depot, and four would be relocatable units deployed across the 11kV network,
primarily to provide resilience in the event of a fault.
In the event, 11 new generators were purchased. Eight are being installed at Bonnetts Rd and, instead of deploying
generators across the 11kV network, two generators are being installed at our Omanaia substation and one at
Pukenui. Reasons for this strategy change include:
13NETWORK DEVELOPMENT
• Omanaia and Pukenui are both single transformer substations. The presence of generation at these
substations will enable supply to be restored more rapidly and reduce the urgency with which the mobile
substation needs to be deployed should there be a transformer failure. The generation will also be used to
avoid supply interruptions during maintenance outages of the incoming single circuit 33kV lines;
• Our operational experience with the Taipa generators is that there can be problems when starting
generators remotely in response to an unplanned network failure. This experience has been incorporated
into the selection of locations for our new generator fleet. Rather than installing generators in remote
locations where communications are less reliable, less intensive monitoring is possible from the control
room, and response time for repair or local start up is protracted, we are installing them at substations that
are more accessible and have reliable communications links. Delayed start negates the benefit of
generators as unplanned outage backup.
Notwithstanding this, it may be that in the future we decide to deploy a generator to provide network support on
the remote 11kV network for planned interruptions. Under these circumstances, and with the ability to forward
plan, it is likely that a hire generator would be deployed, then removed at the end of the work.
The Electricity Authority has still to grant an exemption for the new and existing diesel generation units from the
cross-ownership requirements of the Electricity Industry Act 2010. This exemption has been applied for; however,
until it is granted, we will be unable to run the installed generation across the northern part of our network which
will significantly decrease the reliability of supply to these consumers. We estimate that we will require eight
planned shutdowns per annum of between eight and ten hours per shutdown.
3.3 Distribution Network Reconfigurations
Summary
We have reviewed our network capital expenditure forecast for the first five years of the AMP planning period to
ensure consistency with the reliability improvement implied by the unplanned interruption targets in Table 2.1. The
review has confirmed that the network projects in the 2019 AMP are appropriate and that no material forecast
changes are required.
Projects in our forecast for the first five years of the planning (FYE2021-25) period that are designed to increase the
resilience of our network to faults through network reconfiguration are shown in Table 3.1. Network
reconfigurations will not prevent faults occurring but will either reduce the number of consumers affected by a fault
or enable supply to be restored more quickly to many consumers after a fault occurs.
Project Implementation Budget Comment
($ million)
Russell Reinforcement FYE 2022 1.48 The installation of a new 11kV cable between
Okiato Pt and the Russell Rd intersection will enable
the Russell Peninsula load to be shared between
two feeders. This means that a single fault will only
interrupt supply to half the feeders on the
peninsula.
Feeder Interconnections FYE 2022-26 4.75 The installation of additional interconnections
between adjoining feeders allow load transfers
between feeders after a fault occurs, reducing the
time taken to restore supply to many consumers.
Interconnections between the following feeders
have been provided for over this period:
Matauri Bay – Whangaroa
Rangiahua --South Rd
Rangiahua – Horeke
Bulls Gorge – Moerewa
Herekino-South Rd
14NETWORK DEVELOPMENT
Table 3.1: Planned Distribution Network Reconfigurations
Figure 3.1: Planned/Anticipated 110kV Transmission Network Development
15NETWORK DEVELOPMENT
3.4 Innovation Pilot Projects
Summary
We have decided not to proceed with the innovation pilot projects identified in the 2019 AMP and will review our
approach to the trialling of innovative technologies during FYE 2021. As the cost of these pilot projects was relatively
small, we have not changed our total forecast expenditure.
Our 2019 AMP signalled our intention to initiate a range of new technology pilot projects, including the development
of micro-grids supported by battery storage and the deployment of a static voltage compensator on the Russell
feeder. We have decided not to proceed with the pilots as:
• Many other EDBs are, or have already been, actively undertaking new technology trials and the results of
those trials are readily available. Typically, these trials are more extensive than Top Energy could entertain,
and duplication of work already done is not good use of our capital resources;
• We have made a commitment in the AMP to undertake specific, long term remediation and maintenance
work on the network in order to provide an improving level of service to our consumers, including improved
reliability, resilience and security of supply. Funding for new innovative technology trials is well down the
priorities list for funding and its inclusion cannot be justified in the foreseeable future; and
• While we will maintain our watching brief on the introduction of new technology, in general, we will be
followers rather than leaders in this area and only adopt new technology after it has been well proven.
The Commission’s DPP3 final decision provides an innovation project allowance, recoverable as a pass-through cost,
which we could utilise for the implementation of innovation initiatives. The innovation project allowance available
to us under this mechanism over the DPP3 regulatory period is $198,000. To qualify for this funding, we would need
to meet certain conditions. In particular:
• We would need to match any drawdown from the project innovation allowance with a corresponding
contribution from our own resources;
• Prior to starting the project, we would need to submit a report to the Commission from an independent
engineer or suitable specialist. The report would need to confirm that the proposed project met the criteria
set by the Commission;
• The Commission must approve the project based on its analysis of this report;
• On completion of the project we would need to provide the Commission with a report on the findings of
the project. This report must also be publicly available on our website.
During FYE 2021 we plan to review our approach to innovation in the light of this new innovation framework and
provision for the implementation of suitable innovation projects may be included in future expenditure forecasts. It
is likely that any such initiatives will focus on the development and implementation of our ADMS system to optimise
our effectiveness as a distribution system operator. The use of the ADMS system to more effectively manage the
operation of our diesel generation after an unplanned 110kV interruption, or to black-start Ngawha after a sustained
outage of the connection to the Transpower grid are possible areas of investigation.
3.5 Solar Penetration
As shown in Figure 3.2, there has been steady growth in the connection of solar generation to our network, with
more 1.1 MW of new generation connecting to the network in the year to the end of January 2020. We have also
received enquiries for the connection of large solar generation projects rated at about MAW and, as such, we are
currently reviewing our embedded generation policy. We are planning to formally review the impact of solar
generation on our network once our total solar penetration exceeds 5MW and if the growth in solar generation
continues at its current rate this trigger point will be reached sometime during FYE 2021. Although there is no
current impact on distribution, we will address in more detail the implications of increased solar penetration in our
2021 AMP.
16NETWORK DEVELOPMENT
Figure 3.2: Growth in Network Solar Penetration
17LIFECYCLE ASSET MANAGEMENT
4. Lifecycle Asset Management
Prior to the completion of our 2019 AMP we undertook a comprehensive assessment of the health of the assets in
the different asset classes within our network. The assessment was based on the criteria in the Energy Engineers’
Association (EEA) Asset Health Indicator (AHI) Guide, using where possible the results of our asset inspection
program. For assets such as cables, where an assessment of asset condition is not possible from a visual inspection,
asset age was used as a proxy for condition. This exercise, which is based on asset condition rather than solely on
asset age, has provided us with more accurate quantitative information on the health of our asset fleet and enabled
us to develop an asset renewal budget that better targets assets in most need of replacement.
A limitation of the AHI approach is that asset health is determined only by the probability of failure. The EEA has
recently extended this approach by developing a structured approach to the assessment of asset criticality, based
on the consequences of asset failure. This information, when combined with our knowledge of the health of an
asset, can be used to develop a two-dimensional assessment of asset risk, which is defined as the consequences to
our business and our consumers if an asset fails. The overall objective is to base the decision to replace or renew an
asset on the risk of an asset failure rather than purely on asset health.
The EEA criticality guide has only just been released and we have still to develop a structured approach to quantifying
asset risk. In prioritising assets for replacement, we intuitively take criticality into account in that, all else being
equal, assets where the consequences of failure are highest, are prioritised for replacement. Nevertheless, this is
still a high-level, qualitative assessment.
We adopt a two-pronged approach to asset renewal, reactive and proactive. Reactive renewals are driven by the
need to replace assets that have failed in service and by the need to replace individual assets that have been
identified through our asset inspection programme as being defective to the point where they have a high risk of
failure. The effort is the responsibility of our Network Maintenance Manager, who must also consider the
consequences of failure when prioritising the replacement of assets known to be defective.
The proactive component of asset renewal is driven by our Network Planning Manager. Under this programme the
replacement of assets or the refurbishment of parts of the network are aggregated into asset renewal projects for
proactive implementation. For example, over the last few years the incoming 33kV lines supplying Taipa and Pukenui
substations have both been refurbished and refurbishment of the 33kV line to Omanaia is currently being
undertaken. Asset health and the consequence of asset failure are key inputs to the development and prioritisation
of asset renewal projects.
4.1 Proactive Asset Renewals
Summary
In our 2019 AMP we incorporated the results of our asset inspection programme into our assessment of asset
condition for the first time. This provided a more accurate assessment of the quantity and type of assets that have
reached the end of their economic lives. We have reviewed our proactive asset renewal programme in the light of
this revised assessment approach. We note that the SAIDI impact of faults due to assets failing in service has
progressively reduced from a high of 229.8 minutes in FYE 2014 to 66.5 minutes in FYE 2019 and have confirmed that
no assets currently in service and identified as having reached the end of their economic life are critical to safety, the
reliability or performance of the network. A change in the asset renewal strategy set out in the 2019 AMP to
accelerate the replacement of these assets would divert funds from the renewal of more critical assets and could
constrain the rate at which we can improve our supply reliability.
While the planned reconfiguration strategies described in Section 3.3 are designed to make the network more
resilient to faults that that do occur, our proactive network renewal strategy is designed to limit the incidence of
interruptions due to defective equipment and ensure that the network remains fit for purpose. This expenditure is
over and above our reactive capital expenditure on asset renewal, which arises from the replacement of assets that
fail in service or are identified during asset inspection as requiring urgent replacement.
Over the past few years our proactive renewal strategy has largely focused on our subtransmission network, since
subtransmission faults can interrupt supply to large numbers of consumers. The transformer at Omanaia substation
18LIFECYCLE ASSET MANAGEMENT
has now been replaced with a new unit and, apart from refurbishment of the Omanaia circuit and the rebuild of the
Waipapa substation, this work is now substantially complete. We are therefore increasing our expenditure on
renewal of the 11kV distribution network.
The Waipapa substation rebuild has been deferred out to 2028. The objective of this project is to replace the 33kV
and 11kV outdoor switchyards with indoor switchboards, primarily to reduce the safety risk in line with current
industry practice, and to lower the transformers to ground level to reduce the earthquake risk. While the switchyard
structures are old, they are still serviceable and key outdoor assets such as circuit breakers have already been
replaced. Pending the start of the rebuild, all assets will be maintained in a serviceable condition and safety risks
will continue to be managed using industry standard procedures.
Our 11kV asset renewal forecast is focused on the renewal of following assets:
• Wooden poles. These are a safety risk as deterioration usually occurs below ground level and is not
apparent from a visual inspection. We still have more than 1,000 wooden poles on our network, of which
approximately 25% are considered unreliable. We intend to replace all these wooden poles with concrete
by the end of the planning period and will prioritize those known to be unreliable.
• Concrete poles. Concrete poles deteriorate much more slowly than wooden poles and deterioration
generally occurs above ground level, so is apparent from a visual inspection. Our older concrete poles are
“L” and “T” shaped, some of which have a known construction flaw where short pieces of reinforcing were
welded together when the correct length was not available. Affected units have failed in service but the
location of other flawed units is not known and cannot be determined by a visual pole inspection. We have
approximately 31,500 concrete poles on our network, of which around 3% are considered potentially
unreliable.
• Conductor: The majority of faults from conductor failure are due to the failure of steel, copper and small
aluminum (mink) conductor that is now close to the end of its useful life. Approximately 0.7% of the almost
4,000km of circuit conductor on our network requires replacement and almost 50% of this deteriorated
conductor is on our SWER network. We currently plan to replace approximately 10 cct-km conductor per
year. Initially this work will be bundled into line refurbishment projects where 11kV lines in poor condition
are fully refurbished. Accelerated replacement of this conductor is not considered justified as the
conductor is located in remote, uneconomic network locations.
• Switchgear: While we plan to replace limited numbers of air-break switches and ring main units each year,
most of the switchgear on our network that has reached end of life are drop-out fuse holders. There are
more than 5,600 drop-out fuses on our network and more than 10% of these have been assessed as
requiring replacement. Our documented risk management strategy, which includes component risk
assessment, raises few safety or reliability concerns. Anodically, the failure modes are generally burnt off
terminations, or fuses not clearing the holder as designed. As there is little safety risk, these assets are
generally run to failure, rather than proactively replaced.
The 2019 AMP identified two substation transformers that had reached the end of their economic life and were at
a heightened risk of failing in service. The 33/11kV transformer at Omanaia was replaced with a new unit in
FYE 2020. The second transformer is the smaller 110/33kV transformer at Kaitaia. It was inherited from Transpower
and is a bank of three single phase units with each phase in a separate tank. The larger 40MVA Kaitaia transformer
is about four years old and still in as-new condition. The transformer it replaced has not been removed. There are
therefore four spare single-phase units still at Kaitaia, which are available to be brought back into service if one of
the three in-service units failed. Replacement of this old transformer bank is currently scheduled for FYE 2029.
Our strategy for ensuring that the network remains fit for purpose and for controlling the number of interruptions
due to equipment failing in service includes completing the projects identified in Table 4.1 over the first five years
of the planning period.
19You can also read