Investor Presentation - Q4 FY21 - IDFC FIRST Bank
←
→
Page content transcription
If your browser does not render page correctly, please read the page content below
Investor Presentation – Q4 FY21
Disclaimer
This presentation has been prepared by and is the sole responsibility of IDFC FIRST Bank (together with its subsidiaries, referred to as the
“Company”). By accessing this presentation, you are agreeing to be bound by the trailing restrictions.
This presentation does not constitute or form part of any offer or invitation or inducement to sell or issue, or any solicitation of any offer or
recommendation to purchase or subscribe for, any securities of the Company, nor shall it or any part of it or the fact of its distribution form the basis
of, or be relied on in connection with, any contractor commitment therefore. In particular, this presentation is not intended to be a prospectus or
offer document under the applicable laws of any jurisdiction, including India. No representation or warranty, express or implied, is made as to, and
no reliance should be placed on, the fairness, accuracy, completeness or correctness of the information or opinions contained in this presentation.
Such information and opinions are in all events not current after the date of this presentation. There is no obligation to update, modify or amend
this communication or to otherwise notify the recipient if information, opinion, projection, forecast or estimate set forth herein, changes or
subsequently becomes inaccurate.
Certain statements contained in this presentation that are not statements of historical fact constitute “forward-looking statements.” You can
generally identify forward-looking statements by terminology such as “aim”, “anticipate”, “believe”, “continue”, “could”, “estimate”, “expect”,
“intend”, “may”, “objective”, “goal”, “plan”, “potential”, “proforma”, “project”, “pursue”, “shall”, “should”, “will”, “would”, or other words or phrases
of similar import. These forward-looking statements involve known and unknown risks, uncertainties, assumptions and other factors that may cause
the Company’s actual results, performance or achievements to be materially different from any future results, performance or achievements
expressed or implied by such forward-looking statements or other projections. Important factors that could cause actual results, performance or
achievements to differ materially include, among others: (a) material changes in the regulations governing our businesses; (b) the Company's
inability to comply with the capital adequacy norms prescribed by the RBI; (c) decrease in the value of the Company's collateral or delays in
enforcing the Company's collateral upon default by borrowers on their obligations to the Company; (d) the Company's inability to control the level of
NPAs in the Company's portfolio effectively; (e) certain failures, including internal or external fraud, operational errors, systems malfunctions, or
cyber security incidents; (f) volatility in interest rates and other market conditions; and(g) any adverse changes to the Indian economy.
This presentation is for general information purposes only, without regard to any specific objectives, financial situations or informational needs of
any particular person. The Company may alter, modify, regroup figures wherever necessary or otherwise change in any manner the content of this
presentation, without obligation to notify any person of such change or changes.
                                                                                                                                      2
Key Metrics and our progress vis-à-vis Guidance provided at the time of the merger in Dec 2018
                                                                                                                                                      Guidance given at the time of
                Particulars                Dec-18 (At Merger)                  Mar-19                   Mar-20                    Mar-21 (YoY %)                                                  Status
C                                                                                                                                                        merger for FY24-FY25
A   Net-worth                                     Rs. 18,736 Cr         Rs. 18,159 Cr            Rs. 15,343 Cr            Rs. 20,808 Cr (36%)^
P
I   CET – 1 Ratio                                        16.14%                15.27%                   13.30%                          15.62%^
T
A
    Capital Adequacy (%)                                 16.51%                15.47%                   13.38%                          16.32%^
L

    CASA Deposits                                   Rs. 5,274 Cr          Rs. 7,893 Cr           Rs. 20,661 Cr                     Rs. 45,896 Cr
L
I   CASA as a % of Deposits (%)                            8.68%               11.40%                   31.87%                            51.75%
                                                                                                                                                                30% (FY24),
A                                                                                                                                                                                               Achieved
                                                                                                                                                               50% thereafter
B   Average CASA Ratio (%)                                 8.39%                9.40%                   27.72%                            50.23%
I   Core Deposits as a % of Total
                                                           8.04%                9.49%                   27.76%                            47.51%                     50%                        On Track
L   Deposits & Borrowings
I
    Branches (#)                                             206                   242                      464                               596                  800-900                      On Track
T
I   Customer Deposits
Key Metrics and our progress vis-à-vis Guidance provided at the time of the merger in Dec 2018
                                                                                                                                      Guidance given at the time of
                   Particulars                   Dec-18 (At merger)                  Mar-19         Mar-20           Mar-21 (YoY %)                                    Status
                                                                                                                                         merger for FY24-FY25
    Retail Funded Assets                                Rs. 36,236 Cr       Rs. 40,812 Cr      Rs. 57,310 Cr   Rs. 73,672 Cr (26%^)          Rs. 100,000 Cr           On Track

    Retail as a % of Total Funded Assets                          35%                   37%            54%                    63%                 70%                 On Track

A   Wholesale Funded Assets                             Rs. 56,809 Cr       Rs. 53,649 Cr      Rs. 39,388 Cr   Rs. 33,920 Cr (-14%)          < Rs. 40,000 Cr          On Track
S
S   - of which Infrastructure loans                     Rs. 22,710 Cr       Rs. 21,459 Cr      Rs. 14,840 Cr   Rs. 10,808 Cr (-27%)           Nil in 5 years          On Track
E
    Top 10 borrowers as % of Total
T                                                               12.8%                  9.8%            7.2%                   5.9%                < 5%                On Track
    Funded Assets (%)
S
    GNPA (%)                                                    1.97%                 2.43%          2.60%                   4.15%               2-2.5%               On Track

    NNPA (%)                                                    0.95%                 1.27%          0.94%                   1.86%               1.1.2%               On Track

    Provision Coverage Ratio (%)                                  52%                   48%            65%                    55%                ~70%                 On Track
E
    Net Interest Margin (%)                                     3.10%                 2.61%          3.91%                   4.98%               5-5.5%               On Track
A
R   Cost to Income Ratio (%) without
                                                              81.56%                 82.74%         76.86%                 78.79%                 55%                 On Track
N   trading gains
I   Return on Asset (%)                                        -3.70%                 -1.33%         -1.75%                  0.29%              1.4-1.6%              On Track
N
G   Return on Equity (%)                                     -36.81%                 -11.64%       -17.10%                   2.73%              13-15%                On Track
S
    Quarterly Avg. LCR (%)                                      123%                   120%           111%                   153%
    ^ excluding the ECLGS portfolio of Rs. 1,687 crore as on March 31, 2021
    Note: Earnings ratios are quarterly annualized for the quarter ended on Dec-18

    “On Track” status represents that the Bank is progressing well on the parameter and in confident of achieving the guidance by the defined date             4
Results at a glance for Period ended on March 31, 2021:
IDFC FIRST Bank: Strong Strides across all the Strategic Priorities
We are happy to report that we are making strong progress on the guidance since merger.
1. Strong Growth in Retail Assets:
       • Retail Book increased 26%^ YoY to Rs. 73,673 crore as on March 31, 2021 from Rs. 57,310 crore as on March 31, 2020.
       • Retail constitutes 67% of funded loan assets as on March 31, 2021 including retail PSL buyouts.
       • Wholesale funded book decreased by 14% to Rs. 33,920 crore as on March 31, 2021 from Rs. 39,388 crore as on March 31, 2020
       • Infrastructure loans (part of wholesale) decreased by 27% to Rs. 10,808 crore as on March 31 2021 from Rs. 14,840 crore as on March 31, 2020.
       • Infrastructure loans are only 9.23% of total funded assets as on March 31, 2021 as compared to 13.87% as on March 31, 2020
2. Strong growth in Retail Liabilities
       • CASA Deposits increased by 122% YOY to Rs. 45,896 crore as on March 31, 2021 from Rs. 20,661 crore as on March 31, 2020
       • CASA Ratio improved to 51.75% as on March 31, 2021 from 31.87% as on March 31, 2020.
       • Average CASA Ratio (calculated on daily CASA balance) also improved to 50.23% as on March 31, 2021 from 27.72% as on March 31, 2020.
       • Total Customer Deposits increased to Rs. 82,725 crore as on March 31, 2021 from Rs. 57,719 crore as on March 31, 2020, Y-o-Y increase of 43%.
       • Top 20 Depositors’ concentration as % to total customer deposits has reduced to 7.75% as on March 31, 2021 from 20.36% as on March 31, 2020
       • IDFC First Bank Fixed Deposit program have the highest safety rating of FAAA by CRISIL

   ^ excluding the ECLGS portfolio of Rs. 1,687 crore as on March 31, 2021

                                                                                                                                   5
Results at a glance for Period ended on March 31, 2021:
IDFC FIRST Bank: Strong Strides across all the Strategic Priorities
 3. Strong growth in Core Earnings:
a.   Strong NII Growth: For the full year, the Total Net Interest Income increased by 21% to Rs. 7,380 crore in FY21 from Rs. 6,076 crore in FY20. NII
     for Q4-FY21 grew by 15% YOY to Rs. 1,960 crore from Rs. 1,700 crore in Q4 FY20.
      i.    The NII in Q4-F21 includes the impact of Rs. 55 crore on account of interest on interest provision, following the order of the Honorable Supreme Court.
b.   Strong NIM improvement: The NIM for the full year FY21 was at 4.98% as compared to 3.91% in FY20. Quarterly NIM has improved to 5.09% in
     Q4 FY21 as compared to 4.61% in Q4 FY20.
c.   Strong growth in Total Income (NII + Fees and Other Income+ Trading Gain): The total income for the full year increased by 24% to Rs. 10,207
     crore in FY21 from Rs. 8,237 crore in FY20. Quarterly Total income grew 14% YOY to Rs. 2,801 crore in Q4 FY21 from Rs. 2,451 crore in Q4 FY20.
d.   Core Pre-Provisioning Operating Profit (excluding Trading gains & impact of interest on interest reversal): For the full year, the Core PPOP grew
     by 11% to Rs. 1,964 crore in FY21 from Rs. 1,764 crore in FY20. Quarterly Core PPOP de-grew by 1.5% YOY to Rs. 460 crore in Q4 FY21 as
     compared to Core PPOP of Rs. 468 crore in Q4 FY20.
e.   Provision: For the full year, Total Provisions stood at Rs. 2,638 crore in FY21 as compared to Rs. 4,754 crore in FY20. Quarterly provisions for Q4
     FY21 was Rs. 603 crore as compared to Rs. 679 crore in Q4 FY20.
      i.    Earlier, Capital First had portfolios like Loan Against Shares with ticket sizes above Rs. 20 lac and Loans with annual interest payments, which were
            permitted for an NBFC but are not permitted for a Bank. On merger with the Bank, the dispensation was provided by the RBI for the said portfolio
            which is no longer available. Because of the above, the Bank had to make one time provision of 100% to this outstanding portfolio amounting to Rs.
            89 crore in Q4-FY21.
f.   Profit After Tax: The Net Profit for the Full year FY21 was Rs. 452 crore as compared to loss of Rs. 2,864 crore in FY20. Quarterly Net Profit grew
     by 79% YOY to Rs. 128 crore in Q4 FY21 from Rs. 72 crore in Q4 FY20. Without the impact as mentioned in a(i) and e(i), the Net Profit of the Bank
     at the normalized tax rate, would be Rs. 140 crore for Q4-FY21 and Rs. 464 crore for FY21.
                                                                                                                                                6
Results Update: IDFC FIRST Bank: Strong Strides across all the Strategic Priorities
4. Asset Quality of the Bank remains resilient
• Bank’s Gross NPA marginally improved by 3 bps to 4.15% as of March 31, 2021 as compared to 4.18% as of December 31, 2020 (proforma).
• Bank Net NPA improved by 18 bps to 1.86% as of March 31, 2021 from 2.04% as of December 31, 2020 (proforma).
• Bank’s Gross & Net NPA were 2.60% and 0.94% respectively as on March 31, 2020 which increased in FY21 due to COVID-19 impact.
• Provision Coverage Ratio (PCR) improved by 388 bps to 56.23% as of March 31, 2021 from 52.35% as of December 31, 2020 (proforma). The PCR is at
  64.95% including the additional COVID-19 provision of Rs. 375 crore made in Q4-FY21 and carried forward to FY22.

Asset Quality on Retail Loan Book:
• Retail Asset Gross NPA increased by 13 bps to 4.01% as of March 31, 2021 from 3.88% as of December 31, 2020 (proforma). Retail Asset Net NPA
  improved by 45 bps to 1.90% as of March 31, 2021 from 2.35% as of December 31, 2020 (proforma).
• The GNPA and NNPA as on March 31, 2021 are higher by 175 bps and 77 bps respectively from the Pre-COVID average GNPA and NNPA of 2.27% and
  1.13% respectively (details provided in Page no 41). This is considered to be quite normal considering the pandemic situation. The management believes,
  as the economic activities revive, a significant portion of overdues will be collected bring the GNPA and NNPA back to pre-COVID level.
• The Bank has implemented a list of initiatives, specifically in credit policy and collections to factor for COVID-19 impact on its retail loans and the results
  of the same have been very positive.
      •   The New to Credit customers represent only 10% of the disbursals (by value) in Q4-FY21 as compared to 18% in Q4-FY19.
      •   83% of the customers sourced (by value) now in Q4-FY21 has Credit Bureau Score above 700 as compared to 61% in Q4-FY19.
      •   The overall collection efficiency for standard loans improved every month since July 2020 and in March 2021, it was near 100 % of the pre-covid (Feb-20) levels.
      •   Going forward, the Bank would continue to actively monitor the portfolio quality and tighten credit standard further in the context of the second wave of
          COVID-19 pandemic.

                                                                                                                                                7
Results Update: IDFC FIRST Bank: Strong Strides across all the Strategic Priorities
5. Strong Capital Adequacy:
• Capital Adequacy Ratio of the Bank was strong at 16.32% with CET-1 Ratio at 15.62% including additional equity capital of Rs. 3,000
  crore raised through QIP on April 6, 2021, calculated on figures as on March 31, 2021.
• Excluding the capital raised, the capital adequacy as of March 31 would have been 13.77% with CET-1 ratio of 13.27%.

6. Franchise:
• The Branch Network now stands at 596 branches, 592 ATMs and 85 recyclers across the country as on March 31, 2021.

                                                                                                                         8
9    SECTION 1: THE FOUNDING OF IDFC FIRST BANK

           17   SECTION 2: VISION & MISSION OF IDFC FIRST BANK

Table      20   SECTION 3: PRODUCT OFFERING

of         24   SECTION 4: FINANCIAL PERFORMANCES
Contents
           50   SECTION 5: DIRECTORS & SHAREHOLDERS

           55   SECTION 6: STRATEGY GOING FORWARD FOR THE COMBINED ENTITY
Section 1: The Founding of IDFC FIRST Bank..

 IDFC FIRST Bank was founded by the merger of Erstwhile IDFC
 Bank and Erstwhile Capital First on December 18, 2018.

Section 1: The Founding of IDFC FIRST Bank        10
Section 1: The Founding of IDFC FIRST Bank..
Erstwhile IDFC BANK                                                       Erstwhile CAPITAL FIRST LIMITED
IDFC Limited was set up in 1997 to finance infrastructure focusing        Mr Vaidyanathan who had built ICICI Bank’s Retail Banking business
primarily on project finance and mobilization of capital for private      from 2000-2009 and was then the MD and CEO of ICICI Prudential Life
sector infrastructure development. Whether it is financial                Insurance Company in 2009-10, started an entrepreneurial foray to
intermediation for infrastructure projects and services, whether          acquire a stake in an existing NBFC with the stated plan to convert the
adding value through innovative products to the infrastructure value      NBFC to a commercial bank focused on financing small businesses.
chain or asset maintenance of existing infrastructure projects, the       During 2010-12, he acquired a significant stake in a real-estate
company focused on supporting companies to get the best return on         financing NBFC through personal leverage, and launched businesses of
investments. The Company’s ability to tap global as well as Indian        financing small entrepreneurs and consumers. The NBFC wound down
financial resources made it the acknowledged experts in infrastructure    existing businesses and instead started businesses of financing such
finance.                                                                  segments within consumer and micro-entrepreneurs that not financed
Dr. Rajiv Lall joined the company in 2005 and successfully expanded       by existing banks, by using alternative and advanced technology led
the business to Asset Management, Institutional Broking and               models.
Infrastructure Debt Fund. He applied for a commercial banking license     He built a prototype for such financing (Rs 12000-Rs. 30,000, ~$300-
to the RBI in 2013. In 2014, the Reserve Bank of India (RBI) granted an   $500), built a loan book of Rs. 770 crore ($130m, March 2011) within a
in-principle approval to IDFC Limited to set up a new bank in the         year, and presented the proof of concept to many global private equity
private sector.                                                           players for a Leveraged Management Buyout.
Following this, the IDFC Limited divested its infrastructure finance      In 2012, he concluded India’s largest Leveraged Management Buyout,
assets and liabilities to a new entity - IDFC Bank- through demerger.     got fresh equity of Rs. 100 crore into the company and founded Capital
Thus IDFC Bank was created by demerger of the infrastructure lending      First as a new entity with new shareholders, new Board, new business
business of IDFC to IDFC Bank in 2015.                    Contd..         lines, and fresh equity infusion.                           Contd..

 Section 1: The Founding of IDFC FIRST Bank                                                                                  11
Section 1: The Founding of IDFC FIRST Bank..
Erstwhile IDFC BANK                                                         Erstwhile CAPITAL FIRST LIMITED
Continued from page 11                                                      Continued from page 11
The bank was launched through this demerger from IDFC Limited in            .. Between March 31, 2010 to March 31, 2018, the Company’s Retail
November 2015. During the subsequent three years, the bank                  Assets under Management increased from Rs. 94 crore ($14m) to Rs.
developed a strong and robust framework including strong IT                 29,625 crore ($4.3 b, Sep 2018). The company financed seven million
capabilities for scaling up the banking operations.                         customers for Rs. 60,000 crore ($8.5b) through new age technology
The Bank designed efficient treasury management system for its own          models.
proprietary trading, as well as for managing client operations. The         The company turned around from losses of Rs. 30 crore and Rs. 32
bank started building Corporate banking businesses. Recognizing the         crore in FY 09 and FY 10 respectively, to PAT of Rs. 327 crore ($ 4.7b) by
change in the Indian landscape, emerging risk in infrastructure             2018, representing a 5 year CAGR increase of 56%. The loan assets grew
financing, and the low margins in corporate banking, the bank               at a 5 year CAGR of 29%.
launched retail business for assets and liabilities and put together a      The ROE steadily rose from losses in 2010 to 15% by 2018. The market
strategy to retailize its loan book to diversify and to increase margins.   capitalization of the company increased ten-fold from Rs. 780 crore on
Since retail required specialized skills, seasoning, and scale, the Bank    in March 2012 at the time of the MBO to over Rs. 8,282 crore in
was looking for inorganic opportunities for merger with a retail lending    January 2018 at the time of announcement of the merger.
partner who already had scale, profitability and specialized skills.        As per its stated strategy, the company was looking out for a banking
                                                                            license to convert to a bank.
  As part of its strategy to diversify its loan book from infrastructure,
                                                                            Erstwhile Capital First, as part of its stated strategy, was on the
  the bank was looking for a merger with a retail finance institution
                                                                            lookout for a commercial banking license.
  with adequate scale, profitability and specialized skills.

 Section 1: The Founding of IDFC FIRST Bank                                                                                       12
Section 1: Erstwhile IDFC Bank history and track record (pre-merger)
IDFC Limited was an acknowledged leader and expert in financing Infrastructure Sector
Gross Funded Assets (INR bn) Liabilities (Sep 30,2018) Gross Funded Assets mix (1)
753 INR 753bn
702 709 • CASA balance was at Rs. 6,426 crore out of which
Retail CASA was Rs. 2,609 crore Retail
Others
• Total Term Deposits was at Rs. 29,943 crore with 11% 15%
524 Retail Term Deposits at Rs. 6,804 crore
• CASA Ratio was at 13.3%
• Legacy Borrowings through Long Term Bonds and
Infra Bonds were at Rs. 29,066 crore Wholesale
74%
Mar-16 Mar-17 Mar-18 Sep-18 • The Bank had 203 branches
Net Worth (INR bn) NIM (%) Borrowings + Deposits (1) (2)
153 2.1% INR 1,012bn
147 148 2.0% 1.9%
1.7% Retail Deposits
136 9%
Wholesale
Others
(2) Deposits
64%
27%
Mar-16 Mar-17 Mar-18 Sep-18 FY16 FY17 FY18 H1
FY19
Erstwhile IDFC Bank was focused on infrastructure financing in India, corporate banking and had took steps to diversify into retail banking
1. As on Sep 30, 2018
2. Others include borrowings, money market borrowings and Certificate of Deposits 13
Source: Annual Reports, Investor Presentations of IDFC BankSection 1: Erstwhile Capital First history and track record (pre-merger)
AUM (Rs. Cr) Profit (Rs. Cr) Cost to Income (%)
Wholesale AUM Retail AUM Total AUM 32,623
327
26,997 78% 80%
239 72% 74% 71%
19,824 206 59%
16,041
166 51% 51% 53% 48%
114
91%
11,975
94%
9,679 35 56
6,186 7,510
93%
3.8
86%
84%
2,751
81%
74%
56%
28%
935
10%
72%44% 26% 19% 16% 14% 7% 6% 9% -15.7
90% -46.2
FY10
FY11
FY12
Sep-18
FY14
FY13
FY15
FY16
FY17
FY18
FY10
FY11
FY12
H1-19
FY14
FY13
FY15
FY16
FY17
FY18
FY10
FY11
FY12
H1-19
FY15
FY13
FY14
FY16
FY17
FY18
Return on Equity (%) Earning Per Share (Rs.) Market Cap (Rs. Cr)
Mcap reduced
33.3 after merger
14.5% 8,282 announcement
11.9%13.3% 24.5 7,628
10.1% 20.8
8.3% 18.2 6,096
3.6% 4.9% 12.6
0.5% 6.4 3,634 3,937
4.9
0.6
1,174 902 782 1,152 1,478
-2.1%
-6.1% -2.5 -7.1
31-Mar-13
31-Mar-10
31-Mar-11
31-Mar-12
31-Mar-14
31-Mar-15
31-Mar-16
31-Mar-17
12-Jan-18
31-Mar-18
H1-19
H1-19
FY10
FY10
FY11
FY12
FY11
FY12
FY14
FY14
FY18
FY13
FY15
FY16
FY17
FY18
FY13
FY15
FY16
FY17
14Pre merger - Proforma Financials – P&L (H1 FY19)
In Rs. Crore Erstwhile IDFC Bank Erstwhile Capital First Proforma Total
Funded Assets / AUM 75,332 32,623 1,07,955
Net-Worth 14,776 2,928 17,704
NII 912 1,143 2,055
Fees & Other Income 256 153 409
Treasury Income 31 31
Total Income 1199 1,297 2,496
Opex 1108 616 1,724
PPOP 91 681 772
Provisions 562 363 925
PBT -471 317 (154)
NIM % 1.56% 8.20% 2.85%
RoA at PBT level % (0.75%) 2.26% (0.20%)
RoE % (at normalized level) (4.18%)* 14.51% (1.21%)
Cost to Income Ratio % 92.41% 47.52% 69.09%
Note: IDFC Bank and Capital First Limited (CFL) were in IGAAP and IND-AS respectively in H1-FY19
15Section 1: The Founding of IDFC FIRST Bank..
In January 2018, Erstwhile IDFC Bank and Erstwhile Capital First announced a merger. Shareholders of Erstwhile Capital First
were to be issued 13.9 shares of the merged entity for every 1 share of Erstwhile Capital First. Thus, IDFC FIRST Bank was
founded as a new entity by the merger of Erstwhile IDFC Bank and Erstwhile Capital First on December 18 2018.
• Post the merger, during the last 2 years, the Bank invested in the people, processes, products, infrastructure and technology to put
together all the necessary building blocks of a stronger foundation which is essential for a long-term growth engine.
• The bank restricted loan growth for two years in order to strengthen the liabilities franchise (CASA 8.7% at merger) first.
• Between 2018-2020 the Bank also accounted for legacy Infrastructure and Corporate loans that turned bad post-merger, which resulted
in reduction of net worth, and thus the Book Value per share reduced from Rs. 38.4 on December 31, 2018 to Rs. 31.90 on March 31,
2020.
• The COVID 19 crisis struck the system in March - April 2020.
• Because the Bank had successfully raised large quantities of retail CASA deposits prior to COVID19 and had replaced Certificate of
Deposits and bulk Corporate Deposits prior to the crisis, the Bank comfortably sailed through the COVID crisis on liquidity.
• Further, the Bank also successfully raised fresh equity of Rs. 2000 crores to strengthen the balance sheet in June 2020.
• The Bank now has a strong retail and CASA deposits franchise (CASA 51.75% as of March 2021) and looks forward for to steady growth
from here on.
• Further, the Bank raised additional equity capital of Rs. 3,000 crore through QIP on April 6, 2021.
• We are proud about our heritage of transparent disclosures, high levels of corporate governance, and swift action on dealing with
pressing strategic issues and for laying the foundation for future long-term growth.
• We sincerely thank our shareholders for their faith and trust in us during this period.
Section 1: The Founding of IDFC FIRST Bank 169 SECTION 1: THE FOUNDING OF IDFC FIRST BANK 17 SECTION 2: VISION & MISSION OF IDFC FIRST BANK 20 SECTION 3: PRODUCT OFFERING 24 SECTION 4: FINANCIAL PERFORMANCES 50 SECTION 5: DIRECTORS & SHAREHOLDERS 55 SECTION 6: STRATEGY GOING FORWARD FOR THE COMBINED ENTITY
Section 2: Vision and Mission Our Vision: To create a world-class bank in India for larger social good Our Mission: We want to touch the lives of millions of Indians in a positive way by providing high-quality banking products and services to them, with particular focus on aspiring consumers and entrepreneurs of our new India, using contemporary technologies. Organisation Theme Line: Section 2: Vision and Mission 18
Section 2: Key excerpts from MD & CEO’s Letter - Annual Report 2019-20 Theme of 2nd Annual Report after merger: AR 19-20: “Building a Strong Foundation“ Section 2: Vision and Mission 19
9    SECTION 1: THE FOUNDING OF IDFC FIRST BANK

17   SECTION 2: VISION & MISSION OF IDFC FIRST BANK

20   SECTION 3: PRODUCT OFFERING

24   SECTION 4: FINANCIAL PERFORMANCES

50   SECTION 5: DIRECTORS & SHAREHOLDERS

55   SECTION 6: STRATEGY GOING FORWARD FOR THE COMBINED ENTITY
Section 3: Loan offerings – IDFC FIRST Bank offers a bouquet of loan products..
.. across varied customer segments including Consumers and MSMEs in different parts of India
Prime Home Loans: Affordable Home Loans: Loan Against Property: New and Pre-owned Car Business Loans:
Starting at 6.9% to select Prime Smaller ticket size home loans to Long term loans to MSMEs after Unsecured Loans to the self-
Salaried Customer of top salaried and self-employed Loan:
proper evaluation of cash flows; employed individual or entity
corporates, Self-employed customers for purchasing house To salaried and self-employed
against residential or against business cashflows
customers for buying house property. customers for purchasing a new
commercial property
property. car or a pre-owned car
Personal Loans: Consumer Durable Loans: Two Wheeler Loans: Micro Enterprise Loans: JLG Loan for Women:
Unsecured Loans to the financing to individuals for To the salaried and self- Loan solutions to small business Sakhi Shakti loan is especially
salaried and self-employed purchasing of LCD/LED panels, employed customers for owner designed as the livelihood
customers for fulfilling their Laptops, Air-conditioners etc purchasing new two wheelers advancement for women,
financial needs primarily in rural areas
Apart from these products, IDFC FIRST Bank also offers Working Capital Loans, Corporate Loans for Business Banking and Corporate
Customers in India
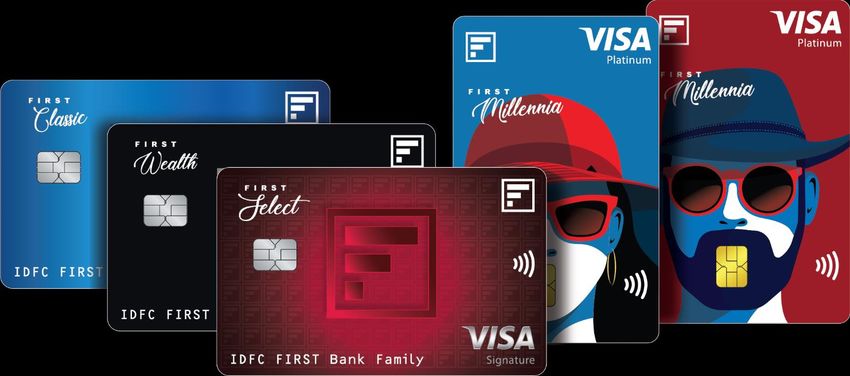
Section 3: Product Offering 21Section 3: Since Launch in January 2021, the Bank has issued 1.5 Lac Credit Cards till March
31, 2021
INDUSTRY
IDFC FIRST Bank Credit
Cards customer friendly
A Credit Card, like no other
initiatives Customer friendly card launched by the Bank, keeping in line with the ethos of
always customer first.
Multiple Fees (Annual/ Over Lifetime Free
Limit) (No Annual Fees ever)
No Charges for spends upto
Charges for spending over limit
10%*
Static and high interest rates
Dynamic Interest Rate
(36% to 48% APR)
(9% to 36% APR)$
(since last 30 years)
Often Complicated Reward Simple scheme, upto 10X
Points with T&Cs and Rewards reward points. No expiry.
expiry date Easy online redemption
Interest on ATM cash Interest-Free Cash
Super Saver Interest Interest Free Cash
withdrawal from Day 1 Withdrawal (up to next Lifetime free Super Rewarding
Rate (% APR Starting Withdrawal
billing cycle or 48 days, Credit Card Program
Entire outstanding deemed as from 9%) (up to next billing
revolver & charged interest whichever is earlier) cycle or 48 days,
whichever is earlier)
*Spending over limit is usually inadvertent by customers. Hence as a customer friendly measure, the Bank will intimate the customers if their spends are going above limit to avoid any
charges incurred by them. $Customer rates depending on algorithm, factoring in credentials, relationship with the bank and many other parameters
Section 3: Product Offering 22Section 3: Product Offerings – Liabilities, Payments and other Services
IDFC FIRST Bank provides wide range of Deposit facilities along with Savings Accounts, Deposit accounts, Wealth
Management, Forex Services, Cash Management Services and Insurance services to its customers.
Wealth Management Services, Payments and Online Services:
Investments and Insurance Distribution: ✓ Debit Cards & Prepaid Cards
✓ Investment Solutions ✓ NACH & BHIM UPI
✓ Personal Insurance Solutions
✓ Business Insurance Solutions
✓ Mutual Funds distribution
✓ Life, Health and General Insurance
distribution
Deposit Accounts:
✓ Savings Account Forex Services:
✓ Current Account ✓ Import and Export Solutions
✓ Corporate Salary Account ✓ Domestic Trade Finance
✓ Fixed Deposit ✓ Forex Solutions and Remittances
✓ Recurring Deposit ✓ Overseas Investments & Capital
A/C Transactions
Section 3: Product Offering 239 SECTION 1: THE FOUNDING OF IDFC FIRST BANK 17 SECTION 2: VISION & MISSION OF IDFC FIRST BANK 20 SECTION 3: PRODUCT OFFERING 24 SECTION 4: FINANCIAL PERFORMANCES 50 SECTION 5: DIRECTORS & SHAREHOLDERS 55 SECTION 6: STRATEGY GOING FORWARD FOR THE COMBINED ENTITY
SECTION 4:
       FINANCIAL PERFORMANCE
       OF THE BANK FOR Q3 FY21
•   Update on Liabilities
•   Assets Update
•   Assets Quality
•   Key Business & Financial Parameters
    ✓ Income Statement
    ✓ Balance Sheet
    ✓ Net Interest Margin
    ✓ Capital Adequacy
Section 4: The Bank has made strong progress in retailization of Liabilities. Retail liabilities
now comprise 77% of customer deposits, up from 27% at merger.
• The Bank is focused for retailization of the liabilities which is reflected in the growth in its Core Deposits.
• Such Deposits are sticky and sustainable in nature in comparison to Corporate Deposits or Certificate of Deposits.
• We are happy to report that the Bank has increased the Core Deposits (Retail CASA + Retail Term Deposits) as a % of Total Customer Deposits of the
Bank as on March 31, 2021 to 77% from 27% as on December 31, 2018 (merger quarter).
• The Liability Franchise is strong and well diversified across retail depositors.
Core Deposits (Retail CASA + Retail TD) Other Deposits Total Customer Deposits (Excl. CD)
Rs. 28,370 Cr Rs. 38,455 Cr Rs. 40,504 Cr Rs. 57,719 Cr Rs. 82,725 Cr
20% 23%
27%
33% 41%
59%
67%
80% 73% 77%
Mar-18 Dec-18 Mar-19 Mar-20 Mar-21
Section 4: Update on Liabilities 26Section 4: The Bank now has a strong and well diversified liability franchise
CASA Deposits has grown by Rs. 40,622 crore since merger with As a result, the CASA Ratio (%) of the Bank has grown from 8.68%
1 2 (Dec-18) at merger to 51.75% (Mar-21)
YoY growth (FY21) of 122%
45,896 51.75%
in Rs. crore
31.87%
20,661
7,893 11.54% 8.68% 11.40%
5,544 5,274
31 Mar 18 31 Dec 18 31 Mar 19 31 Mar 20 31 Mar 21 31 Mar 18 31 Dec 18 31 Mar 19 31 Mar 20 31 Mar 21
Average CASA Ratio (on daily CASA balances) (%) also shows With healthy growth of the Retail Deposits including CASA, the
3 strong improvement over the years 4 Bank successfully reduced dependency on Certificate of Deposits
in the last 2 years
50.23% 28,754
in Rs. crore
22,312
19,662
27.72%
8.39% 9.40% 7,111 5,964
6.05%
31 Mar 18 31 Dec 18 31 Mar 19 31 Mar 20 31 Mar 21 31 Mar 18 31 Dec 18 31 Mar 19 31 Mar 20 31 Mar 21
Section 4: Update on Liabilities 27Section 4: Granularization of the Customer Deposits through quality liability franchise
As part of the granularization, the Bank increased its Deposits Similarly, the Bank increased Deposits with balance Rs. 1 crore
1 2 and less, as % of total customer deposits, from 18% (Mar-18) to
with balance Rs. 5 crore and less, as % of total customer deposits,
from 28% (Mar-18) to 82% (Mar-21) 62% (Mar-21)
82% 62%
59%
41%
31% 37% 25%
28% 18% 21%
Mar-18 Dec-18 Mar-19 Mar-20 Mar-21 Mar-18 Dec-18 Mar-19 Mar-20 Mar-21
The Bank reduced the top 20 borrowers’ concentration as % of The Bank reduced the Top 10 borrowers’ concentration as % of
3 customer deposits from 42.0% (Mar-18) 7.7% (Mar-21), thus 4 customer deposits from 28.6% (Mar-18) to 5.5% (Mar-21) on
curtailing the concentration risk similar lines
42.0% 40.0% 28.6% 28.7%
35.4% 25.2%
20.4% 14.5%
7.7% 5.5%
31 Mar 18 31 Dec 18 31 Mar 19 31 Mar 20 31 Mar 21 31 Mar 18 31 Dec 18 31 Mar 19 31 Mar 20 31 Mar 21
Section 4: Update on Liabilities 28Section 4: The Bank continues to see strong growth in Retail Deposits. This has reduced the dependence on wholesale deposits and has provided greater stability. In Rs. Crore Mar-20 Dec-20 Mar-21 YOY% Legacy Long Term Bonds 12,013 9,460 7,892 -34% Legacy Infra Bonds 10,434 9,514 9,508 9% Refinance 14,738 8,297 15,438 5% Other borrowings 12,984 8,997 7,618 -41% Total Borrowings (A) 50,169 36,267 40,456 -19% CASA 20,661 40,563 45,896 122% Term Deposits* 37,058 36,726 36,829 -1% Total Customer Deposits (B) 57,719 77,289 82,725 43% Certificate of Deposits (C) 7,111 6,673 5,964 -16% Money Market Borrowings (D) 7,228 4,538 5,330 -26% Borrowings + Deposits (A)+(B)+(C)+(D) 122,227 124,768 134,475 10% CASA % of Deposits 31.87% 48.31% 51.75% Customer Deposits as % of Borrowings + Deposits 47.22% 61.95% 61.52% * Though the customer Term Deposits at Rs. 36,829 crores as of March 31 2021 has not grown YOY, the underlying composition of Terms Deposits have improved substantially. Retail Term Deposits were up 21% over last year and Wholesale Term Deposits were reduced by 21% YOY. Section 4: Update on Liabilities 29
SECTION 4:
       FINANCIAL PERFORMANCE
       OF THE BANK FOR Q4 FY21
•   Update on Liabilities
•   Assets Update
•   Assets Quality
•   Key Business & Financial Parameters
    ✓ Income Statement
    ✓ Balance Sheet
    ✓ Net Interest Margin
    ✓ Capital Adequacy
Section 4: Retail loans as a % of total loans has improved to 67% (including Retail PSL buyouts).
• The Bank provides financing for prime home loans, affordable home loans, business banking, loan against property, car loans, consumer durables and
other such products to salaried and self – employed individuals and entities which is a large opportunity in India.
• We have strong demonstrated capabilities on this front developed through greenfield efforts over the last 10 years and we have maintained high asset
quality, and consistently rising profitability over the years.
Retail Funded Assets Wholesale Funded Assets (incl Inorganic Portfolio) Total Funded Assets
Rs. 73,051 Cr Rs. 1,04,660 Cr Rs. 1,10,400 Cr Rs. 1,07,004 Cr Rs. 1,17,127 Cr
10%
35% 37% 37%
46%
54%
65% 63% 63%
90%
Mar-18 Dec-18 Mar-19 Mar-20* Mar-21
The Bank inorganically acquired portfolio as PSL retail loans. Including this as part of Retail Loan Book, the Retail contribution to the overall Loan
Assets is 67% as of March 31, 2021.
*Gross of Inter-Bank Participant Certificate (IBPC) transactions.
Section 4: Assets Update 31Section 4: Together, the Consumer and SME business has a rich history of 10 years with
stable growth and high Asset quality. All amounts are in Rs. crore unless specified
• Capital First was focused on growing the home loans, business loans, Consumer Loans, car loans and loan against property. The retail loan
book of erstwhile Capital First grew at CAGR of 35% between FY13 to FY18 to reach Rs. 29,625 crore.
• During this time, asset quality was high with GNPA maintained at 2% and Net NPA maintained at 1%.
• Erstwhile IDFC Bank started its retail loan book in
2016, primarily focused on prime home loans GROWTH CONTINUES POST
and rural micro finance. MERGER OF THESE BUSINESSES
• Taken together, the bank has strong capabilities ON BANK PLATFORM
in these businesses. 73,673
• We are confident that we can sustain the
66,665
growth of this business at ~ 25% over the next
many years. 59,860
57,310 56,043
53,685
PRE MERGER HISTORY
CAPITAL FIRST+IDFC BANK 39,233 40,812
36,236
32,281
IDFC FIRST Bank
Erstwhile IDFC Bank 20,634
Erstwhile CFL 13,876
5,560 7,883 10,113
3,460
94 771
Mar-10 Mar-11 Mar-12 Mar-13 Mar-14 Mar-15 Mar-16 Mar-17 Mar-18 Sep-18 Dec-18 Mar-19 Dec-19 Mar-20 Jun-20 Sep-20 Dec-20 Mar-21
^ Excluding ECLGS portfolio of Rs. 1,687 crore as of March 31, 2021
Section 4: Assets Update 32Section 4: The Bank reduced wholesale, infrastructure loan assets since merger; Top 10
borrowers’ concentration reduced.
The Bank reduced the wholesale funded assets by CAGR of 29% Out of this, infrastructure financing (Rs crore) has reduced by 41%
1 2
between Mar-19 and Mar-21 CAGR between Mar-19 to Mar-21
56,809 26,832
53,871 53,649 22,710 21,459
39,388
33,920 14,840
10,808
Mar-18 Dec-18 Mar-19 Mar-20 Mar-21 Mar-18 Dec-18 Mar-19 Mar-20 Mar-21
The Bank reduced Infrastructure financing portfolio as % of total The Bank also proactively reduced the concentration risk by improving
3 funded assets from 37% (Mar-18) to 9% (Mar-21) 4 top 10 borrowers’ concentration from 18.8% (Mar-18) to 5.9% (Mar-21)
36.73% 18.8%
12.8%
21.70% 19.44% 9.8%
13.87% 7.2% 5.9%
9.23%
Mar-18 Dec-18 Mar-19 Mar-20 Mar-21 Mar-18 Dec-18 Mar-19 Mar-20 Mar-21
Section 4: Assets Update 33Section 4: Total Funded Assets Breakup In Rs. Crore Mar-20 Dec-20 Mar-21 Growth% (YoY) Home Loans 7,736 9,367 10,613 37% Loan against Property 12,578 13,817 15,320 22% SME Loans 8,871 9,415 10,812 22% Wheels 8,875 10,162 10,763 21% Consumer Loans 11,722 13,159 13,949 19% Credit Card - 86 428 - Rural 6,687 7,247 7,658 15% Others 841 1,714 2,443 190% Total Retail Funded Assets (Excl. ECLGS Portfolio) 57,310 64,967 71,987 26% ECLGS Portfolio - 1,699 1,687 - Total Retail Funded Assets (A) 57,310 66,665 73,673 29% Corporates 24,548 23,207 23,112 -6% - Conglomerates 839 1,401 1,345 60% - Large Corporates 1,540 1,782 1,898 23% - Emerging Large Corporates 6,629 6,864 7,115 7% - Financial Institutional Group 12,645 10,876 10,960 -13% - Others 2,894 2,283 1,794 -38% Infrastructure 14,840 11,602 10,808 -27% Total Wholesale Funded Assets (B) 39,388 34,809 33,920 -14% PSL Inorganic (C) 7,954 6,694 7,436 -7% SRs and Loan Converted into Equity (D) 2,351 2,300 2,097 -11% Total Funded Assets (A)+(B)+(C)+(D) 107,004 110,469 117,127 9% Note: The figures above are gross of Inter-Bank Participant Certificate (IBPC) transactions. The SME Loans include Business Loans, Business Banking, Micro Credit. The Wheels include TW Loans, Car Loans and CV Loans. The Consumer Loans include Consumer Durable Loans, PL including cross-sell loans. Others includes portfolio buyout, trade finance, digital lending etc. Section 4: Assets Update 34
Section 4: Key Strategic Step going forward..

• Thus far, the bank has specialised in providing loans in the affordable segment, where yields have been
  between 8 to 9%. Our asset quality has been high and experience in the segment has been excellent.
• Based on the strong inflow on retail liabilities into the Bank and surplus liquidity, the Bank has reduced the
  Savings Rate to 4% for balance below Rs. 1 lac and reduced the peak savings account interest rate to 5%.
• Consequent to the rate reduction of savings accounts, the Bank can now afford to participate in the prime
  segments of all businesses including the prime home loans to employees of top corporates at a very
  competitive interest rate starting at 6.9%, in line with market for this segment.
• This will open up a new and large market with higher asset quality for our Bank and set up the Bank for
  continuous and sustainable book growth as home loans have comparative longer tenure up to 20 years.

Section 4: Assets Update                                                                              35
SECTION 4:
       FINANCIAL PERFORMANCE
       OF THE BANK FOR Q3 FY21
•   Update on Liabilities
•   Assets Update
•   Assets Quality
•   Key Business & Financial Parameters
    ✓ Income Statement
    ✓ Balance Sheet
    ✓ Net Interest Margin
    ✓ Capital Adequacy
Section 4: Bank maintains strong overall Asset Quality
Dec-19 Proforma Dec-20 Mar-21 Sequential (QoQ)
In Rs. Crore Mar-20
(Pre-Covid) (Post-Covid) (Post-Covid) movement
GNPL 2,511 2,280 4,044 4,303 Increased by Rs. 259 crore
Provisions for GNPL 1,440 1,471 2,117 2,420 Increased by Rs. 303 crore
NNPL 1,071 809 1,927 1,883 Decreased by Rs. 44 crore
GNPA (%) 2.83% 2.60% 4.18% 4.15% Decreased by 3 bps
NNPA (%) 1.23% 0.94% 2.04% 1.86% Decreased by 18 bps
Provision Coverage Ratio % 57.35% 64.53% 52.35% 56.23% Increased by 388 bps
• Earlier, the Supreme Court vide an interim order dated September 03, 2020 had directed to stop NPA classification till further orders. The interim
order granted to not declare accounts as NPA stood vacated on March 23, 2021 vide the judgement of the Honourable Supreme Court.
Accordingly, the Bank has continued with asset classification of borrower accounts as per the extant RBI Instructions.
• Including the additional COVID-19 provision of Rs. 375 crore made in Q4-FY21 and carried forward to FY22, the PCR would be 64.95% on reported
GNPA and NNPA as on March 31, 2021.
• The total restructured (approved & implemented) book including retail and wholesale loans stood at 0.9% of the total funded assets.
Section 4: Assets Quality 37Section 4: In addition to declared Wholesale NPA accounts, Bank has proactively identified the following
wholesale accounts, which are standard on the books but are stressed or potential NPAs, and taken
provisions for the same proactively.
O/S
Client Description (Rs. Crore) Provision PCR% Comments
Exposure
Toll Road Projects in MH 873 154 18% The repayment has been consistently delayed (SMA2) but account is regular as of date.
Account suffers from delayed payments from Discoms. The account is regular as it is benefiting from the RBI Covid
Thermal Power Project in Orissa 534 534 100% schemes. We expect the account to be resolved leading to a positive economic value to the Bank, as the account is fully
provided for.
Toll Road (BOT) project in MH 251 13 5% Operating project, toll is being collected, account is being serviced.Section 4: Exposure to identified Stressed Assets mentioned in previous slide, has reduced
by 45% since March 2019
All amounts are in Rs. crore unless specified
O/s Exposure Provision Provision coverage
23% 47% 47% 50% 49% 52% 48% 51% 48%
4,138
3,804
3,544 3,518
3,205 3,195
2,717
2,528
2,264
1,786 1,663 1,773 1,668
1,569
1,303 1,285
957 1,082
Mar-19 Jun-19 Sep-19 Dec-19 Mar-20 Jun-20 Sep-20 Dec-20 Mar-21*
*Apart from the accounts mentioned above, the Bank had also marked one large telecom account as stressed and provisioned 15% against outstanding of Rs. 2,000
crore (Funded) and against Rs. 1,244 crore (Non Funded). The said account is current and has no overdues as of March 31 2021.
Section 4: Assets Quality 39Section 4: The asset quality trends over the last 8 years at Capital First is displayed below
as a demonstration of our trend in asset quality and our capabilities in this space.
Since most of the loan book in the merged entity has been built and seasoned in Capital First prior the merger and the same model is being scaled
up now, we present below the asset quality trends of the book in Capital First which have stayed steady over the years, i.e. Gross NPA ~2% and Net
NPA ~1%. The portfolio remained stable even after being stress tested through economic slowdown in 2010-2014, demonetization (2016), GST
implementation (2017) and economic slowdown in recent times. Hence gives us confidence to grow in future on this strong asset quality model.
Largely Wholesale Loan
5.28% Book during this phase CFL-GNPA CFL-NNPA
During this phase, the Company transformed into a Retail Financing Player with introduction of many Retail Loans products and consequently the
quality improved and remained high over the years. (Section of the Graph is representative)
3.78%
Demonetization GST Launched
Nov 8th 2016 July 1st 2017
1.74% 1.71% 1.59% 1.65% 1.72% 1.63% 1.59% 1.62% 1.57%
1.52%
1.21% 1.13% 1.04%
0.97% 1.00% 1.00% 1.00% 0.97% 1.00% 1.00%
31-Mar-10 31-Mar-16 30-Jun-16 30-Sep-16 31-Dec-16 31-Mar-17 30-Jun-17 30-Sep-17 31-Dec-17 31-Mar-18 30-Jun-18
Note: NPA recognition norm migrated to 90 dpd effective from 01 April, 2017.
Section 4: Assets Quality 40Section 4: Retail Loans - Gross and Net NPA
Long term pre-COVID Proforma Covid Impact Sequential (QoQ)
Mar-21
Average (A) Dec-20 (C – A) Change (C - B)
(C)
(Mar-19 to Dec-19) (B) (bps) (bps)
Gross NPA - Retail Increased by
2.27% 3.88% 4.01% 175
13 bps
Net NPA - Retail Decreased by
1.13% 2.35% 1.90% 77
45 bps
Provision Coverage Increased by
Ratio (%) 51% 39% 53% 300
1319 bps
• In the Pre-Covid time, the Bank was sustainably maintaining the Gross NPA and Net NPA level of the Retail Loan Book around 2.3% and 1.1%
respectively. Due to the Covid-19 impact and the subsequent lockdown and moratorium which ended by August 2020, the GNPA and NNPA of the
Bank in Retail Loans increased by 175 bps and 77 bps respectively as compared to Pre-Covid average level. This magnitude of increase in NPA levels in
considered normal in the context of COVID-19 impact on the banking system.
• The Cheque/ECS/NACH bounce trend over the months has improved since July 2020 and the Bank is confident of getting back to pre-Covid level of
GNPA and NNPA in due course, as and when the economy revives to normalcy.
Section 4: Assets Quality 41Section 4: Continuous improvement in Retail Loan Underwriting over the years
• The first step in disbursing retail loans is credit policy and underwriting. Even prior to arrival of Covid-19, the bank has been continuously improving
its credit underwriting based on experience by tightening its underwriting policy filters.
• This has resulted in increased percentage of customers who have credit track record on the credit bureau. In Q4 FY19, 83% of loan bookings done by
the bank (by value) had a credit bureau record, and 17% were new to credit customers. As a result of continuous improvement in underwriting, in Q4
FY21, only 10% customers disbursed are new to credit customers.
Retail Loan Disbursal: Customers (by Value) with Credit Retail Loan Disbursals: Customers (by Value) with Credit
Bureau Record as % of total Retail Disbursals Bureau Score of more than 700 as % of total Retail
Disbursals 83%
91% 90% 85%
89% 81%
89% 80% 78%
87%
87%
85% 85% 75%
85% 84%
83%
83% 82% 70% 68%
65%
81% 65% 62%
79% 60% 60% 60%
77% 60%
77%
75% 55%
Q4FY19 Q1FY20 Q2FY20 Q3FY20 Q4FY20 Q1FY21 Q2FY21 Q3FY21 Q4FY21 Q4FY19 Q1FY20 Q2FY20 Q3FY20 Q4FY20 Q1FY21 Q2FY21 Q3FY21 Q4FY21
Section 4: Assets Quality 42Section 4: Incremental controls implemented in the light of COVID-19
• Further, in the light of the Covid-19, the bank has implemented a number of new measures to restrict lending to sectors affected by the
pandemic. All new bookings that have been done post-pandemic already factors for pandemic related restrictions for lending to sectors
and segments affected by COVID-19. Examples of such initiatives include –
i. Implemented sector restrictions for underwriting in the COVID-19 affected sectors
ii. Reduction of Authority Limits for Credit Appraisals
iii. Implemented additional caps on individual ticket sizes on incremental loans
iv. Reduced the LTV limits in certain categories
v. Revised restrictions on collaterals
vi. Revised criteria for bureau score cut-offs and tightened the criteria for number of credit enquiries on the bureau
vii. Increased requirement for FOIR (Fixed Obligations to Income Ratio to estimate the customer’s ability to repay monthly instalments)
viii. Increased checking whether the customer has availed moratorium, also subsequent track record
ix. Increased average balance requirements for our average Bank Balance based lending program
x. Revised preapproved prequalified program with increased scrutiny;
• Consequent to these new criteria and restrictions implemented in the light of Covid-19, the new bookings done post-July 2020 are showing
significantly better credit performance (adjusted for like-to-like vintage) as compared to pre-pandemic loan bookings, as these new loan bookings
post July 2020 already factor for Covid-19 impacted industries.
• During COVID wave 1, the cheques/ECSs/NACHs bounce increased to 2.5X from the Pre-COVID bounce levels, but when economic revival happened
between September 20 to March 21, cheque returns have been dropping consistently and reached to 1.2X of Pre-Covid level in March 2021.
• Collection Efficiency for the Bank has improved every month since July 2020 and in March 2021, the collection efficiency has reached 100% of the
Pre-COVID collection efficiency levels.
Section 4: Assets Quality 43SECTION 4:
FINANCIAL PERFORMANCE
OF THE BANK FOR Q3 FY21
• Update on Liabilities
• Assets Update
• Assets Quality
• Key Business & Financial Parameters
✓ Income Statement
✓ Balance Sheet
✓ Net Interest Margin
✓ Capital AdequacySection 4: Income Statement – For the year ended March 31, 2021 In Rs. Crore FY20 FY21 Growth (%)Y-o-Y Interest Income 16,308 15,9681 -2% Interest Expense 10,232 8,588 -16% Net Interest Income 6,076 7,380 21% Fee & Other Income 1,550 1,622 5% Operating Income (Excl Trading Gain) 7,625 9,002 18% Trading Gain 612 1,204 97% Operating Income 8,237 10,207 24% Operating Expense 5,861 7,093 21% Pre-Provisioning Operating Profit (PPOP) 2,376 3,113 31% Core PPOP (Ex. Trading gain and Interest on interest reversal) 1,764 1,964 11% Provisions 4,754 2,6382,3 -45% Profit Before Tax (2,379) 4764 Tax 486 245 -95% Profit After Tax (2,864) 452 1. Includes reversal of Interest on Interest Rs. 55 crore in Q4 FY21 following the Supreme Court order 2. Earlier, Capital First had portfolios of Loan Against Shares with ticket sizes above Rs. 20 lac and Loans with annual interest payments, which were permitted for an NBFC, but not permitted in the Bank. On merger with the Bank, the dispensation was provided by the RBI for the said portfolio which is no longer available. Because of the same, the Bank was required to make 100% provision to this outstanding portfolio, and the provisions on this count amounted to Rs. 89 crore in Q4-FY21. 3. The provisions included the reversal of provisions of Rs. 324 crores on account of one large telecom account. The Bank created COVID 19 provisions for Rs. 375 crores and carried it into FY 22. 4. Without the impact of the point 1 and 2 mentioned above, the PBT for FY21 would be Rs. 620 crore and with normalized tax rate, the corresponding PAT would be Rs. 464 crore for FY21 5. Includes de-recognition of DTA on goodwill pursuant to recent changes in Finance Act and benefit on account of DTA reassessment at March 31, 2021 Section 4: Key Business & Financial Parameters 45
Section 4: Quarterly Income Statement
In Rs. Crore                                                                                Q4 FY20             Q3 FY21            Q4 FY21 Growth% (QoQ)                       Growth% (YoY)
Interest Income                                                                               4,092               4,101             3,9931            -3%                                 -2%
Interest Expense                                                                              2,392               2,209              2,033            -8%                                -15%
Net Interest Income                                                                           1,700               1,892              1,960             4%                                 15%
Fee & Other Income                                                                              432                 582                600             3%                                 39%
 Operating Income (Excl Trading Gain)                                                         2,132               2,474              2,561             3%                                 20%
Trading Gain                                                                                    319                 290                241           -17%                                -24%
Operating Income                                                                              2,451               2,764              2,801             1%                                 14%
Operating Expense                                                                             1,664               1,991              2,156             8%                                 30%
Pre-Provisioning Operating Profit (PPOP)                                                        787                 773                646           -16%                                -18%
Core PPOP (Ex. Trading gain and Interest on interest reversal)                                  468                 484                460            -5%                                 -2%
Provisions                                                                                      679                 595              6032,3            1%                                -11%
                                                                                                                                          4
Profit Before Tax                                                                               107                 179                 43           -76%                                -60%
                                                                                                                                          5
Tax                                                                                              36                  49               (85)          -272%                              -336%
Profit After Tax                                                                                 72                 130                128            -1%                                 79%
1. Includes reversal of Interest on Interest Rs. 55 crore in Q4 FY21 following the Supreme Court order
2. Earlier, Capital First had portfolios of Loan Against Shares with ticket sizes above Rs. 20 lac and Loans with annual interest payments, which were permitted for an NBFC, but not permitted in
   the Bank. On merger with the Bank, the dispensation was provided by the RBI for the said portfolio which is no longer available. Because of the same, the Bank was required to make 100%
   provision to this outstanding portfolio, and the provisions on this count amounted to Rs. 89 crore in Q4-FY21.
3. The provisions included the reversal of provisions of Rs. 324 crores on account of one large telecom account. The Bank created COVID 19 provisions for Rs. 375 crores and carried it into FY 22.
4. Without the impact of the point 1 and 2 mentioned above, the PBT for Q4FY21 would be Rs. 188 crore and with normalized tax rate, the corresponding PAT would be Rs. 140 crore for Q4FY21
5. Includes de-recognition of DTA on goodwill pursuant to recent changes in Finance Act and benefit on account of DTA reassessment in Q4-FY21

 Section 4: Key Business & Financial Parameters                                                                                                                       46
Section 4: Balance Sheet
Growth (%)
In Rs. Crore Mar-20 Dec-20 Mar-21
(Y-o-Y)
Shareholders' Funds 15,343 17,668 17,808 16%
Deposits 65,108 84,294 88,688 36%
- Retail Deposits 33,924 58,435 63,894 88%
- Wholesale Deposits (including CD) 31,184 25,859 24,795 -20%
Borrowings 57,397 40,805 45,786 -20%
Other liabilities and provisions 11,353 12,909 10,861 -4%
Total Liabilities 149,200 155,676 163,144 9%
Cash and Balances with Banks and RBI 4,191 7,141 5,828 39%
Net Funded Assets 98,062 106,263 111,758 14%
- Net Retail Funded Assets 54,848 66,731 72,334 32%
- Net Wholesale Funded Assets* 43,214 39,532 39,425 -9%
Investments 35,841 33,037 36,719 2%
Fixed Assets 1,038 1,233 1,266 22%
Other Assets 10,069 8,003 7,572 -25%
Total Assets 149,200 155,676 163,144 9%
*includes credit investments (Non-Convertible Debentures, RIDF, PTC, SRs and Loan Converted into Equity)
Section 4: Key Business & Financial Parameters 47Section 4: Strong improvement in Net Interest Margin %
• The NIM of the bank has accelerated to 5.09% post merger (Q4-FY21) despite accounting for reversal of Interest on Interest of Rs. 55 crore.
• Interest income from the loans originated through Business correspondents being booked net of the origination and servicing expense incurred
by business correspondents. Effective from Q4 FY21 such income is now booked as gross interest income and the origination expenses pertaining
to this book is included in the operating expense line of the Bank. For the fair comparison purposes, the previous period interest income and
opex figures, and as a result, the NIM% have been reinstated.
• As per our earlier guidance, we aspire to take it to 5-5.5% in the next 5 years. We are on track for reaching there.
4.91% 5.04% 5.09%
4.86%
4.61%
4.16%
Post - Merger 3.69%
3.10% 3.24% 3.23%
(Pre – Merger)
1.84%
Q2 FY19 Q3 FY19 Q4 FY19 Q1 FY20 Q2 FY20 Q3 FY20 Q4 FY20 Q1 FY21 Q2 FY21 Q3 FY21 Q4 FY21
Section 4: Key Business & Financial Parameters 48Section 4: Capital Adequacy Ratio, including additional equity capital of Rs. 3,000 crore
raised in April 2021, is at 16.32% with CET-1 Ratio at 15.62%
Mar-21
In Rs. Crore Mar-20 Dec-20 Mar-21
(Incl Capital Raise)
Common Equity 14,690 17,287 16,974 19,988
Tier 2 Capital Funds 90 629 647 887
Total Capital Funds 14,780 17,917 17,622 20,875
Total RWA 110,481 125,052 1,27,944 1,27,944
CET 1 Ratio (%) 13.30% 13.82% 13.27% 15.62%
Total CRAR (%) 13.38% 14.33% 13.77% 16.32%
▪ The regulatory requirement for the Capital Adequacy Ratio is 10.875% with CET-1 Ratio at 7.375% and Tier I at 8.875% as per the RBI Guidelines.
▪ The Bank has successfully raised Rs. 3,000 crore of equity capital through QIP process by allotting new equity shares to marquee international
and domestic investors in April 2021. The process began in the last week in February 2021 and was completed in the first week of April 2021.
Section 4: Key Business & Financial Parameters 499 SECTION 1: THE FOUNDING OF IDFC FIRST BANK 17 SECTION 2: VISION & MISSION OF IDFC FIRST BANK 20 SECTION 3: PRODUCT OFFERING 24 SECTION 4: FINANCIAL PERFORMANCES 50 SECTION 5: DIRECTORS & SHAREHOLDERS 55 SECTION 6: STRATEGY GOING FORWARD FOR THE COMBINED ENTITY
Section 5: Board of Directors
                                        With over two decades in financial services in India, V. Vaidyanathan has seen India through many lens – first as a banker (1990-2010, Citibank), then as
                                        an entrepreneur (2010-2019, Capital First) and a professional banker again (2019- date, after merging Capital First with IDFC Bank). He worked with
                                        Citibank Consumer Banking from 1990-2000, then set up ICICI Group’s retail banking from 2000-2009 since its inception, built ICICI Bank’s branch
                                        network to 1411 branches and 28 million customers, built a large CASA and retail deposits franchise, and built the retail lending businesses including
                                        mortgages, auto loans, credit cards and personal credit businesses to Rs. 1.35 trillion ($30 bn). He was appointed at the Board of ICICI Bank in 2006 at
                                        age 38. In 2009, he became the MD and CEO of ICICI Prudential Life Insurance Company in India.
                                        In 2010, he quit ICICI Group for an entrepreneurial opportunity to acquire an NBFC with an idea to convert it to a bank focused on consumer and MSME
                                        lending. On acquiring equity stake, he shut down all non-core businesses like broking and real estate financing, and instead used the NBFC platform to
                                        build MSME and Consumer Financing businesses, based on new technologies and algorithms. Between 2010 to 2018, he grew the loan book from start-
                                        up stage to Rs. 29,600 crores (US$4.05 bn), grew the equity capital from Rs. 691 crores (US$118 mn) to Rs. 3,993 crores (US$600 mn), reduced Gross
                                        NPA from 5.28% to 1.94%, reduced Net NPA from 3.6% to 1%, acquired 7 million customers, got the long-term credit rating upgraded from A+ to AAA,
                                        turned around the company from losses of US$5 mn (2010) to profit of US$50 mn (2018), increased ROE from -6% to +15%, and increased the market
                                        cap 10 times from Rs. 780 crores (US$120 mn) to Rs. 8,200 crores (US$1.2 bn) in 8 years. Capital First was growing at a 5-year CAGR of loan growth of
                                        30%, and 55% in PAT between 2013-2018.
Then, in order to secure a commercial banking license, he agreed to merge Capital First with IDFC Bank in December 2018 and took over as the MD and CEO of the merged entity. Since then,
between December 2018 to March 2021, he has increased retail loan book from 13.16% pre-merger to 62.89% (Rs. 73,673 crores) of the total funded assets, increased Net Interest margin from
1.84% pre-merger to 5.09%, increased CASA from 8.68% to 51.75%, turned the bank into profitability, and is currently busy converting the bank into a world-class retail bank in India. The bank
now has over 10 million customers and loan book of more than Rs. 1 lac crores (~US$14 bn). He believes India provides unlimited opportunity in financial services in India.
During his career, he and his organization have received a number of domestic and international awards including the prestigious CNBC Awaaz Entrepreneur of the year 2020, CNBC Asia’s
"Innovative company of the year" India Business Leader Awards-2017, "Most Inspirational Leveraged Management Buyout, India 2018" by CFI Awards, "Entrepreneur of the Year" Award at Asia
Pacific Entrepreneurship Awards 2017, "Transformational Leader 2018" by CFI Awards UK, "Financial Services Company of the Year, 2018 - VC Circle", "Outstanding contribution to Financial
Inclusion, India, 2017" from Capital Finance International, London, "Most Promising Business Leaders of Asia" 2016 by Economic Times, 'Outstanding Entrepreneur Award' in Asia Pacific
Entrepreneurship Awards 2016, Greatest Corporate Leaders of India- 2014, Business Today - India's Most Valuable Companies 2016 & 2015, Economic Times 500 India's Future Ready
Companies 2016, Fortune India's Next 500 Companies 2016, Dun & Bradstreet India's Top 500 Companies & Corporates 2016 & 2015. During his prior stint, awards included "Best Retail bank in
Asia 2001", "Excellence in Retail Banking Award" 2002, "Best Retail Bank in India 2003, 2004, and 2005" from the Asian Banker, "Most Innovative Bank" 2007, "Leaders under 40" from Business
Today in 2009, and was nominated "Retail Banker of the Year" by EFMA Europe for 2008.
He is an alumnus of Birla Institute of Technology and Harvard Business School. He has run 23 half-marathons and 8 full marathons.

  Section 5: Directors and Shareholders                                                                                                                              51
You can also read