Investor Presentation - Q1 FY22 - IDFC FIRST Bank
←
→
Page content transcription
If your browser does not render page correctly, please read the page content below
Investor Presentation – Q1 FY22

Disclaimer

This presentation has been prepared by and is the sole responsibility of IDFC FIRST Bank (together with its subsidiaries, referred to as the “Company”). By
accessing this presentation, you are agreeing to be bound by the trailing restrictions.
This presentation does not constitute or form part of any offer or invitation or inducement to sell or issue, or any solicitation of any offer or recommendation to
purchase or subscribe for, any securities of the Company, nor shall it or any part of it or the fact of its distribution form the basis of, or be relied on in
connection with, any contractor commitment therefore. In particular, this presentation is not intended to be a prospectus or offer document under the
applicable laws of any jurisdiction, including India. No representation or warranty, express or implied, is made as to, and no reliance should be placed on, the
fairness, accuracy, completeness or correctness of the information or opinions contained in this presentation. Such information and opinions are in all events
not current after the date of this presentation. There is no obligation to update, modify or amend this communication or to otherwise notify the recipient if
information, opinion, projection, forecast or estimate set forth herein, changes or subsequently becomes inaccurate.
Certain statements contained in this presentation that are not statements of historical fact constitute “forward-looking statements.” You can generally identify
forward-looking statements by terminology such as “aim”, “anticipate”, “believe”, “continue”, “could”, “estimate”, “expect”, “intend”, “may”, “objective”, “goal”,
“plan”, “potential”, “proforma”, “project”, “pursue”, “shall”, “should”, “will”, “would”, or other words or phrases of similar import. These forward-looking
statements involve known and unknown risks, uncertainties, assumptions and other factors that may cause the Company’s actual results, performance or
achievements to be materially different from any future results, performance or achievements expressed or implied by such forward-looking statements or
other projections. Important factors that could cause actual results, performance or achievements to differ materially include, among others: (a) material
changes in the regulations governing our businesses; (b) the Company's inability to comply with the capital adequacy norms prescribed by the RBI; (c) decrease
in the value of the Company's collateral or delays in enforcing the Company's collateral upon default by borrowers on their obligations to the Company; (d) the
Company's inability to control the level of NPAs in the Company's portfolio effectively; (e) certain failures, including internal or external fraud, operational
errors, systems malfunctions, or cyber security incidents; (f) volatility in interest rates and other market conditions; and(g) any adverse changes to the Indian
economy.
This presentation is for general information purposes only, without regard to any specific objectives, financial situations or informational needs of any particular
person. The Company may alter, modify, regroup figures wherever necessary or otherwise change in any manner the content of this presentation, without
obligation to notify any person of such change or changes.

                                                                                                                                               2
Bank At a Glance (as of 30 June 2021)

             Gross                           Retail                         Customer                          CASA
             Funded                          Assets (%)                     Deposits                          Ratio
             Assets

                ₹ 1,13,794 Cr                          64%*                      ₹ 84,893 Cr                         50.86%
                    9% (Y-o-Y)                                                      36% (Y-o-Y)
                                            % of Gross Funded Assets                                             % of Total Deposits

              Capital                        Net                             Rating                          Branches
              Adequacy                       Worth                                                           (#)
              Ratio (%)
                                                                              Tier-2 bonds:
                                                                              AA (CRISIL)
                   15.56%                       ₹ 20,170 Cr                   Fixed Deposits:
                                                                                                                      601
                  CET-1: 14.86%
                                                   16% (Y-o-Y)                FAAA (CRISIL)

*Retail Assets including Inorganic PSL Buyouts, where the underlying assets are retail, constitutes 68% of the Overall Funded Assets
                                                                                                                                 3
5    PROGRESS SINCE MERGER

           7    MANAGEMENT COMMENTARY ON Q1-FY22 RESULTS

                CREATION OF IDFC FIRST BANK
Table      15

of         24   VISION & MISSION OF IDFC FIRST BANK
Contents
           27   PRODUCT OFFERINGS

           36   BUSINESS & FINANCIAL PERFORMANCE

           54   BOARD OF DIRECTORS & KEY SHAREHOLDERS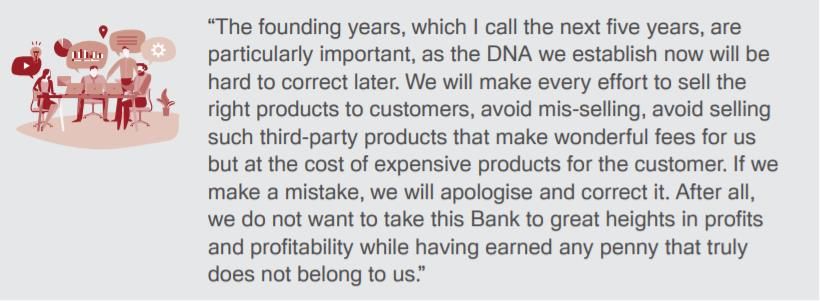
Key Metrics and our progress vis-à-vis Guidance provided at the time of the                                                                                                             Progress Since
                                                                                                                                                                                               Merger
    merger in Dec 2018
                                                                               Dec-18                                                                                   Guidance given at the time
                             Particulars                                                           Mar-19                 Mar-20               Mar-21          Jun-21                                 Status
                                                                          (At Merger)                                                                                    of merger for FY24-FY25
C
A   Net-worth                                                           Rs. 18,736 Cr       Rs. 18,159 Cr          Rs. 15,343 Cr      Rs. 17,808 Cr     Rs. 20,170 Cr
P
I                                                                                                                                                                                                      On
    CET – 1 Ratio                                                              16.14%              15.27%                 13.30%             13.27%          14.86%             >12.5 % *
T                                                                                                                                                                                                     Track
A                                                                                                                                                                                                      On
L   Capital Adequacy (%)                                                       16.51%              15.47%                 13.38%             13.77%          15.56%             >13.0 % *
                                                                                                                                                                                                      Track
    CASA Deposits                                                        Rs. 5,274 Cr         Rs. 7,893 Cr         Rs. 20,661 Cr      Rs. 45,896 Cr     Rs. 46,439 Cr

    CASA as a % of Deposits (%)                                                 8.68%              11.40%                 31.87%             51.75%          50.86%
L                                                                                                                                                                             30% (FY24),
                                                                                                                                                                                                     Achieved
                                                                                                                                                                             50% thereafter
I   Average CASA Ratio (%)                                                      8.39%                9.40%                27.72%             50.23%          50.26%
A
B   Core Deposits as a % of Total Deposits & Borrowings                         8.04%                9.49%                27.76%             47.51%          47.10%               50%                On Track
I
    Branches (#)                                                                   206                  242                   464                596             601             800-900             On Track
L
I
    Customer Deposits
Key Metrics and our progress vis-à-vis Guidance provided at the time of the                                                                                                                Progress Since
                                                                                                                                                                                                  Merger
    merger in Dec 2018

                                                                          Dec-18                                                                                          Guidance given at the time
                          Particulars                                                       Mar-19            Mar-20                 Mar-21                Jun-21(YoY)                               Status
                                                                     (At merger)                                                                                           of merger for FY24-FY25

    Retail Funded Assets                                            Rs. 36,236 Cr Rs. 40,812 Cr Rs. 57,310 Cr                Rs. 73,673 Cr       Rs. 72,766 Cr (30%^)           Rs. 100,000 Cr          On Track
    Retail as a % of Total Funded Assets                                      35%               37%              54%                   63%                          64%                 70%             On Track
    Wholesale Funded Assets                                         Rs. 56,809 Cr Rs. 53,649 Cr Rs. 39,388 Cr                Rs. 33,920 Cr        Rs. 32,148 Cr (-15%)          < Rs. 40,000 Cr         On Track
A
    - of which Infrastructure loans                                 Rs. 22,710 Cr Rs. 21,459 Cr Rs. 14,840 Cr                Rs. 10,808 Cr        Rs. 10,346 Cr (-23%)           Nil in 5 years         On Track
S
S   Top 10 borrowers as % of Total Funded Assets (%)                        12.8%              9.8%              7.2%                 5.9%                         5.8%               < 5%              On Track
E
T   GNPA (%)                                                                1.97%            2.43%             2.60%                 4.15%                       4.61%*              2-2.5%             On Track
S   NNPA (%)                                                                0.95%            1.27%             0.94%                 1.86%                       2.32%*              1.1.2%             On Track
    Provision Coverage Ratio (%)                                              52%               48%              65%                   55%                         51%*               ~70%              On Track
E
A   Net Interest Margin (%)                                                 3.10%            2.61%             3.91%                 4.98%                        5.51%              5-5.5%             Achieved
R   Cost to Income Ratio (%)                                              81.56%            82.74%            76.86%               78.79%                        77.16%                 55%             On Track
N
I   Return on Asset (%)                                                    -3.70%            -1.33%           -1.75%                 0.29%                      -1.51%$             1.4-1.6%            On Track
N
    Return on Equity (%)                                                 -36.81%           -11.64%           -17.10%                 2.73%                     -13.31%$             13-15%              On Track
G
S   *Due to COVID, a large infrastructure account (A Mumbai based toll road) of Rs. 854 crores has turned NPA during Q1 FY22; this was already a part of identified stressed list as SMA 2 account.
    Since the account is now classified as NPA, the identified stressed asset list stands reduced by such amount. We expect no economic loss on this account eventually as this is an performing and operating toll
    road, albeit delayed. Excluding this account, the GNPA would have been 3.77%, the NNPA would have been 1.61% and PCR% would have been 58.22%.

    $ The RoA and RoE in Q1 FY22 is not representative of the longer term ROA/ ROE because of COVID impact. The fundamental drivers of the business model is strong and the bank is on track to achieve the
    said target within the given timeline. ^ Including ECLGS portfolio of Rs. Rs. 1645 crores.

                                                                                                                                                                                    6
5    PROGRESS SINCE MERGER

           7    MANAGEMENT COMMENTARY ON Q1-FY22 RESULTS

                CREATION OF IDFC FIRST BANK
Table      15

of         24   VISION & MISSION OF IDFC FIRST BANK
Contents
           27   PRODUCT OFFERINGS

           36   BUSINESS & FINANCIAL PERFORMANCE

           54   BOARD OF DIRECTORS & KEY SHAREHOLDERS
Management
Q1 22 results: Sustainable Growth in Core Franchise                                                                                   commentary on
                                                                                                                                      Q1-FY22 results

Strong Growth in Retail Assets:
      • Retail Book increased 30%^ YoY to Rs. 72,766 crore as on June 30, 2021 from Rs. 56,043 crore as on June 30, 2020.
      • Retail constitutes 68% of funded loan assets as on June 30, 2021 including retail PSL buyouts.
      • Wholesale funded book decreased by 15% YOY to Rs. 32,148 crore as on June 30, 2021 from Rs. 37,928 crore as on June 30, 2020
      • Infrastructure loans (part of wholesale) decreased by 23% YOY to Rs. 10,346 crore as on June 30, 2021 from Rs. 13,416 crore as on June 30, 2020.
      • Infrastructure loans are only 9.09% of total funded assets as on June 30, 2021 as compared to 12.89% as on June 30, 2020 and 21.70% as on
          December 31, 2018 (merger quarter)
Strong growth in Retail Liabilities
      • CASA Deposits increased by 98% YOY to Rs. 46,439 crore as on June 30, 2021 from Rs. 23,491 crore as on June 30, 2020 despite reduction of SA
          rate by 200 bps in the last 6 months.
      • CASA Ratio improved to 50.86% as on June 30, 2021 from 33.74% as on June 30, 2020.
      • Daily Average CASA Ratio improved to 50.3% as on June 30, 2021 from 32.0% as on June 30, 2020.
      • Total Customer Deposits increased to Rs. 84,893 crore as on June 30, 2021 from Rs. 62,409 crore as on June 30, 2020, Y-o-Y increase of 36%.
Strong Capital Adequacy: Capital Adequacy Ratio of the Bank was strong at 15.56% with CET-1 Ratio at 14.86%. During the quarter, equity capital of
          Rs. 3,000 crore was raised through QIP on April 6, 2021.
Franchise: The Branch Network now stands at 601 branches, 703 ATMs (including 94 recyclers) across the country as on June 30, 2021.
Diversification:
      • Top 20 Depositors’ concentration as % to total customer deposits has reduced to 9.39% as on June 30, 2021 from 16.86% as on June 30, 2020.
      • Top 10 Borrowers concentration as % of total Funded Assets has reduced to 5.8% as on June 30, 2021 from 7.3% as on June 30, 2020.
IDFC FIRST Bank has highest safety rating of FAAA by CRISIL for the Fixed Deposit program

  ^Excluding the ECLGS Portfolio, the Retail Funded Assets grew by 27% on YoY basis.                                              8
Management
Asset Quality Trends: The Bank is confident of improving asset quality                                           commentary on
over coming quarters                                                                                             Q1-FY22 results

Asset Quality Trends
                                Dec-19            Mar-21                Jun-21    Change from Pre-Covid
                                                                                                                        PCR (%)
Particulars                 (Pre-Covid)   (Post Covid 1.0)   (During Covid 2.0)           Levels ( C – A )
                                                                                                                 As of 30 Jun 21
                                   (A)                (B)                  (C)                   (in bps)
Retail
GNPA%                            2.26%             4.01%                3.86%                         160
                                                                                                                         53.84%
NNPA%                            1.06%             1.90%                1.82%                          76
Corporate (Non-Infra)
GNPA%                            3.08%             3.98%                2.91%                        (17)
                                                                                                                         57.60%
NNPA%                            1.58%             1.92%                1.25%                        (33)
Infrastructure
GNPA%                            4.69%             5.76%               15.65%                       1,096
                                                                                                                         41.13%
NNPA%                            1.23%             1.35%                9.84%                         861
Total
GNPA%                           2.83%              4.15%                4.61%                         178
                                                                                                                        50.86%
NNPA%                           1.23%              1.86%                2.32%                         109

                                                                                                             9
Management
Asset Quality Trends: The Bank is confident of improving asset quality                                                                commentary on
over coming quarters.. Contd..                                                                                                        Q1-FY22 results

• Due to COVID-19 second wave, there were strict lockdowns across the country in April and May 21, and in part of June-21 including in major states
  like Delhi, Maharashtra, West Bengal, Tamil Nadu, Karnataka. This impacted the operations of the Bank, especially in terms of disbursals and
  collections as the logistical challenges increased due to lockdowns. At the same time, there was no moratorium, leading to slippages during the
  quarter.
• The NPA% mentioned above includes one infrastructure loans (Mumbai Toll Road account) which became NPA during the quarter with Rs. 854 crore
  outstanding, due to the impact on toll collections following COVID-19 second wave.
• This toll road account continued to repay its dues, partially, even during this quarter which was affected by second wave (Q1-FY22), the principal
  outstanding has come down by Rs. 19 crore during Q1 FY22. The Bank carries Rs. 154 crore provision on this account. This account was already
  disclosed under the identified stressed asset list.
• The slippage of this account led to an increase in GNPA by Rs. 854 crores, and a corresponding reduction in the Identified Stress Asset List. Bank
  expects to collect our dues in due course from this entity as this is an operating toll road entity and does not expect any material economic loss on
  this account.
• Thus, excluding the impact of the said Mumbai based infra Toll road account, the GNPA and NNPA as of June 30, 2021 would have been 3.77% and
  1.61% with PCR of 58.22%.
• With this account moving to NPA, the proactively identified Stress Assets pool of the Bank now stands reduced to Rs. 1,371 crore as on June 30,
  2021 from Rs. 3,195 crore as on June 30, 2020, a reduction of 57%, for which the Bank holds provision cover of 67%.
• The Bank was sensitive to customers affected by COVID during this quarter. Standard restructured outstanding portfolio (under the COVID-19 relief
  package provided by the RBI) in retail loans was 1.81% of the overall Retail Loan Book as of June 30, 2021. Restructuring for the overall portfolio
  stood at 2.01% of the total Funded Assets.

                                                                                                                                   10
Management
Provisions: Bank has made prudent provision for COVID 2nd wave, commentary on
provisions likely to taper off in coming quarters Q1-FY22 results
Provisions for the Quarter:
1. The Bank has created additional COVID-19 provisions of Rs. 350 crore during the quarter taking the total COVID-19 provision pool to Rs. 725
crores. The Bank believes that the full estimated impact of COVID wave 2 is now provided for in the books of the Bank. Including the COVID
provision of Rs 725 crore as of June 30, 2021, the PCR would improve to 66.40% and without the effect of the Mumbai based road toll account
where we expect to collect our dues in due course, it would be 77.23%.
2. The Bank has already taken provision of Rs. 1,879 crore during Q1 FY22. Based on the recent portfolio quality indicators (latest cheque bounce
trends, collection efficiency, vintage analysis) we expect the provisions to taper off from here for the rest of the year (assuming no Covid third
wave).
3. There was no moratorium provided to customers during COVID 2nd wave and thus there was ageing provisions that were required to be taken as
per our conservative provisioning norms. The Bank believes that these provisions may not reflect actual economic loss but represent a delay in
timing of repayments.
4. We believe cash flow of these customers have got affected due to lockdowns in Covid second wave in Q1-FY22. However, a reasonable
proportion among them are likely to pay back their dues when economy normalizes.
5. Further, the Bank has seen improvement in key indicators, like (a) Improving customer profile for on-boarding (b) improving cheque bounce
trends of portfolio (c) improving collection efficiencies and improved vintage analysis indicators. Based on the above portfolio analysis of these
key indicators, the bank is confident of reducing Gross NPA and NPA to pre-COVID levels and expects to reduce annualized credit costs to less
than 2% by Q4 FY22 for the retail loan book.
11Management
Future Asset Quality Indicators: Key quality Indicators showing commentary on
improvement which points to lower delinquency and credit losses in future. Q1-FY22 results
Improved quality of Sourcing: New to Credit customers as % incremental Improved quality of Sourcing: Customers having Bureau score
bookings have reduced sharply, indicating improved quality. > 700 has sharply improved from 61% to 83% over two years.
17% 80% 83%
16%
68%
12% 13% 61% 60%
10%
Jan'19 to Jun'19 Jul'19 to Dec'19 Jan'20 to Jun'20 Jul'20 to Dec'20 Jan'21 to Jun'21 Jan'19 to Jun'19 Jul'19 to Dec'19 Jan'20 to Jun'20 Jul'20 to Dec'20 Jan'21 to Jun'21
Early Bucket cheque Bounce Rates (on Principal Outstanding) is Early Bucket Collection Efficiency (urban retail) in July estimated to
almost as good as Pre-Covid (Mar-20) Levels (x) for urban retail. surpass pre COVID levels.
2.53 99.5%
98.8% 98.2% 97.9% 98.7% 98.8% 99.0% 99.2% 98.8%
96.7% 97.3%
1.29 1.29 1.34
Moratoorium
1.24 1.16 1.18
1.00 1.08 94.9%
Dec-20
Sep-20
Mar-21
Jun-21
Feb-20
Nov-20
Feb-21
Jul-21E
Apr-21
Oct-20
Jan-21
May-21
Mar-20 Sep-20 Jan-21 Feb-21 Mar-21 Apr-21 May-21 Jun-21 July-21
12Management
Profitability: Highest ever Core Operating Profits posted in Q1 FY22, commentary on
Q1-FY22 results
strong NIM improvement.
Steady Improvement in NIM%
Highest ever Core Operating Profits in Q1-FY22
5.51%
4.86% 4.91% 5.04%
5.09% • Because of strong growth in Net Interest Margin of the bank, the
4.61%
4.16% core operating profit of the bank has reached an all-time high at Rs.
3.69% 601 crores.
Pre- 3.10%
3.24% 3.23% • Core PPOP has more than doubled from Rs. 276 crore in the first
merger Quarter after merger with Capital First. (For context, pre-merger
1.84% PPOP was Rs. 92 crores for H1-FY19.
• We are happy to share that this growth in core operating profits
has been achieved despite that the bank has invested heavily in
branches, network, technology, and people over the last two years.
Q2 Q3 Q4 Q1 Q2 Q3 Q4 Q1 Q2 Q3 Q4 Q1
• Therefore, as the provisions come down to normalized levels post
FY19 FY19 FY19 FY20 FY20 FY20 FY20 FY21 FY21 FY21 FY21 FY22 second wave, the Profits of the bank will increase.
• The Bank has been reporting net profits continuously since March 2020 for 5 quarters in a row through COVID-19 first wave. During COVID-19
wave 2.0 there was strict lockdowns through April and May 2021, limiting our collection efforts.
• Based on portfolio ageing caused by the lockdown, the Bank has upfronted a reasonable portion of the estimated provision because of the COVID-
19 second wave, because of which the Bank posted net loss of Rs. 630 crore in Q1-FY22. The Bank believe the full estimated impact of COVID
wave 2 is now provided for in the books of the Bank.
• Therefore, with a strong and rising PPOP and expected lower provisions going forward, the Bank is expected to be profitable for the full year.
13Management
Future Profitability Drivers are getting stronger. Incremental RoE is commentary on
Q1-FY22 results
healthy, will replace old book in due course
1. Legacy book being replaced by new book with strong incremental margins and strong Incremental ROE.
a) The incremental yield of the retail book is about 14.5%.
b) The incremental cost of funds is5 PROGRESS SINCE MERGER
7 MANAGEMENT COMMENTARY ON Q1-FY22 RESULTS
CREATION OF IDFC FIRST BANK
Table 15
of 24 VISION & MISSION OF IDFC FIRST BANK
Contents
27 PRODUCT OFFERINGS
36 BUSINESS & FINANCIAL PERFORMANCE
54 BOARD OF DIRECTORS & KEY SHAREHOLDERSThe Creation of IDFC FIRST Bank : Merger of erstwhile Capital First & Creation of IDFC
FIRST Bank
IDFC Bank
IDFC FIRST Bank was created by the merger of Erstwhile IDFC Bank and Erstwhile
Capital First on December 18, 2018.
Prior to this IDFC First Bank was a premier infrastructure Financing Domestic
Financial Institution since 1997 and Capital First was a successful consumer and
MSME financing entity since 2012.
16Creation of IDFC
FIRST Bank
Background information of the two merging entities
Erstwhile IDFC BANK Erstwhile CAPITAL FIRST LIMITED
IDFC Limited was set up in 1997 with equity participation from the Mr Vaidyanathan had built ICICI Bank’s Retail Banking business
Government of India, to finance infrastructure focusing primarily on between 2000-2009 and was later the MD and CEO of ICICI Prudential
project finance and mobilization of capital for private sector Life Insurance Company in 2009-10.
infrastructure development. Whether it is financial intermediation for During 2010-12, he acquired a significant stake in a small real-estate
infrastructure projects and services, or innovative products to the financing NBFC through leverage, wound down existing businesses of
infrastructure value chain, or asset maintenance of existing broking, wealth and Foreign Exchange, and instead used the NBFC
infrastructure projects, the company built a substantial franchise and vehicle to start financing consumers (Rs 12000-Rs. 30,000) and micro-
became acknowledged as experts in infrastructure finance. entrepreneurs (Rs. 1-5 lacs) who were not financed by existing banks,
Dr. Rajiv Lall joined the company in 2005 and successfully expanded by using alternative and advanced technology led models.
the business to Asset Management, Institutional Broking and Within a year he built a prototype loan book of Rs. 770 crore ($130m,
Infrastructure Debt Fund. In 2014, the Reserve Bank of India (RBI) March 2011), and presented the proof of concept to many global
granted an in-principle approval to IDFC Limited to set up a new bank private equity players for a Leveraged Buyout (LBO).
in the private sector.
In 2012, he concluded India’s largest Leveraged Management Buyout,
Following this, the IDFC Limited divested its infrastructure finance got fresh equity of Rs. 100 crore into the company and founded Capital
assets and liabilities to a new entity - IDFC Bank- through demerger. First as a new entity with new shareholders, new Board, new business
Thus IDFC Bank was created by demerger of the infrastructure lending lines, and fresh equity infusion.
business of IDFC to IDFC Bank in 2015.
Contd.. Contd..
17Creation of IDFC
FIRST Bank
Background information of the two merging companies.. Contd.
Erstwhile IDFC BANK Erstwhile CAPITAL FIRST LIMITED
… The bank was launched through this demerger from IDFC Limited in … He then turned around the company from losses of Rs. 30 crore and
November 2015. During the subsequent three years, the bank Rs. 32 crore in FY 09 and FY 10 respectively, to PAT of Rs. 327 crore ($
developed a strong and robust framework including strong IT 4.7b) by 2018, representing a 5 year CAGR increase of 56%.
capabilities for scaling up the banking operations. - The loan assets grew at a 5 year CAGR of 35%. Rs. 94 crore to Rs.
- The Bank designed efficient treasury management system for its own 29,625 crore (Sep 2018). The company financed seven million
proprietary trading, as well as for managing client operations. The customers for Rs. 60,000 crore ($8.5b) through new age technology
bank started building Corporate banking businesses. models.
- Recognizing the change in the Indian landscape, emerging risk in - The market capitalization of the company increased ten-fold from Rs.
infrastructure financing, and the low margins in corporate banking, the 780 crore on in March 2012 at the time of the LBO to over Rs. 8,282
bank launched retail business for assets and liabilities and put together crore in January 2018 at the time of announcement of the merger.
a strategy to retailize its loan book to diversify and to increase - As per its stated strategy, Capital First was looking out for a banking
margins. license to convert to a bank when opportunity struck in the form of an
- Since retail required specialized skills, seasoning, and scale, the Bank offer from IDFC Bank to merge with Capital First, with Mr. Vaidyanathan
was looking for inorganic opportunities for merger with a retail lending to become the CEO of the merged bank.
partner who already had scale, profitability and specialized skills.
the bank was looking for a merger with a retail finance institution Erstwhile Capital First, as part of its stated strategy, was on the
with adequate scale, profitability and specialized skills. lookout for a commercial banking license.
18Creation of IDFC
Erstwhile IDFC Bank pre-merger history and track record FIRST Bank
• IDFC raises Rs. 700 million in a second
• IDFC incorporated in Chennai on the
growth equity fund and Rs. 930 million in • IDFC Mutual Fund ranked 10th in the
recommendation of the Expert Group on
a new asset-class to recycle equity in country by AUM
commercialization of Infrastructure 2011
completed infrastructure projects
1997 Projects
• Acquired AMC business of Standard
• IDFC completes 15 years.
• IDFC raises Rs. 893 crore for India’s first Chartered Bank. Setup an office in
2008
infrastructure dedicated growth equity Singapore
• Recognised as the best NBFC for
2003 fund2.8 Infrastructure Financing.
• IDFC is recognised as a top 5 Lead
Arranger for Project Finance Loans in Asha 2012 • Set up an office in New York, USA.
• IDFC lists on both NSE & BSE. Raises Rs. by Dealogic
2005 1372 crore of equity capital
• IDFC becomes a signatory to UNPRI, CDP
• IDFC becomes the first signatory to the
2009 and the UNGC Global Compact
2013 Equator Principles
• IDFC raises over Rs. 2000 crore for its
second infrastructure focused growth
2006 equity fund • IDFC Investment Bank ranked 2nd in the
equity league tables by Bloomberg. IDFC • Secured license from RBI
ranked among the top 50 companies in 2014
• Does a QIP raising Rs. 2100 crore India’s S&P ESG Index.
• Acquired SSKL, a leading domestic
investment bank and institutional equities • IDFC launches the National PPP Capacity
firm Building programme to train over 10,000 • Launch of IDFC Bank
2007 2010 government officials 2015
19Creation of IDFC
FIRST Bank
Erstwhile Capital First pre-merger history and track record
Background AUM (Rs. Cr) Profit (Rs. Cr)
Wholesale AUM Retail AUM Total AUM 32,623
327
26,997
Capital First was a successful NBFC, 239
19,824 206
growing its loan book and net profits at 16,041
114
166
11,975
a 5 year CAGR of 29% and 56% 9,679 35 56
6,186 7,510 3.8
respectively, with stable asset quality of 2,751
935
Gross NPA ofThe asset quality trends over the last 8 years at erstwhile Capital First is displayed below
Creation of IDFC
as a demonstration of our capabilities in this space. Bank is moving to safer credit FIRST Bank
categories based on lower cost of funds.
Since the retail loan book of the Bank has been built and seasoned in Capital First for 10 years, we present below the asset quality trends of the book in
Capital First as a demonstration of our skills and track record in managing stable and high asset quality, i.e. Gross NPA and Net NPA stayed at ~2% and 1%
respectively over a long time. Credit costs were about 275bps. The portfolio remained stable even after being stress tested through economic slowdown in
2010-2014, demonetization (2016), GST implementation (2017) and economic slowdown. Hence gives us confidence to grow in future on this strong asset
quality model. After the merger, the bank has been able to move to even safer credit categories like prime home loans because of reduced cost of funds of
a bank and has improved underwriting by usage of data and analytics, and thus expects to maintain the business at credit costs ofPre merger - Proforma Financials of IDFC Bank and Capital First – Creation of IDFC
FIRST Bank
P&L (H1 FY19)
Proforma Total
In Rs. Crore Erstwhile IDFC Bank Erstwhile Capital First
(H1 FY 19)
Funded Assets / AUM 75,332 32,623 1,07,955
Net-Worth 14,776 2,928 17,704
NII 912 1,143 2,055
Fees & Other Income 256 153 409
Treasury Income 31 31
Total Income 1199 1,297 2,496
Opex 1108 616 1,724
PPOP 91 681 772
Provisions 562 363 925
PBT -471 317 (154)
Key Ratios
NIM % 1.56% 8.20% 2.85%
RoA at PBT level % (0.75%) 2.26% (0.20%)
RoE % (at normalized level) (4.18%)* 14.51% (1.21%)
Cost to Income Ratio % 92.41% 47.52% 69.09%
Note: IDFC Bank and Capital First Limited (CFL) were in IGAAP and IND-AS respectively in H1-FY19
22Creation of IDFC
Since merger, IDFC FIRST Bank as a merged entity, has been building FIRST Bank
strong foundation for a long term growth engine
In January 2018, Erstwhile IDFC Bank and Erstwhile Capital First announced a merger. Shareholders of Erstwhile Capital First
were to be issued 13.9 shares of the merged entity for every 1 share of Erstwhile Capital First. Thus, IDFC FIRST Bank was
founded as a new entity by the merger of Erstwhile IDFC Bank and Erstwhile Capital First on December 18 2018.
• Post the merger, during the last 2 years, the Bank invested in the people, processes, products, infrastructure and technology to put
together all the necessary building blocks of a stronger foundation which is essential for a long-term growth engine.
• The bank restricted loan growth for two years in order to strengthen the liabilities franchise (CASA 8.7% at merger) first.
• Between 2018-2020 the Bank also accounted for legacy Infrastructure and Corporate loans that turned bad post-merger, which resulted
in reduction of net worth, and thus the Book Value per share reduced from Rs. 38.4 on December 31, 2018 to Rs. 31.90 on March 31,
2020.
• The COVID 19 crisis struck the system in March - April 2020.
• Because the Bank had successfully raised large quantities of retail CASA deposits prior to COVID19 and had replaced Certificate of
Deposits and bulk Corporate Deposits prior to the crisis, the Bank comfortably sailed through the COVID crisis on liquidity.
• Further, the Bank also successfully raised fresh equity of Rs. 2000 crores to strengthen the balance sheet in June 2020.
• The Bank now has a strong retail and CASA deposits franchise (CASA 50.86% as of June 2021) and looks forward for to steady growth
from here on.
• Further, the Bank raised additional equity capital of Rs. 3,000 crore through QIP on April 6, 2021.
• We are proud about our heritage of transparent disclosures, high levels of corporate governance, and swift action on dealing with
pressing strategic issues and for laying the foundation for future long-term growth.
• We sincerely thank our shareholders for their faith and trust in us during this period.
235 PROGRESS SINCE MERGER
7 MANAGEMENT COMMENTARY ON Q1-FY22 RESULTS
CREATION OF IDFC FIRST BANK
Table 15
of 24 VISION & MISSION OF IDFC FIRST BANK
Contents
27 PRODUCT OFFERINGS
36 BUSINESS & FINANCIAL PERFORMANCE
54 BOARD OF DIRECTORS & KEY SHAREHOLDERSVision, Mission
& Culture of the
Bank
Vision and Mission of IDFC FIRST Bank
Our Vision:
To build a world class bank for aspiring India, driven by human values and technology, and be a force for social good..
Our Mission:
We want to touch the lives of millions of Indians in a positive way by providing high-quality banking products and services
to them, with particular focus on aspiring consumers and entrepreneurs of our new India, using contemporary
technologies
Organisation Theme Line:
25Vision, Mission
& Culture of the
Culture setting at IDFC FIRST Bank Bank
Message from MD and CEO to the Bank employees and
shareholders. Source: Annual Report 2019, 2020
265 PROGRESS SINCE MERGER
7 MANAGEMENT COMMENTARY ON Q1-FY22 RESULTS
CREATION OF IDFC FIRST BANK
Table 15
of 24 VISION & MISSION OF IDFC FIRST BANK
Contents
27 PRODUCT OFFERINGS
36 BUSINESS & FINANCIAL PERFORMANCE
54 BOARD OF DIRECTORS & KEY SHAREHOLDERSOur key philosophy: Ethical & transparent Banking.
In all products we launch, we are driven about one thing: to deliver high quality products and services at
affordable rates. Employees’ DNA are being coded to be sincere about working in the customer’s interest at all
times.
28Key Value Driver for the Bank
“Customer First”
IDFC First Bank is insanely focused on Customer experience and Customer Service.
We believe to build a bank where we can offer High Quality Banking at affordable rates to reach
millions of customers is a great privilege of our lifetime.
Being a new bank, we have no baggage of past practices. We do business in the most ethical and
transparent way. We have brought a fresh perspective to banking through our unique products and
customer first approach.
We use all our resources - service, technology, product innovation, and good spirit to try and deliver
exceptional customer experience.
29Customer First Approach
We have an unique approach to new and existing products and services, manifested
in the many First’s to our credit viz.,
- Higher interest rates on savings
- Monthly interest credits on savings accounts,
- Higher spending limits and insurance cover on Debit Cards than the market,
- Lifetime free credit cards with
- never expiring rewards
- lowest APR,
- zero interest on ATM cash
- Many such unconditional benefits and USPs which make us a Customer First,
Transparent and Ethical Bank.
- No “Fine Print Banking” all information transparently displayed in simple
language
30Bank has wide bouquet of Consumer and MSME loans
.. across varied customer segments including Consumers and MSMEs in different parts of India
Prime Home Loans: Affordable Home Loans: Loan Against Property: New and Pre-owned Car Business Loans:
Starting at 6.9% to select Prime Smaller ticket size home loans to Long term loans to MSMEs after Unsecured Loans to the self-
Salaried Customer of top salaried and self-employed Loan:
proper evaluation of cash flows; employed individual or entity
corporates, Self-employed customers for purchasing house To salaried and self-employed
against residential or against business cashflows
customers for buying house property. customers for purchasing a new
commercial property car or a pre-owned car
property.
Personal Loans: Consumer Durable Loans: Two Wheeler Loans: Micro Enterprise Loans: JLG Loan for Women:
Unsecured Loans to salaried financing to individuals for To the salaried and self- Loan solutions to small business Sakhi Shakti loan is especially
and self-employed customers purchasing of LCD/LED panels, employed customers for owner designed as the livelihood
for fulfilling their financial Laptops, Air-conditioners etc purchasing new two wheelers advancement for women,
needs primarily in rural areas
Apart from these products, IDFC FIRST Bank also offers Working Capital Loans, Corporate Loans for Business Banking and Corporate
Customers in India
31Comprehensive product suite on Savings, Current, Transaction services, Advisory,
Payments, Fleet, Corporate solutions digitally.
IDFC FIRST Bank provides wide range of Deposit facilities along with Savings Accounts, Deposit accounts, Wealth Management,
Forex Services, Cash Management Services and Insurance services to its customers.
Wealth Management Services, Investments and Payments and Online Services:
Insurance Distribution: ✓ Debit Cards & Prepaid Cards
✓ Investment Solutions ✓ NACH & BHIM UPI
✓ Personal Insurance Solutions
✓ Business Insurance Solutions
✓ Mutual Funds distribution
✓ Life, Health and General Insurance
distribution
Deposit Accounts:
✓ Savings Account Forex Services:
✓ Current Account ✓ Import and Export Solutions
✓ Corporate Salary Account ✓ Domestic Trade Finance
✓ Fixed Deposit ✓ Forex Solutions and Remittances
✓ Recurring Deposit ✓ Overseas Investments & Capital A/C
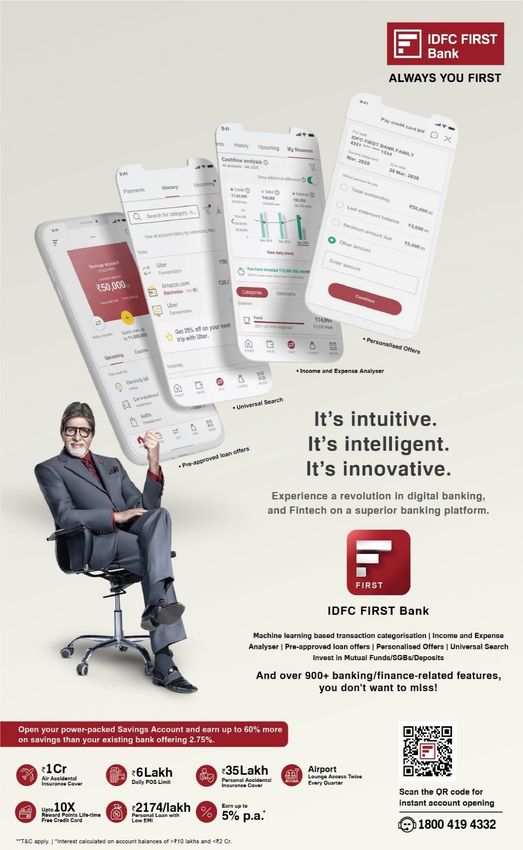
TransactionsOur Savings Account Proposition Highlights
Monthly Interest credit on Savings account: India’s first large
universal bank to offer this feature, a Customer First
Interest up to 5% : This enables our customers to earn between 34%
and 58% more with IDFC FIRST Bank Savings Account as compared to
leading banks who pay 3% for deposits upto Rs. 50 lacs, and 3.5%
above Rs. 50 lacs of balances.
No penalty for senior citizens on early withdrawal: If a senior citizen
customer gets his/her FD pre-matured, no penal charges are levied
Higher limits and Insurance: ₹6 lakhs/day Purchase limit and ₹ 2
lakhs/day ATM withdrawals and ₹35 lakhs free personal accident
insurance cover & 1 crore free air accident insurance cover on Debit
Card
Interest payment on Employee Reimbursement Accounts for corporate
salary customers and many more: ….Self-Service
Mobile App India’s truly unique net and mobile banking,
with new age look and advanced Industry first
features. Seamless customer servicing via our
newly launched net banking application
Settle your bills in a one click with automated reminders, eg: Netflix,
Cult fit etc.
Your card your choice: Change your card preferences & limits on the
go
Seamless reward redemption with Cult.fit, Chaipoint, BigBasket,
Udemy & many more
My financial planner- Insights on spending by category, type of spend
& vendor (eg: Amazon)
And many more: real-time add on card issuance for your loved ones,
convert to EMI feature….Since Launch in Jan 2021, the Bank has issued 3+ Lac Credit Cards till June 30, 2021
INDUSTRY
IDFC FIRST Bank Credit
Cards customer friendly
A Credit Card, like no other
initiatives Customer friendly card launched by the Bank, keeping in line with the ethos of
always customer first.
Multiple Fees (Annual/ Over Lifetime Free
Limit) (No Annual Fees ever)
No Charges for spends upto
Charges for spending over limit
10%*
Static and high interest rates
Dynamic Interest Rate
(36% to 48% APR)
(9% to 36% APR)$
(since last 30 years)
Often Complicated Reward Simple scheme, upto 10X
Points with T&Cs and Rewards reward points. No expiry.
expiry date Easy online redemption
Interest on ATM cash Interest-Free Cash
Super Saver Interest Interest Free Cash
withdrawal from Day 1 Withdrawal (up to next Lifetime free Super Rewarding
Rate (% APR Starting Withdrawal
billing cycle or 48 days, Credit Card Program
Entire outstanding deemed as from 9%) (up to next billing
revolver & charged interest whichever is earlier) cycle or 48 days,
whichever is earlier)
*Spending over limit is usually inadvertent by customers. Hence as a customer friendly measure, the Bank will intimate the customers if their spends are going above limit to avoid any
charges incurred by them. $Customer rates depending on algorithm, factoring in credentials, relationship with the bank and many other parameters
355 PROGRESS SINCE MERGER
7 MANAGEMENT COMMENTARY ON Q1-FY22 RESULTS
CREATION OF IDFC FIRST BANK
Table 15
of 24 VISION & MISSION OF IDFC FIRST BANK
Contents
27 PRODUCT OFFERINGS
39 BUSINESS & FINANCIAL PERFORMANCE
57 BOARD OF DIRECTORS & KEY SHAREHOLDERSBUSINESS & FINANCIAL
PERFORMANCE
OF THE BANK FOR Q1 FY22
• Update on Liabilities
• Assets Update
• Key Financial Parameters
✓ Income Statement
✓ Balance Sheet
✓ Capital AdequacyBusiness &
Financial
Performance
Built a strong retail Deposit Base from millions of customers.
• The Bank quickly raised deposits from millions of customers because of our relentless focus on excellent service to our
customers, our Customer First approach, our superior product propositions, and capability for contactless and video-
KYC. We are a trusted brand for millions of our customers
Core Deposits (Retail CASA + Retail TD) Other Deposits Total Customer Deposits (Excl. CD)
Rs. 28,370 Cr Rs. 38,455 Cr Rs. 40,504 Cr Rs. 57,719 Cr Rs. 82,725 Cr Rs. 84,893 Cr
20% 23% 22%
27%
33% 41%
59%
73% 67%
80% 77% 78%
Mar-18 Dec-18 Mar-19 Mar-20 Mar-21 Jun-21
38Business &
Financial
The Bank now has a strong and well diversified liability franchise Performance
CASA Deposits has grown by Rs. 41,166 crore since merger with As a result, the CASA Ratio (%) of the Bank has grown from 8.68%
1 in Rs. crore 2 (Dec-18) at merger to 50.86% (Jun-21)
YoY growth of 98%
51.75% 50.86%
45,896 46,439
31.87% 33.74%
20,661 23,491
11.54% 8.68% 11.40%
5,544 5,274 7,893
31 Mar 18 31 Dec 18 31 Mar 19 31 Mar 20 30 Jun 20 31 Mar 21 30 Jun 21
31 Mar 18 31 Dec 18 31 Mar 19 31 Mar 20 30 Jun 20 31 Mar 21 30 Jun 21
Average CASA Ratio (on daily CASA balances for the quarter) Retail CASA Deposits has grown by Rs. 39,788 crore since merger
3 4 in Rs. crore
(%) also shows strong improvement over the years with YoY growth of 112%
50.23% 50.26% 42,060 42,583
32.00%
27.72%
20,104
15,797
8.39% 9.40%
6.05%
2,795 4,445
1,586
31 Mar 18 31 Dec 18 31 Mar 19 31 Mar 20 30 Jun 20 31 Mar 21 30 Jun 21
31 Mar 18 31 Dec 18 31 Mar 19 31 Mar 20 30 Jun 20 31 Mar 21 30 Jun 21
39Business &
Financial
Performance
Granularization of the Customer Deposits through quality liability franchise
As part of the granularization, the Bank increased its Deposits Similarly, the Bank increased Deposits with balance Rs. 1 crore
1 2 and less, as % of total customer deposits, from 18% (Mar-18) to
with balance Rs. 5 crore and less, as % of total customer deposits,
from 28% (Mar-18) to 82% (Jun-21) 61% (Jun-21)
82% 82% 62% 61%
65% 46%
59% 41%
37% 25%
28% 31% 18% 21%
31 Mar 18 31 Dec 18 31 Mar 19 31 Mar 20 30 Jun 20 31 Mar 21 30 Jun 21 31 Mar 18 31 Dec 18 31 Mar 19 31 Mar 20 30 Jun 20 31 Mar 21 30 Jun 21
The Bank reduced the top 20 depositors’ concentration as % of The Bank reduced the Top 10 depositors’ concentration as % of
3 customer deposits from 42.0% (Mar-18) 9.4% (Jun-21), thus 4 customer deposits from 28.6% (Mar-18) to 6.9% (Jun-21) on similar
curtailing the concentration risk lines
42.0% 40.0%
35.4% 28.6% 28.7%
25.2%
20.4% 14.5%
16.9% 12.5%
7.7% 9.4% 5.5% 6.9%
31 Mar 18 31 Dec 18 31 Mar 19 31 Mar 20 30 Jun 20 31 Mar 21 30 Jun 21 31 Mar 18 31 Dec 18 31 Mar 19 31 Mar 20 30 Jun 20 31 Mar 21 30 Jun 21
Section 4: Update on Liabilities 40Business &
Strong growth in retail deposits has reduced the dependence on wholesale Financial
deposits and has provided greater stability. Performance
In Rs. Crore Jun-20 Mar-21 Jun-21 YOY%
Legacy Long Term Bonds 10,638 7,892 7,645 -28%
Legacy Infra Bonds 10,166 9,508 9,487 -7%
Refinance 12,000 15,438 13,999 17%
Other borrowings 12,471 7,618 7,131 -43%
Total Borrowings (A) 45,274 40,456 38,262 -15%
CASA 23,491 45,896 46,439 98%
Term Deposits* 38,917 36,829 38,453 -1%
Total Customer Deposits (B) 62,409 82,725 84,893 36%
Certificate of Deposits (C) 7,212 5,964 6,419 -11%
Money Market Borrowings (D) 7,123 5,330 10,168 43%
Borrowings + Deposits (A)+(B)+(C)+(D) 122,018 134,475 1,39,741 15%
CASA % of Deposits 33.74% 51.75% 50.86%
Customer Deposits as % of Borrowings + Deposits 51.15% 61.52% 60.75%
* Though the customer Term Deposits at Rs. 38,453 crores as of June 30, 2021 has not grown YOY, the underlying composition of Terms Deposits have improved substantially.
Retail Term Deposits were up 18% over last year and Wholesale Term Deposits were reduced by 20% YOY.
41BUSINESS & FINANCIAL
PERFORMANCE
OF THE BANK FOR Q1 FY22
• Update on Liabilities
• Assets Update
• Key Financial Parameters
✓ Income Statement
✓ Balance Sheet
✓ Capital AdequacyBusiness &
Strong and consistent growth in consumer financing over the last decade. This is our DNA. Financial
Disbursed millions of loans life to date, including new-to-credit and new-to-bank. Performance
• The Bank provides financing for prime home loans, affordable home loans, business banking, loan against property, car loans, consumer
durables and other such products to salaried and self – employed individuals and entities which is a large opportunity in India.
• We have strong demonstrated capabilities on this front developed through greenfield efforts over the last 10 years and we have maintained
high asset quality, and consistently rising profitability over the years.
Retail Funded Assets Wholesale Funded Assets (incl Inorganic Portfolio) Total Funded Assets
Rs. 73,051 Cr Rs. 1,04,660 Cr Rs. 1,10,400 Cr Rs. 1,07,004 Cr Rs. 1,17,127 Cr Rs. 1,13,794 Cr
10%
35% 37% 37% 36%
46%
54%
65% 63% 63% 64%
90%
Mar-18 Dec-18 Mar-19 Mar-20* Mar-21 Jun-21
The Bank inorganically acquired portfolio as PSL retail loans. Including this as part of Retail Loan Book, the Retail contribution to the overall Loan Assets is 68% as of June 30,
2021.
*Gross of Inter-Bank Participant Certificate (IBPC) transactions.
43Business &
Strong and consistent growth in consumer financing over the last Financial
Performance
decade.
All amounts are in Rs. crore unless specified
• The bank has a rich history of 10 years of growing the retail
loans book. Rs. 94 crores to ~ Rs. 36,000 crores in 10 years,
and to Rs. 72,766 crores today. GROWTH CONTINUES POST
MERGER OF THESE BUSINESSES
• We have maintained stable growth, strong margins, and ON BANK PLATFORM
high Asset quality of Gross and Net NPA of ~2% and 1%
respectively for close to a decade, except during COVID. We 73,673 72,766
66,665
expect to revert to pre COVID asset quality by end FY 22.
57,310 56,043 59,860
53,685
PRE MERGER HISTORY
CAPITAL FIRST+IDFC BANK 40,812
39,233
36,236
32,281
IDFC FIRST Bank
Erstwhile IDFC Bank 20,634
Erstwhile CFL 13,876
7,883 10,113
3,460 5,560
94 771
Mar-10 Mar-11 Mar-12 Mar-13 Mar-14 Mar-15 Mar-16 Mar-17 Mar-18 Sep-18 Dec-18 Mar-19 Dec-19 Mar-20 Jun-20 Sep-20 Dec-20 Mar-21 Jun-21
^ Excluding ECLGS portfolio of Rs. 1,645 crore as of June 30, 2021, Retail loan book has grown by 27% on YoY basis
44Business &
Financial
Retail Funded Assets Mix Performance
Dec-18 Jun-20 Jun-21
ECLGS Others ECLGS
Others Others ECLGS
Portfolio Rural (JLG/KCC) 4% Portfolio
1% 1% Portfolio
0% 12% Rural (JLG/KCC) 2%
0% 10%
Credit Card Rural Home Loan
Credit Card Home Home
0% (JLG/KCC) 12% Loan Loan
0% Credit Card
12% 14% 15%
1%
Loan Loan Loan
Consumer Consumer
Against Against Consumer Against
Loans Property
Loans
23% 20% Property Loans Property
22%
22% 19% 21%
SME Loans Wheels SME Loans Wheels SME Loans
Wheels
13% 16% 15% 14% 14%
17%
Retail Funded Assets Rs. 36,236 Cr Rs. 56,043 Cr Rs. 72,766 Cr
Retail Funded Assets 35% 54% 64%
(% of Total Funded Assets)
45Business &
The Bank reduced wholesale, infrastructure loan assets since merger; Top 10 Financial
Performance
borrowers’ concentration reduced.
The Bank reduced the wholesale funded assets by 15% Out of this, infrastructure financing (Rs crore) has reduced by 23% in
1 in Rs. crore
2 in Rs. crore
during the last year the last year
26,832
53,871 56,809 53,649 22,710 21,459
39,388 37,928
33,920 32,148 14,840 13,416
10,808 10,346
Mar-18 Dec-18 Mar-19 Mar-20 Jun-20 Mar-21 Jun-21 Mar-18 Dec-18 Mar-19 Mar-20 Jun-20 Mar-21 Jun-21
The Bank reduced Infrastructure financing portfolio as % of total The Bank also proactively reduced the concentration risk by improving
3 funded assets from 37% (Mar-18) to 9% (June-21) 4 top 10 borrowers’ concentration from 18.8% (Mar-18) to 5.8% (Jun-21)
36.7% 18.8%
12.8%
21.7% 19.4% 9.8%
13.9% 12.9% 7.2% 7.3%
5.9% 5.8%
9.2% 9.1%
Mar-18 Dec-18 Mar-19 Mar-20 Jun-20 Mar-21 Jun-21 Mar-18 Dec-18 Mar-19 Mar-20 Jun-20 Mar-21 Jun-21
46Business &
Financial
Diversified Loan Book Performance
In Rs. Crore June-20 Mar-21 Jun-21 Growth% (YoY) Growth% (QoQ)
Home Loans 7,681 10,613 10,919 42% 3%
Loan against Property 12,445 15,320 15,087 21% -2%
SME Loans 8,427 10,812 10,100 20% -7%
Wheels 8,718 10,763 10,169 17% -6%
Consumer Loans 11,089 13,949 13,843 25% -1%
Credit Card - 428 819 - 91%
Rural (JLG/KCC) 6,769 7,658 7,093 5% -7%
Others 703 2,443 3,092 340% 27%
Total Retail Funded Assets (Excl. ECLGS Portfolio) 55,831 71,987 71,122 27% -1%
ECLGS Portfolio 212 1,687 1,645 676% -2%
Total Retail Funded Assets (A) 56,043 73,672 72,766 30% -1%
Corporates 24,512 23,112 21,802 -11% -6%
- Conglomerates 1,354 1,345 1,403 4% 4%
- Large Corporates 1,832 1,898 2,206 20% 16%
- Emerging Large Corporates 6,411 7,115 7,173 12% 1%
- Financial Institutional Group 12,036 10,960 9,352 -22% -15%
- Others 2,878 1,794 1,669 -42% -7%
Infrastructure 13,416 10,808 10,346 -23% -4%
Total Wholesale Funded Assets (B) 37,928 33,920 32,148 -15% -5%
PSL Inorganic (C) 7,732 7,436 6,796 -12% -9%
SRs and Loan Converted into Equity (D) 2,347 2,097 2,083 -11% -1%
Total Funded Assets (A)+(B)+(C)+(D) 104,050 117,127 113,794 9% -3%
Note: The figures above are gross of Inter-Bank Participant Certificate (IBPC) transactions.
The SME Loans include Business Loans, Business Banking, Micro Credit. The Wheels include TW Loans, Car Loans and CV Loans. The Consumer Loans include Consumer Durable Loans, PL
including cross-sell loans. Others includes portfolio buyout, trade finance, digital lending etc.
47Detail of the identified stressed pool, where the Bank has proactively identified the Business &
accounts, which are standard on the books as of now, but are stressed or potential NPAs, Financial
Performance
and taken provisions for the same
O/S
Client Description (Rs. Crore) Provision PCR% Comments
Exposure
Account suffers from delayed payments from Discoms. We expect the account to be resolved leading to a
Thermal Power Project in Orissa 523 523 100%
positive economic value to the Bank, as the account is fully provided for.Business &
Identified Stressed Assets pool (apart from the declared NPAs) reduced by 57% from Rs. Financial
3,195 crores to Rs. 1,371 crore during the last one year. Provision Coverage rises to 67%. Performance
During the last one year, because of COVID-1.0 followed by COVID-2.0 in the recent quarter, some of the identified stressed accounts have moved to
NPA with their provision coverage and some of the accounts are resolved, bringing the identified stressed pool (non-NPA) reduced by 57%
All amounts are in Rs. crore unless specified
O/s Exposure Provision Provision coverage
23% 47% 47% 50% 49% 52% 48% 51% 48% 67%
4,138
3,804
3,544 3,518
3,205 3,195
2,717
2,528
2,264
1,786 1,663 1,773 1,668
1,569
1,303 1,285 1,371
957 1,082
915
Mar-19 Jun-19 Sep-19 Dec-19 Mar-20 Jun-20 Sep-20 Dec-20 Mar-21 Jun-21*
*Apart from the accounts mentioned above, the Bank had also marked one large telecom account as stressed and provisioned 15% (Rs. 487 crore) against
outstanding exposure of Rs. 3,244 crore (Funded and Non-Funded). This provision translates to 24% of the Funded exposure on this account. The said account is
current and has no overdues as of June 30, 2021.
49BUSINESS & FINANCIAL
PERFORMANCE
OF THE BANK FOR Q1 FY22
• Update on Liabilities
• Assets Update
• Key Financial Parameters
✓ Income Statement
✓ Balance Sheet
✓ Capital AdequacyBusiness &
Financial
Performance
Quarterly Income Statement
Growth (%) Growth (%)
In Rs. Crore Q1 FY21 Q4 FY21 Q1 FY22
Q-o-Q Y-o-Y
Interest Income1 3,949 3,993 4,089 2% 4%
Interest Expense 2,205 2,033 1,905 -6% -14%
Net Interest Income 1,744 1,960 2,185 11% 25%
Fee & Other Income 148 600 449 -25% 203%
Operating Income (Excl Trading Gain) 1,892 2,561 2,634 3% 39%
Trading Gain 337 241 400 66% 19%
Operating Income 2,229 2,801 3,034 8% 36%
Operating Expense 1,337 2,156 2,032 -6% 52%
Pre-Provisioning Operating Profit (PPOP) 892 646 1,001 55% 12%
Core Pre-Provisioning Operating Profit (Ex. Trading gain) 555 405 601 48% 8%
Provisions 764 603 1,8792 212% 146%
Profit Before Tax 128 43 (877) - -
Tax 34 (85)3 (247) - -
Profit After Tax 94 128 (630) - -
1. Loan Servicing Fees paid to Business correspondents (incl IFBL) has been re-classified from interest income to operating expenses effective Q4 FY21, prior period numbers are also reclassed accordingly.
2. The Bank has made additional COVID provision of Rs. 350 crore in Q1 FY22 and now carries a cumulative COVID provision of Rs. 725 crore as on June 30, 2021.
3. Includes de-recognition of DTA on goodwill of Rs. 338 crores pursuant to recent changes in Finance Act. Includes DTA reassessment based on future projections.
51Business &
Financial
Performance
Balance Sheet
Growth (%) Growth (%)
In Rs. Crore Jun-20 Mar-21 Jun-21
(Q-o-Q) (Y-o-Y)
Shareholders' Funds 17,436 17,808 20,170 13% 16%
Deposits 69,832 88,688 91,312 3% 31%
- Retail Deposits 39,872 63,894 65,811 3% 65%
- Wholesale Deposits (including CD) 29,959 24,795 25,501 3% -15%
Borrowings 52,397 45,786 48,430 6% -8%
Other liabilities and provisions 10,975 10,861 9,075 -16% -17%
Total Liabilities 150,641 163,144 168,986 4% 12%
Cash and Balances with Banks and RBI 5,932 5,828 9,774 68% 65%
Net Funded Assets 97,940 111,758 108,628 -3% 11%
- Net Retail Funded Assets 55,741 72,334 71,412 -1% 28%
- Net Wholesale Funded Assets* 42,199 39,425 37,217 -6% -12%
Investments 35,942 36,719 41,368 13% 15%
Fixed Assets 1,079 1,266 1,298 2% 20%
Other Assets 9,747 7,572 7,918 5% -19%
Total Assets 150,641 163,144 168,986 4% 12%
*includes credit investments (Non-Convertible Debentures, RIDF, PTC, SRs and Loan Converted into Equity)
52Business &
Financial
Capital Adequacy Ratio is at 15.56% with CET-1 Ratio at 14.86% Performance
In Rs. Crore Jun-20 Mar-21 Jun-21
Common Equity 17,065 16,974 19,460
Tier 2 Capital Funds 528 647 916
Total Capital Funds 17,593 17,622 20,376
Total RWA 117,077 1,27,943 130,946
CET 1 Ratio (%) 14.58% 13.27% 14.86%
Total CRAR (%) 15.03% 13.77% 15.56%
▪ The regulatory requirement for the Capital Adequacy Ratio is 10.875% with CET-1 Ratio at 7.375% and Tier I at 8.875% as per the RBI Guidelines.
535 PROGRESS SINCE MERGER
7 MANAGEMENT COMMENTARY ON Q1-FY22 RESULTS
CREATION OF IDFC FIRST BANK
Table 15
of 24 VISION & MISSION OF IDFC FIRST BANK
Contents
27 PRODUCT OFFERINGS
36 BUSINESS & FINANCIAL PERFORMANCE
54 BOARD OF DIRECTORS & KEY SHAREHOLDERSBoard of
Directors & Key
Board of Directors: MD & CEO Profile Shareholders
With over two decades in financial services in India, V. Vaidyanathan has seen India through many lens – first as a banker (1990-2010, Citibank), then as
an entrepreneur (2010-2019, Capital First) and a professional banker again (2019- date, after merging Capital First with IDFC Bank). He worked with
Citibank Consumer Banking from 1990-2000, then set up ICICI Group’s retail banking from 2000-2009 since its inception, built ICICI Bank’s branch
network to 1411 branches and 28 million customers, built a large CASA and retail deposits franchise, and built the retail lending businesses including
mortgages, auto loans, credit cards and personal credit businesses to Rs. 1.35 trillion ($30 bn). He was appointed at the Board of ICICI Bank in 2006 at
age 38. In 2009, he became the MD and CEO of ICICI Prudential Life Insurance Company in India.
In 2010, he quit ICICI Group for an entrepreneurial opportunity to acquire an NBFC with an idea to convert it to a bank focused on consumer and MSME
lending. On acquiring equity stake, he shut down all non-core businesses like broking and real estate financing, and instead used the NBFC platform to
build MSME and Consumer Financing businesses, based on new technologies and algorithms. Between 2010 to 2018, he grew the loan book from start-
up stage to Rs. 29,600 crores (US$4.05 bn), grew the equity capital from Rs. 691 crores (US$118 mn) to Rs. 3,993 crores (US$600 mn), reduced Gross
NPA from 5.28% to 1.94%, reduced Net NPA from 3.6% to 1%, acquired 7 million customers, got the long-term credit rating upgraded from A+ to AAA,
turned around the company from losses of US$5 mn (2010) to profit of US$50 mn (2018), increased ROE from -6% to +15%, and increased the market
cap 10 times from Rs. 780 crores (US$120 mn) to Rs. 8,200 crores (US$1.2 bn) in 8 years. Capital First was growing at a 5-year CAGR of loan growth of
30%, and 55% in PAT between 2013-2018.
Then, in order to secure a commercial banking license, he agreed to merge Capital First with IDFC Bank in December 2018 and took over as the MD and CEO of the merged entity. Since then,
between December 2018 to June 2021, he has increased retail loan book from 13% pre-merger to 64% (Rs. 72,766 crores) of the total funded assets, increased Net Interest margin from 1.84%
pre-merger to 5.51%, increased CASA from 8.68% to 50.86%, turned the bank into profitability, and is currently busy converting the bank into a world-class retail bank in India. The bank now
has over 10 million customers and loan book of more than Rs. 1 lac crores (~US$14 bn). He believes India provides unlimited opportunity in financial services in India.
During his career, he and his organization have received a number of domestic and international awards including the prestigious CNBC Awaaz Entrepreneur of the year 2020, CNBC Asia’s
"Innovative company of the year" India Business Leader Awards-2017, "Most Inspirational Leveraged Management Buyout, India 2018" by CFI Awards, "Entrepreneur of the Year" Award at Asia
Pacific Entrepreneurship Awards 2017, "Transformational Leader 2018" by CFI Awards UK, "Financial Services Company of the Year, 2018 - VC Circle", "Outstanding contribution to Financial
Inclusion, India, 2017" from Capital Finance International, London, "Most Promising Business Leaders of Asia" 2016 by Economic Times, 'Outstanding Entrepreneur Award' in Asia Pacific
Entrepreneurship Awards 2016, Greatest Corporate Leaders of India- 2014, Business Today - India's Most Valuable Companies 2016 & 2015, Economic Times 500 India's Future Ready
Companies 2016, Fortune India's Next 500 Companies 2016, Dun & Bradstreet India's Top 500 Companies & Corporates 2016 & 2015. During his prior stint, awards included "Best Retail bank in
Asia 2001", "Excellence in Retail Banking Award" 2002, "Best Retail Bank in India 2003, 2004, and 2005" from the Asian Banker, "Most Innovative Bank" 2007, "Leaders under 40" from Business
Today in 2009, and was nominated "Retail Banker of the Year" by EFMA Europe for 2008.
He is an alumnus of Birla Institute of Technology and Harvard Business School (Advanced Management Program). He has run 23 half-marathons and 8 full marathons.
55Board of
Directors & Key
Shareholders
Board of Directors
MR. AASHISH KAMAT - INDEPENDENT DIRECTOR
Mr. Aashish Kamat has over 30 years of experience in the corporate world, with 24 years being in banking & financial services & 6 years in public accounting. He was the
Country Head for UBS India, from 2012 until his retirement in January 2018. Prior to that he was the Regional COO/CFO for Asia Pacific at JP Morgan based out of Hong
Kong. Before moving to Hong Kong, he was in New York, where is was the Global Controller for the Investment Bank (IB) at JP Morgan in New York; & at Bank of America as
the Global CFO for the IB, and, Consumer and Mortgage Products. Mr. Kamat started his career with Coopers & Lybrand, a public accounting firm, in 1988 before he joined
JP Morgan in 1994.
DR. (MRS.) BRINDA JAGIRDAR - INDEPENDENT DIRECTOR
Dr. (Mrs.) Brinda Jagirdar, is an independent consulting economist with specialization in areas relating to the Indian economy and financial intermediation. She is on the
Governing Council of Treasury Elite, a knowledge sharing platform for finance and treasury professionals. She retired as General Manager and Chief Economist, SBI, based at
its Corporate Office in Mumbai. She has a brilliant academic record, with a Ph.D. in Economics from the Department of Economics, University of Mumbai, M.S. in Economics
from the University of California at Davis, USA, M.A. in Economics from Gokhale Institute of Politics and Economics, Pune and B.A. in Economics from Fergusson College,
Pune. She has attended an Executive Programme at the Kennedy School of Government, Harvard University, USA and a leadership programme at IIM Lucknow.
MR. HEMANG RAJA - INDEPENDENT DIRECTOR
Mr. Hemang Raja, is an MBA from Abeline Christian University, Texas, with a major in finance. He has also done an Advance Management Program (AMP) from Oxford
University, UK. He has vast experience in the areas of Private Equity, Fund Management and Capital Markets in companies like Credit Suisse and Asia Growth Capital
Advisers in India as MD and Head - India. He has served on the executive committee of the board of the National Stock Exchange of India Limited; also served as a member
of the Corporate Governance Committee of the BSE Limited.
MR. PRAVIR VOHRA - INDEPENDENT DIRECTOR
Mr. Pravir Vohra is a postgraduate in Economics from St. Stephen's College, University of Delhi & a Certified Associate of the Indian Institute of Bankers. He began his career
in banking with SBI where he worked for over 23 years. He held various senior level positions in business as well as technology within the bank, both in India & abroad. The
late 1990s saw Mr. Vohra as Vice President in charge of the Corporate Services group at Times Bank Ltd. In January 2000, he moved to the ICICI Bank group where he
headed a number of functions like the Retail Technology Group & Technology Management Group. From 2005 till 2012 he was the President and Group CTO at ICICI Bank.
56You can also read