Great-West Lifeco Empower Retirement Investor Day - June 2021 Note: All figures in U.S. dollars, unless stated otherwise
←
→
Page content transcription
If your browser does not render page correctly, please read the page content below

Great-West Lifeco
Empower Retirement Investor Day
June 2021
Note: All figures in U.S. dollars, unless stated otherwise
Cautionary notes
CAUTIONARY NOTE REGARDING FORWARD-LOOKING INFORMATION
This document may contain forward-looking information. Forward-looking information includes statements that are predictive in nature, depend upon or refer to future events or conditions, or include words such as "will", "may",
"expects", "anticipates", "intends", "plans", "believes", "estimates", "objective", "target", "potential" and other similar expressions or negative versions thereof. These statements include, without limitation, statements about the
operations, business, financial condition, expected financial performance (including revenues, earnings or growth rates) of Great-West Lifeco Inc. ("Lifeco" or the "Company") and its subsidiaries, ongoing business strategies or
prospects, anticipated global economic and market conditions and possible future actions by the Company, including statements made with respect to the U.S. retirement solutions and wealth management industries, expected cost
(including deferred consideration), benefits, timing of integration activities and revenue and expense synergies of acquisitions and divestitures, including the recent acquisitions of Personal Capital Corporation (Personal Capital) and
the retirement services business of Massachusetts Mutual Life Insurance Company (MassMutual), expected earnings contribution of the Company's U.S. segment, scale advantages, value creation and growth/rollover opportunities,
expected capital management activities and use of capital, expected dividend levels, expected cost reductions and savings, expected expenditures or investments (including but not limited to investment in technology infrastructure
and digital capabilities), business resiliency, and otherwise concerning the Company and Empower Retirement.
Forward-looking statements are based on expectations, forecasts, estimates, predictions, projections and conclusions about future events that were current at the time of the statements and are inherently subject to, among other
things, risks, uncertainties and assumptions about the Company, economic factors and the financial services industry generally, including the insurance, mutual fund and retirement solutions industries. This information has been
provided to the reader to give an indication of the Company’s current expectations concerning the Empower Retirement business (and related impacts on the Company) and such statements may not be suitable for other purposes.
They are not guarantees of future performance, and the reader is cautioned that actual events and results could differ materially from those expressed or implied by forward-looking statements. Many of these assumptions are
based on factors and events that are not within the control of the Company and there is no assurance that they will prove to be correct. Whether or not actual results differ from forward-looking information may depend on
numerous factors, developments and assumptions, including, without limitation, the severity, magnitude and impact of the pandemic health event resulting from the novel coronavirus ("COVID-19") (including the effects of the
pandemic and the effects of the governments' and other businesses' responses to the pandemic on the economy and the Company's financial results, financial condition and operations), assumptions around sales, fee rates, asset
breakdowns, lapses, plan contributions, redemptions and market returns, the ability to integrate the acquisitions of Personal Capital and the retirement services business of MassMutual, the ability to leverage Empower
Retirement's, Personal Capital's and MassMutual's retirement services businesses and achieve anticipated synergies, customer behaviour (including customer response to new products), the Company's reputation, market prices for
products provided, sales levels, premium income, fee income, expense levels, mortality experience, morbidity experience, policy and plan lapse rates, participant net contribution, reinsurance arrangements, liquidity requirements,
capital requirements, credit ratings, taxes, inflation, interest and foreign exchange rates, investment values, hedging activities, global equity and capital markets (including continued access to equity and debt markets), industry
sector and individual debt issuers' financial conditions (including developments and volatility arising from the COVID-19 pandemic, particularly in certain industries that may comprise part of the Company's investment portfolio), the
United Kingdom's exit ("Brexit") from the European Union, business competition, impairments of goodwill and other intangible assets, the Company's ability to execute strategic plans and changes to strategic plans, technological
changes, breaches or failure of information systems and security (including cyber attacks), payments required under investment products, changes in local and international laws and regulations, changes in accounting policies and
the effect of applying future accounting policy changes, unexpected judicial or regulatory proceedings, catastrophic events, continuity and availability of personnel and third party service providers, the Company's ability to complete
strategic transactions and integrate acquisitions, unplanned material changes to the Company's facilities, customer and employee relations or credit arrangements, levels of administrative and operational efficiencies, changes in
trade organizations, and other general economic, political and market factors in North America and internationally.
The reader is cautioned that the foregoing list of assumptions and factors is not exhaustive, and there may be other factors listed in filings with securities regulators, including factors set out in the Company’s management's
discussion and analysis for the year ended December 31, 2020 ("2020 Annual MD&A") under "Risk Management and Control Practices" and "Summary of Critical Accounting Estimates" and in the Company's annual information form
dated February 10, 2021 under "Risk Factors", which, along with other filings, are available for review at www.sedar.com. The reader is also cautioned to consider these and other factors, uncertainties and potential events carefully
and not to place undue reliance on forward-looking information. Other than as specifically required by applicable law, the Company does not intend to update any forward-looking information whether as a result of new
information, future events or otherwise.
CAUTIONARY NOTE REGARDING NON-IFRS FINANCIAL MEASURES
This document contains some non-IFRS financial measures. Terms by which non-IFRS financial measures are identified include, but are not limited to, "base earnings (loss)", "base earnings (loss (US$)", "base earnings per common
share", "return on equity", "base return on equity", "core net earnings (loss)", "constant currency basis", "impact of currency movement", "premiums and deposits", "pre-tax operating margin", "sales", "operating expenses", "assets
under management“, "assets under administration“, "EBITDA", and "EBITDA (pre-CAC)". Non-IFRS financial measures are used to provide management and investors with additional measures of performance to help assess results
where no comparable IFRS measure exists. However, non-IFRS financial measures do not have standard meanings prescribed by IFRS and are not directly comparable to similar measures used by other companies. Refer to the
"Non-IFRS Financial Measures" section in the Company’s 2020 Annual MD&A for the appropriate reconciliations of these non-IFRS financial measures to measures prescribed by IFRS, where applicable, as well as additional details on
each measure.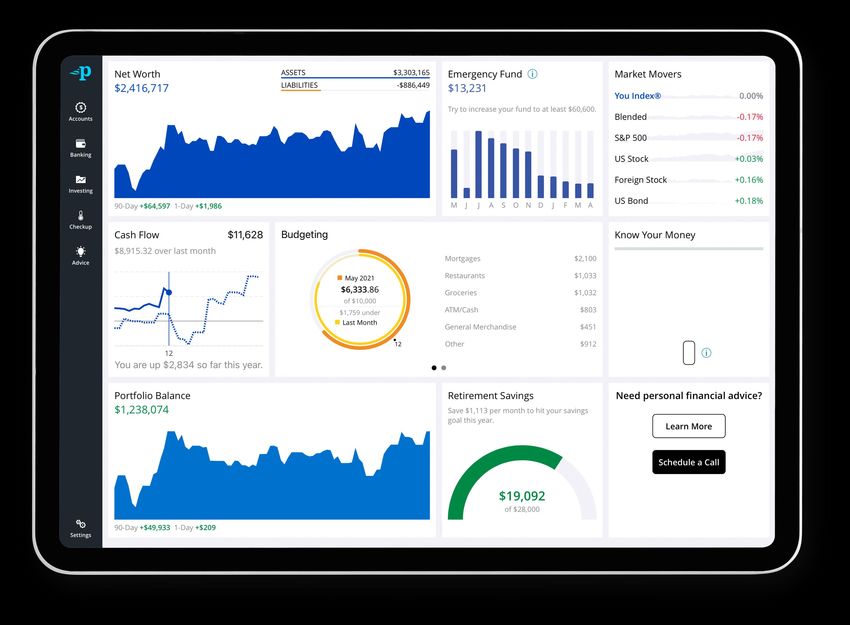
CEO welcome &
Great-West Lifeco overview
Paul A. Mahon
President & Chief Executive Officer, Great-West Lifeco Inc.
4

Agenda
   9:00 – 9:15   CEO welcome & Great-West Lifeco overview       Paul Mahon

   9:15 – 9:50   Empower Retirement

                 Business overview                              Ed Murphy
                 Attractive retirement plan market              Ed Murphy

                 Empower — DC retirement                        Richard Linton

  9:50 – 10:00   Break

 10:00 – 10:20   Empower Retirement

                 Growing consumer wealth management market      Ed Murphy
                 High-growth wealth management business (B2C)   Jay Shah & Carol Waddell
                 Strong financials & looking forward            Christine Moritz & Ed Murphy

 10:20 – 10:25   CEO wrap-up                                    Paul Mahon

 10:25 – 11:30   Q&A (live)                                     All
5

     We have built a diversified, value-creating portfolio

                                                 Lifeco net earnings per share1

                                                                                     ‘12 – ‘20 CAGR                              Retirement Services Business

                                                                                     6.6%                                                                       Since 2012, we have repositioned the
                                                                                                                                                                portfolio through disciplined
                                                                  Health Insurance
                                                                                                                                     Divestment:
                                                                                                                                                                investments and capital deployment
                                           RPS                      Ireland Ltd.
                                                                                                              Divestment:                                       actions:
                                                                                                              U.S. ind. life &
                                                                                                             annuity business                                   • Investing in digital capabilities
                                                                                                                                                                • Acquisitions and dispositions
                                                                                                                                                                • Share buy-backs

                                                                                                                                                                These actions have delivered solid
                                                                                                                                                                shareholder returns:
                                                                                                                                                                • Annual EPS growth of 6.6%
                                                                                                                                                                • Annual dividend growth of 6.1% since 2014
               1.90          2.34         2.55             2.77        2.67            2.17           3.00     2.49                     3.17                    • An average ROE2 of 14.1%
                2012          2013         2014            2015         2016            2017          2018       2019                     2020
Dividends
per share1     1.23          1.23         1.23             1.30        1.38            1.47           1.56      1.65                     1.75

     1 In Canadian dollars; rounded to the nearest cent.
     2 Average ROE between 2012 and 2020.
6

Our market-leading franchises are well positioned
for growth
                     Canada                                                  U.S.                                                            Europe                    Capital & Risk Solutions

     45%                   36%                            10%                    13%                             26%                        31%                           20%                       21%
  of base earnings1,2    of net earnings1             of base earnings1,2      of net earnings1               of base earnings1,2         of net earnings1            of base earnings1,2         of net earnings1

• A leader for insurance and                       • Empower: #2 defined                                   • U.K.: Largest group insurance                           • Top-10 global reinsurer and
  wealth management products                         contribution recordkeeper;5 over                        provider and strong position in                           top-6 life reinsurer9
  and services                                       U.S. $1T6 in AUA2 and 12M6 plan                         retirement income solutions
                                                     participants                                                                                                    • A top-2 reinsurer in the U.S. for
• #1 in individual life insurance3                                                                         • Ireland: Leading life assurance                           structured life reinsurance10
                                                   • With acquisition of MassMutual’s                        and pension provider; Irish Life
• #2 in segregated funds4
                                                     retirement services business, U.S.                      Investment Managers (ILIM), one                         • Leading provider in the
• #2 group life and health3                          segment expected to be ~20% of                          of Ireland’s largest fund managers                        evolving European structured
  #3 in group retirement                             Lifeco earnings starting in 20227                                                                                 life reinsurance market
                                                                                                           • Germany: Fast-growing position in
• Multiple, complementary and                      • Putnam: Diversified global asset                        unit-linked pension savings                             • Leading provider of U.K. and
  diverse distribution channels                      management platform with AUM2                           broker-sold market; increasing                            other European annuity/
                                                     of U.S. $192B;8 strong 10-year                          focus on group pensions                                   longevity reinsurance
                                                     performance track record

1 In Canadian dollars. Base earnings for the year ended December 31, 2020, of $2.7B. Net earnings of $2.9B. Corporate represents -1% of base and net earnings. 2 A non-IFRS measure; refer to the discussion of
this measure in the Company’s 2020 Annual MD&A. 3 LIMRA, 2020 results. 4 Strategic Insights (Investor Economics) full-year 2020 results. 5 By total assets and total participants, Pensions & Investments 2020
Defined Contribution Survey Ranking as of April 2020. 6 As of January 2021 and inclusive of MassMutual. 7 Based on the U.S. segment as a percentage of base earnings in 2020 and including 2022 estimated
earnings for the MassMutual business as disclosed on Slide 78 8 As of December 2020. 9 based on all gross reinsurance/life-focused reinsurance premiums written per A.M. Best’s 2019 Rankings: Top 50 World’s
Largest Reinsurer Groups. 10 As of November 30, 2019 (biennial survey).
7

Our four value-creation priorities: Focus on the
customer and leverage our risk & investment expertise

 Advice-centered value        Digital capabilities      Workplace extensions          Risk & investment
       creation                                                                           expertise

   Continue to scale and      Deliver efficient and        Extend workplace         Leverage capabilities to
    leverage millions of         effective advice,      participant relationships    enable and augment
  customer relationships    solutions and service for    into lifetime customer      wealth and insurance
 to capture value through      customers through         relationships through             solutions
 advice-based wealth and        multiple digitally      hybrid advice, solutions
    insurance solutions         enabled channels               and services
8

Strong growth potential in the millions of customer
and deep advisor relationships across our businesses

                             Customer relationships                                      32M                           12M 2                             5M                            15M 5

                     Plan participant relationships                                      20M                            4M 3                             4M                           12M+
Workplace
 focus1

                          Plan sponsor relationships                                    167K                            39K4                             60K                            67K

                                 Advisor relationships                                200K+                             23K                              10K                          170K6

1 Workplace focus includes both workplace benefits and pensions. 2 Canada customer relationship figure inclusive of group benefits plan dependents. 3 Inclusive of approx. 3M Group Life and Health and 1M Group
Capital Accumulation Plan members; figures are not unique and do not include dependents. 4 Inclusive of 30K sponsors with benefit plans and 9K retirement plan sponsors; figures are not unique. 5 U.S. customer
relationship figures inclusive of Empower and Personal Capital; excludes Putnam. 6 U.S. advisor relationship figures inclusive of GWF and Putnam.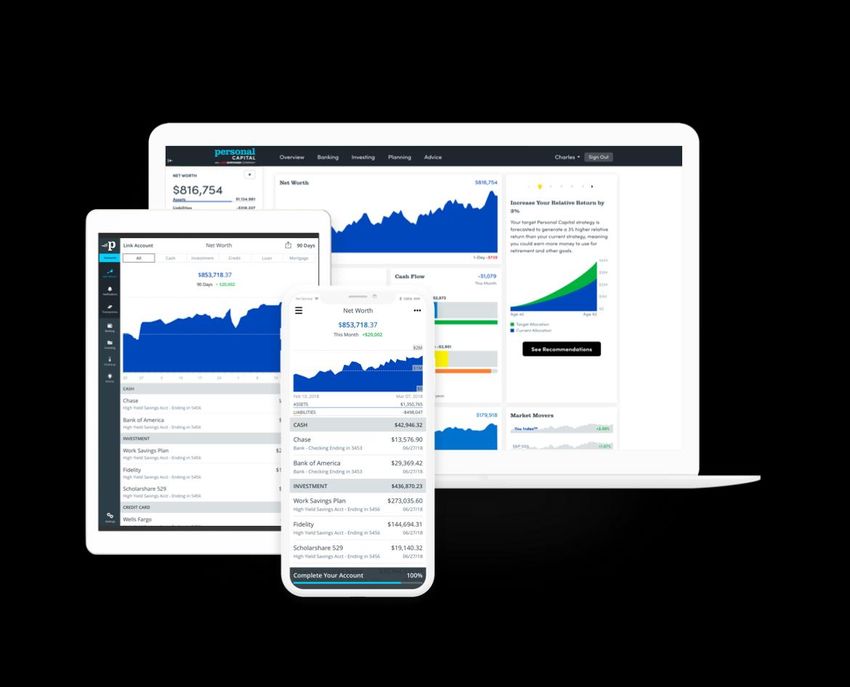
9

Digitally enabled advice is a key value driver
delivered across channels

        Workplace                            Hybrid
                                                                              Advisor
        Direct access to retirement          Digital advice &
                                                                              Advice & solutions through
        & group benefits with plan           solutions plus access
                                                                              independent advisors
        sponsor support                      to in-house advisors

                Plan                         Hybrid advice                     Individual advisor
                participants                 customers                         customers

   Strengthen and extend relationships through digitally enabled experience, advice and solutions
10

Our four priorities are expected to drive growth
across Lifeco’s portfolio

 Higher impact           Lower impact

                 Advice-centered
                 value creation

                 Digital
                 capabilities

                 Workplace
                 extensions

                 Risk & investment
                 expertise
11
Our medium-term* financial objectives are supported
by a diversified portfolio with significant organic and
extension growth potential
8-10% base EPS growth p.a. 14-15% base ROE
Strong cash generation
• Organic earnings growth from • Diversified business that drives • A cash-generative business
market-leading franchises in strong and stable returns supporting a progressive dividend
Canada, the U.S. and Europe policy
• Wealth management extensions
• Digital investments to drive that drive capital-light growth • Investment in future growth and
business extensions and cost resiliency
• Leveraged capital management
optimization
and risk management expertise • Potential incremental base EPS
• Revenue and expense synergy growth and ROE strengthening
harvesting for completed through M&A
transactions
Value creation through disciplined capital deployment
* Medium-term defined as the next 3-5 years.12
Sustainability, DEI and ESG are core to our value-
creation objectives
Environmental Diversity, Equity ESG
stewardship & Inclusion investing
• “A” rating from CDP (formerly the Carbon • Lifeco’s Diversity Policy focuses on • Developing a fully integrated approach to
Disclosure Project); top 5% of companies developing and promoting DE&I in our ESG through the explicit and systematic
globally; highest-rated Canadian insurer workforce and advancing the interests of inclusion of qualitative and quantitative
for 6 consecutive years traditionally underrepresented groups ESG information in investment analysis
and decisions
• Official supporter of the Financial Stability • Formation of Employee Resource Groups
Board’s Task Force on Climate-related for LGBTQ2+, black and persons of colour, • Established a global Sustainable
Financial Disclosures (TCFD) indigenous peoples, and persons with Investment Council in 2019 chaired by the
recommendations disabilities, among others Global CIO
• Greenhouse gas (GHG) emissions • Objective for at least 30% female • Putnam, Panagora, Setanta and ILIM are
reduction target of 50.4% by 2036 (from representation on our Board and senior signatories to the UN-supported
2013) for our owned Canadian office and management team Principles for Responsible Investment
multi-residential properties
• Supporter of various social initiatives • Recipient of Global Real Estate
within our communities Sustainability Benchmark (GRESB) “Green
Star” ratings for multiple fundsEmpower Retirement FOR INTERNAL USE ONLY.
14

Today’s presenters

       Edmund F. Murphy III    Richard Linton              Carol E. Waddell
           President and CEO         President,          Executive Vice President, Head of
                                  Workplace Solutions      Retirement Solutions Group

             Jay Shah          Christine Moritz            Andra S. Bolotin
               President,       Senior Vice President,    Executive Vice President, CFO
            Personal Capital   Empower Retirement CFO
15 Key messages & agenda Business overview - Murphy • Empower is a leading financial services franchise serving businesses and individuals Attractive retirement plan market - Murphy • The large and shifting U.S. market landscape creates a highly attractive growth opportunity. Winning in defined contribution retirement (B2B) - Linton • Empower is an established market leader uniquely positioned to win in the defined contribution retirement plan business. Growing consumer wealth management market - Murphy • The IRA market and underserved mass affluent investors contribute to this growing opportunity. High-growth wealth management business (B2C) – Waddell & Shah • Synergies with B2B retirement and the Personal Capital acquisition create a significant direct wealth-management business opportunity. Strong financials & looking forward – Moritz & Murphy • Empower’s resilient business has delivered a history of growing earnings and cash flows. All presenters will be available for 45-minute question-and-answer opportunity at the end of prepared remarks.
Business overview
17

Empower Retirement overview
All figures in presentation are in U.S. $

                                     Key figures                                                                                                Clients

         2020 revenue of $1.2 billion with a 2016-to-2020 revenue                                                                      12 million individuals and over
         CAGR of 10%                                                                                                                   67,000 organizations
         In January of 2021, passed $1 trillion in assets
         under administration
         Over $35B in retail wealth management assets                                                                                  2.9 million individuals using platform and
         under management as of March 31, 2021                                                                                         27,000 wealth management customers
         Founded in 2014 through the bringing together of Great-West
         Financial and Putnam Retirement and acquisition of J.P.
         Morgan Retirement Plan Services
         Second-largest1 defined contribution recordkeeper                                                                                    Earnings
         Over 8,900 employees
                                                                                                                                   $218M of net earnings in 2020 with a 2016-
         Completed 2 major strategic acquisitions in 2020,                                                                         to-2020 CAGR of 30%
         Personal Capital and MassMutual

1) Measured by retirement plan participant, source P&I DC Recordkeeping Survey 2021
CAGR = Compound annual growth rate
Empower client numbers do not include Personal Capital and Personal Capital client numbers do not include Empower
Assets under administration and assets under management are non-IFRS measures. Refer to the discussion of these measures in Great-West Lifeco’s Q1 2021 MD&A.
18
Used 2020 report
Empower targets a large and growing market
numbers updated
U.S. household investable assets
2019 ($T)
DC (defined contribution)
Tax-advantaged defined contribution retirement
savings plans offered by employers
6.6
5.1
IRA (individual retirement account)
Tax-advantaged retirement savings for individuals
27.0
59.0 that can be funded from DC plan rollovers or
directly by individuals
11.0
9.1 Taxable
Non-tax-advantaged savings and investments
DC IRA Taxable Banking Other Total funded directly by individuals
CAGR 4.3% 6.7% 6.2% Banking
Savings, checking, certificates of deposits and
savings bonds
Cerulli Retirement Markets 2020, Cerulli Retail Markets 2020. CAGR is projected from 2020 to 2025.19
Market-leading franchises in 2 synergistic markets
B2B solutions to manage DC (defined contribution) One at-scale platform
retirement benefits for employers
Shared technology capabilities
Synergistic client acquisition
Complementary brands
B2C wealth management solutions (rollover/IRA & taxable) for
individuals offered directly and through retirement plan Proprietary messaging engine20
We serve our customers
Our culture Our values
Customer obsessed We do the right thing
Accountable We own it
Growth mindset We lead
Constantly improving We simplify
Inclusive We collaborate
FOR INTERNAL USE ONLY.21
Brand
• Empower and Personal Capital brands have increasing awareness numbers with positive brand attributes.
• Significant planned ongoing investment in brand awareness
NFL stadium naming rights & sports sponsorships National television spots22
Consistent history of growth and ambitious financial
targets
• Empower has seen consistent organic growth since inception.
• The Personal Capital and MassMutual acquisitions position Empower to accelerate the growth trajectory moving
forward.
2016 2020 CAGR 16-20
Assets under administration ($B) 450 768 14%
Individual relationships (M) 8.1 9.4 4%
Revenue ($M) 800 1,200 10%
Pretax earnings ($M) 80 250 34%
Note: 2020 data does not include assets and individuals from MassMutual acquisition that closed on December 31, 2020.
Assets under administration is a non-IFRS measure. Refer to the discussion of these measures in Great-West Lifeco’s Q1 2021 MD&A.
Revenues are Net Fees and Net Investment Income, non-IFRS measures. For this purpose, Net Fees are fees less commissions less plan and managed account expenses
and Net Investment Income is investment income excluding income on surplus and changes in fair market values, less interest credits.23
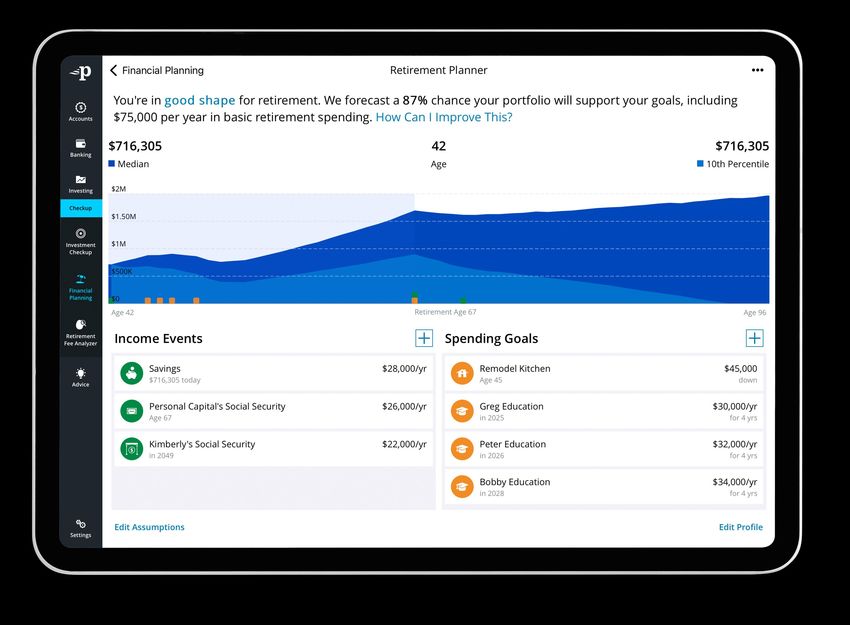
Personal Capital acquisition enhances DC retirement
plan and wealth management value proposition
Organizations receive a state-of-the-art financial Personal Capital tools are
92%
highly persistent, with over
wellness offering bundled with their retirement
plan benefit.
Individuals receive a 3-dimensional saving
experience driven by Personal Capital technology:
of clients logging in quarterly
• Current retirement savings and 23 average logins a month1
• Projected retirement income
• Spending, savings and debt (net worth)
1/2
Over
Multichannel messaging engine provides highly
personalized next steps.
New Empower wealth management website
and platform are featured. of employers believe financial
wellness programs drive tangible
benefits2
1 Personal Capital as of 3/31/21, all clients since inception.
2 Employee Benefits Research Institute Financial Wellbeing Employer Survey 2020.24
MassMutual acquisition drives scale
Summary Composition of client assets1
Defined Benefit
• Transaction strengthens Empower’s position in the #21
Taft-Hartley
12% 4%
defined contribution recordkeeping market Retirement solutions
Not-for-Profit
provider with Corporate
• Increases scale advantages and capitalizes on expertise, capabilities across all
10%
63%
technology excellence and deep product capabilities plan types Government
11%
• Increases the synergy impact of Personal Capital on the
Empower recordkeeping and wealth management business
26,000 > 2.5M management (AUM)
within proprietary
PLANS PARTICIPANTS stable value or Separate account/Other
Proprietary & third-
mutual fund party mutual funds stable value
6%
products 83%
1 Measured by retirement plan participants, source P&I DC Recordkeeping Survey 2021.
2 Key statistics and composition of client assets as of June 2020.25
Community involvement: ACT Program (Associates,
Community, Together)
63% of our corporate giving dollars went to nonprofits that primarily serve under-resourced communities.
SUPPORTED FRONT-LINE
OVER COVID ORGANIZATIONS WITH
1,173 7,420 $250K
NONPROFITS FINANCIALLY SUPPORTED VOLUNTEER HOURS DESPITE AND DOUBLED
COVID CHALLENGES MATCHING GIFTS
2020
NATIONAL PHILANTHROPY
DAY HONOREE
Associates refers to employees of Empower & Personal Capital.26
Empower has leading Glassdoor employee ratings
Score (on a scale of 5)
Empower Retirement 4.2
Fidelity 4.2
Principal 4.1
4.2
T. Rowe Price 3.8
John Hancock 3.8
Prudential 3.8
Voya 3.8 SCORE
Vanguard 3.5
Alight 3.3
Transamerica 2.9
ICMA-RC 2.9
Ratings as of 3/31/21
Source: Glassdoor27
Experienced management team with proven track record
Edmund F. Murphy III John Bevacqua Andra S. Bolotin Richard Linton Stephen E. Jenks Carol Kline Jonathan D. Kreider
President and CEO Chief Risk Officer Executive Vice President, CFO President, Senior Vice President, CMO Senior Vice President, CIO Senior Vice President,
30 years of industry experience 30 years of industry experience 30 years of industry experience Workplace Solutions 30 years of industry experience 25 years of industry experience Head of Great-West Investments™
30 years of industry experience 17 years of industry experience
David G. McLeod Christine Moritz Suzanne M. Sanchez Richard G. Schultz Jay Shah Carol E. Waddell Tina Wilson
Senior Vice President, Chief Business Senior Vice President, CFO Chief Human Resources Officer General Counsel, Chief Legal Officer President, Personal Capital Executive Vice President, Head of Senior Vice President,
Development Officer 18 years of industry experience 15 years of industry experience 34 years of industry experience 20 years of industry experience Retirement Solutions Group Chief Product Officer
35 years of industry experience 27 years of industry experience 25 years of industry experience28 Empower overview video
Attractive market – DC retirement
30

Market – Key messages
  The DC market is large and complex, with many different segments and industry
  participants.

  Organizations have increased interest in financial wellness and bundling benefits.

  Shifting DC market dynamics are changing industry economics and how to compete.

  As a result, DC recordkeepers are consolidating.

  Clear winners are emerging, capturing growing their market share, and some are
  accelerating growth through M&A.
31

DC market continues to grow
•    Corporate DC flows have declined due to aging workforce.
•    Closing the access gap offers opportunity to increase flows.

Corporate DC assets (market), excluding
government & not-for-profit ($B)                                                                         CAGR
                                                                                                         8.7%

                         4,095                    4,835                5,114                  5,078                     5,436                  6,313                  6,025                   7,327
       Year ended         2012                     2013                   2014                   2015                    2016                   2017                   2018                    2019

Corporate DC asset flow (market), excluding
government & not-for-profit ($B)                                                                                                                                                              1,295
                                                                                                                                                 888
                                                     750
                             408                                                                         399                    418                    452                     488                    510
     Market Growth                   321                    343             302    370                                    363
     Contributions                           13                                                                                                                                                               7
     Net Flows                                                     (10)                   (23)     -15           (21)                    (5)                   (11)                    (24)
                                    (308)                  (353)                                                                                                       (264)
     Distributions                                                                (393)                  (420)                  (423)                  (463)                                          (503)
                                                                                                                                                                               (512)

                                    2012                   2013                   2014                   2015                   2016                   2017                    2018                   2019

Source: Cerulli 2019
Corporate DC market net flows is a non-IFRS measure for which there is no comparable measure in IFRS and is an indicator of the ability to attract and retain business. Corporate DC
market net flows is calculated by subtracting aggregate annual corporate DC market distributions from aggregate DC market contributions.
32
New Slide
Large opportunity to increase retirement plan access
for working Americans
Workforce size and participation (in %) as of end of 2019
Private sector Public sector
~62.8 million
9%
19.4
33% 39.6M either do not participate or do not have
access to employer-sponsored
retirement plans
139.6M 16% 19.2M
of public sector workers
workers do not have access to any
type of employer-
~$5 trillion
sponsored programs
120.2 51% 61.2M
potential retirement asset-capture
Private workforce Public workforce opportunity through expanded
participation and access
Do not have access
Have access but do not participate
Have access and participate
Source: 2020 PWC Retirement in America.33
Employers are focusing on financial wellness
programs for employees
% of employees who find it stressful dealing with their financial situation Majority of employers believe FW delivers tangible benefits; 52% have
67% implemented while 25% are implementing (2020)
61%
Top reasons for offering financial wellness
52% 52% 53% Impr oved over all worker satisfaction
Improved overall worker satisfaction 44%
48% 47%
45% Impr oved employee retention
Improved employee retention 37%
2012 2013 2014 2015 2016 2017 2018 2019
Reduced employee financial stress
Reduced employee financial stress 35%
Increased em ployee productivity
Increased employee productivity 28%
% of employees by generations (2019) % distracted at work due to
personal finances Impr oved employee use of existing benefits
Improved employee use of existing benefits 25%
Reduced healthcare costs
Reduced healthcare costs 20%
Reduced employee absenteeism 17%
Reduced employee absenteeism
Baby boomers 51% Baby boomers 16%
Impr oved employee recruitment
Improved employee recruitment 17%
Gen Xers 65% Gen Xers 31%
Impr oved workforce management for r etirement
Improved workforce management
for retirement 14%
Millennials 76% Millennials 49% Differentiator from competitors
14%
Differ entiator from com petitors
Source: Charts on left half of slide, PwC Employee Wellness survey 2019
Source: Charts on right half of slide, EBRI Financial Wellbeing Employer Survey 202034
Significant shifts in the DC market have led to an
evolution of the business model for recordkeepers
Historic model Market forces Future model
1 2 3
Revenue driven from investments Pressure on investment and fee Revenue driven from rollovers,
revenue managed accounts and consumer
Pure B2B recordkeeping and offerings
investment offering ― limited Expanded customer interest in
bundling and consumer offering integrated benefits, including holistic Open-architecture investment offering
financial wellness
Highly paper-centric experience Integrated benefits
Heightened customer expectations
Many small and medium-size for digital experiences Digital-first experiences
specialized players
Need for recordkeepers to make Few large, at-scale operations
large infrastructure investments35
Defined contribution market share as measured by
participants
Total participants Total participants Market share Market share
Rank Recordkeeper YoY change (M) YoY change (%)
as of Sep 2020 (M) as of Sep 2019 (M) as of Sep 2020 as of Sep 2019
1 Fidelity 25.7 23.7 2.03 8.6% 24.5% 23.2%
2 Empower 11.8 9.2 2.59 28.1% 11.2% 9.0%
3 Principal 8.4 8.6 -0.21 -2.5% 8.0% 8.4%
4 TIAA 6.4 6.3 0.10 1.7% 6.1% 6.2%
5 Voya 6.1 5.4 0.69 12.7% 5.8% 5.3%
6 Vanguard 5.5 5.7 -0.22 -3.9% 5.2% 5.6%
7 Alight 4.8 4.8 -0.02 -0.4% 4.6% 4.7%
8 Bank of America 4.0 4.1 -0.08 -2.0% 3.8% 4.0%
9 Transamerica 3.6 3.6 -0.02 -0.6% 3.4% 3.5%
10 Prudential 3.3 3.1 0.20 6.5% 3.1% 3.0%
11 ADP 3.1 2.9 0.17 5.8% 3.0% 2.9%
12 John Hancock 2.9 2.7 0.17 6.3% 2.8% 2.7%
13 Nationwide 2.8 2.7 0.06 2.0% 2.6% 2.7%
14 T. Rowe Price 2.2 2.3 -0.05 -2.4% 2.1% 2.2%
15 AIG 2.0 2.0 -0.02 -1.1% 1.9% 2.0%
Source: P&I DC Recordkeeping Survey 2021 as of September 2020.
Market Share calculated based on participating companies’ self-reported data.
Empower 2020 survey data includes MassMutual acquisition.36
Updated
Largest DC providers are gaining share
Top 5 recordkeepers increased market share from 43% in 2012 to 58% in 2020.
Consolidation is likely to continue
as business models evolve.
Top 5
recordkeepers
13 industry transactions have
Top 5
43% recordkeepers
58% occurred since 2019.
The likely end state is a small
Next 15
recordkeepers group of providers with
32% Next 15 significant scale.
recordkeepers
Other
30%
recordkeepers
25% Other recordkeepers
12%
2012 2020
Source: P&I DC Recordkeeper Survey 2021, data as of Sep-2020; PLANSPONSOR DC RK Survey, Dec-2012; ICI.37
Shifting market creates imperatives for recordkeepers
Operate at scale Provide strong Establish robust Scale distribution Own the last mile to
consumer advice & revenue streams the participant
financial wellness beyond proprietary
offering asset revenue
Industry dynamics will The winning offering will Fiduciary pressures on The ability to reach all The ability to reach
continually raise the bar be driven by an intuitive proprietary offerings will market segments will participants and deliver
of size needed for scale. and easy customer continue. become critical. engaging experiences
experience. allows for greater
capture of rollovers.
Looking ahead, winning in DC will require recordkeepers to drive meaningful revenue growth
from adjacent products while maintaining cost discipline.Empower – DC retirement
39

Empower DC value proposition

                  Powerful online financial tools complemented by human-delivered advice

                  Industry-leading service as measured by Net Promoter Score (NPS)

                  Brand viewed as innovative industry leader

                  Focus on retirement and financial wellness

                  Segmented offering that aligns service model with needs of customers

Net Promoter Score is the percentage of customers rating their likelihood to recommend a company, a product, or a service to a friend or colleague as 9 or 10 minus the percentage
rating this at 6 or below on a scale from 0 to 10.
40
Leader across the DC market
Empower serves the entire business-to-business market, including large and small companies, state
and municipal governments, not-for-profit organizations, and unions.
2 24 1st
Recordkeeping Serving
of the 5 largest DC plans state government Largest provider to small and
in the U.S. plans emerging plans defined as those
under $50M in assets41 Customer experience demonstration video
42

High customer satisfaction
Net Promoter Score (NPS range -100 to +100)                                                          Net Promoter Score is the percentage of customers rating their
                                                                                                     likelihood to recommend a company, product or service to a friend or
                                                                                                     colleague as 9 or 10 minus the percentage of those rating it 6 or below
                                     2020        2019   2018        2017                             on a scale from 0 to 10.

                                                                                                74

                                                                                      67
Large & Mega 401(k)
                                                           37

                                            19
                                                                                                       100                   > 70                  > 50                  30
                                                                                                                                                                      INVESTMENT &
                                                                                                74        BEST              WORLD CLASS          EXCELLENT              INSURANCE
                                                                                                                                                                        AVERAGE
                                                                                           70
       Government
                                                                       46

                                                                            47

                                                                                 53
                                                                                                                   23                     >0                 - 100
                                                                                                                   BANK               AVERAGE TO
                                                                                                                                                              WORST
                                                                                                                  AVERAGE                 GOOD
                                                               39
       Small 401(k)
                                                         35

                                                               37

Internal client satisfaction research & with NPS scale provided by QuestionPro.
43
Awards and recognition
A recognized leader among advisors and plan sponsors Participant experience and communications
152 awards 93 awards
11 P&I Eddy awards 4 Signature awards
89 awards for service excellence – More #1 rankings than any
#1 among the 10 largest providers other recordkeeper
— 2020 DC Survey as of January 2021 — 2020 PLANADVISER Survey
116 awards 4 awards
Ranked Top in 5 of 6
recordkeeping 1 Gold medal for mobile
categories participant experience
—Financial Advisor IQ44
Business results: Empower totals
AUA ($B) Ending participants (000s) Sales ($B)
516 673 958 8,370 8,768 11,903 31 74 44
2018* 2019 2020 2018 2019 2020 2018 2019 2020
2018 does not include investment only.
Assets under administration is a non-IFRS measure. Refer to the discussion of these measures in Great-West Lifeco’s Q1 2021 MD&A.
Sales is a non-IFRS measure. Refer to the discussion of these measures in Great-West Lifeco’s Q1 2021 MD&A.45
MassMutual integration status
Strategy Moving clients to Empower recordkeeping platform
• Three legacy recordkeeping platforms 2021 2022
transitioning to the Empower Q1 Q2 Q3 Q4 Q1 Q2 Q3 Q4
recordkeeping platform
J F M A M J J A S O N D J F M A M J J A S O N D
• Seven migration waves through
September 2022 Wave 1
• Significant upgrade to legacy offering Wave 2
Wave 3
• Fully automated plan and data setup Wave 4
leverageable for future acquisitions Wave 5
Wave 6
Active data Wave 7
Status
• Positive early client-retention results
OMNI end date
• New-associate onboarding and training
TRAC end date
completed Reflex
History end date
• Data mapping nearing completion
Planning Solution Execution
• System builds to automate plan setup/
data migration on scheduleAttractive market – Consumer wealth management
47
                                                                                                                                                                  Used 2020 report

Targeting assets beyond DC plans increases
                                                                                                                                                                  numbers updated

Empower’s addressable market 4-5x
U.S. household investable assets
2019 ($T)
                                                                                                                DC (defined contribution)
                                                                                                                Tax-advantaged defined contribution retirement
                                                                                                                savings plans offered by employers
                                                                                                 6.6
                                                                            5.1
                                                                                                                IRA (individual retirement account)
                                                                                                                Tax-advantaged retirement savings for individuals
                                                       27.0                                             59.0    that can be funded from DC plan rollovers or
                                                                                                                directly by individuals
                                  11.0
               9.1                                                                                              Taxable
                                                                                                                Non-tax-advantaged savings and investments
               DC                  IRA                Taxable             Banking               Other   Total   funded directly by individuals

CAGR        4.3%                 6.7%                6.2%                                                       Banking
                                                                                                                Savings, checking, certificates of deposits and
                                                                                                                savings bonds

Cerulli Retirement Markets 2020, Cerulli Retail Markets 2020. CAGR is projected from 2020 to 2025.
48
Within this large market, mass affluent households
represent ~50% of investable assets
~50% of mass affluent assets are outside
retirement accounts
Ultra high/High net worth wealth market Distribution of investible assets by account / type
47% of assets
1% of households >$5M investable
Other
Banking
1%
11%
Retirement
Retail (DC, IRA)
Mass affluent &
50% of assets
34% of households middle market 37%
51%
$100K - $5M investable
3% of assets
65% of households Mass market49
Financial concerns of mass affluent customers
Mass affluent investors are concerned …
About being financially secure in retirement 51%
That I have not properly tax optimized my portfolio 46%
That my portfolio won't withstand a market downturn 42%
I have not created a long-term estate plan 40%
That I will lose my wealth 38%
I am spending too much/not saving enough for my children's college 38%
About saving enough for my children's college 33%
That my children will grow up spoiled 31%
About keeping up with others in my circle 27%
My financial life feels disorganized 26%
0 10 20 30 40 50 60 70
Source: Personal Capital Affluent Investor report 2021.50
New Slide
The most popular retirement saving vehicle, IRAs
drive overall growth for the industry
IRA assets are expected to surpass $17T (baseline) by 2025 and Rollovers compose majority of 2Q 2020 Market share
remain the most popular retirement saving vehicle in the U.S. all IRA contributions
Assets $T Projected CAGR (‘20-’25) DC plan rollovers represented Fidelity and Charles Schwab
96%
are the largest IRA providers
4.1% 8.1% 11.1% by AUA, with $1.97 trillion
and $956 billion in IRA AUA
CAGR (‘15-’20) 9.5%
18.2%
of IRA contributions
between 2013 and 2018
8.9%
$7.5 $8.0 $9.4 $9.3 $11.0 $11.8 $14.4 $17.4 $19.9 5.8%
2015 2016 2017 2018 2019 2020 2025 Low 2025 Baseline 2025 High
Source: Cerulli 2020 Report, PWC Retirement in America.51
Addressable market and money-in-motion insights
suggest 3 B2C opportunities for Empower
Shifting money to a different institution
Rollovers
Held-away assets Direct client acquisition
On average, ~6% of plan assets roll For every dollar in a DC account, there There are ~$35T of investible
Opportunity
over every year 1 are 4-5 dollars in IRAs, taxable assets outside DC plans 2
accounts & banking accounts 2
Potential for
$60B of rollover assets to $4-5T of assets to target Capturing share in highly
Empower
target annually fragmented wealth
(at $1T of AUA as
management market
of 3/31/2021)
Critical Existing relationships with Existing relationships with DC Efficient direct client-acquisition
success factor DC plan participants plan participants model
1 Empower book of business experience
2 Cerulli Retirement Markets 2020, Cerulli Retail Markets 2020.52
How to win in the wealth management market
Advice-based value Focus on asset Efficient client Digital capabilities Scale
proposition allocation and access acquisition
to low-cost products
Market is moving to fee- As competition High client-acquisition Competitive digital Absorbing increasing
based models as clients increases, wealth cost is a barrier to experience is expected technology and
are increasingly willing managers can use low- growth and gives a by clients and allows regulatory costs
to pay for advice. cost products to lower significant advantage firms to deliver advice requires scale.
the total client cost and to DC providers with at scale and more
capture more margin. existing relationships. profitably.
Looking ahead, winning in wealth management will require winning the advice and
experience battle while acquiring and servicing customers in a cost-effective fashion.Empower & Personal Capital – Consumer wealth management
54

Consumer wealth management – Key messages

  Empower wealth management services are a key part of our retirement plan
  service offering to over 12 million individuals.

  The Personal Capital offering is targeted to the large and underserved mass
  affluent market.

  Personal Capital and Empower consumer offerings are highly synergistic.

  Both offer award-winning online tools complemented by human advice.

  Our efficient customer-acquisition models leverage technology.
55

Fast-growing consumer wealth management franchise
                             Direct markets to mass affluent investors using unique blend                                            Markets to individuals in Empower-administered retirement
                             of digital tools and human advice                                                                       plans to capture IRA rollovers & investment accounts

                        $1M –
                                                                                    Wirehouses,
                        HNW

                                                                                                                                    12+ million retirement plan participants
                         $5M
                                                                                      brokers

                                                                                                                                       JOB CHANGES
                                                                                                                                                                           EMPOWER IRAS
                      affluent
                      $100K –
                       Mass

                        $1M

                                                                                           RIAs
                                                                                                                                     INDIVIDUAL SAVING
                                                                                                                                        & INVESTING                     EMPOWER BROKERAGE
                                                                                                                                                                            ACCOUNTS
                                                   RIAs
                        $100K
                        Retail
                        $0K –

                                       Robo, retail                                                                                     RETIREMENT
                                                                                                                                                                     EMPOWER HIGH NET WORTH
                                                                                                                                                                            SERVICES
                                                                                                                                      HIGH NET WORTH
                                    Simple solutions        Digital advice      Traditional advice
                                      (tech-based)             (hybrid)           (people-based)

                                                                   Wealth management assets under administration ($B)
                                                                                                                                                                           32,500

                                                                                                                                            12,000                           16,300
     Personal Capital
                                        5,500                                    7,600                                   8,500
     Empower retail                       5,500                                   7,600                                    8,500              12,000                         16,200

                                           2016                                     2017                                     2018              2019                           2020

Assets under administration is a non-IFRS measure. Refer to the discussion of these measures in Great-West Lifeco’s Q1 2021 MD&A
Unique digital & human hybrid platform: Personal Capital is different
57

 Meet Personal Capital: The future of
 wealth management
                          Company overview                                                                  Platform “at a glance” as of March 31, 2021

                                                                                                                                               Users (aggregation)                                                     ~2.9M
                                                                                                                                       Total assets: ~$1T (>1% of U.S. investable assets)                           registered users

                                                                                                                                                       Total liabilities: ~$155B
     MISSION                          VISION                          BRAND                                                                                                                                         ~1.7M
 To transform financial            To be a trusted            Do The Right Thing, Always                                                                                                                       aggregating users
      lives through                money advisor
                                                                    Be Innovative
technology and people
                                                                                                                                    30 – 65+
                                                                     Be Personal
                                                                                                                                    College educated
                                                                                                                                                                         Mass
                                                                                                                                                                                                              ~690K
                                                                                                                                    Likely to be married
                                                                                                                                                                        affluent                         current prospects
                                                                                                                                    Professionals                       investor
                           Value proposition                                                                                        Technology forward

                                                                                                                                                                                                       25X+
                                                                                                                                      Core wealth assets: $18B+                                       client base
                                                                                                                                                           AUM/client: $660K+
                                                                                                                                                       Avg. wallet share: 50%+
    CONNECT                            PLAN                           ADVISE
                                                                                                                                                        Median client age: 49
See where you stand          Realize what’s possible             Transform your
  Connect all your            Map your financial life              financial life                                                                                                           ~27K
  money in minutes                                            An advisor you can trust                                                                                                      clients

Assets under administration is a non-IFRS measure. Refer to the discussion of these measures in Great-West Lifeco’s Q1 2021 MD&A.
Assets under management is a non-IFRS measure. Refer to the discussion of these measures in Great-West Lifeco’s Q1 2021 MD&A.
58
A unique digital and human hybrid platform
that tackles real and complex challenges
Credit
Student cards Joint
loan IRA Trust
account
account
Nancy faces a
daunting challenge
of understanding Savings
Advisor
her financial life Challenges
facing mass
affluent
Mortgage customers
Checking
Stock
options
529
401(k)
Line of
credit Brokerage
Please note “Nancy” is not a real client and is mentioned for illustrative purposes only.59
Nancy sees where she stands –
and connects all her money in minutes
What’s my net worth?
Do I spend more than I save?
Is my portfolio diversified?
Will I outlive my money?60
Nancy realizes what’s possible –
maps her financial life
Create a comprehensive plan
Gain insights into spending,
saving, and retirement goals
See projected outcomes and run
“what if” scenarios
Simplify complexity around
constantly evolving life61
Nancy transforms her financial life –
with an advisor she can trust
• Holistic view of entire financial life
• Dedicated advisor who guides her
through a shared experience
• “Show not tell” what is possible
• Personalized portfolios plus full
financial planning
• Confidence in life goals, not just
investments, to optimize outcomes62
Personal Capital is Nancy’s
trusted money advisor
World-class tools and technology
• Holistic view of Nancy’s entire financial
life in real time
• Personal, relevant, data-driven planning
Investment methodology: Personal Strategy™
Tax Smart
• Strategy selection based on sophisticated set
optimization Weighting™ of Nancy's personalized data that conforms to
her individual needs
Personalized
holistic
investment
strategy
• Custom portfolio composed of individual
Dynamic
securities and Smart Weighting™ for better
Disciplined
portfolio
allocation
rebalancing optimization than simple ETF-only solutions63
Engaging personal financial management drives
hyper-engagement among customers
Persistent engagement is the Frequently Dashboard login
frequency
key to building trust and being engaged 90-day active1 (monthly average)
90-day active1
at the right place at the right
92% 62% 40%
time to win clients and extend AGG. USERS
40%+ 15x
23.0
new products and services. Discount broker site
traffic benefits from
18.0 day-trading activity TARGET USERS 62%+ 18x
15.0
CLIENTS 92%+ 23x
users
Clients
Target
Aggregated
users
TOTAL VISITS PER MONTHLY UNIQUE VISITOR (April 2019 – March 2021)2
1 All customers since inception, including app login or open email, as of March 31, 2021.
2 SimilarWeb data as of March 31, 2021.
Aggregated users refers to individuals using Personal Capital aggregation services.
Target users refers to individuals with over $100K of investable assets who use Personal Capital aggregation services.
Clients refers to Personal Capital wealth management clients64
Personal Capital wins Has advisors I can trust
consumer trust Personal Capital 85%
Vanguard 85%
Fidelity Investments 85%
We have achieved the highest level of advisor
trust in the industry* Betterment 84%
Edward Jones 83%
• Personal Capital is a leading authority in
TIAA 83%
“advisors I can trust”
Wealthfront 80%
• Big gains in Aided Awareness with
79%
+~4.5x
Charles Schwab
Mass Affluent * T. Rowe Price 79%
Merrill Lynch 76%
• Winning consumer trust remains our key
JPMorgan 76%
success factor in the digital consumer wealth
marketplace Nationwide 73%
Wells Fargo 61%
*Tracking study conducted November 30, 2020, to December 8, 2020, by The Harris Poll with 95% confidence level.65
Personal Capital business results
High-growth business Highly attractive business model
Gross revenue CAGR of ~55% from 2015 to 2020 Profitable business today prior to new customer-acquisition costs
AUM CAGR of ~55% since 2015 • Currently unprofitable given investment in customer-acquisition spend
Strong organic asset growth, with annual net flows of ~20%+ Financially attractive customer-acquisition spend
through 2020 • Each dollar of spend expected to generate ~6x lifetime value1
Significant opportunity for growth in untapped customer funnel • Strong gross profit margin and net asset retention of 100% as of March 31,
of $1T of aggregated assets on platform 2021 creates compelling unit economics
Gross revenue growth ($M)
$106
$82 LTV / CAC
~6x1
$59
~$6
$39
$22
$12 $1
2015 2016 2017 2018 2019 2020 Customer acquisition cost Expected lifetime value
1Illustrative Lifetime Value based on gross profit / (1 –Net Asset Retention Rate)
Gross revenue and net flows are non-IFRS measures. Refer to the discussion of these measures in Great-West Lifeco’s Q1 2021 MD&A
Advisory services are offered for a fee by Personal Capital Advisors Corporation (“PCAC”), a registered investment adviser with the Securities and Exchange Commission. Registration does
not imply a certain level of skill or training. Investing involves risk. Past performance is not indicative of future returns. You may lose money. PCAC is a wholly owned subsidiary of Personal
Capital Corporation (“PCC”), an Empower company. PCC is a wholly owned subsidiary of Empower Holdings, LLC. © 2021 Personal Capital Corporation. All rights reserved.Empower Retirement Services Group Direct to consumer wealth management enabled by DC plan relationships
67
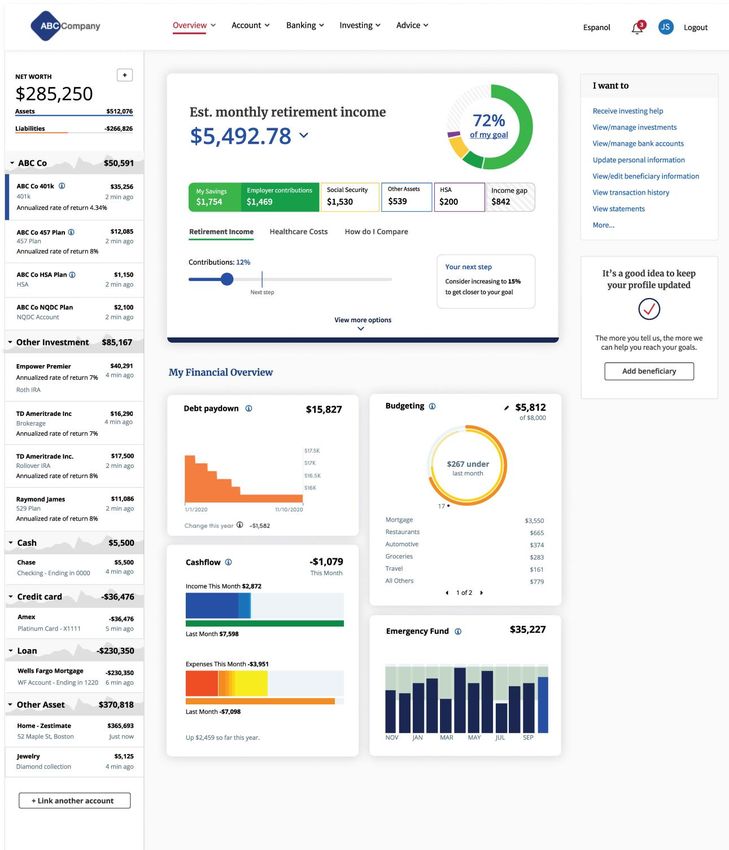
Empower wealth management value proposition
EMPOWER WILL DELIVER STRAIGHTFORWARD, GOALS-BASED ADVICE AND
SOLUTIONS THAT TAKE INTO ACCOUNT YOUR FULL FINANCIAL PICTURE (DEBTS AND ASSETS)
Customer experience
Exceptional digital experience + trusted advisor
driven by Empower values
ONE SIMPLE AGGREGATED ONE HUMAN POINT ONE PATH TO ONE-STOP SHOP
DASHBOARD OF CONTACT SUCCESS FOR ACTION68
Empower wealth management captured $10B in 2020
through money rolled into and out of Empower plans
• Assets roll into Empower retirement plans from individuals who join Empower plans.
• Assets roll into Empower IRAs from individuals who leave Empower plans.
• This money in motion is expected to grow as the Empower retirement plan business scales.
Money in motion
Participant money $4.4B $5.3B Empower IRA
that is held away Empower retirement plans (wealth
(DC plans & IRAs) Roll in Roll out management)
Money in motion represents assets rolled in and rolled out of Empower recordkeeping platform in 202069
Empower wealth management funnel
Roughly 6% of assets are distributed from our
$59B total distributable assets
(includes assets not eligible for rollover)
recordkeeping platform each year.
$40B
Gross rollover opportunity
Empower contacts 50% of distributable
assets.
• Influenced by sponsor participation, plan data and $20B
quality of contact data 50% of opportunity contacted
The rollover rate from Empower plans is 27%
and projected to grow over the next 5 years. $5.3B
27% rolled to
• Influenced by improved product offer, customer Empower
experience and representative effectiveness
Note: Results reflect current Empower capabilities prior to Personal Capital technology integration.70
GUIDANCE AND ADVICE THROUGH ENTIRE JOURNEY
Welcome/ Financial Closed savings Consolidated Best-interest Investment Other goals Managed Financial Job changes/
Onboarding wellness gaps accounts advice strategy accounts planning retirement
Integrated experience
Advisory, wellness and financial planning in a seamless experience
designed to engage employees and promote action
Empower advisor GPS (post Personal Capital integration)
Customer dashboard (post Personal Capital integration)71
Business results: Retirement Solutions Group
AUA ($B) Ending customers (000s) Sales ($B)
8.5 12.0 16.2 104 126 150 3.1 4.3 5.3
2018 2019 2020 2018 2019 2020 2018 2019 2020
Assets under administration is a non-IFRS measure. Refer to the discussion of these measures in Great-West Lifeco’s Q1 2021 MD&A.
Sales is a non-IFRS measure. Refer to the discussion of these measures in Great-West Lifeco’s Q1 2021 MD&A.Financials
73

Financials – Key messages

  Strong earnings growth across workplace and individual wealth management

  Growth potential to come from high-ROI business and generate strong cash flow

  Resilient business with diversified earnings sources

  Strong capital ratios and investment portfolio

  Backed by financial strength of parent company and group
74

Strong track record of growing earnings
                                                                                       Earnings ($s)

                                                                                                                                                                          206
                                                                                                                                              194
                                                                                                                153
                                                                                 121
     Base earnings after-tax:                      76
     Empower BAU

     Base earnings after-tax:
     Personal Capital                               69                            120                            149                            172                       202

     Net earnings after-tax ($s)                    2016                           2017                           2018                           2019                      2020   -10

                  Revenues ($M)                    821                            930                             984                          1,065                      1,195

Revenues are Net Fees and Net Investment Income, non-IFRS measures. For this purpose, Net Fees are fees less commissions less plan and managed account expenses and Net
Investment Income is investment income excluding income on surplus and changes in fair market values, less interest credits.
75
Resilient business with diversified sources of revenues
Estimated revenue mix
~60% of fees are asset-based… …and 68% of assets are equities
Fees by type Assets by type
22% Equities 68%
Asset-based fees
Managed account fees
Non asset-based fees
51%
18%
General account margin
9%
Fixed income
32%
and other
Figures estimated based on revenue since completion of the MassMutual retirement services business acquisition (on a run rate basis).76
Diversified client mix
88% of revenue 40% Core
65K plans
12M participants 15% Govt
B2B
25% Large/Mega Revenues by plan
segment (%)
15% NFP/Taft
5% Inst
B2C
12% of revenue
211K clients
Note: Asset-based fees include administration, AUM and other asset-based fees net of PEA and commissions; Figures estimated based on revenue since completion of the MassMutual
retirement services business acquisition (on a run rate basis).77
Personal Capital growth
Personal Capital’s historical
financial performance
Personal Capital AUM and revenue were at a ~55%
CAGR between 2015 and 2020. Gross revenue ($M)
$82
$106
$59
$39
Personal Capital has been profitable based on $12
$22
serving its existing clients but has been investing 2015 2016 2017 2018 2019 2020
heavily in new-client acquisition.
EBITDA – pre-CAC ($M)
$20
The stand-alone business is expected to achieve $1
$9
profitability after new-client acquisition costs on a ($14)
($7) ($4)
quarterly run-rate basis during 2023 depending on 2015 2016 2017 2018 2019 2020
market and other assumptions. EBITDA ($M)
2015 2016 2017 2018 2019 2020
($27) ($25)
($31)
($37) ($40) ($41)
EBITDA and EBITDA (Pre-CAC) are non-IFRS measures that do not have standard meanings prescribed by IFRS. EBITDA refers to earnings before interest, taxes, depreciation and
amortization. CAC refers to customer-acquisition costs.78
MassMutual acquisition offers meaningful
synergistic opportunities
Following a proven track record, including the similar integration of the J.P. Morgan RPS business
Opportunities Expected run-rate impacts
$160M
• MassMutual business was managed across 3 different recordkeeping Tangible expense synergies
platforms. expected to be phased in
• Empower has a proven proprietary and highly efficient recordkeeping platform over 18 months
that currently administers 12 million participants at a lower unit cost.
• Empower expects to finish migrating the MassMutual business to its platform
in September 2022 (18 months after close).
$30M
Targeted revenue synergies by
• One-time integration costs: $125 million; deal costs: $55 million. 2022, with further synergy
growth expected beyond 2022
• Enhanced business sales platform that offers meaningful revenue synergies
$220M
• Ability to leverage recently completed acquisition of Personal Capital to grow 2022E incremental earnings forecast
the IRA rollover business and expand retail cross-sell capabilities (base earning USD) of MassMutual’s
business (fully synergized, no integration
• Potential to increase penetration of managed account products across expense, including financing)
MassMutual’s book of business of 2.5 million participantsYou can also read


