2021 U.S. Housing Market Outlook April 2021 - Pretium Partners
←
→
Page content transcription
If your browser does not render page correctly, please read the page content below
2021 U.S. Housing Market Outlook : 1

                           2021 U.S. Housing Market Outlook
                           April 2021

                            EXECUTIVE SUMMARY

                            Housing Was the Top Macro Surprise of 2020
                            • CoreLogic’s National Home Price Index rose 9.2% YoY, a remarkable performance
 Charles P. Himmelberg      given the severity of job losses and incomplete recovery of pre-pandemic
Senior Managing Director
    Macro Research          employment levels.
                            • As the pandemic began to restrict social interaction, households suddenly
                            found themselves working from home (also schooling, cooking, and pretty much
                            everything else from home); distance mattered less, and space mattered more.
                            • Reflecting these new demands on homes, potential downsizers and retirees
     Zain N. Butt           decided to postpone listing decisions, while space-constrained families and
      Associate
  Research & Strategy       second-home buyers put new urgency into their purchase decisions, both of which
                            drove the pre-pandemic supply-demand imbalance from bad to worse.

                            Home is Still Paramount
                            • These “pandemic preferences” will likely begin to reverse as social distancing
                            restrictions begin to ease in the second half of 2020.
                            • A return of pent-up sellers and more patient buyers should help rebalance
                            supply and demand, allowing a modest deceleration of home price appreciation to
                            7% in 2021 and 4% in 2022.
                            • Pre-pandemic trends that were driving households into the sunbelt and into the
                            suburbs also seem likely to gain momentum in the post-pandemic era.
                            • In particular, millennial families were already embracing the suburbs, and if
                            work-from-home habits persist into the future as we suspect, then the appeal of
                            the suburbs will have only grown.
                            • Indeed, demand for suburban homes will likely outpace supply for years to come,
                            which implies that strong recent rental demand for Single Family Rental ("SFR")
                            will likely remain robust, driving continued rent growth of around 5% in both 2021
                            and 2022.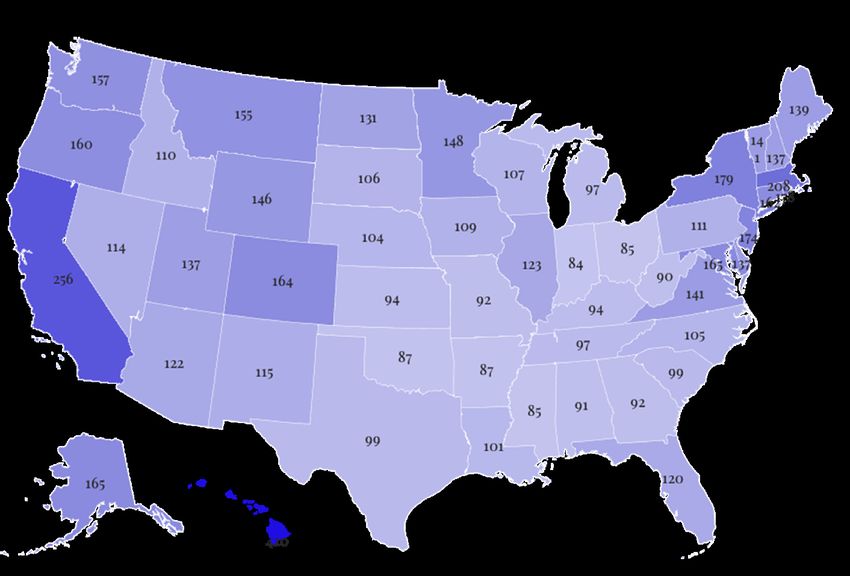
2021 U.S. Housing Market Outlook : 2

Implications for SFR and Mortgages
• SFR and mortgage credit have always offered attractive “yield alternatives,”
but we feel these features will prove ever more attractive in a fixed income
environment where low policy rates, quantitative easing, and now “Corporate QE”
have extracted much of the yields available from liquid securities.
• Since illiquidity and complexity are barriers to entry for capital, these asset
classes have arguably been subject to less crowding than competing sources of
yield.
• Moreover, due to the adoption of new technologies that have increased the scope
of institutional ownership, the SFR market is arguably ripe for consolidation, thus
increasing its ability to absorb institutional capital inflows without undermining
returns.
• Proper fixed income exposure is available via the mortgage credit side of
residential housing markets, and these assets, too, should benefit from the robust
housing market envisioned by our outlook.
• In particular, while mortgage forbearance policies have pushed serious
delinquencies to impressively high levels, homeowners are equity-rich, and their
debt service ratios are at 40-year lows – a social dividend on the re-regulation and
conservative lending policies of the past decade.
• Thus, in dramatic contrast to the devastating experience of the Global Financial
Crisis ("GFC"), most of these seriously delinquent mortgages have high potential to
end with favorable economic outcomes for homeowners and investors alike.

Pretium Forecasts for 2021 and 2022

			                                                        2019       2020    Q1         2021E       2022E

Macro                          Real GDP (YoY%)		           2.3%       -2.4%   4.5%*      6.0%        2.7%
                               Fed Funds		                 1.6%       0.1%    0.1%       0.1%        0.1%
                               10Y Treasury Yield		        1.9%       0.9%    1.5%       1.3%        2.4%
                               Mortgage Rate - 30 Yr       3.7%       2.7%    3.0%       3.3%        3.5%
                               PCE Inflation		             1.6%       1.3%    1.5%       2.1%        2.0%

Housing/SFR                    Home Price
                               Appreciation (YoY%)         4.0%       9.2%    0.9%       7.0%        4.0%
                               John Burns SFR Index        4.3%       3.7%    3.7%       5.0%        5.0%
                               Single Family Starts        777        877     973        973         1,022
                               (SAAR in mil.)

*Bloomberg consensus mean, %QoQ SAAR

Source: Pretium internal using Bloomberg – data through January 31, 2021
2021 U.S. Housing Market Outlook : 3

As We Entered 2020
                             Housing Markets Were the Top Macro
                             Surprise of 2020
                             The pandemic performance of housing markets has been truly remarkable. Despite
                             a steep recession and the severe economic disruptions caused by the COVID-19
                             pandemic, the CoreLogic home price index rose 9.2% in 2020, its biggest year-on-
      Mortgage rates         year increase since the rebound from the Global Financial Crisis in 2014 (Exhibit 1).
     -65 bps                 We expect home prices to grow at 7% and 4% for 2021 and 2022, respectively, driven
                             by chronic shortage of supply coupled with acceleration in deurbanization.

                             Exhibit 1: CoreLogic Home Price Rose +9% YoY

                             CoreLogic Home Price Index - Actual and Forecast
    Existing home sales

+10.4% YoY

                             Source: Pretium internal using CoreLogic HPI, data through December 31, 2020
While the need to shelter
in place obviously fueled
housing demand, the          Indeed, the housing market is arguably one of the most remarkable
quick and aggressive         macroeconomic stories of 2020. Contrary to the worst initial fears of many
policy response of the Fed   economists, housing turned out to be a refuge from the storm. While the need to
played a big role too.       shelter in place obviously fueled housing demand, the quick and aggressive policy
                             response of the Fed played a big role, too. Indeed, even before the onset of the
                             pandemic, housing activity was already beginning to increase at a rapid clip, with
                             30y fixed-rate mortgage rates dropping 65bps and existing home sales rising a
                             robust 10.4% YoY as we entered 2020 as shown in Exhibit 2 and 3.1 The most likely
                             explanation for this surge is the Fed easing that had begun during the summer of
                             2019.

                             1 Existing home sales from Moody’s Analytics, National Association of Realtors and Mortgage rates from FRED, data through Dec. 31, 2020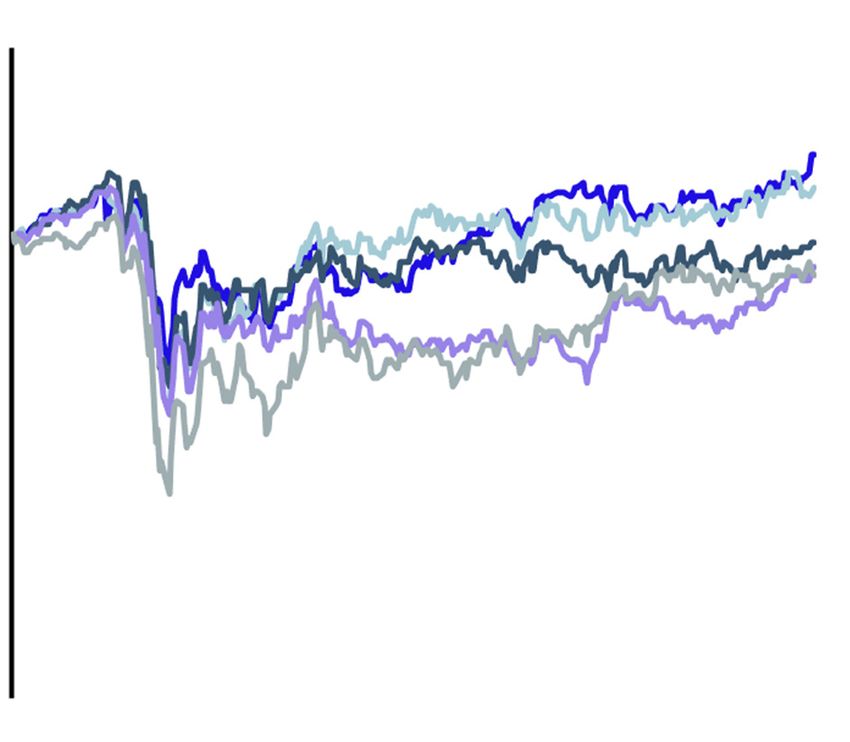
2021 U.S. Housing Market Outlook : 4

Exhibit 2: Mortgage Rates Are at                                              Exhibit 3: Annual Home Sales Rose
Multi-Decade Lows                                                             18% in 2020 Despite H1 Collapse
Percent 30-Year Fixed Mortgage Rate in U.S		                                 Existing Home Sales (SAAR, %YoY)

       20%                                                                             20%

        15%                                                                            15%

       10%                                                                             10%

         5%                                                                             5%

        0%                                                                              0%

              2001     2006      2012      2016      2021                                      2010		2015		2020

Source: Existing home sales from Moody’s Analytics, National Association of Realtors and Mortgage rates from FRED, data through Dec. 31, 2020

                                        That said, the biggest development within the housing market in 2020 was clearly
                                        the emergence of dramatic preference shifts induced by the pandemic. In addition
                                        to working from home (WFH), household members were also schooling, dining,
For big urban cities                    and doing pretty much everything else from home. This sharply increased the value
like New York and San                   of “home amenities” ranging from internet services and home appliances to home
Francisco, this meant that              renovations and simple square footage. Meanwhile, as visits to offices, restaurants
rents and home prices                   and other such city services collapsed, so too did the value of proximity to such
in the urban centers fell,              “urban amenities”. For big urban cities like New York and San Francisco, this meant
while in the suburbs they               that rents and home prices in the urban centers fell, while in the suburbs they rose
rose.                                   (see also Exhibit 7). But for most cities, especially cities with less well-defined urban
                                        cores, the most visible consequence was simply higher home prices everywhere;
                                        households just wanted more. This is evidenced in Exhibit 4 which shows home
                                        price appreciation at state level compared to zip code level.

                                        If housing demand in 2020 was a bumper sticker, it might read: Distance mattered
                                        less, space mattered more. While some observers have described the flight to the
                                        suburbs and rural areas as motivated by health concerns (or “density aversion”),
                                        we suspect these preference shifts are motivated more by space and distance –
                                        an increased demand for space to accommodate “everything from home”, and a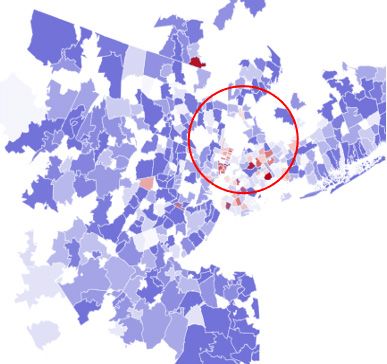
2021 U.S. Housing Market Outlook : 5

                                       decreased demand for proximity to central cities given the dramatic collapse of
                                       office commutes and the widespread shut-down of other urban amenities. Taken
                                       together, these two preference shifts naturally re-directed housing demand to
                                       locations with a lower cost of housing per square foot.

Exhibit 4: Urban to Suburban Rotation is Observable in Home Price Growth

YoY Percent Change in CoreLogic Home Price Index 		                               Atlanta Metro Area

Greater Bay Area						Greater New York City

Source: Pretium internal using CoreLogic HPI, Zip code level, data through Dec. 31, 2020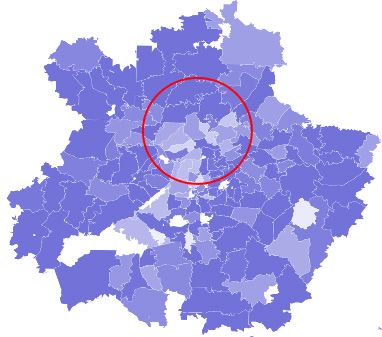
2021 U.S. Housing Market Outlook : 6

                            Another big development for housing markets in 2020 was the disappearance of
                            sellers. Survey evidence suggests that a large fraction of would-be home sellers
                            decided to hunker down in place for the duration of the pandemic, delaying
                            the decision to put their homes on the market (Exhibit 5). When asked in annual
Survey evidence suggests    surveys by the National Association of Realtors about their motives for selling,
that a large fraction       two of the top reasons cited by households 55 and older are “Desire to be closer to
would-be home sellers       family, friends and relatives” and “desire for a smaller home”.2 Heads of households
decided to hunker down      aged 55 and older also tend to be net sellers of homes.3 Not surprisingly then, the
in place for the duration   May 2020 report of the Michigan Survey of Consumers showed the largest-ever
of the pandemic, delaying   3-month jump in the number of households saying that “now is a bad time to sell”
the decision to put their   a home, and despite a partial recovery, selling sentiment has remained well-below
homes on the market         pre-COVID levels as the pandemic has extended.4 That negative selling sentiment
(Exhibit 5).                persists despite the recent increases in home prices and underscores the strong
                            aversion to selling among existing homeowners.

                            Exhibit 5: Active Listings Are Being Delisted as Virus Continues to
                            Spread

                            Percent Active Listings Being Delisted

                                 2.5%

                                2.o%

                                 1.5%

                                0.5%

                               0.0%
                                               1     2           3         4          5          6       7   8   9        10         11         12

                                                                                                 Month

                            Source: Pretium internal using Redfin data, Percent Active Listings Delisted, data through Jan. 31, 2020

                            2 See Exhibit 11

                            3 Pretium internal using NAR survey, data through June 2020

                            4 Surveys of Consumers, University of Michigan, data through January 2021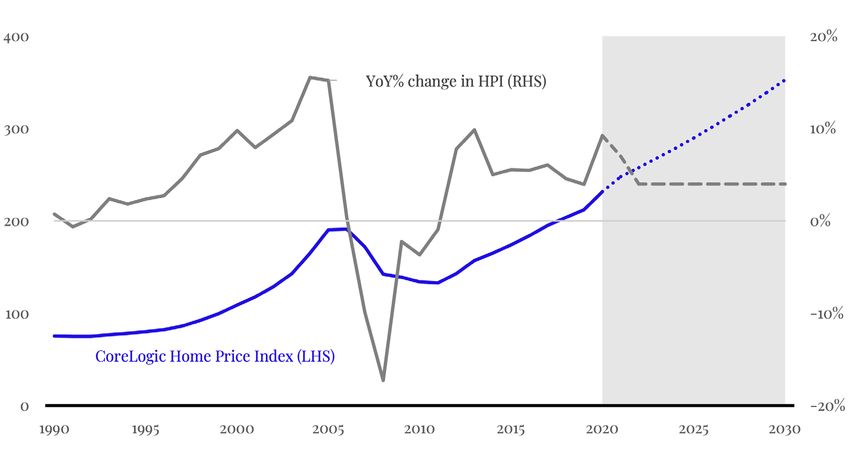
2021 U.S. Housing Market Outlook : 7

                              We expect housing demand to remain strong in 2021, driving HPA to 7%, although
                              we expect a substantial cooling in the second half of the year. This cooling reflects
                              our expectation that an easing of the pandemic restrictions will boost the supply
                              for-sale inventories as pent-up selling motives are released into the market.
While tighter lending         This baseline scenario assumes that new case rates for COVID-19 will (hopefully)
standards and zoning          continue to fall and as vaccinations rise.
restrictions make it less
likely that we are entering   The primary risk to our baseline scenario is the possibility that new, more
into another long cycle,      contagious strains of the virus prove harder to contain (as many epidemiologists
the boom in new-home          warn). This “extended pandemic” scenario would likely keep would-be sellers
construction in the           on the sidelines for longer while doing little to discourage buyers, thus fueling
midst of the pandemic is      another year of strong HPA comparable to 2020. But this scenario would only delay
noteworthy.                   the eventual return of sellers, hence the risk to HPA is more a matter of “when”
                              than “if”. For 2021, however, it is the reason we think the risks to HPA are skewed
                              somewhat to the upside of 7%.

                              We also expect a robust increase in the pace of new single family home
                              construction in 2021. Housing starts for privately owned homes grew 12% in
                              2020 to reach 1.0 million, the highest level since the end of the Global Financial
                              Crisis (GFC). Even so, this barely matches the weakest years during the extended
                              construction boom that ran from 1992-2007, a cycle that peaked in 2005 at 1.7
                              million single family home starts.5 While tighter lending standards and zoning
                              restrictions make it less likely that we are entering into another long cycle, the
                              boom in new-home construction in the midst of the pandemic is noteworthy. With
                              many homebuilders reporting that they are running near full capacity and demand
                              conditions still strong, we forecast new construction activity will remain robust at
                              around 11% in 2021 (Exhibit 6).

                              5 Bloomberg Weighted Average Consensus, Housing Starts, retrieved January 31, 2021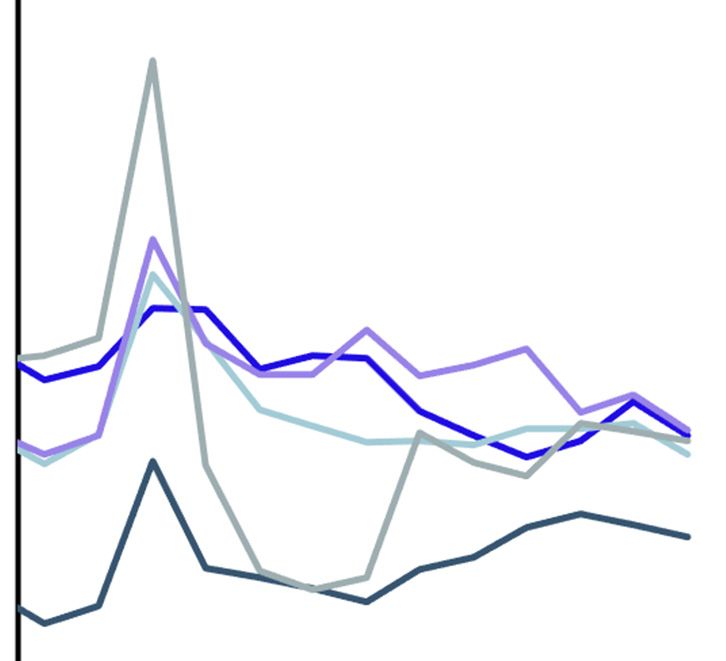
2021 U.S. Housing Market Outlook : 8

Exhibit 6: Single-Family Starts Should Outpace Multi-Family From
Here

Starts (SAAR, millions)

                                                                                                                             Forecast

Source: Pretium internal using Bloomberg Weighted Average Consensus, Housing Starts, retrieved January 31,

20216

Will pandemic preferences persist? The pandemic era has seen housing demand
shift from urban to rural, from cities to suburbs, and from multi-family apartment
buildings to single-family homes. But to what extent will these shifts persist in 2021
and beyond? While we’re clearly going to see some reversion back to pre-pandemic
norms, our view is that many of these shifts will prove surprisingly persistent.
For one, working from home has been a learning experience. Many workers have
learned that they enjoy working from home, and many employers and have learned
that this can be just as productive (and perhaps less costly) than providing office
space. In addition, while restaurants and other “pandemic exposed” businesses
will obviously reopen, those that have gone out of business obviously will not. The
start-up of new businesses will take time, and until that happens, the amenity
value of urban living will be diminished. Finally, for households that fled the city,
life in the suburbs will likely become an acquired taste. For all these reasons, we
expect the pandemic will cast a long shadow on housing demand in the post-
pandemic economy.
6 Pretium internal using Bloomberg Weighted Average Consensus, Housing Starts, retrieved January 31, 2021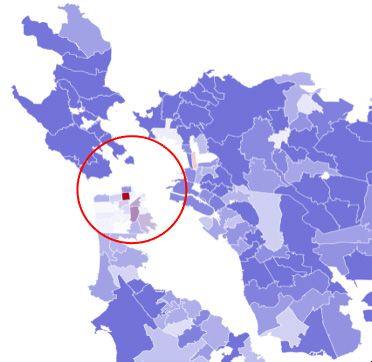
2021 U.S. Housing Market Outlook : 9

                            Exhibit 7: Rent Growth in the Suburbs Outpaced Downtown

                            YoY Rent Growth in Suburban Minus Urban Area

                                      New York, NY
                                        Seattle, WA
                               San Francisco, CA
                                        Atlanta, GA
                                 Washington, DC
                                      Memphis, TN
                                      Riverside, CA
                                    Pittsburgh, PA
                                          Austin, TX
                                       Houston, TX
                                        Chicago, IL
                                 Minneapolis, MN
                                          Dallas, TX
                                           National                                                   3.7%
                                  Los Angeles, CA
                                 Sacramento, CA
                                    Columbus, OH
                                       Phoenix, AZ
                            Core Pretium Markets                                               2.2%
                                        Denver, CO
                                     Las Vegas, NV
                                  San Antonio, TX
                                          Miami, FL                                            Suburban rents grew
                                 Kansas City, MO                                               faster than urban rents
                                      Portland, OR
                                         Tampa, FL
                                      Nashville, TN
                                     San Diego, CA
                                        Raleigh, NC
                                     Richmond, VA
                                     Charlotte, NC
                                    Cleveland, OH
                                       Orlando, FL
                                 Philadelphia, PA
                                         Detroit, MI
                                   Jacksonville, FL    Urban rents grew faster
                                    Cincinnati, OH     than suburban rents
                                      Louisville, KY
                                  Indianapolis, IN
                               Virginia Beach, VA
                                    Baltimore, MD
                                      St. Louis, MO
                                       San Jose, CA

                                          15%           10%          -5%          0%            5%               10%             15%
Single-family homes
have been failing to keep   Source: Pretium internal using Zillow data, www.zillow.com/research/2020-urban-suburban-report-28802, data
pace with trend growth      through Feb. 4, 2021
demand. Meanwhile,
household demand for
single-family homes has     Many long-running tailwinds for housing should persist past the pandemic.
been growing robustly       Throughout the entirety of the recovery from the GFC, construction of single-
as millennials are now      family homes in this expansion has been failing to keep pace with trend growth
starting families and       demand. Meanwhile, household demand for single family homes has been growing
choosing to move to the     robustly as millennials are now starting families and choosing to move to the
suburbs.                    suburbs. The construction of single family homes has been steadily rising in recent
2021 U.S. Housing Market Outlook : 10
years and will further close the gap in 2021, but this long-running deficit remains
large and will likely take years to make up.
For investors in single family rentals (SFR), migration to both the sunbelt and
the suburbs should provide strong tailwinds. The pre-crisis demand for sunbelt
suburbs – whether owned or rented – was already strong, and all signs suggest
that these preferences have only strengthened as a result of the pandemic (Exhibit
8). Moreover, not all households who wish to move to the suburbs necessarily wish
to own, nor do they necessarily have the ability to buy. Some find it economically
preferable to rent. This may describe households who were previously renting in
an urban multi-family setting and now wish to rent in the suburbs. But it may also
describe households who prefer to layoff HPA risk on landlords.
Exhibit 8: Population Growth is Persistent and Skewed to Sunbelt Suburbs
Population Growth Regression YoY Population Growth
Population Growth from 2000 to 2010
Population Growth from 2000 to 2010
Source: Pretium internal using data from Brookings Institute for Suburbs and primary cities and Moody’s Analytics, data as of Feb. 2021
For investors in residential mortgages, these migration trends also imply a
reduction in mortgage credit risk. While the pandemic has caused enormous
economic hardship for many homeowners, the implications for mortgage credit
has been greatly mitigated by record levels of fiscal support as well as by robust
house price appreciation. And while mortgage forbearance programs, eviction2021 U.S. Housing Market Outlook : 11 moratoriums and income support have all provided more time and resources to mitigate hardships, homeowners have also been able to lean on the positive home equity, helped not only by favorable financing conditions but also by robust appreciation of home prices (Exhibit 9). Even for households who find they can no longer afford their homes, the fact that housing market conditions remain so favorable is a win-win for both these homeowners and their mortgage lenders. Exhibit 9: Homeowners are Equity Rich Tappable Equity in Billions Source: Pretium internal using Black Knight/McDash data through June 2020 Pandemics and Housing Markets: Lessons from 2020 The onset of the pandemic profoundly disrupted the normal seasonal pattern of home sales. During the first few months, de-listings rose and new listings fell as would-be sellers withdrew from the market (Exhibit 10). This was accompanied by a sharp decline in home sales as buyers initially withdrew, too, but not for long. As spring progressed into summer, buyers returned to the market en force, pushing the spring selling season into summer. Would-be sellers, however, stayed on the sideline, with the result being that inventories of homes for sale were quickly depleted to record-low levels.
2021 U.S. Housing Market Outlook : 12

Exhibit 10: Active Listings Plunged As Virus Lockdowns Took Hold

YoY Change in Active Listings

Source: Pretium internal using data from Redfin, data as of Dec. 2020

Potential sellers remained on the sidelines throughout the fall and into the new
year. The net sellers of existing homes are proto-typically empty nesters who
frequently cite “a desire to be closer to family and friends” along with “downsizing”
as top motives for moving (Exhibit 11). A modest recovery of listing activity over the
summer notwithstanding, many such homeowners (typically aged 55 and older)
were evidently in less of a hurry to sell, content to ride out the pandemic in their
current homes. While health concerns and the complications of showing a home
during a pandemic likely played some role in this, we think it is more likely that
the pandemic undermined their underlying selling motives. Restrictions on social
interaction obviously diminished the value of being close to family and friends,
and the convenience of being able to convert extra bedrooms into home office
presumably diminished the appeal of downsizing. Even under more favorable
selling conditions, surveys reveal that this cohort of net sellers is usually not in any
particular hurry to sell, all of which makes it easier to understand the collapse in
listing activity.
2021 U.S. Housing Market Outlook : 13

Exhibit 11: COVID-19 Undermined Selling Motives for Ages 55+

    Reason for Move		                  All Sellers		                     Net Buyers			                Net Sellers
                                                                22-29     30-39   40-54       55-64       65-73        74-94

Want to move closer to                     16%		                13%        5%     5%		         19%         28%          33%
   friends & family

    Home is too small                       13%                 23%        28%    21%			       5%           5%            3%

     Job relocation 		                     11%                  22%        19%    19%		        9%           2%           N/A

   Neighborhood has                        10%                      8%     10%    12%		        10%         10%            6%
  become less desirable

    Change in family                        10%                 22%        14%    12%			       10%          7%            5%
situation (e.g. marriage,
    birth of child, etc.)

    Home is too large                       9%                  N/A        3%     6%			        12%          10%          17%

    Want to move closer                     5%                      3%     7%     8%			        5%            1%          N/A
      to current job

Upkeep of home difficult                    4%                  N/A        2%     1%			        4%            5%          12%
 due to health/financial
       limitations

    Schools became less                     1%                  N/A        2%     2%			       N/A           N/A          N/A
         desirable

   Cannot afford the                        1%                  N/A        1%     1%			        2%            2%          N/A
  mortgage & expenses
    of owning home

            Other                           14%                     5%     9%     12%			      16%           15%           17%

Source: Pretium internal using NAR survey, data through June 2020

                                      As the pandemic surged again in the fall, the pattern from spring was repeated.
                                      Again, new listings fell and delistings rose, but this time demand held firm. In fact,
                                      demand was strong enough to push sales volumes to levels that more than made
                                      up for the sluggish spring, which combined with tight supply was enough to push
                                      home prices to their fastest growth rates since the post-GFC rebound in 2013
                                      (Exhibit 12).
2021 U.S. Housing Market Outlook : 14
Exhibit 12: Active Listings Rose in Urban Centers
YoY Percent Change in Active Listings
New York Metro Area San Francisco Metro Area
Source: Pretium internal using Active Listings from Redfin.com, Zip code level – data through November 2020
Another distortion caused by the pandemic was to turn inter-metro patterns of
price appreciation “inside out”. Under normal market conditions, local economic
growth tends to fuel increases for apartment rents or home prices that are
Single-family homes in
strongest for housing units located closest to city centers. But as it is now well-
the suburbs have risen
known, the pandemic caused a dramatic shift in preference for the amenity values
robustly, while rents
of suburbs over city centers (space mattered more, distance mattered less). As
in large multi-family
a result, “heat maps” for large cities with dense city centers produced distinct
buildings closer to urban
“red donuts with purple holes”, with purple indicating listing increases and red
centers have fallen (see
indicating declines. In cities like New York and Atlanta, for example, these shifts
Exhibit 13).
have revealed even higher rates of inventory drawdowns for suburbs located
furthest from the center. This net demand shift was similarly visible in rental
markets; rents for single-family homes in the suburbs have risen robustly while
rents in large multi-family buildings closer to urban centers have fallen (see Exhibit
13).2021 U.S. Housing Market Outlook : 15
Exhibit 13: Rents Fell in Urban Centers, But Rose in Suburbs
YoY Percent Change in Rent
New York Metro Area Atlanta Metro Area
Source: Pretium internal using ZORI from Zillow.com, Zip code level – data through December 2020
Robust HPA and Rent Growth Should
Cool as Pandemic Fades
How will housing markets evolve from here? Over the near-term horizon (6-12
months), we expect to see strong housing demand persist through at least the
summer of 2021. We also expect to see continued “patience” on the part of sellers,
and hence a sustained demand-supply imbalance for at least as long as housing
market behaviors are being shaped by the social distancing restrictions imposed
by the pandemic. This market imbalance could easily sustain double-digit price
Prices Rising & Cooling growth through the first half of the year.
But pandemic restrictions appear poised to relax, after which we think HPA could
quickly cool to a year-on-year pace of around 7%. This forecast envisions home
prices rising at an annualized average pace of around 10% during H1 before cooling
to a pace of around 4% in H2. A deceleration obviously envisions a meaningful
H1 H2
convergence of the demand-supply imbalance; we expect such adjustments to
10% 4% come from both cooling demand and surging supply.2021 U.S. Housing Market Outlook : 16 On the demand side of the market, we expect the blistering 18.7% surge in new home sales in 2020 to slow in 2021.7 Our assumption is that new home sales in 2020 were driven by an elevated sense of urgency that will (hopefully) be missing by the second half of 2021. Mortgage origination data show that most of the increased sales in 2020 went to first-time homebuyers and purchasers of second homes. These buyers had obviously become impatient since they managed to drive new home sales to their largest annual increase of the post-GFC period despite a 9.2% increase in home prices and a 52% decrease in the inventory of homes for sale (see Exhibit 14). But the composition of buyers also suggests that the pandemic encouraged many households to “pull forward” the timing of purchases that households had previously planned to make in the future. As such, when we look ahead to the second half of 2021, we expect the relaxation of pandemic restrictions will be met with a modest cooling of housing demand relative to 2020. That said, we believe demand will still remain firm since the preference shifts induced by WFH and other norms will likely persist for years. Exhibit 14: Inventories Are Down Sharply for Single Family Homes YoY Percent Change in Inventory for Sale Source: Pretium internal using Inventory from Redfin.com – data through February 2021 Meanwhile, the easing of pandemic restrictions should also release pent-up selling back into the market. Despite better prices and higher sales volumes in 2020, 7 U.S. Census Bureau and the U.S. Department of Housing and Urban Development, New Home Sales, as of February 2021
2021 U.S. Housing Market Outlook : 17

                          existing homeowners were largely unresponsive to these incentives and generally
                          appeared to disengage from the housing market. As a result, the inventory of
                          existing single-family homes for sale was drawn down by the surge in sales.
                          Indeed, this decline in the inventory of homes for sale has continued into the first
                          few months of 2021 and will likely persist until the pandemic restrictions begin to
                          ease.

Our baseline scenario
envisions a material      Our baseline scenario envisions a material easing of pandemic conditions by June.
easing of pandemic        While the difficulty of predicting the pandemic’s path to date warrants forecaster
conditions by June, but   humility, the rapidly falling case rates during the first two months of 2021 likely
there are risks.          bode well for the next few months. In particular, the falling rates suggest that the
                          combined effects of mask wearing and social distancing measures are reducing
                          transmission rates. The rising fraction of the vaccinated public will soon begin
                          to help, too. That said, there are risks in both directions. On the one hand, some
                          scientists have recently pointed to rapidly falling case rates to suggest we may
                          be closer to herd immunity than is generally believed.88On the other hand, the
                          emergence of new strains that are more contagious may threaten to delay the
                          point of herd immunity. As such, there is considerable uncertainty around our
                          expectation of a second-half cooling of HPA, implying a corresponding amount of
                          upside risk to our expectation that home prices grow 7% in 2021.

                          Long-Run Housing Fundamentals Remain
                          Robust
                          The longer-term outlook for housing remains robust, but risks remain. Relative
                          to our pre-pandemic outlook, we think the longer-term outlook for both price
                          appreciation and rent growth of single family homes has improved. In particular,
                          we think likely that post-pandemic preference shifts will more than offset the
                          expected future declines in affordability metrics (more on that below), which will
                          only add to the fundamental support implied by the long-standing dearth of new
                          construction relative to the organic growth of new household formation.

                          To be fair, there are numerous economic headwinds to be overcome. For one,
                          the “K-shaped” nature of the recovery has caused disproportionate damage to
                          small businesses and workers in lower-income service sector jobs. Even today, 10
                          million jobs are still missing9, robust recovery notwithstanding. In addition, the
                          aggressiveness of fiscal and monetary policy implies a payback period when the

                          8 https://www.businessinsider.com/johns-hopkins-professor-herd-immunity-us-april-2021-2

                          9 Non-farm payroll, U.S. Census, through March 2021
2021 U.S. Housing Market Outlook : 18
fading of fiscal stimulus and removal of monetary accommodation will effectively
feel like new headwinds for growth. While these policy shifts will not likely
appear before sometime in 2022, they will nonetheless loom over the outlook for
sentiment, especially if the strength of the recovery happens to disappoint.
But there are new tailwinds, too. For one, to the extent that firms and workers have
discovered WFH arrangements are more feasible or desirable than was previously
known, the preference for suburban over urban will likely persist. To repeat the
bumper sticker, distance matters less, and space matters more. And while much
of this boost is obviously transitory, recent experience has demonstrated that
for some jobs, working from home is just as productive as working in the office.
In addition, while the ending of the pandemic will obviously allow small service-
oriented businesses to reopen, many have gone out of business, and the growth
of new businesses will take time. Finally, for many urban transplants, life in the
suburbs will likely become an acquired taste. For all these reasons, we expect that
suburban preferences will persist past the pandemic.
Motives for Moving
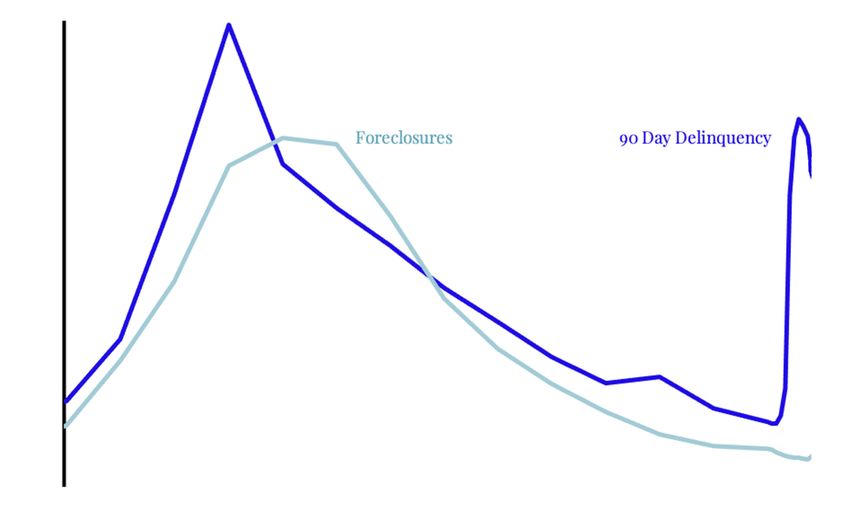
Second, any shifts in post-pandemic migration trends will likely benefit the Sun
Belt. Consistent with our view that larger numbers of households will be choosing
WFH arrangements, we expect that such households will also favor housing options
offering more square feet per dollar. This implies not only a shift from city centers
to suburbs, but also a higher propensity to migrate from high-cost coastal cities to
Employment
low-cost cities. In a survey asking households who moved 50 miles or more about
43% their motives for moving, it’s not surprising that 43% answered “employment”. But
VS perhaps more surprisingly, 25% cited “housing-relating” concerns, and when asked
to provide details, a desire for cheaper and better ranked as the top motives.1010In
short, roughly a quarter of long-distance migration appears to be heavily
influenced by a desire for a cheaper quality of life. If the pandemic experience
causes households to put more value on their quality of life, as we expect, then this
shift will likely provide yet another boost to the pre-pandemic migration trends
Housing-relating concerns
that were already boosting population in the Sun Belt relative to the rest of the US.
25%
10 U.S. Census Bureau, Housing Pulse Survey, data through February 20212021 U.S. Housing Market Outlook : 19
Exhibit 15: Price per Square Foot is Lower in Sun Belt Markets
Price per Square Feet by State
PPSF in $
400
200
0
Source: Pretium internal using Price per Square Foot by State from Census 2019 ACS – data through December
2019
Finally, the impressive resilience of household balance sheets during this
pandemic underscores the improved quality of mortgage lending standards over
the past decade. This resilience bodes well for the organic sustainability of housing
demand. In contrast to the credit-fueled bubble in housing demand leading up
to the Global Financial Crisis, demand growth has been fully organic. Indeed, the
ratio of mortgage debt to GDP prior to the pandemic has fallen steadily throughout
this expansion. While this trend has been interrupted by the recent surge in
refinancing activity, there is little doubt that home price appreciation over the
course of this expansion has been more “supply driven” than “demand driven”.
Thus, while home prices by some metrics may look moderately over-valued, there
is far less downside risk in housing markets today. In contrast to “sudden stops” of
demand caused by abrupt changes in financial conditions, there really is no sense
in which the market can be disrupted by a “sudden surge” of supply.2021 U.S. Housing Market Outlook : 20 Implications for Investors in Single-Family Rentals and Mortgage Credit For investors in the single family rental market, the onset of the COVID-19 pandemic posed obvious headwinds. In addition to the fact that many tenants were struggling with job loss and other financial hardships, they were also taking advantage of eviction moratoriums to mitigate those difficulties. With the unemployment rate spiking to 14.8% back in April 202011, the prospects for SFR markets (like residential real estate more broadly) were looking challenging, to say the least. As it turns out, the SFR sector in 2020 was a “A Good Place to Be”, as Greenstreet Research put it in a recent report. According to this report, SFR asking rents were up over 7% YoY in 2020, while the national apartment average was down over 1%.12 Despite a record jump in the national unemployment rate, the single family rental sector has weathered the storm with relative ease. The urban-to-suburban demand shifts described above were obviously beneficial since most of the SFR housing stock resides in the suburbs. In addition, because SFR was suddenly so sought after, existing tenants were motivated to prioritize rent payments. And finally, the middle-income (and often two-income) families that tend to gravitate toward the SFR market may have fared better during the pandemic than lower- income households. In particular, unemployment data by occupation suggests that the pandemic fell harder on low-wage jobs in the service industries, and such households tend to rent lower-cost apartments.13 But even here, survey evidence collected by the US Census suggests that the speed and scale of the fiscal response played an important role in helping even low-income tenants remain current on their rent.14 Exhibit 16 shows Green Streets expectations for Public and Private REITs. 11 U.S. Bureau of Labor Statistics, Unemployment rate, data through December 2020 12 Residential Sector Update”, December 7, 2020 13 Labor Force Statistics from the Current Population Survey, https://www.bls.gov/web/empsit/cpseea30.htm 14 https://www.census.gov/programs-surveys/household-pulse-survey/data.html
2021 U.S. Housing Market Outlook : 21

Exhibit 16: Risk Adj. Returns Expected to Be +40bps for Private REITs vs. Public

Annualized Risk Adjusted Return			                                    Risk Adj. Return Difference in bps – Private minus Public

                             0%                  5%                  10%                          -100    -50       0           50          100

Source: Pretium internal using Green Street Monthly REIT report – data through January 2021

                                      We are bullish on the longer-run prospects for the SFR sector. For one, we suspect
                                      that the COVID-19 pandemic will come to be seen as a seminal event for SFR. Its
Diversified portfolios
                                      impressive performance during the pandemic demonstrated not only its maturity
exposed to a mix of MFR
                                      and resiliency, but also its diversification value. While multi-family was exposed to
and SFR realized lower
                                      falling demand for urban centers and smaller floor plans, SFR was on the receiving
volatility than portfolios
                                      end of this demand shift. Consequently, diversified portfolios exposed to a mix of
holding MFR alone.
                                      MFR and SFR realized lower volatility than portfolios holding MFR alone (Exhibit
                                      17). More generally, the single-family rental stock is an enormous asset class in
                                      which we believe institutional investors have long been under-invested.
2021 U.S. Housing Market Outlook : 22
Exhibit 17: SFR Provided Diversification During Pandemic
Daily Equity Returns Indexed to 100 as of Jan 1, 2020 Property Sector Implied Cap Rates
140% 8%
120%
7%
100%
6%
80%
60% 5%
40%
4%
20%
0% 3%
Jan 2020 Apr 2020 Jul 2020 Oct 2020 Jan 2021 Feb 2020 May 2020 August 2020 Nov 2020 Feb 2021
Source: Pretium internal using Green Street Monthly REIT report – data through January 2021
Second, the pandemic has also ushered in version 2.0 of the “new normal” for
yield investors. In contrast to the original “new normal”, however, the new version
Within the universe
has come with an additional twist, namely, “Corporate QE”. In our view, the Fed’s
of “yield alternatives”,
recent expansion of Quantitative Easing ("QE") to include not just Treasuries and
we think the cap rates
MBS but also, for the first time in history, corporate bonds, has the potential to
in the SFR sector are
become yet another seminal event. For fixed income investors who have come
particularly well-
to rely on corporate bonds for incremental yields, the birth of “Corporate QE”
positioned to withstand
threatens to squeeze yields to untenable levels. Within the universe of “yield
inflows of institutional
alternatives”, we think the cap rates in the SFR sector are particularly well-
capital.
positioned to withstand inflows of institutional capital. Whereas other sectors
in real estate already have large institutional ownership shares, SFR is primed
for increased institutionalization. New technologies have greatly increased the
operational efficiency of SFR assets, thus increasing the scope of institutional
ownership versus more traditional “mom and pop” owners. This implies the
possibility of a long runway over which SFR can offer highly competitive cap rates
while also absorb significant inflows of new capital without suffering an undue
compression of rental yields.2021 U.S. Housing Market Outlook : 23
In addition to SFR, residential mortgages – the credit counterpart to SFR equity
– offer yet another way to generate yield from exposure to housing. Under the
outlook for housing markets that we have laid out above, mortgage credit is
positioned to perform well. Forbearance and foreclosure moratoriums have
created a situation that is basically without precedent (Exhibit 18). On the one hand,
housing markets have been unusually robust over the past year, and there is no
reason to think that price growth won’t remain stable and rising for years to come.
On the other hand, over 12 months of mortgage forbearance has created 2.5 million
seriously delinquent mortgages that will very likely need to be sold and modified.15
Exhibit 18: Mortgage Forbearance is Concentrated in Weakest Loans
Forbearance Rate Total Unpaid Principal Balance in Bil.
14% 450
400
12%
350
10%
300
8% 250
200
6%
150
4%
100
2% 50
0
0%
Apr 2020 Jul 2020 Oct 2020 Jan 2021 Apr 2020 Jul 2020 Oct 2020 Jan 2021
Source: Pretium internal using Black Knight data – data through February 2021
15 Black Knight, Monthly Mortgage Monitor, data through January 31, 20212021 U.S. Housing Market Outlook : 24
These mortgage market conditions are historically unprecedented. Except for GFC,
such large increases in the “distress rates” for mortgages have no precedent in the
modern era. But in sharp contrast to the boom of the early 2000s, mortgage debt
over the past decade has been falling as a fraction of income. In fact, according to
data from the Federal Reserve Board, mortgage service payments as a percentage
of personal disposable income have fallen to their lowest levels in over 40 years.16
More households own positive equity in their homes today than at any time since
the end of the GFC, and homeowner balance sheets are as strong as they’ve been in
decades (Exhibit 19).
Service payments as a
percentage of personal Exhibit 19: Declining Mortgage Rates Have Improved Affordability
disposable income have
fallen to their lowest Mortgage Payments as Percent of Disposable Personal Income
levels in over 40 years.
8%
7%
6%
LT Average (since 1980)
5%
4%
3%
1980 1985 1990 1995 2000 2010 2005 2015 2020
Source: Board of Governors of the Federal Reserve System
That’s what makes the current market so unusual. Despite the general robust good
health of both housing markets and borrower balance sheets, mortgage distress is
at levels approaching those of the GFC. For most of these mortgages, substantial
amounts of home equity available can be accessed via restructuring, making it
possible for homeowners to get current on their mortgage payments and remain
in their homes. In our view, this will likely add to the steady growth in the supply of
attractive, risk-adjusted yields available in mortgage credit.
16 https://www.federalreserve.gov/releases/housedebt/default.htm2021 U.S. Housing Market Outlook : 25
Exhibit 20: Delinquency Rates Have Spiked, But Foreclosures
Remain Low
90 Day Delinquency and Foreclosure Counts
3.0
2.5
2.0
1.5
1.0
0.5
0.0
2007 2009 2011 2013 2015 2017 2019
Source: Pretium internal forecasts using Delinquency rates and foreclosure data from Mortgage Bankers
Association– through December 20202021 U.S. Housing Market Outlook : 26 Conclusion What a strange 12 months it has been for housing markets. Prior to the onset of the COVID-19 pandemic, housing markets were already in the midst of a modest boom. At this time last year (in February), monthly home prices were rising at a 5.5% annualized rate and existing home sales had risen to a 5.7 million SAAR.17 Then the pandemic washed ashore and what followed has been a remarkable year of volatility in housing markets, yet those markets end the year with strong momentum. As we have argued here, we believe the recent momentum in housing markets will most likely extend through at least the first half of 2021, if not longer. We expect this mini-boom will begin to decelerate as the “pandemic panic” for home buying begins to normalize. We may even see a modest dip in demand as we discover how much of the surge in 2020 sales was partly a pull-forward of future sales. However, we think with GDP expected to grow 6% and mortgage rates unlikely to rise much above 3%, housing demand seems very firmly on track. A bigger question, in our view, is how much pent-up supply from natural net sellers will have accumulated by the time we’ve effectively exited the pandemic. The collapse of inventories for sale suggests that many potential sellers did, in fact, decide to hold pat. There’s no guarantee, of course, that these households haven’t decided to remain in place indefinitely. In this scenario, our HPA forecast will likely prove to have been too timid. We think it’s more likely that these households will be looking to turn the page on the pandemic and begin their post-pandemic chapter by listing their existing homes. In this scenario – our baseline – we expect the boost to inventories will be enough to cool HPA to around 7% in 2021. Either way, we think it sets up an exciting year for residential housing assets. 17 Home price growth from CoreLogic Home Price Index and Existing Home Sales from National Association of Realtors, data through December 2020
2021 U.S. Housing Market Outlook : 27

Confidentiality and Other Important Disclosures
This report discusses general market activity, industry, or sector trends, or other broad-based economic, market or political conditions and should not be
construed or relied upon as research or investment advice, as predictive of future market or investment performance or as an offer or solicitation of an
offer to buy or sell any security or investment service. This report reflects the views of Pretium Partners, LLC (“Pretium”), as of the date on the cover and
these views are subject to change without notice as the market conditions change and evolve, which can occur quickly. Past performance is not indicative
of future results.

Recipients are urged to consult with their financial advisors before making any investment. All investments entail risks, and mortgage-related
investments are speculative and entail special risks. Changes in interest rates, both real estate and financial market conditions, the overall economy,
the regulatory environment and the political environment can affect the market for mortgage-related investments and should be considered carefully.
Investors may lose all or substantially all an investment, and no investment strategy or process is guaranteed to be successful or avoid losses.

This report is being furnished on a confidential basis and is intended solely for the person to whom it was originally delivered. Distribution of this report
to any person other than the person to whom it was originally delivered is unauthorized, and any reproduction of these materials, in whole or in part, or
the divulgence of any of its contents, without the prior express written consent of Pretium, is prohibited.

Certain information in this report has been obtained from published and non-published sources prepared by third parties, which, in certain cases, have
not been updated through the date hereof. While such information is believed to be reliable, Pretium has not independently verified such information,
does not assume any responsibility for the accuracy or completeness of such information nor does it warrant that such information will not be changed.
Any reference to a specific company or security does not constitute a recommendation to buy, sell, hold or directly invest in the company or its securities.

The information included herein may not be current and Pretium has no obligation to provide any updates or changes. No representation, warranty or
undertaking, express or implied, is given as to the accuracy or completeness of the information or opinions contained herein, and nothing in this report
should be relied upon as a promise or representation.

This report includes a discussion of certain market opportunities as determined by Pretium. There can be no assurance that such opportunities will exist,
and both the timing and opportunities are subject to change based on Pretium’s analysis of current market conditions.

This report contains forward-looking statements, which can be identified by the use of forward-looking terminology such as “may,” “will,” “should,”
“seek,” “expect,” “anticipate,” “project,” “estimate,” intend,” continue,” “target,” “plan,” “believe,” the negatives thereof, other variations thereon or
comparable terminology and information that is based on projections, estimates, and assumptions. Such statements and information cannot be viewed as
fact and are subject to uncertainties and contingencies. Actual results during the period or periods covered by such statements and information may differ
materially from the information set forth herein, and no assurance can be given that any such statement, information, projection, estimate, or assumption
will be realized or accurate.

The information set forth in this report is not intended as a representation or warranty by Pretium or any of its affiliates as to the composition or
performance of any future investments. Assumptions necessarily are speculative in nature. It is likely that some or all the assumptions set forth or relied
upon in this report will not materialize or will vary significantly from any assumptions made (in some cases, materially so). You should understand
such assumptions and evaluate whether they are appropriate for your purposes. Certain information in this report is based on mathematical models
that calculate results using inputs that are based on assumptions about a variety of future conditions and events. The use of such models and modeling
techniques inherently are subject to limitations. As with all models, results may vary significantly depending upon the value and accuracy of the inputs
given, and relatively minor modifications to, or the elimination of, an assumption, may have a significant impact on the results. Actual conditions or events
are unlikely to be consistent with, and may differ materially from, those assumed. ACTUAL RESULTS WILL VARY, AND MAY VARY SUBSTANTIALLY FROM
THOSE REFLECTED IN THESE MATERIALS.
2021 U.S. Housing Market Outlook : 28

For questions or comments on this report, please contact
your Pretium relationship manager.

Charles P. Himmelberg, Senior Managing Director – Macro Research, chimmelberg@pretium.com

Charlie Himmelberg is Senior Managing Director and Head of Macro Research at Pretium, where he has overall responsibility for global market research
across all of the firm’s strategies, including real estate. Mr. Himmelberg joined Pretium in 2020 with more than 25 years of experience in mortgage, credit,
market, and policy research. Prior to joining Pretium, he spent 15 years at Goldman Sachs & Co., most recently as Partner & Managing Director, Global
Investment Research, responsible for the global market research teams in rates, FX, credit, mortgages, EM and macro equity; previously, he was head
of global credit and mortgage research. Prior to joining Goldman, Mr. Himmelberg had a distinguished career in policy research and academia at the
Federal Reserve Bank of New York, Columbia University, New York University, and The University of Chicago. Mr. Himmelberg is a member of Pretium’s
Executive Committee. He received a BA in Economics and a BS in Mathematics from the University of Kansas, and a PhD in Economics from Northwestern
University. Additionally, he serves as a trustee of St. Peter’s Catholic Church.

Zain N. Butt, Associate – Research & Strategy, zbutt@pretium.com

Zain Butt is an Associate on the Macro Research Team at Pretium, where he supports global market research across all of the firm’s strategies, analyzing
trends in the economy, capital markets and housing markets, as well as working across the organization to translate top-down thoughts into the
investment process and business development efforts. Zain joined Pretium in 2019 after completing a 3-year credit rotation program from S&P Global
Ratings and has experience in analyzing healthcare, insurance, and asset-backed securities. Prior to S&P, he also spent 1 year at Aegis Capital as part of
their equity research team focusing on biotech. Zain graduated cum laude from CUNY Baruch College with a BBA in Economics and Finance, and is a CFA
level 2 candidate.
You can also read