The Hard Costs of Construction: Recent Trends in Labor and Materials Costs for Apartment Buildings in California - Terner Center for Housing ...
←
→
Page content transcription
If your browser does not render page correctly, please read the page content below
A TERNER CENTER REPORT - MARCH 2020

The Hard Costs
of Construction:
Recent Trends in Labor
and Materials Costs
for Apartment Buildings
in California

AUTHORS:
HAYLEY RAETZ
TEDDY FORSCHER
ELIZABETH KNEEBONE
CAROLINA REID

                    Copyright 2020 Terner Center for Housing Innovation
                For more information on the Terner Center, see our website at
                              www.ternercenter.berkeley.edu
A TERNER CENTER REPORT - MARCH 2020

Executive Summary                                   ■ Trends in both labor and materials
                                                      have likely contributed to hard

A     gainst the backdrop of a statewide
      housing crisis, affordable and market-
rate developers have seen increasing devel-
                                                      cost increases, but do not entirely
                                                      account for the pace of change.

                                                      Controlling for key factors, our regression
opment costs, which can hinder the feasibility
                                                      analysis found that projects that began
of new projects and contribute to affordability
                                                      construction between 2016 and 2018 were,
constraints. The rising cost of building housing
                                                      on average, $68 more expensive per square
is fueled by multiple factors, including land,
                                                      foot than projects started between 2009
capital costs, regulations, materials, and labor.
                                                      and 2011.
In this report, we focus on the subset of these
costs that have seen some of the largest escala-    ■ It’s more expensive to build in the
tions in recent years: materials and labor, also      Bay Area and Los Angeles.
referred to as hard construction costs. Hard
construction costs comprise more than sixty           Controlling for project characteristics,
percent of total development costs. Yet under-        compared to the rest of the state, average
standing what goes into hard costs is difficult       hard costs were $35 more expensive per
due to the lack of publicly-available, detailed       square foot in the Los Angeles region and
data on specific projects.                            $81 more expensive per square foot in the
                                                      Bay Area. The Bay Area has comparatively
To shed light on the drivers of hard construc-        higher construction wages than elsewhere
tion costs, we compiled and analyzed a unique         in California, which could help to explain
new dataset of line-item level construction           the difference in hard costs at the regional
costs for 240 multifamily projects built in           level. While we were unable to control for
California between 2009 and 2018. We find:            the effects of local regulations, these too
■ The per-square-foot hard costs for                  could be adding to regional variations in
                                                      construction costs.
  constructing multifamily housing in
  California climbed 25 percent over                ■ Building with concrete and steel
  the course of a decade.                             costs more.
  On average, hard costs per square foot in           Type I construction (mainly composed of
  2018 were $44 higher compared to 2008-              concrete and steel) is significantly more
  2009, after adjusting for inflation.                expensive than other construction types.
■ Cost increases have been most                       This in turn means that these high-rise
                                                      buildings are more likely to be financially
  pronounced in the line-item catego-
                                                      feasible in markets with high rents.
  ries for finishes and for wood, plas-
  tics, and composites.                             ■ Affordable housing projects cost
                                                      more on average than market-rate
  Detailed data shows that since 2010, wood,
                                                      and mixed-affordability projects,
  plastics, and composites costs rose by 110
                                                      but this difference loses significance
  percent after accounting for inflation, and
                                                      after controlling for project size.
  finishes costs rose by 65 percent.
                                                      Controlling for observable cost drivers,
                                                      affordable projects cost on average $48
                                                      more per square foot than market-rate

                                                                                                                  2
A TERNER CENTER REPORT - MARCH 2020

  projects or projects that mix affordable and
  market-rate units. The significance of this
                                                  Introduction
  difference disappears when controlling for      The cost of development is often cited as
  the size of the project. While more data are    a fundamental obstacle to building more
  needed to tease out the implications of this    housing in California, especially housing that
  finding, it suggests that market-rate devel-    is affordable to low- and moderate-income
  opers are more likely to realize efficiencies   households.1 As the costs to build go up, the
  of scale than affordable housing developers     rents for those units go up as well. If the costs
  because they tend to build larger buildings.    become too great, rising construction costs
                                                  can make a project financially infeasible.
■ Prevailing wage requirements are                For example, a multifamily unit that costs
  associated with higher hard costs.
                                                  $800,000 to build will need to charge
  Our analysis joins a body of evidence that      approximately $4,000 in monthly rent2—a
  finds a significant relationship between        price well over the typical monthly earnings in
  prevailing wage requirements and higher         the state —to cover those costs and meet return
  costs. However, it should be noted that         on investment requirements for investors.
  prevailing wage requirements are a policy
                                                  Many different factors layer together to affect
  choice designed to provide public benefit
                                                  the bottom-line costs of building new housing
  by stabilizing employment and benefits in
                                                  and whether or not a project will ultimately
  a high-risk field; those broader benefits
                                                  “pencil”: the costs of acquisition (e.g., land
  would not be captured in an analysis of
                                                  and closing costs), hard construction costs
  hard construction data.
                                                  (e.g., materials and labor), soft costs (e.g.,
Overall, our findings point to the importance     legal and professional fees, insurance, and
of policies that can help to mitigate rising      development fees), and the costs of conversion
construction costs. Streamlining and bringing     once a project is completed (e.g., title fees and
more certainty to the permitting and approval     the operating deficit reserve). Among these
processes can mitigate labor and materials        various components of a project’s total “cost
cost increases, as well as having the added       stack,” by far the largest share of a project’s
benefit of bringing down pre-construction and     total cost comes from materials and labor—or
contingency costs. Reviewing regulations and      hard costs.
building codes for inefficiencies can also rein
                                                  Given the significant role hard costs play
in escalating hard costs. Innovative construc-
                                                  in determining the financial feasibility of
tion techniques that aim to lower costs and
                                                  new housing construction, this analysis
increase efficiency—such as industrial and
                                                  focuses on recent trends in materials and
mass timber construction—could benefit from
                                                  labor costs and what might explain them. To
additional state and local support, as could
                                                  better understand these costs components,
training programs that create a pipeline for
                                                  we collected data from developers, general
talent in the construction industry.
                                                  contractors, and financial institutions for both
                                                  market and affordable multifamily housing
                                                  developments that began construction
                                                  between 2008 and 2018. We created a unique
                                                  dataset of more than 240 projects throughout
                                                  the state of California, which includes
                                                  information on estimated construction
                                                  costs, final construction costs, construction

                                                                                                                  3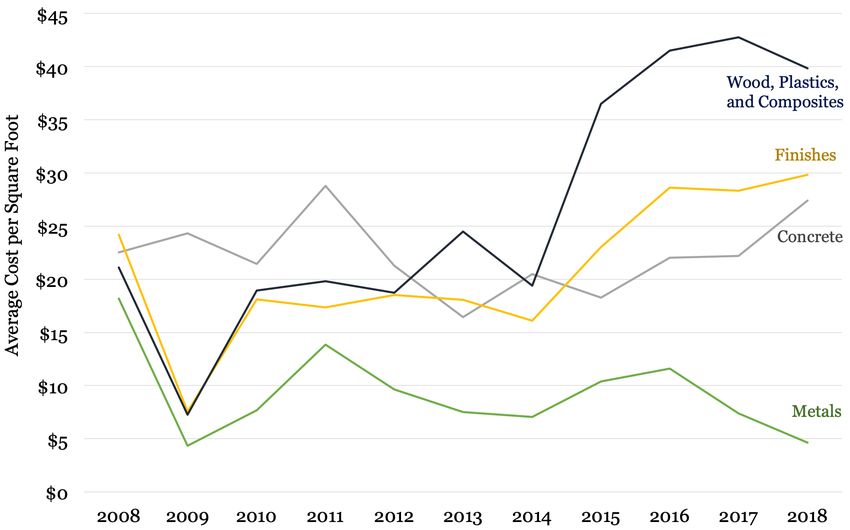
A TERNER CENTER REPORT - MARCH 2020

     This report is part of the Terner Center’s The Cost of Building Housing Research Series,
     which examines the different cost factors that layer together to comprise the total
     costs to build housing in California. Accompanying this report, we have also released
     The Costs of Affordable Housing Production: Insights from California’s 9% Low-Income
     Housing Tax Credit Program, which looks specifically at the factors influencing the
     costs of development for new construction financed through the 9% LIHTC programs.
     Previous studies include Making It Pencil: The Math Behind Housing Development, in
     which we outline how land costs, construction costs, local fees, and financing costs all
     contribute to the total development cost for a housing project. In our work on impact
     fees and development fees, we found that waning tax revenue and the loss of state and
     federal funding for infrastructure resulted in rising local exactions on new housing. And
     in Perspectives: Practitioners Weigh in on Drivers of Rising Housing Construction Costs
     in San Francisco, we examined the ways in which lengthy permitting processes as well
     as local regulations and requirements can increase the cost of both market-rate and
     affordable housing projects.

schedules, and project characteristics (such as     schedules, and project characteristics (such
size, location, etc.). While other data sources     as size, location, etc.). Responses typically
provide insight into broad changes in costs in      came in the form of original project bids, final
the form of price indices, or consolidate data      cost sheets, and final construction schedules.
to inform cost estimation, our data allow us to     We also collected additional details on each
review line item costs directly. Our data offer a   project through a survey completed by the
rare and detailed window into specific factors      responding organizations. We then digitized
underlying the hard costs of construction for       PDFs or scanned documents, cleaned, and
individual projects. With these data, we are        standardized responses to create a unique
able to trace how hard costs have changed           database (the “Terner dataset”) of more
over time, as well as understand which types        than 240 multifamily projects constructed
of costs have seen the steepest increases. The      throughout the state of California.3 Given the
following analysis unpacks these factors and        focus of this analysis, the sample only includes
considers state-level approaches to mitigate        data on hard construction costs, and not on
the rising cost of construction, with the aim       other factors considered elsewhere in the Cost
of producing more market-rate and affordable        of Building Housing Research Series, such as
housing at lower price points.                      land, financing, and contingency costs.

Methodology                                         Defining Construction Costs

Detailed data on hard construction costs—           According to the data we collected on total
also referred to in this analysis as simply         project costs, hard construction costs repre-
“construction costs”—are not publicly avail-        sented more than 60 percent of the total cost
able or easily accessible. We reached out to        of producing a new residential building in
dozens of market-rate and affordable housing        California over the past decade.4
developers, general contractors, and finan-         This analysis reports on bid costs, or
cial institutions to request data on housing        estimated project costs, rather than the final
projects started between 2008 and 2018,             construction costs for projects. While this may
including data on estimated construction            underestimate final costs, the data from bid
costs, final construction costs, construction       sheets were more complete. These bids are

                                                                                                                    4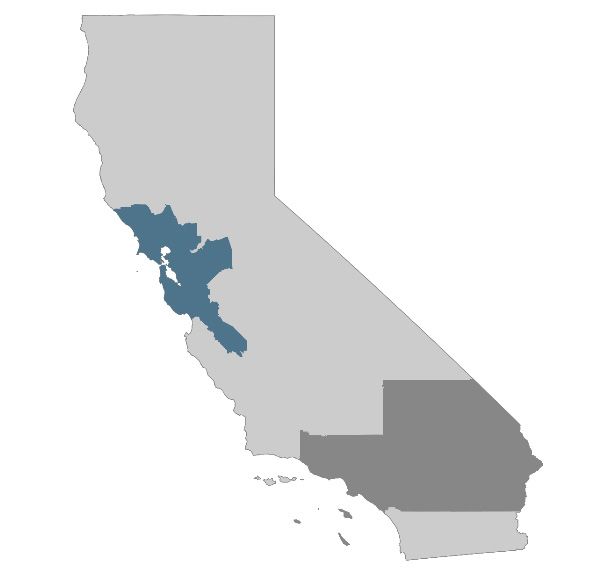
A TERNER CENTER REPORT - MARCH 2020

also what are used to determine the amount of               Key Characteristics of Projects in the
subsidy that is needed for affordable projects.
                                                            Terner Dataset
To consider the cost of materials and labor at
the time of the bid, our analysis categorizes               Among the projects included in the Terner
projects based on the year construction began,              dataset, 79 percent are affordable develop-
rather than the date of completion.                         ments, while market-rate and mixed-afford-
                                                            ability projects make up 11 and 10 percent of
The developers and general contractors that
                                                            the dataset, respectively (Figure 2). “Mixed”
provided data for this project track their
                                                            projects, or projects that contain a mix of
line item level costs differently, parsing
                                                            affordable and market-rate units, tilt heavily
costs at varying levels of detail. In order to
                                                            towards market-rate: in the typical mixed
standardize our analysis across a variety of
                                                            project, 14 percent of units are affordable.
line item categories, we coded each line item
                                                            Most projects in our sample are primarily
according to its Construction Specifications
                                                            wood construction—39 percent of the proj-
Institute MasterFormat division,5 a standard
                                                            ects are type V (i.e., wood construction), while
commonly used in U.S. construction (also
                                                            11 percent are type V over I (i.e., wood over a
referred to in this analysis as CSI divisions
                                                            concrete podium, which is typically a parking
or codes). The line items were coded based
                                                            structure). Only 6 percent of the projects are
on keywords, and any remaining line items
                                                            type I, or tower construction (i.e., steel and
were coded by hand before the dataset was
                                                            concrete high-rises). Just over one-third of
reviewed a second time to ensure fidelity to
                                                            projects (36 percent) did not include data on
the MasterFormat divisions. In a few cases,
                                                            the construction type. Almost half of the proj-
project line items were broad enough that they
                                                            ects in our sample (49 percent) are non-pre-
incorporated multiple divisions; in those cases
                                                            vailing wage projects, 42 percent adhere to
we removed the overly broad costs from the
                                                            prevailing wage regulations, and   9 percent did
                                                                                             83.2%
line item level analysis, but included the costs
                                                            not report their prevailing wage status.
when assessing total hard construction costs.

Figure 1: Total Development Costs for Multifamily Projects in California (Completed 2010-2019)

                                                                                                                                   5
A TERNER CENTER REPORT - MARCH 2020
Figure 2: Characteristics of Projects in the Terner Dataset
Figure 3: Regions for Cost Analysis
6A TERNER CENTER REPORT - MARCH 2020
In order to assess regional differences in
costs while maintaining the anonymity of
Line Item Data on
respondents, we compared the costs of projects Rising Construction Costs
built in the two largest urban centers—the
Bay Area and Los Angeles regions—to those The per-square-foot hard costs for
built in the rest of the state (Figure 3). Fifty
constructing multifamily projects in
percent of the projects are located within the
San Jose-San Francisco-Oakland Combined California climbed 25 percent over the
Statistical Area (CSA), while 33 percent of course of a decade.
projects are in the Los Angeles-Long Beach
CSA. The remaining 17 percent of the projects The Terner dataset confirms what construction
are located in the rest of the state. professionals have reported for years:real
construction costs have risen since the
One challenge in understanding differences in recession. A weighted average of hard costs
construction costs is that different locations, per project square foot, adjusted to 2018
and/or building types, will influence costs. To dollars, shows that costs have increased across
account for these differences, we present the the state (Figure 4).
results of a series of multivariate regression
models that allow us to control for these differ- In 2008-2009, hard costs averaged $177 per
ences. This approach allows us to examine the square foot. By 2018 that average had risen to
independent association of different project $222 per square foot—a 25 percent increase.
characteristics—such as construction type, While these increases have been felt across the
region, or the year construction started—on state, costs are highest—and their increases
overall construction costs. have been most precipitous—in the Bay Area
(see Case Study on page 15).
Figure 4: Hard Construction Cost Per Square Foot, California (2018 $)
7A TERNER CENTER REPORT - MARCH 2020
The cost increases captured in the Terner following MasterFormat divisions: a) metals,
dataset align with other industry measures of b) concrete, c) finishes, and d) wood, plastics
construction costs. The California Construc- and composites. Metals costs include metal
tion Cost index, for example, recorded a 24 framing, joists, decking, stairs, and railings,
percent change in costs between 2009 and among others. Concrete costs cover concrete
2018.6 Because prices declined following the forming and accessories, concrete reinforcing,
recession, increases in recent years have regis- cast-in-place concrete, precast concrete, cast
tered as much steeper, given that they started decks and underlayment, mass concrete, and
from a lower base.7 Between 2014 and 2018, concrete cutting and boring. Finishes costs
hard construction costs in California rose consist of plaster and gypsum board, tiling,
almost $80 per square foot, or 44 percent. ceilings, flooring, wall finishes, painting and
coating, among others. Finally, wood, plastics,
Evidence suggests the trend has not abated
and composites costs include rough carpentry,
since 2018. The California Construction Cost
finish carpentry, architectural woodwork,
Index increased by 3.6 percent in 2019, the
structural plastics and composites, and plastic
highest increase since a 4.4 percent increase
fabrications such as railings and paneling. 9
in 2016.8
Figure 5 documents the trends for each of
Cost increases have been most these line items in the Terner dataset.
pronounced in the line-item categories Adjusting for inflation, metal costs have
for wood, plastics, and composites and remained relatively stable over time, averaging
for finishes. between $5 and $10 per square foot. Concrete,
while significantly higher than in 2014, is only
On any construction project, the largest slightly more expensive per square foot than
contributors to hard costs include the it was in 2008. In contrast, by far the biggest
Figure 5: Line Item Construction Costs (2008-2018)
8A TERNER CENTER REPORT - MARCH 2020
increases have occurred in line-item costs for divisions reviewed above) are generally close
wood, plastics, and composites, which roughly to 2006 levels, at the height of the previous
doubled between 2014 and 2018. These trends building boom. In nominal terms, wages for
remain the same when the sample is isolated all construction and extraction occupations in
to type V—or primarily wood construction— California rose by 29 percent between 2006
projects, implying the change in line item costs and 2018, and by 13 percent since 2010, below
is not driven by changes in construction type the statewide increase in hard costs of 25
over time. Line-item costs for finishes have percent. In real terms, however, wages have
also climbed well above 2008-levels. It could only risen by just 3.4% since 2006.
be that higher construction costs and a hotter
These averages, however, hide the tightness
housing market have increased spending on
in the construction labor market in some
finer floor coverings and other finishes to build
areas. Since the recession, there has been a
out more expensive units and meet the expec-
significant mismatch between the number
tations of a higher rental or sale price point.
of permitted units—increasing more than
Trends in both labor and materials 430 percent between 2009 and 2018—and
the growth in the construction sector, where
have contributed to hard cost increases, the number of workers has only expanded by
but do not entirely account for the pace 32 percent. General contractors noted that
of change. anti-immigration rhetoric, as well as a tight
labor market overall, has made it hard to find
While we can see which areas have experienced construction workers, let alone workers with
the greatest increases in overall costs, it is not more multifamily construction experience
possible to completely disentangle which of and/or those trained in the specific trades.
these costs are driven by materials and which
are driven by labor. General contractors and Indeed, surveys of housing developers have
developers typically only track bundled labor consistently listed a shortage of workers as
and materials costs at the line item level; a top concern.10 For example, in response
for example, they might record the cost of to a 2019 survey of general contractors in
earthwork, but not the overhead for the California, more than 60 percent of firms
earthwork subcontractor, or the cost of labor responded that they were “having a hard time
to dig a foundation. filling some or all positions” for craft and
salaried workers, reflecting the twin challenge
In order to assess the relative role of labor of a constrained labor force at the same time
versus materials costs, we compared the as new development has increased.11
changes in line item costs from the Terner
Center dataset to publicly available data on Statewide employment data also reveals
materials cost indices and wage rates at the that certain types of skilled labor are lagging
state level. more than others. Employment of carpenters
dropped by 30 percent between 2006 and
Wage and Employment Trends 2018, and reinforcing iron and rebar workers
declined by 52 percent over the same period.
A review of construction wages in Cali-
Similarly, employment of cement masons and
fornia reveals that, while wages have risen in
concrete finishers decreased by 18 percent and
nominal terms, when adjusted for inflation,
drywall and ceiling tile installers dropped by
wages in key construction occupations (those
23 percent.12, 13 A survey of California general
closely associated with the four MasterFormat
contractors captured the tightness in the
9A TERNER CENTER REPORT - MARCH 2020
Table 1: Nominal and Real Hourly Median Wages for Selected California Construction Occupations, and Percent
Change in Wages from 2006-2018 and 2010-2018
California Occupations
Cement
Construction Drywall & Structural
Masons & Sheet Metal
& Extraction Carpenters Ceiling Tile Iron & Steel
Concrete Workers
Occupations Installers Workers
Finishers
2006 $20.63 $23.50 $19.49 $21.48 $20.93 $25.17
2010 $23.55 $25.49 $23.10 $23.45 $26.13 $26.47
Wages
(unadjusted 2018 $26.56 $27.29 $25.82 $26.78 $25.77 $31.98
for inflation)
Percent Change,
28.7% 16.1% 32.5% 24.7% 23.1% 27.1%
2006-2018
Percent Change,
12.8% 7.1% 11.8% 14.2% -1.4% 20.8%
2010-2018
2006 $25.70 $29.27 $24.28 $26.75 $26.07 $31.35
2010 $27.12 $29.35 $26.60 $27.00 $30.09 $30.48
Wages
(adjusted
for national 2018 $26.56 $27.29 $25.82 $26.78 $25.77 $31.98
inflation)
Percent Change,
3.4% -6.8% 6.4% 0.1% -1.1% 2.0%
2006-2018
Percent Change,
-2.1% -7.0% -2.9% -0.8% -14.4% 4.9%
2010-2018
Figure 6: Multifamily Permits and Construction Employment in California (2002-2018)
Sources: State of California Department of Finance, Construction Permits, Annual data, from 1975, Residential (units and valuation). Retrieved
from: http://www.dof.ca.gov/Forecasting/Economics/Indicators/Construction_Permits/.; Federal Reserve Bank of St. Louis and U.S. Bureau of
Labor Statistics, All Employees: Construction: Residential Building Construction in California [SMU06000002023610001A]. Retrieved from: FRED,
Federal Reserve Bank of St. Louis; https://fred.stlouisfed.org/series/SMU06000002023610001A. January 9, 2020. 10A TERNER CENTER REPORT - MARCH 2020
labor market across a host of different types climbed at a significantly faster rate than the
of workers: 70 percent or more of respondents lumber materials index. While the materials
noted that it was harder to hire plumbers index increased by 39 percent between 2010
and pipelayers in 2019 than the year before, and 2018, the wood, plastics, and composites
and more than 60 percent said the same for line item costs in California housing projects
roofers, equipment operators-cranes, heavy increased by 110 percent over the same period,
equipment, drywall installers, sheet metal with costs remaining high after 2014 (Figure
workers, and cement masons. More than 7). As previously noted, real wages for occu-
50 percent of respondents found it harder pations closely associated with the line items
to hire concrete workers and carpenters, as reviewed all either dropped or remained rela-
well as pipefitters/welders, mechanics, and tively flat, leaving a question as to the central
laborers. Perhaps reflecting the increase in driver of increasing costs for wood, plastics
iron workers, only 33 percent of respondents and composites.
noted that the trade was more difficult to hire
A number of factors can influence materials
for than the year previous.14
costs. Some are macroeconomic forces influ-
Materials Cost Trends enced by global trade patterns and federal
policy decisions. For instance, the National
In order to assess the relationship between Association of Home Builders estimated that
materials costs and hard cost line item trends the tariffs imposed in 2018 on Chinese imports
in California, we compared price trends translated to a $1 billion increase in residen-
between key materials indices and the Terner tial construction costs.15 Others are shaped by
dataset (Table 2). state and local policy decisions—from regula-
Most key line items tracked closely with their tory requirements to building codes to nego-
corresponding materials cost indices; finishes, tiations around the elements of specific proj-
concrete, and metal costs all rose in parallel ects—that may dictate the types of materials
with materials costs (Table 2). In contrast, used in a given project. Although such deci-
wood, plastics, and composites line item costs sions affect total costs, the impact can be hard
to quantify.
Table 2: Percent Change in Terner Line Item Costs and Interviews conducted by Terner Center
Related Industry Indices for Materials researchers suggested that general contrac-
tors and subcontractors are asking for higher
levels of overhead, profit, and contingency,
Percent Change, 2010-2018
in some cases to hedge against risk and costs
Terner Data Industry Index associated with a restricted workforce, such
Concrete 28 25 as losing workers or subcontractors to more
Finishes/Gypsum 65 66 profitable projects in the middle of a job.
Metals -39 8 While the structure of the Terner data did not
allow us to review profit or contingency sepa-
Wood/Lumber 110 39
rately, San Francisco tied with New York City
Source: Terner Center analysis of U.S. Bureau of Labor Statistics data:
for the highest contractor’s margins in any
U.S. Bureau of Labor Statistics. Producer Price Indexes. Retrieved U.S. city surveyed in the most recent Turner
from: https://www.bls.gov/ppi/.
and Townsend survey, at seven percent.16
11A TERNER CENTER REPORT - MARCH 2020
Figure 7: Wood, Plastics, and Composites Line Item Cost Index and Producer Price Index by Commodity for Lumber
and Wood Products: Lumber (Base Year 2008)
Source: Terner Center analysis of Terner Center data and U.S. Bureau of Labor Statistics data: U.S. Bureau of Labor Statistics, Producer Price
Index by Commodity for Lumber and Wood Products: Lumber [WPU081]. Retrieved from: FRED, Federal Reserve Bank of St. Louis; https://fred.
stlouisfed.org/series/WPU081, January 9, 2020.
Putting It All Together: To understand all the factors that influence
construction costs in tandem, we developed a
The Drivers of Increased regression model that allows us to assess how
each factor influences the bottom-line cost of
Construction Costs building. Table 3 presents the results of this
analysis, first without controlling for project
As materials and labor costs have gone up,
size (model 1) and then after taking project
it is not surprising that overall construction
size into account (model 2).
costs have also risen. One possible expla-
nation for the higher costs is that the mix of The key findings are:
projects being built has changed over time—
for instance, a shift toward more high-rise ■ Hard costs of building housing in
condominiums that require more expensive California have increased by $68 per
construction materials—or that more develop- square foot, on average.
ment is occurring in high-cost markets, where Even accounting for other relevant factors
labor costs will be higher. in the model, it is more expensive to build a
similarly-sized unit in California compared
to a decade ago.
■ It is more expensive to build in the
Bay Area and Los Angeles.
Controlling for key factors like construc-
tion type, prevailing wage requirements,
affordability, and year construction started,
12A TERNER CENTER REPORT - MARCH 2020
Table 3: Model Identifying Factors that Contribute to Per Square Foot Hard Costs, California, 2008-2018
Per Square Foot
Variables Model 1 Model 2
-0.23***
Project Size (Number of Units)
(0.09)
Year Construction Began (Compared to
Projects Started in 2009-2011)
39.71 59.39
Project Started 2007-2008
(42.26) (42.36)
9.57 10.00
Project Started 2012-2015
(18.16) (17.91)
65.46*** 67.85***
Project Started 2016-2018
(20.18) (19.93)
Type of Construction (Compared to All
Other Types)
65.06** 70.94***
Construction Type I
(25.69) (25.45)
Region (Compared to Los Angeles)
48.94*** 46.19***
San Jose- San Francisco-Oakland
(13.18) (13.05)
-30.66* -35.08**
Other
(16.80) (16.66)
Project Characteristics
47.57*** 24.27
Project Is Affordable Housing
(16.97) (18.95)
36.41*** 30.31**
Project Includes Prevailing Wage
(12.95) (12.98)
127.75*** 174.08***
Constant
(23.40) (29.06)
Number of Observations 223 223
R- Squared 0.29 0.31
Adjusted R-Squared 0.26 0.28
Notes: Standard errors in parentheses. *** pA TERNER CENTER REPORT - MARCH 2020
urban areas showed statistically significant higher development costs, especially if
cost differences. Compared to projects in multiple projects subject to labor require-
other parts of the state, Bay Area projects ments move forward simultaneously in
cost $81 more per square foot to build, and a constrained labor market. In order to
projects in the Los Angeles region cost $35 secure local approvals, affordable housing
more per square foot. (See Case Study on projects are also often subject to increased
page 15 for more on Bay Area costs.) design requirements. In some cases, purely
aesthetic changes required by a locality can
■ Building with steel and concrete costs increase the cost of construction, and even
more.
result in a reduction in the number of units
Type I projects, which are typically over
produced.17
5-7 stories and constructed with steel and
concrete, cost an average of $65 more per However, once we control for project size,
square foot than other types of construc- we find that affordable projects are not
tion, like Type V over I (i.e., wood frame statistically more expensive than market-
floors over a concrete platform). Type I rate. This may be in part due to the small
projects use more expensive components in sample, but it may also be due to the fact
order to build higher, and are more likely that affordable projects tend to be smaller
to be found in infill locations, such as San given that the way affordable units are enti-
Francisco or Los Angeles, where zoning tled and financed constrain project size.18
allows higher density construction. When
we also control for the number of units in a
■ Prevailing wage requirements are
associated with higher hard costs.
project (which reduces costs slightly due to
Both market-rate and affordable projects
economies of scale), the additional cost of
may be subject to prevailing wage require-
Type 1 projects rises slightly to $71 dollars
ments or project labor agreements for their
per square foot.
construction contracting. Market-rate proj-
■ Affordable housing projects cost ects may adhere to requirements as part of
more on average than market-rate a developer agreement with a locality, for
and mixed-affordability projects, example. Funding sources for affordable
but this difference loses significance projects may trigger state or federal Davis-
after controlling for project size. Bacon prevailing wage requirements, which
Controlling for year, region, construction differ from state level prevailing wage
type, and prevailing wage requirements, requirements in terms of oversight regula-
affordable projects cost, on average, $48 tions as well as wage rates.19
more per square foot compared to market-
Our model found that projects with
rate projects and projects that mixed
prevailing wage requirements cost an
affordable and market-rate units. In a
average of $30 more per square foot than
companion study, The Costs of Affordable
those without wage requirements, after
Housing Production: Insights from Califor-
controlling for whether or not a project was
nia’s 9% Low-Income Housing Tax Credit
affordable, as well as project size, region,
Program, we examine the drivers of costs
construction type, and the year construc-
for affordable projects in more detail, and
tion started.20
find that funding complexity, including
the associated prevailing wage and other Prevailing wages may increase the cost
local hire requirements, is associated with of construction for a number of reasons.
14A TERNER CENTER REPORT - MARCH 2020
Case Study: The Bay Area has the highest construction costs in the state.
Hard construction costs have climbed statewide, but they are the most expensive and have risen most
dramatically in the San Francisco Bay Area. While normalized statewide costs increased 25 percent between
2008-2009 and 2018, costs for projects in the Bay Area rose 119 percent over the same period, reaching
more than $380 per square foot in 2018 (Figure 8).
Figure 8: Construction Costs Per Square Foot, Statewide and Bay Area Weighted Averages (2008-2018)
A number of factors are likely contributing to the rapid escalation of construction costs in the Bay Area.
For one, wages are higher in the region, reflecting higher costs of living.23 In 2018, the San Francisco and
San Jose Metropolitan Statistical Areas had the two highest hourly median wages in the state, which could
contribute to comparatively higher construction costs overall.24 However, when adjusted for inflation using
the local consumer price index (which takes into account the cost of living in the Bay Area by accounting for
changes in gas, shelter, food, energy and other consumer goods), wages in the region have actually fallen
in real terms (Table 3). The failure of wages to keep pace with local price increases may contribute to the
challenges and delays in attracting labor reported by developers and builders.
Table 3: Percent Change in Median Hourly Wages for Construction and Extraction Occupations in the Bay Area (2009-2018)
Percent Change in Hourly Wages
Metropolitan Statistical Area Unadjusted for Adjusted for
Local Inflation Local Inflation
San Francisco-Oakland-Hayward, CA 7% -16%
San Jose-Sunnyvale-Santa Clara, CA 15% -10%
Additional local regulations and lengthy review processes specific to the Bay Area may also add to the
cost of construction. For instance, while raw materials costs are relatively similar across the state (not-
withstanding variation in transportation costs), local regulations that require certain materials or building
components can contribute to the costs of materials.25 Moreover, workforce procurement rules—such as
San Francisco’s Small Business Enterprise, Local Business Enterprise, and local hire requirements—re-
flect worthy policy goals; they may also result in restricting the labor pool for projects, particularly in a
region where living costs are so high that few construction workers can afford to live locally.26 In addition,
a recent study found that the average San Francisco project takes 3.8 years to be permitted.27 While delays
in permitting and approval may not affect hard construction costs directly, our previous research found that
subcontractor concerns about project timelines and risk can make them hesitant to work in San Francisco,
pushing up bids. 15A TERNER CENTER REPORT - MARCH 2020
Besides setting higher wage rates, prevailing
x2122232425 risk for projects. As previously noted, these
wage triggers requirements such as payroll timelines can be extensive.29 The process is
certification that can add to costs. The sufficiently onerous that developers often hire
same measures may also deter illegal labor private expeditors to move projects through
practices that would lower costs, such as review in a timely manner.30 Affordable
wage theft and worker misclassifications— projects often face more extensive review by
construction consistently ranks as an more local departments, resulting in longer
industry with some of the highest number and more circuitous paths to final permitting
of cases on the U.S. Department of and approval.31 Slowing any project in the
Labor’s list of “Low Wage, High Violation pre-construction phase can increase the
Industries,” although it is unclear what cost of carrying capital and imperil key
proportion of those cases represent funding deadlines, endangering the viability
residential projects.26, 27 Interviews of projects. Increased risk and uncertainty
highlighted that because of the increased in the approvals process may also convince
demand for labor, it can also be harder to general contractors and subcontractors to add
find contractors willing to do prevailing escalation clauses or to increase contingency
wage jobs. Conversely, labor economists costs in their contracts, in order to ensure
argue that better paying projects are able to they can cover future hikes in wages and
attract more productive workers, which can materials costs if a project is delayed.32 And, of
mitigate the cost impacts of prevailing wage course, the longer a project takes to move into
requirements.28 construction, the higher the likelihood that
costs associated with labor and materials have
Ultimately, prevailing wage requirements
also increased.
are a policy choice designed to provide
public benefit by stabilizing employment Reviewing code for inefficiencies
and benefits in a high risk field; those can also mitigate rising construction
benefits have values not captured in an costs.
analysis of hard construction data.
Jurisdictions should consider the ways in
Policy Implications which overlapping regulations can add to
construction costs, and review ways to main-
This report provides a unique look at the role tain environmental and safety standards
of different line item costs in driving hard while easing the cost impact for new housing.
construction costs. While state and local For example, in our report on construction
policymakers do not control broader labor costs in San Francisco, focus group members
market trends or the cost of materials, there suggested that the city could require more
are a number of levers at their disposal that advanced air quality ventilators only for
could help mitigate rising costs, including the lower floors affected by pollution, rather than
following: throughout a building.33 Small changes can
have an outsize impact as jurisdictions aim
Shortening permitting and approval to meet goals for housing development while
timelines can mitigate costs continuing to rigorously protect the health
associated with uncertainties and and sustainability of their community. Further
delays. research is needed on state building codes to
determine if there are opportunities to consol-
Local agencies should consider ways to shorten
idate or improve the efficiency of regulation
review and approval timelines, reducing
while achieving the same policy goals.
16A TERNER CENTER REPORT - MARCH 2020
Increasing support for labor training the nation in industrialized construction, with
programs, such as apprenticeships at least 31 different companies founded in the
and programs at community colleges, state over the last two decades.38 Our research
can assist in building and skilling up found that off-site construction can save as
the construction workforce. much as 20 percent on the cost of building a
three or four story wood-frame multifamily
California needs a more robust labor pool to development, and shorten the construction
meet the demand for building in the state, timeline by between 40 and 50 percent.39
especially as the state steps up goals for
production. Unions are playing an increasing Yet, industrialized construction also faces
role in training the construction workforce; challenges. As developers and architects begin
empirical studies have found a positive to work with new construction technology,
relationship between union coverage and they are experiencing a learning curve in terms
construction worker training.34 In a 2019 of siting and designing projects to optimize
survey by the Associated General Contractors potential efficiencies. General contractors
of America (AGC), 47 percent of California have to adapt to new workflows and scopes
contractors reported that they had added of work, which requires coordination and
or increased their use of unions to provide education between developers, contractors,
workers in the past year, the top response.35 and IC firms. Government actors also have
a role to play in smoothing the way for new
Vocational training programs also provide an technology. Currently, the state inspects offsite
important pipeline for talent; the second most components while local buildings officials
prevalent response to the AGC survey question review the completed building for local code
was “[engaging] with [a] career-building compliance, which can cause confusion. The
program.”36 These programs, which include state and local governments can work with
classes and academies within high schools firms to bring local inspectors up to speed on
and pre-apprenticeship programs, provide the unique approach to building review.
students with the skills they need to enter the
workforce. The state could consider increasing Affordable housing projects face additional
support for labor training programs, such as financial barriers to adapting IC, because
those at community colleges that prepare factories require a large deposit prior to
students for apprenticeship exams. construction in order to cover ordering of
materials, before or at the time of finalizing
Supporting innovative construction a construction loan, even though no work
methods and materials could has been delivered to the site. While private
ultimately lead to lower construction developers may be able to access more flexible
costs. forms of capital, affordable housing developers
draw from fewer and more regulated sources
Industrialized construction (IC) has the poten- of capital, limiting their ability to spend
tial to lower costs and speed construction earlier in order to save later. The state or local
schedules. A broad category that encompasses governments could address this concern by
firms that produce units, elements, or parts of running a pilot program to create supplemental
a building offsite, industrialized construction revolving construction loans for affordable
has garnered attention from venture capital- housing developers that make use of offsite
ists, developers, and researchers as a way to technology, in effect seeding the industry to
improve an industry that has seen produc- lower costs for subsidized development.
tivity decline for decades.37 California leads
17A TERNER CENTER REPORT - MARCH 2020
Other technological advances, like mass funded. As The Costs of Affordable Housing
timber (MT), may also lower costs, but MT Production: Insights from California’s 9%
has yet to be fully integrated into statewide Low-Income Housing Tax Credit Program
building codes. MT has drawn attention for its shows, while some of the factors influencing
ability to shorten construction timelines (by the cost of affordable housing are no different
15-20 percent, by some estimations),40 and from market-rate construction, there are
lower costs. Some have argued that the need aspects of costs that are unique to affordable
for MT is heightened in the face of increased projects. Key among these is the fragmented
seismic requirements for the 2020 building regulatory and funding structure for financing
code, which MT can mitigate by lightening the affordable units. Resolving this fragmentation
load of the building.41 won’t be easy, but a valuable first step would be
for the state to consider emulating the Minne-
While states like Oregon have allowed for
sota Housing Finance Agency in creating a
mass timber to be used in taller residential
consolidated Request for Proposals (RFP) for
structures, only one high-rise (eight story)
several funding sources, including LIHTC.45
residential building has been built in that
state42 and California has yet to adopt similar National policy changes are also key
code. MT remains cutting-edge in residential to reining in hard construction costs.
construction, but continues to gain traction
in the field—the International Code Council At a national level, more can be done to
adopted changes to the 2021 International lower the cost of materials and expand the
Building Code that allow for MT construction construction workforce. As previously noted,
up to 18 stories.43 some have traced part of the increase in
materials costs to increased tariffs; lowering
Following this determination, California State tariffs and promoting the international
Assemblymember Frank Biglow introduced trade of building materials could mitigate
Assembly Concurrent Resolution 102 in rising material expenses. On the labor side,
2019, which would have “urged the Office of national immigration policy has direct effects
the State Fire Marshal to adopt rules for the on the construction workforce. According to
use of mass timber products for residential a recent report by the Pew Research Center,
and commercial building construction,” but unauthorized immigrants make up 15%
the resolution stalled in the assembly.44 MT of the national construction occupation,46
construction could help to lower building costs and the current administration’s actions on
across the state while providing additional immigration have raised concerns about the
benefits in terms of seismic requirements, and loss of experienced construction workers.47
the state should continue to weigh responsible While outside of the purview of state and local
ways to incorporate the material more policymakers, national level policies represent
explicitly in the building code. fundamental tools to lower the cost of hard
construction.
Streamlining affordable housing
entitlements and funding could help
to lower construction costs.
The finding that, on average, affordable units
cost more per square foot than market-rate
units indicates the need to further examine
how affordable housing is permitted and
18A TERNER CENTER REPORT - MARCH 2020
Conclusion
California’s rising construction costs undercut
housing affordability goals and threaten the
viability of new housing projects overall. The
data confirm that, controlling for key factors,
hard construction costs have significantly
increased, and certain line items are driving
those costs. In a state battling to overcome
years of undersupply of housing, policymakers
are rightfully invested in tamping down esca-
lating development costs.
While there is no “silver bullet” to lower costs,
state and local policymakers have a host of
tools at their disposal to mitigate expensive
construction. Building regulations and codes,
as well as permitting and approval processes,
could be reviewed with an eye towards stream-
lining and lowering the cost of building. Poli-
cymakers could consider ways to responsibly
support new construction techniques with
the potential to increase the sector’s effi-
ciency. Supporting the expansion of training
and apprenticeship programs could increase
the pipeline for much-needed talent. Finally,
policymakers could review the way in which
affordable housing projects are financed to
promote more cost efficient construction. By
reining in construction costs, policymakers
can build more housing more affordably,
broaden the impact of public subsidies for
affordable homes, and move forward in allevi-
ating the state’s housing crisis.
19ENDNOTES 1. Garcia, D. (2019). “Making It Pencil: The Math Behind Housing Devel- opment.” Terner Center for Housing Innovation at UC Berkeley. Retrieved from: https://ternercenter.berkeley.edu/making-it-pencil. 2. According to the U.S. Bureau of Labor Statistics’ Occupational Employ- ment Statistics, in 2018, the median hourly wage for all occupations in the state was $20.40. Assuming an employee earning that wage works 8 hours a day for 20 days in a month, their monthly earnings would be $3,264. 3. We requested data from both single-family and multifamily developers and builders but did not receive any responses from the single-family industry. Single-family cost trends remain an area in need of further research. 4. The majority of the projects for which we were able to collect total project cost data were affordable projects, with a smaller number of mixed-afford- able and market-rate projects. No data on total costs was available for solely market-rate projects. Figure 1 displays four project cost categories: 1) acqui- sition costs, which include land and closing costs, 2) hard construction costs, 3) soft costs, such as legal fees, insurance, professional fees, and develop- ment fees, and 4) conversion costs including the conversion fee, the operating deficit reserve, and title fees. This figure includes acquisition costs that were as low as $100 or $0, presumably because land was donated to the project. When those low figures are extracted from the averages acquisition costs rise by 1% to 9% of total project costs, and hard costs drop by the same amount to 62% of total costs. 5. Construction Specifications Institute MasterFormat. Retrieved from: https://www.csiresources.org/home. 6. California Department of General Services. DGS California Construction Cost Index CCCI. Retrieved from:https://www.dgs.ca.gov/RESD/Resources/ Page-Content/Real-Estate-Services-Division-Resources-List-Folder/ DGS-California-Construction-Cost-Index-CCCI. 7. These data align with those presented in the GAO report on Low-In- come Housing Tax Credit (LIHTC) development costs. See United States Government Accountability Office. (2018). Low-Income Housing Tax Credit: Improved Data and Oversight Would Strengthen Cost Assessment and Fraud Risk Management. 16-18. Retrieved from: https://www.gao.gov/ assets/700/694541.pdf. 8. California Department of General Services. DGS California Construction Cost Index CCCI. Retrieved from: https://www.dgs.ca.gov/RESD/Resources/ Page-Content/Real-Estate-Services-Division-Resources-List-Folder/ DGS-California-Construction-Cost-Index-CCCI.
9. See https://www.edmca.com/media/35207/masterformat-2016.pdf for
a detailed list of CSI MasterFormat Divisions.

10. National Association of Home Builders. (2019). Builder Confidence
Holds Firm in November. Retrieved from: http://eyeonhousing.org/2019/11/
builder-confidence-holds-firm-in-november-2/.

11. Associated General Contractors of America and Autodesk. (2019). 2019
Workforce Survey Results: California Results. Retrieved from: https://www.
agc.org/sites/default/files/WorkforceDevelopment_2019_California_0.
pdf.

12. Terner Center analysis of U.S. Bureau of Labor Statistics data: U.S.
Bureau of Labor Statistics. Occupational Employment Statistics Data.
Retrieved from: https://www.bls.gov/oes/tables.htm.

13. It is unclear why California saw such an increase in structural iron and
steel employment while reinforcing iron and steel employment declined.
Staff from the U.S. Bureau of Labor Statistics confirmed that the occupa-
tional definitions for these groups did not change between 2006 and 2018.

14. Associated General Contractors of America and Autodesk. (2019). 2019
Workforce Survey Results: California Results. Retrieved from:https://www.
agc.org/sites/default/files/WorkforceDevelopment_2019_California_0.
pdf.

15. National Association of Home Builders. (2019). Housing Takes a Hit on
Higher China Tariffs. Retrieved from:http://nahbnow.com/2019/05/sched-
uled-chinese-tariff-hike-on-may-10-will-harm-housing-affordability/.

16. Turner and Townsend. (2019). International Construction Market
Survey 2019. Retrieved from:https://www.turnerandtownsend.com/en/
perspectives/international-construction-market-survey-2019/the-most-ex-
pensive-market-to-build/.

17. Reid, C. & Raetz, H. (2018). “Perspectives: Practitioners Weigh in on
Drivers of Rising Housing Construction Costs in San Francisco.” Terner
Center for Housing Innovation at UC Berkeley. Retrieved from:https://
ternercenter.berkeley.edu/uploads/San_Francisco_Construction_Cost_
Brief_-_Terner_Center_January_2018.pdf.

18. Reid, C. (2020). “The Costs of Affordable Housing Production: Insights
from California’s 9% Low-Income Housing Tax Credit Program.” Terner
Center for Housing Innovation at UC Berkeley. Retrieved from: http://tern-
ercenter.berkeley.edu/development-costs-LIHTC-9-percent-california.

19. California Tax Credit Allocation Committee, California Debt Limit Allo-
cation Committee, Department of Housing and Community Development,
California Housing Finance Agency, Newman, M., Shawn, B., & Woodward,
S. (2014). Affordable Housing Cost Study. Retrieved from: https://www.
treasurer.ca.gov/ctcac/affordable_housing.pdf.
20. This is consistent with what previous research has found, see, for
example, Duncan, K. & Ormiston, R. (2019). What Does the Research Tell
Us About Prevailing Wage Laws? Labor Studies Journal. 44(2) 139-160.
Retrieved from: https://doi.org/10.1177/0160449X18766398.

21. Romem, I. (2018). What’s Up With Construction Costs. BuildZoom.
Retrieved from: https://www.buildzoom.com/blog/whats-up-with-con-
struction-costs.

22. U.S. Bureau of Labor Statistics. May 2018 Metropolitan and Nonmet-
ropolitan Area Occupational and Wage Estimates. Retrieved from: https://
www.bls.gov/oes/current/oes_41860.htm.

23. Romem, Issi. (2018). What’s Up With Construction Costs. Buildzoom.
Retrieved from: https://www.buildzoom.com/blog/whats-up-with-con-
struction-costs.

24. Reid, C. & Raetz, H. (2018). “Perspectives: Practitioners Weigh in on
Drivers of Rising Housing Construction Costs in San Francisco.” Terner
Center for Housing Innovation at UC Berkeley. Retrieved from:https://
ternercenter.berkeley.edu/uploads/San_Francisco_Construction_Cost_
Brief_-_Terner_Center_January_2018.pdf.

25. Goggin, B. (2018). Measuring the Length of the Housing Development
Process in San Francisco. Retrieved from: http://ternercenter.berkeley.edu/
student-projects.

26. U.S. Department of Labor. Low Wage, High Violation Indus-
tries. Retrieved from: https://www.dol.gov/agencies/whd/data/charts/
low-wage-high-violation-industries.

27. Duncan, K. & Ormiston, R. (2019). What Does the Research Tell
Us about Prevailing Wage Laws?. Labor Studies Journal. 44(2) 139-160.
Retrieved from: https://doi.org/10.1177/0160449X18766398.

28. Ibid.

29. Ibid.

30. Reid, C. & Raetz, H. (2018). “Perspectives: Practitioners Weigh in on
Drivers of Rising Housing Construction Costs in San Francisco.” Berkeley,
CA: Terner Center for Housing Innovation at UC Berkeley. Retrieved from:
https://ternercenter.berkeley.edu/uploads/San_Francisco_Construction_
Cost_Brief_-_Terner_Center_January_2018.pdf.

31. See: Reid, C. (2020). “The Costs of Affordable Housing Production:
Insights from California’s 9% Low-Income Housing Tax Credit Program.”
Terner Center for Housing Innovation at UC Berkeley. Retrieved from:
http://ternercenter.berkeley.edu/development-costs-LIHTC-9-percent-cal-
ifornia.
32. Reid, C. & Raetz, H. (2018). “Perspectives: Practitioners Weigh in on
Drivers of Rising Housing Construction Costs in San Francisco.” Berkeley,
CA: Terner Center for Housing Innovation at UC Berkeley. Retrieved from:
https://ternercenter.berkeley.edu/uploads/San_Francisco_Construction_
Cost_Brief_-_Terner_Center_January_2018.pdf.

33. Ibid.

34. Waddoups, C. J. (2014). “Union Coverage and Work-Related Training
in the Construction Industry.” ILR Review 67, no. 2 (April 2014): 532–55.
https://doi.org/10.1177/001979391406700210.

35. Associated General Contractors of America and Autodesk. (2019). 2019
Workforce Survey Results: California Results. Retrieved from:https://www.
agc.org/sites/default/files/WorkforceDevelopment_2019_California_0.
pdf.

36. Associated General Contractors of America and Autodesk. (2019). 2019
Workforce Survey Results: California Results. Retrieved from:https://www.
agc.org/sites/default/files/WorkforceDevelopment_2019_California_0.
pdf.

37. Woetzel, J., Sangeeth, R., Mischke, J., Garemo, N., & Sankhe, S.
(2014). A blueprint for addressing the global affordable housing challenge.
McKinsey Global Institute. Retrieved from:https://www.mckinsey.com/~/
media/McKinsey/Featured%20Insights/Urbanization/Tackling%20
the%20worlds%20affordable%20housing%20challenge/MGI_Affordable_
housing_Full%20Report_October%202014.ashx.

38. Pullen, T., Hall, D. M., & Lessing, J. (2019). “A Preliminary Overview of
Emerging Trends for Industrialized Construction in the United States”(White
Paper). Zurich, Switzerland: ETH Zurich Research Collection. https://doi.
org/10.3929/ethz-b-000331901.

39. Galante, C., Draper-Zivetz, S., & Stein, A. (2017). Building Afford-
ability by Building Affordably. Terner Center for Housing Innovation at
UC Berkeley. Retrieved from: http://ternercenter.berkeley.edu/uploads/
offsite_construction.pdf.

40.     Pacheco, A. (2018). Can mass timber help California build its way out
of the housing crisis? The Architect’s Newspaper. Retrieved from: https://
archpaper.com/2018/03/can-mass-timber-help-california-build-way-hous-
ing-crisis.

41. Boerner, D. (2019). Is Mass Timber An Answer To Codes And Costs In
The Bay Area? Bisnow. Retrieved from: https://www.bisnow.com/san-fran-
cisco/news/construction-development/is-mass-timber-an-answer-to-new-
code-demands-and-soaring-costs-in-the-bay-area-101803.
You can also read