Performance Measurement and Management with Financial Ratios - the BASF SE Case
←
→
Page content transcription
If your browser does not render page correctly, please read the page content below
Hochschule für
Wirtschaft und Recht Berlin
Berlin School of Economics and Law

IMB Institute of Management Berlin

Performance Measurement and
Management with Financial Ratios –
the BASF SE Case
Author: Avo Schönbohm

Working Papers No. 72
03/2013

Editors:
                        ■            ■            ■
Gert Bruche Christoph Dörrenbächer Friedrich Nagel Sven Ripsas
TEACHING NOTE

            Performance Measurement and Management
                with Financial Ratios – the BASF SE Case

                                Avo Schönbohm

                          Paper No. 72, Date: 03/2013

                                Working Papers of the
                         Institute of Management Berlin at the
                   Berlin School of Economics and Law (HWR Berlin)
                        Badensche Str. 50-51, D-10825 Berlin

                                        Editors:
                                     Gert Bruche
                               Christoph Dörrenbächer
                                    Friedrich Nagel
                                     Sven Ripsas

                                   ,661

                                 - All rights reserved -

                                           1
IMB Institute of Management Berlin Working paper No. 72
Hochschule für Wirtschaft und Recht Berlin - Berlin School of Economics and Law
Biographic note:
Prof. Dr. Avo Schönbohm is a Business Administration Professor focusing on Management
Accounting at the Berlin School of Economics and Law. Before joining the university in 2010, he had
worked for several years in various assignments in the industry. His latest responsibility was Vice
President of Strategic Planning at Voith Paper GmbH & Co. KG. He studied Business Administration
at the University of Mannheim and the ESSEC Business School, and earned his PhD while working as
an Assistant Professor at the Technical University Kaiserslautern.
Contact: Badensche Straße 52, 10825 Berlin, avo.schoenbohm@hwr-berlin.de, +49 (0) 30 30877-
1144
2IMB Institute of Management Berlin Working paper No. 72
Hochschule für Wirtschaft und Recht Berlin - Berlin School of Economics and Law
Abstract:
This teaching note provides an overview and a technical introduction to the mechanics of financial
statement and ratio analysis, and offers an outlook into related areas. The BASF SE financial data
2011 are analyzed to illustrate the techniques of financial performance analysis and discusses action
levers to enhance the performance of a business. This teaching note is especially written for
undergraduate students in Management Accounting. However, it might serve well as an introduction to
strategic performance management on graduate level for students without deep financial or
management accounting background.
Zusammenfassung:
Dieser pädagogische Artikel bietet einen Überblick und eine technische Einführung in die Mechanik
der Finanz- und Kennzahlenanalyse von Unternehmen. Darüber hinaus wird ein Ausblick in
angrenzende Forschungsgebiete aufgezeigt. Zur Verdeutlichung des Konzeptes werden die Zahlen
des Jahresberichtes der BASF SE von 2011 analysiert und Hebel zur Verbesserung der Kennzahlen
und der Leistung von Unternehmen diskutiert. Der vorliegende Artikel wurde insbesondere für
Studierende in der Vertiefung Controlling auf Bachelor-Niveau geschrieben. Er kann allerdings auch
gut als Einleitung für strategische Controlling-Fragen für Masterstudierende genutzt werden, die nicht
über vertiefte Finanz- bzw. Controllingkenntnisse verfügen bzw. diese auffrischen wollen.
3IMB Institute of Management Berlin Working paper No. 72
Hochschule für Wirtschaft und Recht Berlin - Berlin School of Economics and Law
Table of contents
1. Introduction and learning objectives ............................................................................................... 5
2. Horizontal and vertical analysis ...................................................................................................... 6
3. Using ratios to make decisions ..................................................................................................... 12
3.1. Measuring the ability to pay back debt ................................................................................. 13
3.2. Measuring working capital efficiency.................................................................................... 15
3.3. Measuring profitability .......................................................................................................... 16
4. Warning signals in financial statements ....................................................................................... 19
5. Limitations of financial ratio analysis and further sources of information ..................................... 20
References ............................................................................................................................................ 22
List of figures and tables........................................................................................................................ 23
Working Papers des Institute of Management Berlin an der Hochschule für Wirtschaft und Recht Berlin
............................................................................................................................................................... 24
4IMB Institute of Management Berlin Working paper No. 72
Hochschule für Wirtschaft und Recht Berlin - Berlin School of Economics and Law
1. Introduction and learning objectives
Management accounts might be regarded as performance agents helping the company to achieve its
desired performance. But what is performance and what are the commonly accepted measures of
performance? Financial statements are the condensed performance reports of companies. They are
based on the accounting data which form the language of business and are described in line with
generally accepted accounting principles (US GAAP, IFRS, HGB, etc.). They can provide the initiated
reader (be it as (prospective) shareholder, competitor or employee) with valuable insights about the
1
financial vitality and value of a company. Companies are under scrutiny by banks as well as
investors, and subject to performance expectations that are largely expressed in accounting ratios.
Graduates in Business Administration and future management accountants need to be able to read,
analyze and interpret financial statements in order to prepare and make informed management
decisions, and find levers for action to improve the company’s performance.
Figure 1: Paper overview
The data for the financial statement analysis can be found in the company’s income statement,
balance sheets and cash flow statement. These data are easily accessible via the investor relations
sections of all publicly traded companies. We will use data from BASF SE’s 2011 annual Integrated
2
Report 2011 to illustrate our analysis.
After studying this Teaching Note, students should be able to perform a horizontal and vertical
analysis of financial statements of a company, compute the most important accounting ratios and
critically assess and compare the financial performance of an analyzed company.
1 Standard textbooks in Accounting and Finance are also explaining ratio analysis. See for example Horngren et al. (2011), and
Brealy et al (2010).
2 See BASF (2012).
5IMB Institute of Management Berlin Working paper No. 72
Hochschule für Wirtschaft und Recht Berlin - Berlin School of Economics and Law
2. Horizontal and vertical analysis
A good starting point for the performance appraisal of the company is the income statement. Of
particular interest are the sales (“top line”) and the net income (“bottom line”). A negative net income
indicates that the company has been in trouble and is destroying value. Many decisions hinge on the
development of these numbers. Do we need to boost sales or cut costs?
BASF Report 2011
Consolidated statements of income (million €) 2011 2010 Change
Sales 73,497 63,873 15.07%
Cost of sales (53,986) (45,310) 19%
Gross profit on sales 19,511 18,563 5%
Selling expenses (7,323) (6,700) 9%
General and administrative expenses (1,315) (1,138) 16%
Research and development expenses (1,605) (1,492) 8%
Other operating income 2,008 1,140 76%
Other operating expenses (2,690) (2,612) 3%
Income from operations 8,586 7,761 11%
Other Income, net 984 299 229%
Interest income 189 150 26%
Interest expense (763) (773) -1%
Other financial income 909 866 5%
Other financial expenses (935) (930) 1%
Financial result 384 (388) -199%
Income before taxes and minority interests 8,970 7,373 22%
Income taxes (2,367) (2,299) 3%
Income before minority interests 6,603 5,074 30%
Minority interests (415) (517) -20%
Net income 6,188 4,557 36%
Table 1: BASF income statement 2011
However, by looking at one year’s numbers alone, we only gain a limited view. Therefore, one often
considers the historical percentage change. The study of percentage changes in comparative
statements is also called horizontal analysis. It is calculated in two steps, illustrated by the
computation of the sales change.
1. The change amount is calculated: € 73,497 (2011) - € 63,878 (2010) = € 9,624 (increase).
2. The change amount in EUR is divided by the amount of the base period (2010): € 9,624 / €
63,873 = 0.1507 ≈ 15 %
Trend percentages are another form of horizontal analysis. How have sales changed over the past
years? Derived from the data provided by BASF for the past ten years, we can see that BASF has
more than doubled its sales over that period of time.
A “smoothed” growth rate is the compound annual growth rate (CAGR). It shows the average annual
th
growth rate over a period of time. The CAGR is calculated by taking the n root of the total percentage
6IMB Institute of Management Berlin Working paper No. 72
Hochschule für Wirtschaft und Recht Berlin - Berlin School of Economics and Law
growth rate, where n is the number of years in the period being considered, as described in the
following formula.
ࡱࢊࢍ࢜ࢇ࢛ࢋሺሻ ͓ࢌ࢟ࢋࢇ࢙࢘
ࡳࡾ ൌ ൨ െ
ࢋࢍࢍ࢜ࢇ࢛ࢋሺሻ
BASF 2002 2003 2004 2005 2006 2007 2008 2009 2010 2011
Sales 32,216 33,361 37,537 42,745 52,610 57,951 62,304 50,693 63,873 73,497
Trend percentage 100% 104% 117% 133% 163% 180% 193% 157% 198% 228%
CAGR = [(73,497/32,216)^0.1] - 1 = 9%
Figure 2: BASF 10 year sales history
The sales CAGR of BASF over the last ten years was around 9 %. This growth ratio can be compared
with other companies and competitors (benchmarking) to see how BASF did in comparison to its
peers or companies from other industries.
BASF 2002 2003 2004 2005 2006 2007 2008 2009 2010 2011
Net income 1,504 910 2,004 3,007 3,215 4,065 2,912 1,410 4,557 6,188
Trend percentage 100% 61% 133% 200% 214% 270% 194% 94% 303% 411%
CAGR = [(6,188/1,504)^0.1] - 1 = 15%
Figure 3: BASF 10 year net income history
Even more impressive is the net income CAGR being 15 % during the same period. BASF has grown
at a high rate and has managed to become even more profitable.
Whereas the horizontal analysis reveals changes over time, the vertical analysis shows the
relationship of each item of the statements in percentage to its base. The base of the income
statement is sales, while total assets are the base of the balance sheet analysis. To start with the
income statement, the formula for each item is calculated as follows:
݉݁ݐ݅ݐ݊݁݉݁ݐܽݐݏ݄݁݉ܿ݊݅ܿܽܧ
ܸ݁ݏ݅ݏݕ݈݈ܽ݊ܽܽܿ݅ݐݎΨ ൌ
ܰ݁ݏ݈݁ܽݏݐ
Let us have a look at some key figures from the vertical analysis (see table 2):
§ Cost of sales: In “classic” accounting terms this line is called cost of goods sold. All direct
costs (material and wages) and manufacturing overhead costs are included here (based on
the absorption costing logic).
§ Gross profit: Difference between sales and cost of sales. It indicates how much a business
earns from the sales of its products and services to be able to pay for the indirect costs like
R&D or general administration costs.
7IMB Institute of Management Berlin Working paper No. 72
Hochschule für Wirtschaft und Recht Berlin - Berlin School of Economics and Law
BASF Report 2011
Consolidated statements of income (million €) 2011 % of Sales 2010 % of Sales
Sales 73,497 100% 63,873 100.00%
Cost of sales (53,986) 73% (45,310) 70.94%
Gross profit on sales 19,511 27% 18,563 29.06%
Selling expenses (7,323) 10% (6,700) 10.49%
General and administrative expenses (1,315) 2% (1,138) 1.78%
Research and development expenses (1,605) 2% (1,492) 2.34%
Other operating income, net (682) -1% (1472) 2.30%
Income from operations 8,586 12% 7,761 12.15%
Other Income, net 984 1% 299 0.47%
Interest income 189 0% 150 0.23%
Interest expense (763) 1% (773) 1.21%
Other financial income, net (26) 0% (64) 0.10%
Financial result 384 1% (388) 0.61%
Income before taxes and minority interests 8,970 12% 7,373 11.54%
Income taxes (2,367) 3% (2,299) 3.60%
Income before minority interests 6,603 9% 5,074 7.94%
Minority interests (415) 1% (517) 0.81%
Net income 6,188 8% 4,557 7.13%
Table 2: BASF vertical income statement
As we can see in table 2, this figure can also be shown as a % of sales. In this case, this figure is
called gross margin. In the case of BASF, we see that in 2011 the gross margin slightly decreased,
probably due to higher material (oil based) costs. In general, a large drop in the gross margin is
perceived as an alarming signal to investors. Decreasing profitability may lead to lower net income,
lower dividend payments and a lower share price. We can see other percentages of special expenses
like R&D or interest payments, which seem to be under control at BASF.
The vertical analysis tells us about the business model of a company. A service company has very
little cost of sales and a pharmaceutical company has typically a lower percentage of cost of sales but
makes up for it by substantially higher sales (marketing) and R&D expenses.
Net income as % of sales is also often referred to as return on sales (RoS). It shows how much the
company retains from each € sold. The RoS is alternatively calculated by using the income from
operations or EBIT (earnings before interest and taxes). This % is also called the EBIT margin and
can be well used for comparing different companies, since it shows the profitability of the business
regardless of the financial structure and the applied tax scheme.
To put the numbers in perspective, it is essential to compare them with data of competitors.
Comparing BASF with Dow Chemicals (see below), we can see that BASF has almost double the
gross margin than Dow and almost double the RoS.
8IMB Institute of Management Berlin Working paper No. 72
Hochschule für Wirtschaft und Recht Berlin - Berlin School of Economics and Law
BASF versus DOW CHEMICAL 2011 BASF DOW CHEMICAL
in million € in million $
Consolidated statements of income 2011 % of Sales 2010 % of Sales
Sales 73,497 100% 59,985 100.00%
Cost of sales (53,986) 73% 51,029 85.07%
Gross profit on sales 19,511 27% 8,956 14.93%
SG&A (8,638) 12% (2,788) -4.65%
Research and development expenses (1,605) 2% (1,646) -2.74%
Other operating income, net (682) -1% (843) -1.41%
Income from operations 8,586 12% 3,679 6.13%
Other Income, net 984 1% 1223 2.04%
Interest income 189 0% 40 0.07%
Interest expense (763) 1% (1341) -2.24%
Other financial income, net (26) 0% 0 0.00%
Financial result 384 1% (78) -0.13%
Income before taxes and minority interests 8,970 12% 3,601 6.00%
Income taxes (2,367) 3% (817) -1.36%
Income before minority interests 6,603 9% 2,784 4.64%
Minority interests (415) 1% (42) -0.07%
Net income 6,188 8% 2,742 4.57%
3
Table 3: BASF vs. Dow Chemical income statement 2011
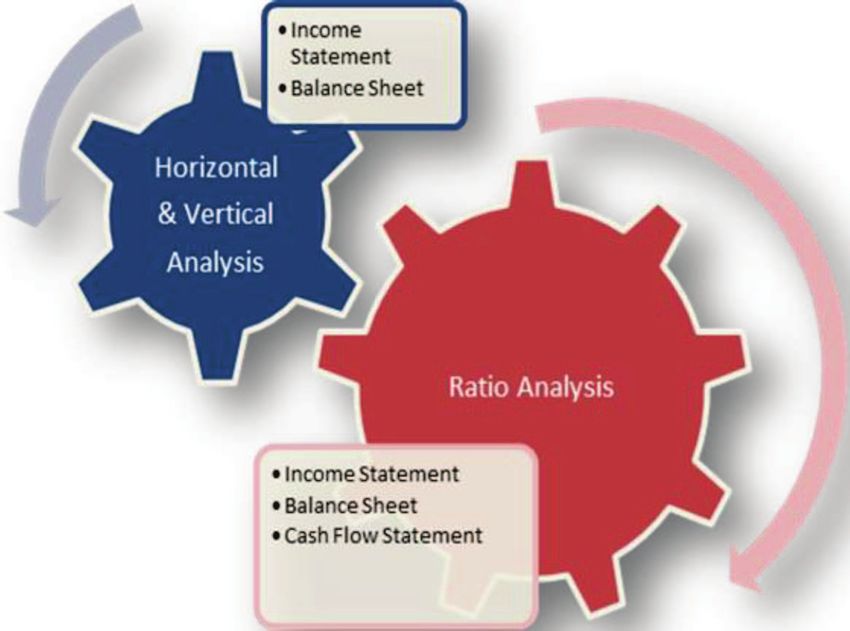
The statement of the pure percentages is well suited for the comparison of different companies. They
are also called common-size statements (see figure 4).
Figure 4: Common size statements BASF vs. Dow Chemical
The vertical analysis of BASF’s balance sheet reveals a strong balance sheet with an equity
percentage of 41%. A high equity portion and long-term liabilities (32%) signal a very conservative
balance sheet approach, well braced for the short-term turmoil of another financial crisis. It is
interesting to note, that banks, following a substantially riskier business approach have equity ratios of
less than 10%. At this rate, industrial companies would probably not get any loans, run into trouble
with their suppliers due to a lack of credit-worthiness and ultimately head for bankruptcy.
3 Dow Chemical’s data are also available online. See Dow Chemical (2012), pp. 169-174.
9IMB Institute of Management Berlin Working paper No. 72
Hochschule für Wirtschaft und Recht Berlin - Berlin School of Economics and Law
Intangible assets form 19% of total assets at BASF in 2011. Generally speaking, a high percentage of
intangible assets such as that of BASF might cause worries, as they could be considered to be
“worthless” or at least difficult to transform into cash. At BASF, these assets could be patents (due to
research) or goodwill (due to acquisitions). Investors would probably have a closer look at these
positions.
The high and growing percentage (44%) of short term assets, mainly inventories (16%) and accounts
receivables (16%) might be a reason for operational concern and a lever for optimizing the supply
chain. However, we need more operational insight to understand the reasons behind the figures.
BASF Report 2011 (Simplified)
Assets (million €)
December 31, 2011 % of Total December 31, 2010 % of Total
Intangible assets 11,919 19% 12,245 21%
Property, plant and equipment 17,966 29% 17,241 29%
Other long term assets 4,202 7% 5,046 8%
Long-term assets 34,087 56% 34,532 58%
Inventories 10,059 16% 8,688 15%
Accounts receivable, trade 10,886 18% 10,167 17%
Other short term assets 4,095 7% 4,513 8%
Cash and cash equivalents 2,048 3% 1,493 3%
Short-term assets 27,088 44% 24,861 42%
Total assets 61,175 100% 59,393 100%
Equity and liabilities (million €)
December 31, 2011 % of Total December 31, 2010 % of Total
Equity of shareholders of BASF SE 24,139 39% 21,404 36%
Minority interests 1,246 2% 1,253 2%
Equity 25,385 41% 22,657 38%
Long-term liabilities 19,313 32% 21,168 36%
Accounts payable, trade 5,121 8% 4,738 8%
Other Short-term liabilities 11,356 19% 10,830 18%
Short-term liabilities 16,477 27% 15,568 26%
Total equity and liabilities 61,175 100% 59,393 100%
Table 4: BASF vertical balance sheet 2011
To put the balance sheet data into perspective, it is often helpful to compare them with a main
4
competitor. In this case the benchmarking with Dow Chemical is quite interesting. We immediately
recognize the substantially higher share of intangible assets and the higher amount of long-term
liabilities at the expense of equity.
4 See Dow Chemical (2012) for the data.
10IMB Institute of Management Berlin Working paper No. 72
Hochschule für Wirtschaft und Recht Berlin - Berlin School of Economics and Law
Benchmarking BASF Report 2011 vs. Dow Chemical
BASF DOW CHEMICAL
Assets in million € in million $
December 31, 2011 % of Total December 31, 2011 % of Total
Intangible assets 11,919 19% 21,446 31%
Property, plant and equipment 17,966 29% 17,299 25%
Other long term assets 4,202 7% 7,057 10%
Long-term assets 34,087 56% 45,802 66%
Inventories 10,059 16% 7,577 11%
Accounts receivable, trade 10,886 18% 4,900 7%
Other short term assets 4,095 7% 5,501 8%
Cash and cash equivalents 2,048 3% 5,444 8%
Short-term assets 27,088 44% 23,422 34%
Total assets 61,175 100% 69,224 100%
Equity and liabilities
Equity of shareholders 24,139 39% 22,281 32%
Minority interests 1,246 2% 1,010 1%
Equity 25,385 41% 23,291 34%
Long-term liabilities 19,313 32% 32,299 47%
Accounts payable, trade 5,121 8% 4,778 7%
Other Short-term liabilities 11,356 19% 8,856 13%
Short-term liabilities 16,477 27% 13,634 20%
Total equity and liabilities 61,175 100% 69,244 100%
Table 5: BASF vs. Dow Chemical balance sheet
In order to complement the first glance analysis of BASF, we look at the consolidated statement of
cash flows. “Profit is opinion, cash is fact.” goes the saying amongst investors. Therefore, they
carefully analyze the cash flow statement and in particular the line of the cash provided by operating
activities (operating cash flow) and the net changes in cash. Is the company producing a decent
stream of cash to invest, pay its debts and shareholders and to build up a cash pile for future needs?
BASF generated 7.1 billion euro as operating cash flow in 2011, which was used for the above
mentioned purposes. It is obvious that BASF is in a healthy cash generating position. Negative
operating cash flows are reason for panic amongst investors. The respective company is “burning”
5
cash, which will eventually lead to bankruptcy even if the company looks still profitable.
5 See Alirezea et al (2012) for the prediction power of financial ratios to predict financial crises of companies.
11IMB Institute of Management Berlin Working paper No. 72
Hochschule für Wirtschaft und Recht Berlin - Berlin School of Economics and Law
BASF Report 2011
Consolidated statements of cash flows (million €)
2011 2010
Net income 6,188 4,557
Depreciation and amortization of intangible assets, property, plant and 3,419 3,393
Changes in inventories (1,239) (1,341)
Changes in receivables (45) (1,839)
Changes in operating liabilities and other provisions 378 1,500
Changes in pension provisions, defined benefit assets
and other non-cash items (68) 273
Net gains from disposal of long-term assets and securities (1,528) (83)
Cash provided by operating activities 7,105 6,460
Payments related to intangible assets and property, plant and equipment (3,410) (2,548)
Payments related to financial assets and securities (346) (480)
Payments related to acquisitions (148) (605)
Proceeds from divestitures 665 43
Proceeds from the disposal of long-term assets and securities 1,501 874
Cash used in investing activities (1,738) (2,716)
Capital increases/repayments and other equity transactions 32 (18)
Proceeds from the addition of financial liabilities 2,306 3,679
Repayment of financial liabilities (4,678) (5,974)
Dividends paid
To shareholders of BASF SE (2,021) (1,561)
To minority shareholders (457) (370)
Cash used in financing activities (4,818) (4,244)
Net changes in cash and cash equivalents 549 (500)
Effects on cash and cash equivalents
From foreign exchange rates 9 86
From changes in scope of consolidation (3) 72
Cash and cash equivalents at the beginning of the year 1,493 1,835
Cash and cash equivalents at the end of the year 2,048 1,493
Table 6: BASF cash flow statement 2011
3. Using ratios to make decisions
The internet has created unmatched transparency about financial data of corporations. It has become
very easy to compare accounting ratios as mentioned above. Out of the plethora of key ratios each
company and investor chooses a certain set to display the performance of a company. In the following
chapter we will discuss the most commonly used financial ratios measuring:
1. the ability to pay back long-term and short-term liabilities (and avoid insolvency/bankruptcy),
2. the ability to sell inventory and collect receivables (efficiency ratios),
3. the profitability and investment opportunity of a company.
The transparency of performance is valuable for analysis. The more important question, however, is:
What can we do to influence ratios into a desired direction?
12IMB Institute of Management Berlin Working paper No. 72
Hochschule für Wirtschaft und Recht Berlin - Berlin School of Economics and Law
3.1. Measuring the ability to pay back debt
Most companies have long-term debt (bank or bond loans) which is not due within the time frame of
one year. Additionally, we will typically find short-term liabilities (former long-term liabilities that are
close to maturity date), and trade payables, the company owe to its suppliers. In order to assess the
creditworthiness of a company, from the perspective of a potential supplier, bond investor or bank, it is
recommended to analyze ratios giving hints about the ability of a company to pay back its debt.
The first and most intuitive ratio is the debt ratio. Which percentage of total assets is financed by debt?
Or to use the definition of the equity ratio: Which percentage of total assets is financed by equity which
will pay for potential losses and guarantee for the repayment of outstanding loans?
The debt ratio for BASF in 2011 is easy to calculate:
ܶͻͳ ݏ݁݅ݐ݈ܾ݈݈݅݅ܽ݅ܽݐǡ͵ͳ͵ሺ݈݃݊ሻ ͳǡͶሺݐݎ݄ݏሻ
݅ݐܽݎݐܾ݁ܦൌ ൌ ൌ ͷͻΨ
ܶݏݐ݁ݏݏ݈ܽܽݐ ͳǡͳͷ
A debt ratio of less than 60% is not high. Dow Chemical had a debt ratio of 66%. The German small
and middle-sized enterprises (SMEs) are notorious for having a relatively high debt ratio of more than
75%. Banks often have a debt ratio of more than 90%.The quantity of debt used to finance a firm's
assets is also called the leverage. A firm with considerably more debt than equity is considered to be
highly leveraged. Although the leverage effect might have positive connotations in finance: Higher
debt leads to higher interest payments and a lower credit worthiness of a company. What can be done
to decrease the debt ratio, or to deleverage? The most obvious and intuitive measure is to raise
equity. However, this is the politically and economically most difficult approach. A change in the
dividend policy might eventually lead to higher retained earnings and thus slowly increases equity.
Thus, the equity story remains a difficult one. If equity remains stable, the only possible way to bring
down the debt ratio is by selling assets and paying debts. This could be assets not relevant for the
operational business like unused property or financial investments. This would be an easy move,
depending on the salability of the assets. Operational assets could be sold and leased back – this
practice may include selling company trucks, properties, machines and even office material like
computers and copy machines. As a short term measure, this could be rather costly, because it might
be difficult to attain selling prices at book value. One should also take into consideration that the
leasing of operational assets will burden the operational income.
The debt ratio is a good first indicator, but it does not specifically evaluate the ability to pay interest
expense. Analysts use the times-interest-earned ratio to measure the number of times the operating
income can cover the interest expense. Therefore, this ratio is also called the interest-coverage ratio.
The computation for BASF in 2011 works as follows:
13IMB Institute of Management Berlin Working paper No. 72
Hochschule für Wirtschaft und Recht Berlin - Berlin School of Economics and Law
ͺǡͷͺ
െ െ ൌ ൌ ൌ ͳͳǤ͵
͵
This is a very conservative position. BASF SE could pay its interest more than 11 times with its current
income from operations. The long-term norm for U.S. business is in the range of 2.0 to 3.0. Dow
Chemical displays an interest-coverage of 2.7. In order to improve the times-interest-earned ratio, first,
the level of debt has to be reduced by deleveraging. Second, it might be worthwhile to investigate
refinancing alternatives (e.g. bonds), which offer lower interest rates.
If we concentrate on short-term liabilities, a new term comes into play: working capital. It is quickly
defined as current assets minus current liabilities, measuring the ability to pay short-term liability with
short term assets. To make informed decisions based on working capital conditions, management
accountants, analysts and investors create ratios. The most frequently used ratio is the current ratio. It
simply divides a company’s current assets by its current liabilities. In the case of BASF 2011, we get
the following:
ʹǡͲͺͺ
ൌ ൌ ൌ ͳǤͶ
ͳǡͶ
A strong current ratio can be taken as an indicator for a strong financial position, meaning that the
company has sufficient liquid assets to run its operational business. An acceptable level for the current
ratio depends on the industry: Dow Chemical has a current ratio of 1.71 in 2011. In most industries
anything around 1.5 could be seen as the norm, while a current ratio of 2.0 is considered to be very
strong. What has to be done to increase the current ratio? One option is to take a long term loan to
finance the operational business. The new cash injection would per se increase current assets. The
other possibility is to transform current liabilities (bank loans) into long-term loans.
The acid-test ratio (or quick ratio) answers the hypothetical question whether a company would be
able to pay all its current liabilities if they were due immediately. Since this is considered to be a very
tough stress-test, it has been poetically called acid-test. To compute the acid-test ratio, one has to add
cash, short-term investments and net receivables (these are all items that can be quickly transferred
into cash. Note that inventory is not part of this list.) and divide the sum by current liabilities. In the
case of BASF, it looks as follows:
െ ൌ
ʹǡͲͶͺ ͶǡͲͻͷ ͳͲǡͺͺ
െ ൌ ൌ ͳǤͲ͵
ͳǡͶ
14IMB Institute of Management Berlin Working paper No. 72
Hochschule für Wirtschaft und Recht Berlin - Berlin School of Economics and Law
An acid-test ratio of 0.9 to 1.0 is acceptable in most manufacturing industries. Retailers have a con-
siderably lower quick ratio due to their high inventory. Dow Chemical had a quick ratio of 1.2 in 2011.
The difference can be found in the relatively large inventory of BASF. Inventory management is also
the key for increasing the acid-test ratio. Reducing inventory (e.g. end of year sales) and using less
buffer inventory can enhance the acid-test ratio.
3.2. Measuring working capital efficiency
This leads us to more operational working capital ratios measuring the ability to sell inventory and
collect receivables.
Inventory turnover measures how many times a company sells its average inventory during one fiscal
year. A high turnover indicates an ease to sell products, whereas a low turnover could be interpreted
as problematic.
To calculate inventory turnover, we divide cost of goods sold (or cost of sales) by the average
inventory. Why do we use cost of sales/ goods sold instead of the sales number? It is because sales
include the price premium to arrive at the selling price. In order to get to the turnover, the inventory
has to be evaluated at cost and not at selling price.
Let’s take the BASF example for 2011:
ͷ͵ǡͻͺ
ൌ ൌ ൌ ͷǤ
ሺͳͲǡͲͷͻ ͺǡͺͺሻΤʹ
The evaluation of this figure depends on the comparison with other companies. Inventory turnover
varies from industry to industry, with low turnover industries like manufacturing tending to have an
inventory turnover of 3, whereas high turnover industries like natural gas suppliers have a substantially
higher inventory turnover of over 30. Dow Chemical had an inventory turnover of 6.96 in 2011. Being
significantly higher, it is an indicator for working capital efficiency. This corresponds to a build of BASF
inventory of 16 % in 2011, whereas BASF showed only a 15 % increase in sales. Dow Chemical
increased sales in 2011 by 12 % and increased its inventory by only 7 %. It would be premature to
jump to the conclusion that BASF had a sloppy inventory management in 2011, but the development
might merit further scrutiny.
What can be done to increase inventory turnover? Logically it can be enhanced by selling more
without using more average inventory (and thus eventually running the risk of a stock-out). But it might
also depend on old, unsalable inventory, which could be identified over an aging report by ERP-
systems for instant. ERP-systems identify old inventory items and slow sellers. Scrapping low sellers
from the product offering might be an option to increase inventory turnover. The partly or full
15IMB Institute of Management Berlin Working paper No. 72
Hochschule für Wirtschaft und Recht Berlin - Berlin School of Economics and Law
depreciation of items in inventory that are older than a year or two years will also have an (accounting)
effect on inventory turnover.
The other important ingredient of working capital is receivables. By allowing our customers to buy and
pay later we provide a financial service. The ability to collect the outstanding receivables is a key
success factor. Days of sales outstanding (DSO), or days’ sales in receivables, is a popular ratio to
measure the ability to collect receivables. To compute the ratio we follow two steps: First, dividing net
sales of a company by 365 days in order to one average day’s sales. Second, we divide the average
net accounts receivables by one day’s sales. In the case of BASF in 2011, we get the following
picture:
ͳͲǡͺͺ ͳͲǡͳΤʹ ͳͲǡͷʹ
ൌ ൌ ൌ ൌ ͷʹ
ᇱ ͵ǡͶͻΤ͵ͷ ʹͲͳ
52 is a relatively high number stating that the average invoice gets paid within 52 days which is almost
two months. BASF thus finances its customers to a large extent. Dow Chemical had DOS of 29 which
is considerably lower. Of course, it might be relatively easy to reduce the payment terms to 30 days.
However, BASF might lose some customers in this process and eventually accept lower prices for its
products. In small companies the installation of an effective receivables management (which starts
with a creditworthiness check before engaging in a credit sales contract, monitors all receivables with
an aging report and includes an effective dunning system) might be advisable to control this area of
working capital. Big corporations have embedded this into their business processes. One option might
be factoring, where companies sell on their invoices to a third party debt collection agency, which in
turn collect the sales invoices on behalf of the company. In this case all receivables are sold to a
factoring company (usually a bank) at a certain discount. The factoring agency takes care of the
receivables management as well as credit risks and pays cash to the issuing company immediately.
Many companies use factoring to improve cash flow. However, it also releases the administrative
burden of managing a sales ledger department.
3.3. Measuring profitability
Addressing the profitability topic, or the bottom line analysis of a company, we put net income or
operational earnings in proportion to sales, assets or equity. Again, there are many different ways to
do it and we are forced to restrain ourselves to the most basic ratios. We have already discussed
some of the ratios analyzing the vertical income statement.
Return on sales (RoS) is computed as net income divided by net sales. For BASF we get the
following:
16IMB Institute of Management Berlin Working paper No. 72
Hochschule für Wirtschaft und Recht Berlin - Berlin School of Economics and Law
ǡͳͺͺ
ൌ ൌ ͺǤͶΨ
͵ǡͶͻ
Dow Chemical achieved a RoS of 4.6 % in 2011, which is substantially below BASF, meaning BASF
earned, after taxes, more money on each € of sales. To answer the question how profitable BASF
made use of its assets, we compute the return on assets ratio. To do this we add the interest expense
to net income and divide the sum by the average of total assets. Why do we add interest expenses?
Interest expenses were paid for using a part of the assets. To get to the real return on assets, we have
6
to add this payment to get the return regardless of the financing of the capital. For BASF this looks
like this:
ͳͺͺ ͵
ൌ ൌ ൌ ͳͳǤͷΨ
ሺͳǡͳͷ ͷͻǡ͵ͻ͵ሻΤʹ
BASF earned on its assets 11.5 % after tax. The same figure is 5.9 % for Dow Chemical. Again, BASF
seems to be more profitable in relation to its capital use.
Investors are the owners of equity. They have a particular interest in the ratio return on equity (RoE).
What is the return on their investment? Minority Investors might receive preferred dividends that
diminish the return to shareholders. The RoE is therefore defined and computed like this for BASF
2011:
כ ǡͳͺͺ
ൌ ൌ ൌ ʹΨ
ᇱ ሺʹͶǡͳ͵ͻ ʹʹǡʹͺͳሻȀʹ
* Net income without preferred dividends or minority interests.
Dow Chemical has a RoE of 15.2 % in 2011. A return on equity of 15 to 20 % is considered to be
respectable in most industries. BASF proves to be more profitable.
What helps to increase the profitability? The simple answer is reduce costs and increase prices.
However, it seems rather difficult to increase prices without new and innovative products, while cutting
costs in marketing, purchasing, personnel and R&D is rather painful leading to possible negative long-
term consequences. Profitability is a lagging indicator for the overall economic vitality of a company,
depending on its strategy, its products, reputation, execution and personnel performance, to name a
few factors.
The number of financial ratios is long. Open online resources like Bloomberg Business Week provide
free access to many ratios for almost all publicly listed companies. All board and investor
6 A minor flaw in this equation is that the interest expenses also have a tax shield function, which is neglected. The interest
expenses decrease the taxable income and overall income taxes.
17IMB Institute of Management Berlin Working paper No. 72
Hochschule für Wirtschaft und Recht Berlin - Berlin School of Economics and Law
presentations usually include an overview of key financial ratios. In many instances companies use
industry specific ratios or even company specific ratios. The presented 9 ratios are a limited but
representative selection of financial ratios with a focus on management accountants. Left out are
investor related ratios like price-earnings ratio or Total Shareholder Return. Investors take into account
all of these data and the companies’ business outlooks to determine share prices. To assess the
performance of a company, we should not neglect to risk a glance at the share price development
over the last years.
Comparison of share price development between BASF and Dow Chemical:
Figure 5: BASF share price history (Source: http://finance.yahoo.com)
BASF SE more than doubled its share price from 2004 to July 2012. Investors were obviously happy
with the long-term performance of BASF.
Figure 6: Dow Chemical share price history (Source: http://finance.yahoo.com)
18IMB Institute of Management Berlin Working paper No. 72
Hochschule für Wirtschaft und Recht Berlin - Berlin School of Economics and Law
Dow Chemical could not maintain its share price from 2004 and traded in July 2012 more than a third
below its level of 2005. There are many other factors influencing investors than we could analyze
above, but the development does not contradict our findings that BASF indeed is a profitable company
providing decent returns for its shareholders. Please find below an overview of the most important
financial/accounting ratios treated in this teaching note:
Ability to pay short ۱ܛܜ܍ܛܛ܉ܜܖ܍ܚܚܝ
Current
term liabilities with
ratio
current assets ۱ܛ܍ܑܜܑܔܑ܊܉ܑܔܜܖ܍ܚܚܝ
Acid test/ Ability to immediately
Quick ratio pay current liabilities
Ability to pay long-
Debt ratio
term debt
Times
Ability to pay interest
interest
earned
expenses
Inventory The salability of
turnover inventory
Days’s sales
Days it takes to collect
outstanding
DSO
receivables. ᇱ
Return on The net income per €
sales RoS of revenues/ sales
Return on
The profit of the used
assets
RoA
assets/capital
Return on The income per € of
equity RoE shareholders’ equity ᇱ
Table 7: Important accounting ratios
4. Warning signals in financial statements
Accounting scandals like Enron, Worldcom or Parmalat have shaken the trust of many investors in the
7
financial statements of companies. Although the financial statements are audited by third parties (for
big and international corporations this is done by the big four: KPMG, E&Y, PwC or Deloitte), the
skeptical analyst might follow a different approach towards analyzing financial statements searching
for warning signals by asking the following five questions:
§ Does the company have an earnings problem? Has the profitability decreased and has the
company even experienced an operational or net income loss? If this goes together with a
high debt ratio, the company under investigation might not be able to sustain this situation for
long.
7 See Lundstrom (2009) for a perspective on financial statement fraud.
19IMB Institute of Management Berlin Working paper No. 72
Hochschule für Wirtschaft und Recht Berlin - Berlin School of Economics and Law
§ Does the cash flow match the income? Is the cash flow from operations lower than net
income? Does the company refinance itself by selling plant assets? The cash validates the
earnings (remember: “Profit is opinion - cash is fact.”). Signals for cash shortage might
foreshadow insolvency.
§ Does the company build up inventories? An easy way to overstate net income is by
overstating ending inventories. The question is whether the inventory is salable at the
minimum price of cost of goods manufactured, in which production overhead is included. A
decreasing inventory turnover might exacerbate this picture.
§ Do the different operational driven movements in the financial statement fit together?
Sales, inventory and receivables should be fairly correlated in their movement. Higher sales
trigger higher inventory levels and more receivables. Opposing movements should stir
attention.
§ Does the company build up high levels of receivables, it might not be able to collect?
Although there might be legitimate operational reasons for not being able to collect
receivables, the skeptical mind might ask whether the related sales could lead to an inevitable
shortage in cash. A criminal overstatement of fictitious sales might lead to receivables that
never materialize.
External analysts are confronted with substantial information asymmetry. If trust is compromised and
cannot be restored by management, it might be wise not to invest into or do business with a company
that sends out warning signals or red flags.
5. Limitations of financial ratio analysis and further sources of information
Financial ratio analysis helps the analyst to get a first understanding of a company. However, it
remains a very theoretical and past-oriented approach without a deeper understanding of the business
model of a company, the comprehension of the dynamics of the industry and the markets the
company is serving. To serve this information need the annual reports of companies include also non-
financial data in the form of special reporting sections: These are the President’s Letter to
Shareholders, the Management Discussion and Analysis and the Auditor’s Report.
The President’s Letter to the Shareholders gives a personal statement about the state of the company
and informs investors about major changes and strategic directions.
The Management Discussion and Analysis section of section displays management’s explanations
why the financial data developed like they did and provide plans for future developments and strategic
projects. These explanations and forward-looking statements help external analysts to understand and
evaluate financial data. BASF included many non-financial data about its ecological and social
performance of 2011 in this section. This increases the pieces of the jigsaw that have to fit together to
create a harmonious investor story.
20IMB Institute of Management Berlin Working paper No. 72
Hochschule für Wirtschaft und Recht Berlin - Berlin School of Economics and Law
The Auditor’s Report expresses the view of the external auditors as opposed to the insider view
dominating the annual report and the above mentioned sources. In the case of the BASF 2011 report,
the external auditors come after their audits to the following conclusions (see page 141): “… the
Consolidated Financial Statements comply with IFRS…and give a true and fair view of the net asset,
financial position and results…The Management’s Analysis is consistent with the Consolidated
Financial Statements and as a whole provides a suitable view of the Group’s position and suitably
presents the opportunities and risks of future development.” This sounds reassuring.
In order to assess the performance of a company, the financial ratio analysis is a fundamental starting
point. To complement the performance picture, non-financial indicators and assessments about
markets, competitors and internal strategies and processes are presented in the annual report. As an
insider, one could bundle all these data in the form of a balanced scorecard in order to achieve a more
8
holistic overview and actively manage the overall performance of a company.
8 See Cardinaels and van Veen-Dirks (2010) on the effects on displaying financial and non-financial data in the form of a
balanced scorecard.
21References
Alirezea, F., Parviz, M./Sheikhi, M. (2012): Evaluation of the Financial Ratio Capability to Predict the
Financial Crisis of Companies. In: IUP Journal of Behavioral Finance, Vol. 9, No. 1, pp. 57-69.
BASF (2012): BASF Report 2011.
http://www.basf.com/group/corporate/en_GB/function/conversions:/publish/content/about-
th
basf/facts-reports/reports/2011/BASF_Report_2011.pdf, last retrieved January 29 , 2013.
Brealy, R., Myers, S./Allen, F. (2010): Principles of Corporate Finance. McGraw-Hill Higher Education,
th
10 Global Edition, New York.
TM
Dow Chemical (2012): Dow Chemical Annual Report 2011 – Welcome to Solutionism .
http://www.dow.com/investors/pdfs/161-00769_2011_Annual_Report_Final.pdf, last retrieved
st
January 21 , 2013.
Eddy Cardinaelsa, E./van Veen-Dirks, P. (2010): Financial versus non-financial information: The
impact of information organization and presentation in a Balanced Scorecard. In: Accounting,
Organizations and Society, Volume 35, Issue 6, pp. 565 – 578.
th
Horngren, C., Harrison/ W. and Oliver, M. (2011): Accounting, 9 Global Edition, Upper Saddle River,
New Jersey.
Lundstrom, R. (2009): Fraud: Red Flags or “Red Herring”? Telling the Difference. In: Journal of
Forensic Studies in Accounting & Business, Vol. 1, Issue 2, pp. 1 - 38.
22IMB Institute of Management Berlin Working paper No. 49
Hochschule für Wirtschaft und Recht Berlin - Berlin School of Economics and Law
List of figures and tables
Figure 1: Paper overview......................................................................................................................... 5
Figure 2: BASF 10 year sales history ...................................................................................................... 7
Figure 3: BASF 10 year net income history............................................................................................. 7
Figure 4: Common size statements BASF vs. Dow Chemical ................................................................ 9
Figure 5: BASF share price history (Source: http://finance.yahoo.com) ............................................... 18
Figure 6: Dow Chemical share price history (Source: http://finance.yahoo.com) ................................. 18
Table 1: BASF income statement 2011 ................................................................................................... 6
Table 2: BASF vertical income statement ............................................................................................... 8
Table 3: BASF vs. Dow Chemical income statement 2011 ..................................................................... 9
Table 4: BASF vertical balance sheet 2011 .......................................................................................... 10
Table 5: BASF vs. Dow Chemical balance sheet .................................................................................. 11
Table 6: BASF cash flow statement 2011 ............................................................................................. 12
Table 7: Important accounting ratios ..................................................................................................... 19
23IMB Institute of Management Berlin Working paper No. 49
Hochschule für Wirtschaft und Recht Berlin - Berlin School of Economics and Law
Working Papers des Institute of Management Berlin an der Hochschule für Wirtschaft
und Recht Berlin
1 Bruche, Gert/Pfeiffer, Bernd: Herlitz (A) – Vom Großhändler zum PBS-Konzern – Fallstudie, Oktober
1998.
2 Löser, Jens: Das globale Geschäftsfeld „Elektrische Haushaltsgroßgeräte“ Ende der 90er Jahre –
Fallstudie, Oktober 1998.
3 Lehmann, Lutz Lars: Deregulation and Human Resource Management in Britain and Germany – Illus-
trated with Coca-Cola Bottling Companies in Both Countries, March 1999.
4 Bruche, Gert: Herlitz (B) - Strategische Neuorientierung in der Krise - Fallstudie, April 1999.
5 Herr, Hansjörg/Tober, Silke: Pathways to Capitalism - Explaining the Difference in the Economic Devel-
opment of the Visegrad States, the States of the Former Soviet Union and China, October 1999.
6 Bruche, Gert: Strategic Thinking and Strategy Analysis in Business - A Survey on the Major Lines of
Thought and on the State of the Art, October 1999, 28 pages.
7 Sommer, Albrecht: Die internationale Rolle des Euro, Dezember 1999, 31 pages.
8 Haller, Sabine: Entwicklung von Dienstleistungen - Service Engineering und Service Design, Januar
2000.
9 Stock, Detlev: Eignet sich das Kurs-Gewinn-Verhältnis als Indikator für zukünftige
Aktienkursveränderungen?, März 2000.
10 Lau, Raymond W.K.: China’s Privatization, June 2000.
11 Breslin, Shaun: Growth at the Expense of Development? Chinese Trade and Export-Led Growth Recon-
sidered, July 2000, 30 pages.
12 Michel, Andreas Dirk: Market Conditions for Electronic Commerce in the People’s Republic of China and
Implications for Foreign Investment, July 2000, 39 pages.
13 Bruche, Gert: Corporate Strategy, Relatedness and Diversification, September 2000, 34 pages.
14 Cao Tingui: The People's Bank of China and its Monetary Policy, October 2001, 21 pages.
15 Herr, Hansjörg: Wages, Employment and Prices. An Analysis of the Relationship Between Wage Level,
Wage Structure, Minimum Wages and Employment and Prices, June 2002, 60 pages.
16 Herr, Hansjörg/Priewe, Jan (eds.): Current Issues of China’s Economic Policies and Related International
Experiences – The Wuhan Conference 2002 - , February 2003, 180 pages.
17 Herr, Hansjörg/Priewe, Jan: The Macroeconomic Framework of Poverty Reduction An Assessment of the
IMF/World Bank Strategy, February 2003, 69 pages.
18 Wenhao, Li: Currency Competition between EURO and US-Dollar, June 2004, 18 pages.
19 Kramarek, Maciej: Spezifische Funktionen des Leasings in der Transformationsperiode, Juni 2004, 32
pages.
20 Godefroid, Peter: Analyse von Multimedia-Lern/Lehrumgebungen im Fach Marketing im
englischsprachigen Bereich – inhaltlicher Vergleich und Prüfung der Einsatzfähigkeit an deutschen
Hochschulen, September 2004, 48 pages.
21 Kramarek, Maciej: Die Attraktivität des Leasings am Beispiel polnischer Regelungen der
Transformationsperiode, April 2005, 33 pages.
22 Pan, Liu/Tao, Xie: The Monetary Policy Transmission in China – „Credit Channel” and its Limitations.
23 Hongjiang, Zhao/Wenxu, Wu/Xuehua, Chen: What Factors Affect Small and Medium-sized Enterprise’s
Ability to Borrow from Bank: Evidence from Chengdu City, Capital of South-western China’s Sichuan
Province, May 2005, 23 pages.
24 Fritsche, Ulrich: Ergebnisse der ökonometrischen Untersuchung zum Forschungsprojekt
Wirtschaftspolitische Regime westlicher Industrienationen, March 2006, 210 pages.
25 Körner, Marita: Constitutional and Legal Framework of Gender Justice in Germany, November 2006, 14
pages.
26 Tomfort, André: The Role of the European Union for the Financial Integration of Eastern Europe, De-
cember 2006, 20 pages.
27 Gash, Vanessa/Mertens, Antje/Gordo, Laura Romeu: Are Fixed-Term Job Bad for Your Health? A Com-
parison between Western Germany and Spain, March 2007, 29 pages.
28 Kamp, Vanessa/Niemeier, Hans-Martin/Müller, Jürgen: Can we Learn From Benchmarking Studies of
Airports and Where do we Want to go From Here? April 2007, 43 pages.
29 Brand, Frank: Ökonomische Fragestellungen mit vielen Einflussgrößen als Netzwerke. April 2007, 28
pages.
30 Venohr, Bernd/Klaus E. Meyer: The German Miracle Keeps Running: How Germany’s Hidden Champi-
ons Stay Ahead in the Global Economy. May 2007, 31 pages.
31 Tomenendal, Matthias: The Consultant-Client Interface - A Theoretical Introduction to the Hot Spot of
Management Consulting. August 2007, 17 pages.
32 Zenglein, Max J.: US Wage Determination System. September 2007, 30 pages.
33 Figeac, Alexis: Socially Responsible Investment und umweltorientiertes Venture Capital. December
2007, 45 pages.
34 Gleißner, Harald A.: Post-Merger Integration in der Logistik - Vom Erfolg und Misserfolg bei der
Zusammenführung von Logistikeinheiten in der Praxis. March 2008, 27 pages.
35 Bürkner, Fatiah: Effektivitätssteigerung im gemeinnützigen Sektor am Beispiel einer regionalen ‚Allianz
für Tanz in Schulen’. April 2008, 29 pages.
24IMB Institute of Management Berlin Working paper No. 49
Hochschule für Wirtschaft und Recht Berlin - Berlin School of Economics and Law
36 Körner, Marita: Grenzüberschreitende Arbeitsverhätnisse - Grundlinien des deutschen Internationalen
Privatrechts für Arbeitsverträge. April 2008, 22 pages.
37 Pan, Liu/Junbo, Zhu: The Management of China’s Huge Foreign Reserve and ist Currency Composition.
April 2008, 22 pages.
38 Rogall, Holger: Essentiales für eine nachhaltige Energie- und Klimaschutzpolitik. May 2008, 46 pages.
39 Maeser, Paul P.: Mikrofinanzierungen - Chancen für die Entwicklungspolitik und Rahmenbedingungen
für einen effizienten Einsatz. May 2008, 33 pages.
40 Pohland, Sven/Hüther, Frank/Badde, Joachim: Flexibilisierung von Geschäftsprozessen in der Praxis:
Case Study „Westfleisch eG - Einführung einer Service-orientierten Architektur (SOA). June 2008, 33
pages.
41 Rüggeberg, Harald/Burmeister, Kjell: Innovationsprozesse in kleinen und mittleren Unternehmen. June
2008, 37 pages.
42 Domke, Nicole/Stehr, Melanie: Ignorieren oder vorbereiten? Schutz vor Antitrust Verstößen durch
Compliance“-Programme. June 2008, 25 pages.
43 Ripsas, Sven/Zumholz, Holger/Kolata, Christian: Der Businessplan als Instrument der
Gründungsplanung - Möglichkeiten und Grenzen. December 2008, 34 pages.
44 Jarosch, Helmut: Optimierung des Zusammenwirkens maschineller und intellektueller Spezialisten.
January 2009, 35 pages.
45 Kreutzer, Ralf T./Salomon, Stefanie: Internal Branding: Mitarbeiter zu Markenbotschaftern machen –
dargestellt am Beispiel von DHL. February 2009, 54 pages.
46 Gawron, Thomas: Formen der überörtlichen Kooperation zur Steuerung der Ansiedlung und Erweiterung
von großflächigen Einzelhandelsvorhaben. April 2009, 43 pages.
47 Schuchert-Güler, Pakize: Aufgaben und Anforderungen im persönlichen Verkauf: Ergebnisse einer
Stellenanzeigenanalyse. April 2009, 33 pages.
48 Felden, Birgit/Zumholz, Holger: Managementlehre für Familienunternehmen – Bestandsaufnahme der
Forschungs- und Lehraktivitäten im deutschsprachigen Raum. July 2009, 23 pages.
49 Meyer, Susanne: Online-Auktionen und Verbraucherschutzrecht – ein Rechtsgebiet in Bewegung.
Zugleich ein Beitrag zu Voraussetzungen und Rechtsfolgen des Widerrufsrechts bei Internetauktionen.
December 2009, 29 pages.
50 Kreutzer, Ralf T.: Konzepte und Instrumente des B-to-B-Dialog-Marketings. December 2009, 40 pages.
51 Rüggeberg, Harald: Innovationswiderstände bei der Akzeptanz hochgradiger Innovationen aus kleinen
und mittleren Unternehmen. December 2009, 31 pages.
52 Kreutzer, Ralf T.: Aufbau einer kundenorientierten Unternehmenskultur. December 2009, 59 pages.
53 Rogall, Holger/Oebels, Kerstin: Von der Traditionellen zur Nachhaltigen Ökonomie, June 2010, 28
pages.
54 Weimann, Andrea: Nutzung von Mitarbeiterpotenzialen durch Arbeitszeitflexibilisierung – Entwicklung
eines optimierten Arbeitszeitmodells für eine Abteilung im Einzelhandel, June 2010, 35 pages.
55 Bruche, Gert: Tata Motor’s Transformational Resource Acquisition Path – A Case Study of Latecomer
Catch-up in a Business Group Context, October 2010, 28 pages.
56 Frintrop, Philipp/Gruber, Thomas: Working Capital Management in der wertorientierten
Unternehmenssteuerung bei Siemens Transformers, November 2010, 35 pages.
57 Tolksdorf, Michael: Weltfinanzkrise: Zur Rolle der Banken, Notenbanken und „innovativer
Finanzprodukte“, November 2010, 20 pages.
58 Kreutzer, Ralf T./Hinz ,Jule: Möglichkeiten und Grenzen von Social Media Marketing, December 2010,
44 pages.
59 Weyer,Birgit: Perspectives on Optimism within the Context of Project Management: A Call for Multilevel
Research, January 2011, 30 pages.
60 Bustamante, Silke: Localization vs. Standardization: Global approaches to CSR Management in multina-
tional companies, March 2011, 29 pages.
61 Faltin, Günter/Ripsas, Sven: Das Gestalten von Geschäftsmodellen als Kern des Entrepreneurship, April
2010, 22 pages.
62 Baumgarth, Carsten/Binckebanck, Lars: CSR-Markenmanagement – Markenmodell und Best-Practice-
Fälle am Beispiel der Bau- und Immobilienwirtschaft, September 2011, 46 pages
63 Lemke, Claudia: Entwurf eines Modells zur serviceorientierten Gestaltung von kleinen IT-Organisationen
in Forschungseinrichtungen Theoretische Überlegungen und methodische Konzeption als erste
Ergebnisse eines Forschungsprojektes an der HWR Berlin, October 2011, 43 pages
64 Greiwe, Joris/Schönbohm, Avo: A KPI based study on the scope and quality of sustainability reporting by
the DAX 30 companies, November 2011, 31 pages
65 Lemke, Claudia: Auszug aus der Modellierung des IT-Dienstleistungsmodells „proITS“ am Beispiel der
Struktur von Forschungseinrichtungen und deren IT-Service – Erkenntnisse aus einem
Forschungsprojekt an der HWR Berlin, February 2012, 46 pages.
66 Grothe, Anja/Marke, Nico: Nachhaltiges Wirtschaften in Berliner Betrieben – Neue Formen des
Wissenstransfers zwischen Hochschule und Unternehmen, March 2012, 40 pages.
67 Meyer, Susanne/Fredrich, Jan: Rechtsgrundlagen einer Pflicht zur Einrichtung einer Complance-
Organisation, May 2012, 19 pages.
68 Schönbohm, Avo/Hofmann, Ulrike: Comprehensive Sustainability Reporting – A long road to go for
German TecDax 30 companies, June 2012, 23 pages.
69 Baumgarth, Carsten/Kastner, Olga Louisa: Pop-up-Stores im Modebereich: Erfolgsfaktoren einer
vergänglichen Form der Kundeninspiration, July 2012, 33 pages.
25You can also read