Analysis of Current and Expected Rental Shortfall and Potential Evictions in the U.S - Prepared for: National Council of State Housing Agencies ...
←
→
Page content transcription
If your browser does not render page correctly, please read the page content below
Analysis of Current and Expected
  Rental Shortfall and Potential
              Evictions in the U.S.
             Prepared for: National Council of
                     State Housing Agencies

                           September 25, 2020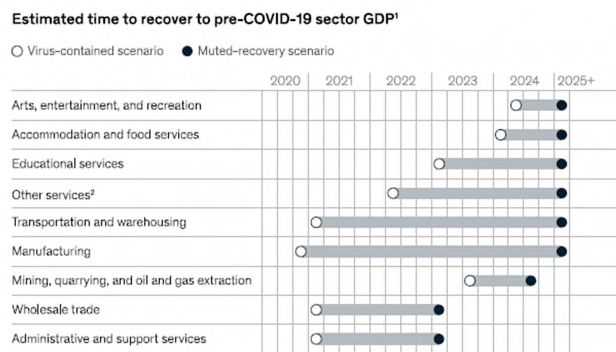
Table of Contents
Executive Summary ......................................................................................................... 3
Analysis of Rent Shortfall ................................................................................................ 6
Statement of Methodology .............................................................................................. 9
  Sources Underlying the Analysis................................................................................... 9
  Key Assumptions Driving Estimate of At-Risk Renter Households............................. 10
  Key Assumptions Driving Estimate of Rent Shortfall ................................................. 13
The Role of Economic Recovery in Estimating Renter Housing Stability and Rent Shortfall
...................................................................................................................................... 15
   The Economic Impact of COVID-19 .......................................................................... 16
   Current Renter Household Instability ....................................................................... 25
   CDC Eviction Moratorium ......................................................................................... 27
   Conclusion................................................................................................................. 29
   Assumptions and Limiting Conditions ...................................................................... 29
Additional Supporting Data Sources and Considerations .............................................. 30
State-by-State Analysis ................................................................................................. 35
Section I
Executive Summary
The COVID-19 pandemic has created both a public health crisis and an economic crisis in the
United States. As of September 21, 2020, there have been more than 6.9 million confirmed
COVID-19 cases and more than 200,000 reported COVID-19 deaths in the United States.1 The
effects of the pandemic on the economy have been “unprecedented in scale: the pandemic has
created a demand shock, a supply shock, and a financial shock all at once.”2 Record levels of
gross domestic product (GDP) decline and job loss were observed in the second quarter of 2020.
Economists predict that the path to economic recovery will take longer than initially expected
and may be “U-shaped” or “swoosh-shaped,” recognizing that economic recovery has already
begun to stall.3
The hardest hit industries, especially small businesses within these industries, include
Accommodation and Food Services; Educational Services; Arts, Entertainment, and Recreation;
Mining, Quarrying, and Oil and Gas Extraction; and Other Services (except Public
Administration).4 Approximately 44% of small business respondents to the U.S. Census Bureau
Small Business Pulse Survey indicated that they do not expect to return to normal (i.e., pre-
pandemic) operations for six months or more.5
Along with small business owners, renters and individual landlords are also experiencing
financial hardship. A monthly survey by Apartment List that started in June found that for each
of the last four months, approximately 33% of American rental households did not make an on-
time rent payment.6 In July, more than 40% of renters making less than $25,000 missed their
rent payment.7 As a result of these late or missed payments, approximately 66% of renters
expressed concerned about eviction within the next six months.8 Renters and individual
landlords – those owning a few investment properties rather than those with large real estate

1
  Sangameswaran, S. “U.S. surpasses grim milestone of 200,000 COVID-19 deaths.” Reuters. September 21, 2020.
2
  Bauer, Lauren et al. “Ten Facts about COVID-19 and the U.S. Economy.” Brookings Institution. September 17,
2020. Referencing Triggs and Kharas 2020.
3
  Hannon, Paul & Chaudhuri, Saabira. “Why the Economic Recovery Will Be More of a ‘Swoosh’ Than V-Shaped.”
The Wall Street Journal. May 11, 2020; Lambert, Lance. “Recovery or double-dip recession? How the U.S.
economy is doing in 9 charts.” Fortune. August 17, 2020; Davidson, Paul. “What shape is the economic recovery
in: U, V or W?” ABC News. August 13, 2020; Thomson-DeVeaux, Amelia & Paine, Neil. “Don’t Expect A Quick
Recovery. Our Survey Of Economists Says It Will Likely Take Years.” FiveThirtyEight. May 26, 2020.
4
  U.S. Census Bureau Small Business Pulse Survey.
5
  Ibid.
6
  Popov, Igor et al. “32% of Americans Entered August with Unpaid Housing Bills.” Apartment List. August 6,
2020.
7
  Warnock, Rob and Salviati, Chris. “Missed Housing Payments Continue Piling Up In July.” Apartment List. July
8, 2020.
8
  Popov, Igor et al. “32% of Americans Entered August with Unpaid Housing Bills.” Apartment List. August 6,
2020.
                                                                                                             4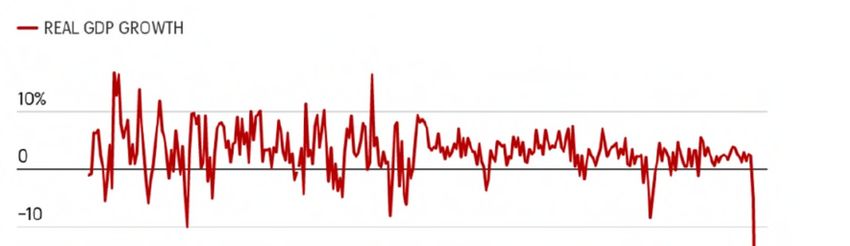
investment companies – likely have limited access to capital and therefore are turning to
making payments via credit cards, borrowing from family and friends, taking out high-interest
payday loans, and depleting their emergency savings funds.9 The uncertainty about whether
rent payments will be made or not likely has both renter households and landlords on edge.
On September 4, 2020, the Centers for Disease Control and Prevention (CDC) issued an Agency
Order to temporarily stop certain residential evictions through December 31, 2020 to prevent
the further spread of COVID-19.10 Stout has conducted a variety of analyses to estimate: (1) the
range of renter households in the United States that are unable to pay rent and are at risk of
eviction; (2) the range of rent shortfall for renter households in the United States that are unable
to pay rent and are at risk of eviction; (3) the range of renter households in the United States
that may experience an eviction filing by January 2021.

Stout estimates that as of September 14, 2020 there are between 9.7 million and 14.2 million
renter households in the United States that may be unable to pay rent and at risk of eviction.
This translates to between approximately 23.3 million and 34.0 million individual renters.
Stout estimates that renter households have already accumulated between $12.2 billion and
$16.7 billion of shortfall in their owed rent.
Stout estimates that by January 2021 the rent shortfall for these households will be between
$25.1 billion and $34.3 billion. 11
Furthermore, Stout estimates that by January 2021, up to 8.4 million renter households,
which include 20.1 million individual renters, could experience an eviction filing.
Given what appears to be a slow economic recovery, it is reasonable to expect ongoing
elevated unemployment, high rent burden among low-income renter households,
continued accumulation of unpaid rent, and continued risk of eviction beyond January 2021.

9
  Dougherty, Conor and Friedman, Gillian. “They’re Making the Rent. Is it Costing Their Future?” The New York
Times. August 21, 2020.
10
   85 FR 55292.
11
   If one were to interpret the Week 14 Household Pulse Survey responses as relating to respondents’ confidence
in their ability to pay September rent, Stout estimates the rent shortfall by January 2021 to be between $30.7
billion and $42.1 billion.
                                                                                                                  5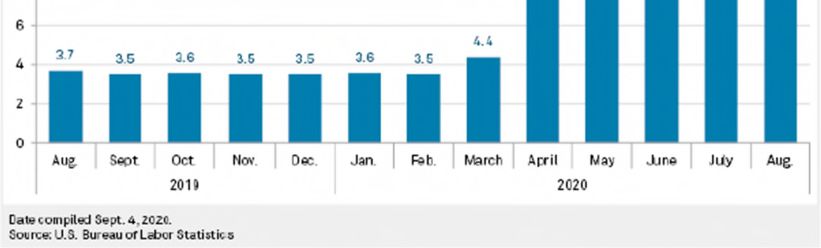
Section II
Analysis of Rent Shortfall
Stout has based its analysis largely on the Household Pulse Survey administered by the U.S.
Census Bureau. The Household Pulse Survey was “designed to deploy quickly and efficiently,
collecting data to measure household experiences during the coronavirus pandemic.”12 The
Household Pulse Survey has two phases. Phase 1 (April 23, 2020 through July 21, 2020) of the
survey collected information about individuals’ employment status, access to food, housing,
physical and mental health, access to healthcare, and disruption to education.13 Phase 2 (August
19, 2020 tentatively through October 2020) of the survey includes many of the questions from
Phase 1 to assess trends over time and additional questions about receipt of governmental
benefits (e.g., unemployment, Social Security, Supplemental Security Income, Medicare),
spending patterns, access to financial resources, remote working, and travel practices.14
Based on data from the Household Pulse Survey, with responses as of September 14, 2020, Stout
estimates that there are between 9.7 million and 14.2 million renter households (between 23.3
million and 34.0 million individual renters) in the United States that are unable to pay rent and
at risk of eviction. The 9.7 million renter households at the low end of the range are renter
households that have indicated no or slight confidence in their ability to pay next month’s rent
and excludes those households that receive certain forms of rental assistance (e.g., public
housing, Section 8 vouchers). The 14.2 million renter households at the high end of the range
are all renter households that have indicated no or slight confidence in their ability to pay next
month’s rent, as well as a portion of renter households that have indicated moderate confidence
in their ability to pay next month’s rent, and does not make any exclusions for the renter
households that receive certain forms of rental assistance within these two sub-populations
(i.e., all renter households that have indicated no or slight confidence in their ability to pay next
month’s rent and a portion of renter households that have indicated moderate confidence in
their ability to pay next month’s rent).
Stout estimates that the rent shortfall by the end of September 2020 for these households is
between $12.2 billion and $16.7 billion and that this rent shortfall will increase to between $25.1
billion and $34.3 billion by January 2021. Unlike other estimates of back-rent owed, Stout’s
estimate of rent shortfall considers that a portion of renters will make partial rent payments
though they may have to rely on credit cards or other (often higher risk) mechanisms of
accessing capital to do so. Stout’s estimate of rent shortfall does not include interest or fees
that landlords may charge renters who are unable to pay rent during the CDC eviction
moratorium. Given what appears to be a slow economic recovery, it is reasonable to expect
ongoing elevated unemployment, high rent burden among low-income renter households,
continued accumulation of unpaid rent, and continued risk of eviction beyond January 2021.
Stout estimates that by January, up to 8.4 million renter households (20.1 individual renters)
could experience an eviction filing. The actual number of renter households that may

12
   https://www.census.gov/data/experimental-data-products/household-pulse-survey.html
13
   Ibid.
14
   Ibid.

                                                                                                   7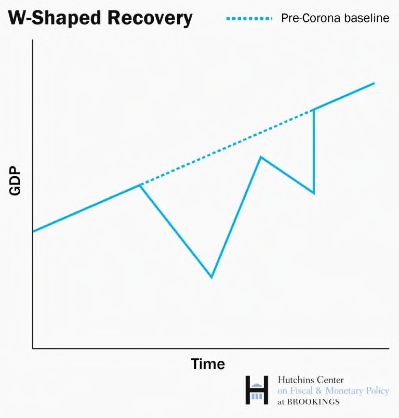
experience an eviction filing could vary based on renters’ awareness of the CDC moratorium
and the degree to which courts are consistently applying the CDC moratorium. For example,
the Texas Supreme Court ruled on September 17, 2020 that “eviction citations will have to
inform renters about the moratorium requirements and include the form needed to apply for
protection,” that landlords must notify the court immediately upon receiving a declaration in
an already-filed case, and that the court must immediately abate the action absent certain
limited exceptions.15 Conversely, the Maryland District Court has stated that even after the
tenant has provided the declaration to the landlord, the court will still hear eviction cases and
that the court will “determine the merits of the case and/or the amount that is due for
possession” but withhold entering judgment until after the CDC order expires, at which point
judgment will be entered automatically.16
Stout also analyzed the data by income category. Figure A shows the estimated range of renter
households (nationally) that may be unable to pay rent and at risk of eviction, estimated
eviction filings by January 2021, and estimated range of rent shortfall by January 2021 for each
of the six income brackets used in the Household Pulse survey. This analysis considers both
reported household income and reported rent burden for each income category in estimating
average household rent burden. It then applies Stout’s methodology to estimate both potential
rental shortfall and eviction filings. Unsurprisingly, renter households with the lowest incomes
are more likely unable to pay rent and at risk of eviction. Renter households with annual
incomes of less than $50,000 constitute 71% of the estimated eviction filings by January 2021.
                                              Estimated Range of Renter
                                           Households Unable to Pay Rent                Estimated Eviction Filings by        Estimated Range of Rent Shortfall
Income Bracket                                    and at Risk of Eviction                               January 2021                           by January 2021
Annual Income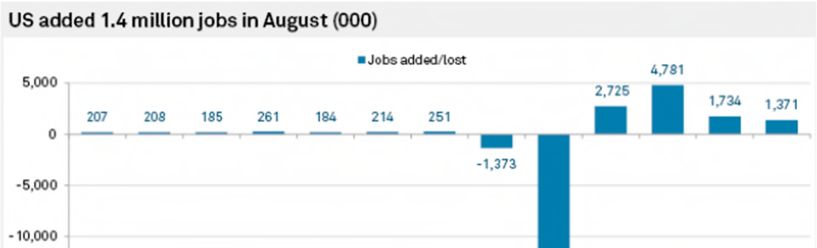
potentially facing evictions as well as other information considered in the development of these
calculations.
Statement of Methodology
Stout’s Statement of Methodology is divided into three sections: (1) Sources Underlying the
Analysis; (2) Key Assumptions Driving Estimate of At-Risk Renter Households; and (3) Key
Assumptions Driving Estimate of Rent Shortfall.17
Sources Underlying the Analysis
This analysis relies on two primary sources of data to derive its estimates: (1) the U.S. Census
Bureau’s Table of Household Income by Gross Rent as a Percentage of Household Income in the
Past 12 Months (“Table B25074”) from its 2019 American Community Survey (“ACS”), released
on September 17, 2020 and (2) the U.S. Census Bureau’s Table of Confidence in Ability to Make
Next Month's Payment for Renter Occupied Housing Units, by Select Characteristics for each
State (Housing Table 2b) from its Household Pulse Survey (“HPS”), released weekly from June
17 through July 29, 2020 and biweekly since September 9, 2020.
The American Community Survey dataset uses a 90% confidence level to determine the margins
of error for each of its point estimates.18 This results in a range of between +/- 0.6% and 6.2%
for the statewide estimate of the number of renter households across all income levels,
depending on the state. As with any dataset, subsets of the data – by income level and rent as a
percentage of income – have higher margins of error. Less than 2% of lowest-level subset of
household estimates have margins of error above +/- 30%, which the U.S. Census Bureau
considers the threshold for, “potentially serious data quality issues related to sampling error.”
Over 78% of the lowest-level subset of 2019 1-year estimates of renter households resulted in a
margin of error of less than +/- 10%.
As described by the U.S. Census Bureau, the sample sizes for the Household Pulse Survey
datasets, “were determined such that a two-percentage point detectable difference in weekly
estimates for an estimate of 40 percent of the population would be detectable with a 90%
confidence interval within each sample area. The overall sample sizes within the sampling areas
were adjusted for an anticipated response rate of five percent.” The results of the Household
Pulse Survey for renter occupied households have demonstrated a consistent concern that
renter households will be unable to make the next month’s rent. This is particularly the case for

17
   Stout revised this methodology in September 2020 to account for the issuance of the CDC moratorium order
and its impact on eviction filings. In addition, we have refined our assumption for the exclusion of low-income
households that receive rental assistance from federal data to now reflect state-level data. Due to these changes,
the estimates presented in this report should not be directly compared to Stout’s previously published estimates.
18
   Stout has not calculated confidence levels for every input. Please review the U.S. Census Bureau technical
document (https://www2.census.gov/programs-surveys/acs/tech_docs/accuracy/ACS_Accuracy_of_Data_2019.pdf)
for more information about the confidence levels used for the surveys that Stout has relied on for its analysis.

                                                                                                                9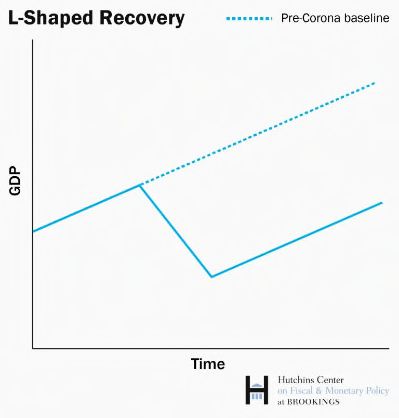
the lowest income categories with approximately two-thirds of respondents only moderately
confident or less.
In our analysis of rent payment confidence, we have omitted the responses to the survey
indicating “No response.” The number of these respondents is relatively small, less than 1% of
all estimated renter households. Similarly, those responses indicating “Payment is or will be
deferred,” also 1% or less of all estimated renter households, are included in the denominator
of our calculations but are not separately identified as households potentially facing a rent
shortfall. We also excluded renter occupied households with non-cash rent or occupied without
rent from the analysis, representing approximately 5% of the total renter households estimate,
as they are not expected to be at risk of eviction nor contribute to the rent shortage.
Household Pulse data reports both household estimates as well as the number of respondents
(individuals) for their Public Use File datasets. U.S. Census Table B25074 is a measure of
households. We have used the proportion of estimated households across each measure of the
Household Pulse data as the unit of measure is most comparable to the numbers provided in
Table B25074.
It should be noted that the income categories compiled in the Household Pulse Survey results,
as well as the American Community Survey, are based on the 2019 annual income levels
reported by the respondents. The economic impact of COVID-19 has likely reduced that income
in 2020 for many households.
Additionally, the Household Pulse Survey income categories are slightly different than the
income categories reported in Table B25074 of the 2019 American Community Survey. The
three lowest reported income categories in Table B25074 are “Less than $10,000,” “$10,000 to
$19,999” and “$20,000 - $34,999.” The lowest reported income category in the Household Pulse
data is “Less than $25,000” and the second income category is “$25,000 - $34,999.” For purposes
of this analysis we used the American Community Survey income categories and have assumed
that the proportions indicated in the Household Pulse Survey data for the lowest two income
categories would reasonably align with those of the American Community Survey. We have also
combined the two lowest income categories from Table B25074 and combined all Household
Pulse Survey income categories greater than $100,000 into a single category for reporting
purposes. All other income categories are aligned.
Key Assumptions Driving Estimate of At-Risk Renter Households
We have assumed that all renter households estimated to have No or Slight confidence in the
ability to make next month’s rent will have some degree of rent shortfall. Correspondingly, we
have assumed that 25% of all renter households estimated to have Moderate confidence in the
ability to make next month’s rent will have some degree of rent shortfall, as described below. It
is possible that the proportion of respondents who indicated they have a Moderate confidence
in paying next month’s rent that would have a rent shortfall could vary based on income levels
or rent burden. That is, respondents at higher income levels or lower rent burden who

                                                                                              10
responded with Moderate confidence may have a lesser likelihood of having a rent shortfall.
The inclusion of 25% of the households with Moderate confidence is intended to consider that
certain incomes and rent burden may have a higher or lower likelihood of having a rent shortfall.
A more refined analysis of this variation could cause the total estimated rent shortfall to be
different – possibly higher or lower.
For purposes of determining the level of rent shortfall needed in this analysis, we have assumed
that those households indicating No or Slight confidence in ability to pay next month’s rent will
have an average rent shortfall consistent with 50% of their monthly rent. This is consistent with
further analysis of Household Pulse Survey regarding households that reported the loss of
employment and any gainful work performed in the last 7 days. Likewise, we have assumed that
the 25% of households indicating Moderate confidence in ability to pay next month’s rent that
will have a rent shortfall, will also fall short by 50% of their monthly rent owed for each month
of rental arrears. As with our estimate of the proportion of Moderate confidence households
that will experience a rent shortfall, our use of a 50% rent shortfall amount for Moderate
confidence households is intended to consider that certain incomes and rent burden may have
a higher or lower level of rent shortfall and is consistent with our analysis of other Household
Pulse Survey results regarding employment impact for these households. Our analysis does not
adjust for available (unused) local, state, or federal emergency rental assistance. We expect that
renter household confidence will be informed by the availability of emergency rental assistance
for which they may be eligible.
We have assumed that households with the greatest rent burden would be most likely to
indicate they would not be able to make next month’s rent. As such, we have measured the
amount of rent shortfall for renter households with the greatest rent burden first. We then apply
this to successive levels of lower rent burden until the total number of expected households
having rent shortfall has been included – calculated separately for No/Slight confidence and
Moderate confidence renter households. While it would certainly be expected that employment
disruption and rental confidence has been impacted across all rent burden levels for all income
categories, it is also reasonable to expect that the greatest risk would be faced by those with the
highest rent burden especially at lower income levels. Therefore, certain of the income-
level/rent burden cohorts in the model are displayed as having no impacted households due to
the assumed application of need at the highest rent burden levels first. Modifying this
assumption to distribute the impacted population across all rent burdens would reduce the
estimate of rent shortfall, as the distribution of monthly rent shortfall for lower rent burdens
would be modified, but would not change the overall number of households likely to experience
a rent shortfall.
In considering renter households in the United States that receive some form of rental
assistance, we have considered both the inclusion of these household in the calculation, as well
as their exclusion under the premise that they are subsidized units for whom other forms of
relief or rental adjustment may be available. Under the exclusionary scenario, we analyzed
11housing data from the Center of Budget and Policy Priorities for the number of households in
each state that use federal rental assistance in comparison to the American Community Survey
estimates of total renter households in low-income brackets in each state. Nationally, 20% of
the estimated number of low-income renter households received federal rental assistance. For
the scenario excluding these households, we have calculated the percentage of low-income
renter households living in federally subsidized housing in each state discretely and removed
that percentage from the estimates for the three lowest income brackets. In other words, we
assume, based on the ratio of subsidized units to the total number of renter households in each
state for those income levels, that a certain percentage of those households that may have a
rent shortfall are in subsidized units for whom other forms of relief or rental adjustment may
be available and we have excluded these households from the calculation for this scenario. We
have not included consideration of any other funding or relief that may be available to renter
households, including CARES or unemployment compensation, or state/local rental assistance
programs. Based on the timing of the survey results, it would be reasonable to expect that the
survey responses have been informed by the receipt of CARES stimulus funding as well as
unemployment benefits or other rental assistance programs for most households.
Additionally of note, when collecting information about rent burden the U.S Census Bureau’s
instructions direct the respondent to, "report the rent agreed to or contracted for, even if the
rent for your home, apartment, or mobile home is unpaid or paid by someone else. Do not
include any subsidy amount which may be paid by a local housing authority or other agency.”
Subsequently, the U.S. Census Bureau published a survey indicating that for this question, 25%
of respondents are likely answering the question as it was intended to be answered, while 71%
are reporting rent amounts that are less than the contract amount (reporting net of subsidy),
and 4% are reporting an amount higher than the contract amount. This is relevant to consider
when assessing rent burden reported, particularly by low-income levels that may be receiving
rental subsidies.
To estimate the number of evictions that may occur by January 2021 resulting from the rent
shortfall for these households, we first applied the percentage of respondents to the U.S. Census
Household Pulse Survey who said that they were currently caught up on rent payments but had
No or Slight confidence in the ability to make next month’s rent – which was approximately
65% of respondents, to the total number of estimated renter households that will experience a
shortfall this month, resulting in the number of renter households that are estimated to be only
one-month in arrears next month. We then stratified the remaining 35% of households into
two-, three-, and four-months in arrears cohorts. These calculations do not adjust for or
otherwise consider the number of households that are facing a pending eviction case.
Households that indicated they will not be able to pay next month’s rent may already be facing
a pending eviction filing.
We have assumed that, in each subsequent month, 75% of households that were only one-
month in arrears will be able to pay enough to remain only one-month behind, with the other
1225% falling one month further behind in rent payments. For households that were two or more
months in arrears, we have assumed that a significant portion (75% or more, increasing as
months in arrears increases) of each cohort of renter households in arrears will continue to fall
one month further behind in rent payments.
When estimating the number of monthly eviction fillings, we have assumed that in the current
economic climate landlords will file an eviction notice after a tenant falls three months behind
in rent payments. Pre-COVID research indicated that landlords typically filed evictions after 1.5
to 2.0 months of rental arrears (see additional supporting information and sources in Appendix
A). Therefore, in each month, we assume that any households which have fallen three or more
months into arrears on rent payments will receive an eviction notice. As noted above, it is
important to note that Stout’s assumption regarding how long a landlord may wait before filing
an eviction (3 months) may be longer than what will be experienced. If landlords bring eviction
filings after less than 3 months in all or partially missed rent, the number of eviction filings
estimated would increase. This assumption is particularly challenging given the limited
information available about landlord response in the current economic climate, as well as the
economic climate that may exist by January 2021 and related months of rent shortfalls. Further,
it is unclear at this time whether a significant number of eviction filings have been or will be
stayed as a result of the CDC moratorium or state or local moratoriums.
Recently, the CDC issued an order establishing the first and only federal moratorium on
evictions, set to remain in place until December 31, 2020. In light of this order, we have assumed
that a portion of those households that would have received an eviction notice under the
previously outlined criteria (three months or more in arrears) will be protected under the CDC
order, deferring their eviction until January 2021. In order to be eligible for the CDC moratorium
tenants must (1) fill out a form certifying that they meet certain eligibility requirements and
give it to their landlord, (2) Make less than $99,000 or $198,000 if you file a joint tax return, (3)
be unable to make full rent, “due to substantial loss of household income, loss of compensable
hours of work or wages, a lay-off, or extraordinary out-of-pocket medical expenses,” (4) be
making an effort to make timely, partial rent payments, (5) have used your “best efforts” to seek
out and apply for all available state or local rental assistance programs, and (6) be at risk of
homelessness or at risk of having to double up with others in cramped, close quarters if you
were evicted. Based on these requirements we have assumed that all renter households in the
$100,000 or more income level are ineligible for the CDC moratorium protection. At the time of
this writing, it is unclear how courts across the country will interpret and apply the various
criteria of the CDC moratorium. We have not included consideration for the incremental impact
of any state or local moratoria efforts that may protect certain renter households over and above
the CDC moratorium order.
Key Assumptions Driving Estimate of Rent Shortfall
We have estimated the average monthly rent using the midpoint income level and rent burden
for each cohort. For the lowest and highest income and rent burden levels we have estimated a
13reasonable average income and expected rent for these households. Based on the distribution
of the estimated renter households at risk of eviction across each income level/rent burden
cohort, and the assumed 50% rent shortfall for these at-risk renter households, we calculate a
weighted average monthly rent shortfall per household for each state. This rent shortfall per
household is then applied to the number of estimated renter household estimated to be in each
group of rental arrears with each increasing group of months in arrears assumed to owe an
additional month of rent shortfall. For each subsequent month, the weighted average monthly
rent shortfall is assumed to be needed for all renter households estimated to be at risk of
eviction for based on the assumed aging of rental shortfall for these households.
14Section IIII The Role of Economic Recovery in Estimating Renter Housing Stability and Rent Shortfall
When forecasting renter household stability and ability to pay rent, it is important to consider
the current economic environment as well as the potential for economic recovery. A recent
survey found that 54% of renters experienced job loss as a result of the economic fallout of
COVID-19, and of the renters who lost their jobs, nearly half were full-time employees and 30%
were part-time employees or self-employed.19 The Terner Center for Housing Innovation at the
University of California, Berkeley estimated that nearly 16.5 million renter households have at
least one worker in an industry immediately affected by the various efforts to curb the spread
of COVID-19.20 This means that “nearly 50 million people live in renter households likely
experiencing immediate job or income losses.”21 The frequency of COVID-19-related job loss
for renter households, the magnitude of renter households that are experiencing income losses,
and the precarious housing situations that renter households find themselves facing may only
be beginning to be mitigated by an economic recovery. The degree to which economic recovery
is expected can impact the reasonable range of renter households that are unable to pay rent
and are at risk of eviction, the rent shortfall for these renter households, and the range of renter
households that may experience an eviction filing by January 2021.
The Economic Impact of COVID-19
Beginning in February 2020, the COVID-19 pandemic plunged the United States economy into
a recession.22 In the first quarter of 2020, real GDP – an indicator of economic health – declined
at an annualized rate of 5%, and in the second quarter, GDP declined by a historic 32%.23 This
is the largest quarterly economic contraction in U.S. record-keeping history, surpassing the
previous record decline of 10% in 1958 by over three-fold.24 Figure B illustrates this year’s
historic GDP decline. Figure C provides a more detailed depiction of the same data for the years
2011-2020.

19
   Williams, Terri. “How COVID-19 is affecting landlords and renters.” MultiBriefs: Exclusive. June 15, 2020.
20
   Kneebone, Elizabeth and Murray, Cecile. “Estimating COVID-19’s Near-term Impact on Renters.” Terner
Center for Housing Innovation, University of California, Berkeley. April 24, 2020.
21
   Ibid.
22
   “NBER Determination of the February 2020 Peak in Economic Activity,” The National Bureau of Economic
Research. June 8, 2020.
23
   “Gross Domestic Product, 2nd Quarter 2020 (Second Estimate); Corporate Profits, 2nd Quarter 2020
Preliminary Estimate,” U.S. Bureau of Economic Analysis. August 27, 2020.
24
   Boak, Josh. “U.S. economy plunged an annualized 31.7% in second quarter.” AP News. August 27, 2020

                                                                                                                16
Figure B25
Figure C26
Unemployment is a secondary indicator of economic health. More than 17.2 million jobs were
lost in March and April 2020 at the onset of COVID-19, resulting in a peak unemployment rate
of approximately 15%.27 Since April 2020, the U.S. labor market has exhibited signs of recovery,
25
Lambert, Lance. “Recovery or double-dip recession? How the U.S. economy is doing in 9 charts.” Fortune.
August 17, 2020.
26
Boak, Josh. “U.S. economy plunged an annualized 31.7% in second quarter.” AP News. August 27, 2020.
27
U.S. Bureau of Labor Statistics.
17with 2.7 million jobs added in May and 4.8 million in June.28 However, during July and August
recovery rates decelerated, with only 1.7 million and 1.4 million jobs added, respectively.29 The
labor market remains more than 11 million jobs short of pre-pandemic levels, and the
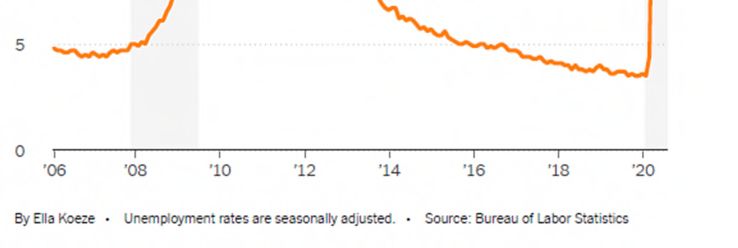
unemployment rate is 8.4% - more than twice the pre-pandemic rate.30 Figures D and E illustrate
the recent trends in the unemployment levels and rates. Figure F compares current
unemployment rates to that of the previous recession.
Figure D31
28
Ibid.
29
“Powell Says Rates Are Likely to Stay Low for Years.” The New York Times. September 18, 2020.
30
Ibid.
31
Fallor, Evan. “US jobs recovery seen at risk without further stimulus.” S&P Global. September 4, 2020.
18Figure E32
Figure F33
32
Ibid.
33
“Powell Says Rates Are Likely to Stay Low for Years.” The New York Times. September 16, 2020.
19It is important to note that August job growth was inflated by the hiring of nearly 240,000
temporary workers for the 2020 census, most of whom will be laid off when canvassing ends at
the end of September.34 This puts actual job growth for the month closer to 1.1 million.35
Further analysis suggests additional weakness and stagnation in the labor market and the
economy as a whole. Overall, permanent job loss has increased by approximately a third from
February 2020 to August 2020.36 There has also been a recent resurgence of permanent job loss,
with layoffs increasing by 534,000 in August after a brief plateau in July.37 Additionally, workers
are experiencing significantly longer periods of unemployment, increasing from two weeks in
April to 17 weeks in August.38 Finally, there’s been an increase in the number of individuals
filing for unemployment benefits. Weekly filings reached a peak of 6.9 million in late March,
which steadily declined into July, at which point improvements began to stagnate.39 Since mid-
July, new filings have marginally decreased from 1.4 million to 1 million in late August.40 Even
the improvement to 1 million filings in late August is above the pre-pandemic record of 695,000
in 1982.41 Continued claims from all unemployment programs totaled 29.6 million for the week
ending August 22, 2020.42 During the Great Recession, continued claims peaked at 6.5 million,
and approximately five years passed before continued claims returned to pre-recession levels.43
Taken together, these employment metrics may be signs of long-term, structural damage to the
economy.
34
“Powell Says Rates Are Likely to Stay Low for Years.” The New York Times. September 16, 2020.
35
Lane, Sylvan. “On The Money: Five things to know about the August jobs report.” The Hill. September 4, 2020.
36
Rosenberg, Eli. “The economy added 1.4 million jobs in August, and the unemployment rate fell below 10
percent.” The Washington Post. September 4, 2020.
37
Lane, Sylvan. “On The Money: Five things to know about the August jobs report.” The Hill. September 4, 2020.
38
Rosenberg, Eli. “The economy added 1.4 million jobs in August, and the unemployment rate fell below 10
percent.” The Washington Post. September 4, 2020.
39
Morath, Eric. “Rise in Weekly Unemployment Claims Points to Faltering Jobs Recovery.” The Wall Street
Journal. July 30, 2020; Mutikani, Lucia. “U.S. labor market recovery slowing; economists urge more
fiscal stimulus.” Reuters. August 27, 2020.
40
Ibid.
41
Morath, Eric. “Rise in Weekly Unemployment Claims Points to Faltering Jobs Recovery.” The Wall Street
Journal. July 30, 2020.
42
“Tracking the COVID-19 Economy Weekly Labor Market Information.” Federal Reserve Bank of Philadelphia.
September 5, 2020.
43
Ibid.
20Future economic recovery is difficult to predict. The United States has never experienced a
recession like this – one stemming from a public health crisis rather than a financial crisis.
There are several trajectories that future economic recovery may take. Those trajectories are
most commonly described as Z-shaped, V-shaped, U-shaped, swoosh-shaped, W-shaped, and
L-shaped. Figures G through L illustrate these trajectories and are generally ordered from most
optimistic to least optimistic.44
Figure G Figure H Figure I
Figure J Figure K Figure L
44
Figures F-K sourced from Sheiner, Louise and Yilla, Kadija. “The ABCs of the post-COVID economic recovery.”
Brookings Institution. May 4, 2020.
21Initially, expectations regarding the path of recovery were debated, though V-shaped recovery
emerged as a dominant early expectation: a sharp economic contraction followed by a quick
bounce back to pre-pandemic levels of activity.45 More recently, professionals are largely
expecting to see a U- or swoosh-shaped recovery.46 This shift in expectations reflects the
realization among economists and business professionals that economic recovery is stalling.
This has widely been attributed to the resurgence in the number of COVID-19 cases, which has
caused some states and businesses to rollback or reverse re-openings.47 Figure M depicts daily
COVID-19 cases from March-September. It is notable that the timing of the increase in daily
COVID-19 cases aligns with the slowing economic recovery the country has experienced since
June.
Figure M48
45
Carlsson-Szlezak, Philipp; Swartz, Paul, & Reeves, Martin. “Taking Stock of the Covid-19 Recession.” Harvard
Business Review. August 14, 2020; Zentner, Ellen. “2020 Midyear Economic Outlook: Embracing a V-Shaped
Recovery.” Morgan Stanley. July 1, 2020.
46
Hannon, Paul & Chaudhuri, Saabira. “Why the Economic Recovery Will Be More of a ‘Swoosh’ Than V-
Shaped.” The Wall Street Journal. May 11, 2020; Lambert, Lance. “Recovery or double-dip recession? How the
U.S. economy is doing in 9 charts.” Fortune. August 17, 2020; Davidson, Paul. “What shape is the economic
recovery in: U, V or W?” ABC News. August 13, 2020; Thomson-DeVeaux, Amelia & Paine, Neil. “Don’t Expect A
Quick Recovery. Our Survey Of Economists Says It Will Likely Take Years.” FiveThirtyEight. May 26, 2020.
47
Marte, Jonnelle. “Fed policymakers say pickup in infections slowing U.S. economic recovery.” Reuters. August
5, 2020; Tankersley, Jim & Casselman, Ben. “A Resurgence of the Virus, and Lockdowns, Threatens Economic
Recovery.” The New York Times. July 15, 2020; Egan, Matt. “The economy is in deep trouble again. Coronavirus
is to blame.” CNN Business. July 23, 2020.
48
The COVID Tracking Project.
22Consistent with the expectation of a gradual, U- or swoosh-shaped recovery is the assumption
that the economic recovery timeline will span several years. A key factor in timeline predictions
is the ability to control the spread of COVID-19, which is expected to be achieved through a
vaccine. Most professionals believe that a COVID-19 vaccine will be widely distributed by early-
to mid-2021.49 If true, it is expected that the economy will not fully recover until at least 2024,
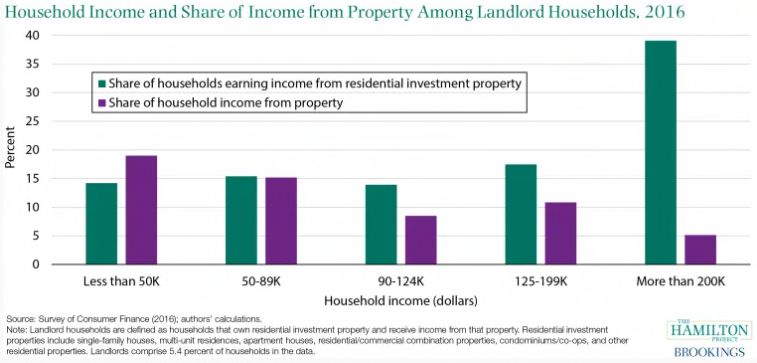
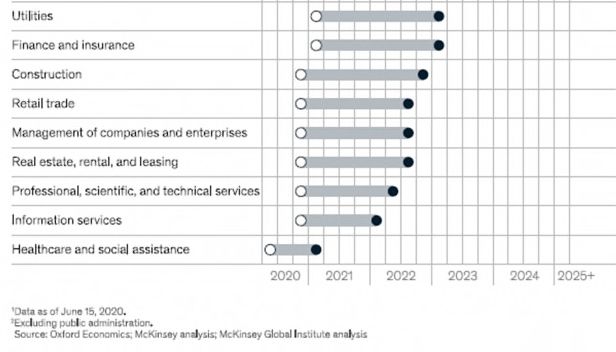
and potentially 2025 or later.50 The hardest-hit industries are primarily responsible for the
extended recovery time. For instance, in September, Airlines for America, which represents the
largest U.S. airlines, estimates that the industry will not return to pre-pandemic levels until
2024.51 Figure N shows recovery time prediction for several additional industries.
Figure N52
49
Harrison, Matthew. “After the Coronavirus Peak, What’s Next?” Morgan Stanley. April 15, 2020; Nagarajan,
Shalini. “Goldman Sachs lifts 2021 US GDP forecast to 6.2% and predicts a COVID-19 vaccine will be 'widely
distributed' by mid-2021.” Business Insider. August 10, 2020.
50
Bogdanova, Kelly. “How long will the economic recovery take?” RBC Wealth Management. July 30, 2020; Dua,
André; Mahajan, Deepa; Oyer, Lucienne; Ramaswamy, Sree. “US small-business recovery after the COVID-19
crisis.” McKinsey & Company. July 7, 2020.
51
Gangitano, Alex. “Airline industry warns it won't rebound until 2024.” The Hill. September 3, 2020.
52
Oxford Economics. McKinsey Analysis.
23In July, there were greater-than-expected employment gains at restaurants, retail stores, and
healthcare.53 However, these industries are among the hardest-hit by the pandemic and remain
at significant risk should jurisdictions need to pause re-opening.54 Within these industries,
many small businesses that gained jobs in July were using funds from the Paycheck Protection
Program (PPP) to avoid layoffs.55 At the height of PPP usage, the program was supporting 1.3
million jobs.56 A reversal of the July job gains may already be happening, as evidenced by weaker
employment at small businesses – the primary beneficiaries of the PPP – based on ADP payroll
data.57
In response to COVID-19, the U.S. Census Bureau created and deployed a new survey intended
to measure the effect of the pandemic on small businesses (i.e., businesses with less than 500
employees) across the country. Phase 1 of the survey was from April 26, 2020 to June 27, 2020,
and Phase 2 began August 9, 2020 and is ongoing.
Respondents were asked questions related to difficulties they faced with business operations
and finances, temporary or permanent closings, and employee terminations or lay-offs. At the
conclusion of Phase 1, approximately 44% of small business respondents indicated that they
did not expect to return to normal operations for six months or longer compared to
approximately 31% of respondents during the first week of the survey.58 Between the first and
third weeks of the survey, the percentage of small businesses that reported receiving financial
assistance, including Paycheck Protection Program assistance, increased from approximately
38% to approximately 67%.59 As Phase 1 of the survey concluded and Phase 2 started, small
businesses began responding with more optimism.
As of September 5, 2020, approximately 32% of small businesses in the United States indicated
that COVID-19 has had a “large negative effect” on them, a decrease from approximately 51%
at the end of April.60 As the portion of small businesses responding that COVID-19 has had a
“large negative effect” on them has decreased, the portion of small businesses responding that
COVID-19 has had a “moderate negative effect” on them has been increasing. This relationship
indicates marginal improvement in small business sentiment.
Although small business sentiment has improved marginally, from August 9, 2020 to September
5, 2020, approximately 40% of respondents indicated that they had not re-hired any paid
53
Zandi, Mark. “The Week Ahead-U.S. Europe, Asia-Pacific.” Moody’s Analytics. August 13, 2020.
54
Ibid.
55
Ibid.
56
Ibid.
57
Ibid.
58
Callen, Jane A. “Census Bureau Launches Phase 2 Small Business Pulse Survey.” August 20, 2020. Referencing
U.S. Census Bureau Small Business Pulse Survey.
59
Ibid.
60
U.S. Census Bureau Small Business Pulse Survey.
24employees who had been furloughed or laid off after March 13, 2020.61 Furthermore, when asked
how much time they think will pass before their business returns to its normal level of
operations relative to one year ago, approximately 31% of respondents indicated six or more
months during the week of April 26, 2020 compared to approximate 45% during the week of
August 30, 2020.62
The degree to which small businesses reported COVID-19 having a “large negative effect” on
them differs by sector. As of September 5, 2020, the five sectors with the high portions of small
businesses reporting COVID-19 having a “large negative effect” on them are:
Accommodation and Food Services – 66.6%
Educational Services – 63.5%
Arts, Entertainment, and Recreation – 61.9%
Mining, Quarrying, and Oil and Gas Extraction – 43.7%
Other Services (except Public Administration) – 40.3%63
Even though small businesses are shifting from having experienced large negative effects to
now experiencing moderately negative effects, there are indications that they are still
struggling – the lagging re-hiring of furloughed or laid off employees and an increased portion
of small businesses expecting six or more months before returning to normal operations. In
addition to small business owners, renters throughout the country are facing uncertainty.
Current Renter Household Instability
A monthly survey by Apartment List that started in June has found that for each of the last four
months approximately 33% of American rental households did not make an on-time rent
payment.64 As a result of these late or missed payments, approximately 66% of renters expressed
concerned about eviction within the next six months.65 Furthermore, of the renters concerned
about eviction in the next six months, two-thirds had not made a full August rent payment.66
Not including August rent payments, the portion of renters owing rent to their landlords by
amount owed were:
15% owing less than $1,000;
11% owing between $1,000 and $2,000; and
5% owing more than $2,000.67
61
Callen, Jane A. “Census Bureau Launches Phase 2 Small Business Pulse Survey.” August 20, 2020. Referencing
U.S. Census Bureau Small Business Pulse Survey.
62
U.S. Census Bureau Small Business Pulse Survey.
63
U.S. Census Bureau Small Business Pulse Survey.
64
Popov, Igor et al. “32% of Americans Entered August with Unpaid Housing Bills.” Apartment List. August 6,
2020.
65
Ibid.
66
Ibid.
67
Ibid.
25A Moody’s Analytics analysis estimates that by the end of 2020, the average back-rent owed by
renters in the United States will be $5,400, accumulating to $70 billion by the end of the year.68
There appear to be several key differences between Stout’s estimates and Moody’s estimate.
Stout assumes that some renters may be able to pay a portion of their rent or have other access
to capital (as described above) in order to make a partial payment of rent each month. In
addition, the Moody’s estimate appears to have been completed on or before August 13, 2020
and would not have had the benefit of the most recent Household Pulse survey data
incorporating renter confidence indicators from September 2 – 14, 2020. With a further review
and understanding of the methodology used by Moody’s in developing its estimates Stout may
be able to further reconcile the differences between the conclusions.
The methods by which renters are paying their rent, whether fully or partially, include using
credit cards, borrowing from friends or family, taking out high-interest payday loans, and
depleting savings and emergency funds. A rent payment processing company reported that the
number of tenants paying rent by credit card was 30% higher during the first week of April
compared to the first week of March.69 While this solution addresses the short-term need to pay
rent, renters who are unemployed or underemployed may be paying double-digit interest rates
and accruing debt if they are paying only the minimum payment on their credit cards.70 Even
renters who are working have expressed challenges with paying rent. According to an August
2020 survey conducted by a property management software firm, approximately 44% of
employed renters were paying 31% to 50% of their yearly income on rent alone before COVID-
19.71 Any change in income or employment exacerbates the financial strain that these renters
were already experiencing pre-pandemic.
To make full or partial rent payments, approximately 42% of renters indicated they are spending
their savings or emergency funds.72 Landlords, particularly small landlords, are also using their
savings or emergency funds to pay for rental property expenses. Approximately 35% of
landlords responding to the same August 2020 survey reported using savings to pay for
expenses that are typically covered by rent income from tenants.73 Landlords’ need to use
savings or emergency funds may be a function of their size. A Brookings Institution analysis
found that “40% of residential property units are owned by individual investor landlords.
Among those owning residential investment property, roughly a third are from low- to
moderate-income households; property income constitutes up to 20% of their total household
68
Zandi, Mark. “The Week Ahead-U.S. Europe, Asia-Pacific.” Moody’s Analytics. August 13, 2020.
69
“More plastic in the pandemic: Credit-card rental payments up 30%.” The Real Deal New York Real Estate
News. April 15, 2020.
70
Ibid.
71
Scott, Marin. “Landlords and Renters Struggling to Make Ends Meet During COVID-19 Uncertainty.” Avail.
September 11, 2020.
72
Ibid.
73
Ibid.
26income.”74 Figure O shows household income and share of income from rental property for
landlord households.
Figure O75
These individual investor landlords, especially those with low- to moderate-incomes likely have
less access to capital compared to large corporate landlords. These properties also tend to be
more affordable and attract lower-income tenants, who have been disparately impacted by
COVID-19.76 The combination of less access to capital and having a renter-base that is
disproportionately affected by the economic fallout of COVID-19 has put smaller landlords in
similar situations as their renters.
CDC Eviction Moratorium
On September 4, 2020, the CDC issued an Agency Order to temporarily stop residential evictions
through December 31, 2020 to prevent the further spread of COVID-19.77 In the Agency Order,
the CDC states:
“In the context of a pandemic, eviction moratoria – like quarantine, isolation, and
social distancing – can be an effective public health measure utilized to prevent
74
Broady, Kristen E. et al. “An eviction moratorium without rental assistance hurts smaller landlords, too.”
Brookings Institution. September 21, 2020.
75
Ibid.
76
Dougherty, Conor and Friedman, Gillian. “They’re Making the Rent. Is it Costing Their Future?” The New York
Times. August 21, 2020.
77
85 FR 55292.
27the spread of communicable disease. Eviction moratoria facilitate self-isolation
by people who become ill or who are at risk for severe illness from COVID-19 due
to an underlying medical condition. They also allow State and local authorities to
more easily implement stay-at-home and social distancing directives to mitigate
the community spready of COVID-19. Furthermore, housing stability helps
protect public health because homelessness increased the likelihood of
individuals moving into congregate settings, such as homeless shelters, which
then puts individuals at higher risk to COVID-19.”78
The Agency Order does not apply to any State, local, territorial, or tribal area with a
residential eviction moratorium that provides the same or greater protections than the
Agency Order, and the Agency Order does not preclude any State, local, territorial, or
tribal area from instituting more restrictive requirements that protect public health.
For tenants to invoke the Agency Order, they must complete and provide an executed
copy of a Declaration, under penalty of perjury, to their landlord, owner of the residential
property, or other person who has the right to evict or remove them.
78
Ibid.
28Conclusion
Stout estimates that there are between 9.7 million and 14.2 million renter households (between
23.3 million and 34.0 million individual renters) in the United States that may be unable to pay
rent and are at risk of eviction. Stout estimates that renter households have already
accumulated between $12.2 billion and $16.7 billion of shortfall in their owed rent. Stout
estimates the rent shortfall for these households will be between $25.1 billion and $34.3 billion
by January 2021. Given what appears to be a slow economic recovery, it is reasonable to expect
ongoing elevated unemployment, high rent burden among low-income renter households,
continued accumulation of unpaid rent, and continued risk of eviction beyond January 2021.
Furthermore, Stout estimates that by January 2021, up to 8.4 million renter households (20.1
million individual renters) could experience an eviction filing.
Assumptions and Limiting Conditions
This report and analysis was prepared for the National Coalition of State Housing Agencies.
Stout has no affiliation or interest (financial or otherwise) in the National Coalition of State
Housing Agencies. No one who worked on this report has any known material interest in the
outcome of the analyses.
Any distribution of this report by the National Coalition of State Housing Agencies, or other
parties, does not create a relationship with, or obligation to, any recipients or readers of the
report.
Stout’s analyses are based on information reviewed to date. Stout reserves the right to, but is
not obligated to, change or supplement these analyses should additional information become
available.
_______________________________________
Neil Steinkamp
Managing Director
Stout Risius Ross, LLC
29Appendix A Additional Supporting Data Sources and Considerations
A recent national online survey by the website Property Nest found that roughly 39
percent of respondents said that they would be unable to pay rent if they lost their job
during the coronavirus pandemic.
The National Association of Realtors (NAR) estimates that 42% of households across the
country would struggle to pay for housing solely with unemployment benefits. Parsed
further, the organization says that 31% of renters have monthly housing costs that are
higher than the amount they can pay with unemployment benefits.
An analysis of the Household Pulse Survey Public Use File (PUF) data files for Weeks 1 to
5 shows that about half of those respondents who indicated they have No/Slight
confidence in making next month’s rent also indicated they were unable to pay last
month’s rent as well.
At a time of historically low unemployment in 2019, the Fed reported that 38% of
Americans did not have the resources to pay an unexpected expenditure of $400.
A pre-COVID analysis of eviction filings in Rochester, NY indicates that 47% of evictions
were filed based on less than 1.5 months of rent. 65% involved 2 months of rent. 77%
involved 2.5 months.
The Rochester (NY) Metro Area Poverty Initiative published data recently showing that
over 30% of respondents indicate that they are unable to pay their rent, haven’t paid
their rent, don’t know how they will pay their rent or has a landlord that is trying to evict
them.
The National Multifamily Housing Council (NMHC) and Entrata reported at the end of
April that:
o New York State had one of the lowest overall percentages in the country of units
that made a rent payment as of April 22 (89.8%) and one of the highest
percentages of uncollected rent.
o This same report indicated a significant increase (nationwide) in payments being
made by credit card in April and in repayment plans negotiated with tenants
(note: this report has not yet been updated for May).
A recent survey by Gracie Hill indicated “The evolution in sentiment may continue to
reflect the timing of stimulus payments from the federal government. When our survey
closed in mid-May, the portion of residents who said they would ask landlords to defer
their rent was set to be 30%, compared to 40% in April. Sixty-eight percent reported
receiving stimulus assistance, and of those 38% said it helped them feel more financially
secure, whereas 49% said it made no difference. Fourteen percent of residents reported
they believed they would be more financially secure in three to six months compared to
how they were before COVID-19. Forty-eight percent anticipated they would be
31You can also read