Major Hydrostratigraphic Contacts of the Truxton Basin and Hualapai Plateau, Northwestern Arizona, Developed from Airborne Electromagnetic Data
←
→
Page content transcription
If your browser does not render page correctly, please read the page content below
Prepared in cooperation with the Bureau of Reclamation

Major Hydrostratigraphic Contacts of the Truxton Basin
and Hualapai Plateau, Northwestern Arizona, Developed
from Airborne Electromagnetic Data
Chapter D of
Geophysical Surveys, Hydrogeologic Characterization, and
Groundwaterflow Model for the Truxton Basin and
Hualapai Plateau, Northwestern Arizona

Scientific Investigations Report 2020–5017–D

U.S. Department of the Interior
U.S. Geological Survey

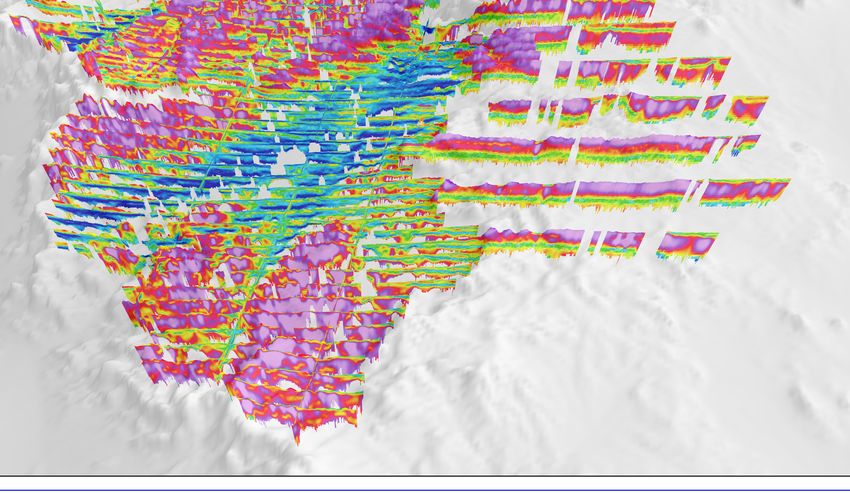
Cover background.    Three-dimensional perspective of inverted resistivity sections in the Truxton basin and
surrounding area.

Cover insert. Three-dimensional perspective of the Truxton Basin Hydrologic Model viewing the Truxton basin
and surrounding area from the south.

Major Hydrostratigraphic Contacts of the Truxton Basin and Hualapai Plateau, Northwestern Arizona, Developed from Airborne Electromagnetic Data By Lyndsay B. Ball Chapter D of Geophysical Surveys, Hydrogeologic Characterization, and Groundwaterflow Model for the Truxton Basin and Hualapai Plateau, Northwestern Arizona Edited by Jon P. Mason Prepared in cooperation with the Bureau of Reclamation Scientific Investigations Report 2020–5017–D U.S. Department of the Interior U.S. Geological Survey

U.S. Department of the Interior
DAVID BERNHARDT, Secretary
U.S. Geological Survey
James F. Reilly II, Director

U.S. Geological Survey, Reston, Virginia: 2020

For more information on the USGS—the Federal source for science about the Earth, its natural and living
resources, natural hazards, and the environment—visit https://www.usgs.gov or call 1–888–ASK–USGS.
For an overview of USGS information products, including maps, imagery, and publications,
visit https://store.usgs.gov.

Any use of trade, firm, or product names is for descriptive purposes only and does not imply endorsement by the
U.S. Government.

Although this information product, for the most part, is in the public domain, it also may contain copyrighted materials
as noted in the text. Permission to reproduce copyrighted items must be secured from the copyright owner.

Suggested citation:
Ball, L.B., 2020, Major hydrostratigraphic contacts of the Truxton basin and Hualapai Plateau, northwestern Arizona,
developed from airborne electromagnetic data, chap. D of Mason, J.P., ed., Geophysical surveys, hydrogeologic
characterization, and groundwater flow model for the Truxton basin and Hualapai Plateau, northwestern Arizona: U.S.
Geological Survey Scientific Investigations Report 2020–5017, 24 p., https://doi.org/10.3133/sir20205017D.

Associated data for this publication:
Ball, L.B., Bills, D.J., and Macy, J.P., 2020, Airborne electromagnetic and magnetic survey data from the western
Hualapai Indian Reservation near Grand Canyon West and Peach Springs, Arizona, 2018: U.S. Geological Survey data
release, https://doi.org/10.5066/P91OLJN3.

ISSN 2328-0328 (online)

iii

Contents
Abstract............................................................................................................................................................1
Introduction.....................................................................................................................................................1
     Purpose and Scope...............................................................................................................................1
     Survey Area Description......................................................................................................................3
Methods...........................................................................................................................................................5
     Airborne Geophysical Data Acquisition, Processing, and Inversion............................................5
     Interpretation Approach.......................................................................................................................7
Results and Discussion..................................................................................................................................8
     Regional Resistivity Structure.............................................................................................................8
     Delineation of Major Hydrostratigraphic Contacts........................................................................13
           Muav Limestone-Bright Angel Shale Contact.......................................................................13
           Top of Crystalline Basement.....................................................................................................20
           Interpretational Uncertainty and Alternative Structural Scenarios...................................21
Conclusions...................................................................................................................................................21
References Cited..........................................................................................................................................23

Figures
  1. Map of the Grand Canyon West airborne geophysical survey area showing flight
		 lines, the groundwater model extent, the Truxton basin, and major
		 geographic features......................................................................................................................2
  2. Map of the Grand Canyon West airborne geophysical survey area showing flight
		 lines and regional geologic units and structures.....................................................................5
  3. Sections of smooth inverted resistivity models for selected flight lines with mapped
     and interpreted geologic features..............................................................................................9
  4. Maps showing smooth inverted resistivity models at selected depth intervals...............14
  5. Map showing interpreted elevation of the Muav Limestone-Bright Angel Shale
		 contact derived from smooth and minimum-layer inverted resistivity models,
		 outcrop observations, and well lithologic records................................................................15
  6. Map showing primary interpretation of the elevation of the top of crystalline
		 basement derived from smooth and minimum-layer inverted resistivity models,
		 outcrop observations, well lithologic records, and the gravity-derived
		 depth-to-bedrock model.............................................................................................................16
  7. Sections of inverted resistivity models for selected flight lines with interpreted
		 hydrostratigraphic contact elevations including alternative basement elevation
		scenarios.......................................................................................................................................17
  8. Maps showing alternative scenarios of the elevation of the top of crystalline
		 basement derived from inverted resistivity models, outcrop observations, well
		 lithologic records, and the gravity-derived depth-to-bedrock model.................................22

Table
         1.     Airborne electromagnetic data processing filters and inversion settings..........................6
iv

     Conversion Factors
     International System of Units to U.S. customary units

                    Multiply                                  By                    To obtain
                                                             Length
      centimeter (cm)                                        0.3937                 inch (in.)
      meter (m)                                              3.281                  foot (ft)
      kilometer (km)                                         0.6214                 mile (mi)
      meter (m)                                              1.094                  yard (yd)
                                                             Area
      square kilometer (km2)                                 247.1                    acre
      square kilometer (km )   2
                                                             0.3861             square mile (mi2)

     Datum
     Vertical coordinate information is referenced to the North American Vertical Datum of 1988
     (NAVD 88).
     Horizontal coordinate information is referenced to the North American Datum of 1983 (NAD 83).
     Altitude, as used in this report, refers to distance above the land surface.

     Abbreviations
      AEM             airborne electromagnetic
      Am    2
                      ampere square meter
      DOI             depth of investigation
      GPS             Global Positioning System
      HM              high moment
      Hz              hertz
      IP              induced polarization
      LCI             laterally constrained inversion
      LM              low moment
      NED             National Elevation Dataset
      ohm-m           ohm-meter
      USGS            U.S. Geological Survey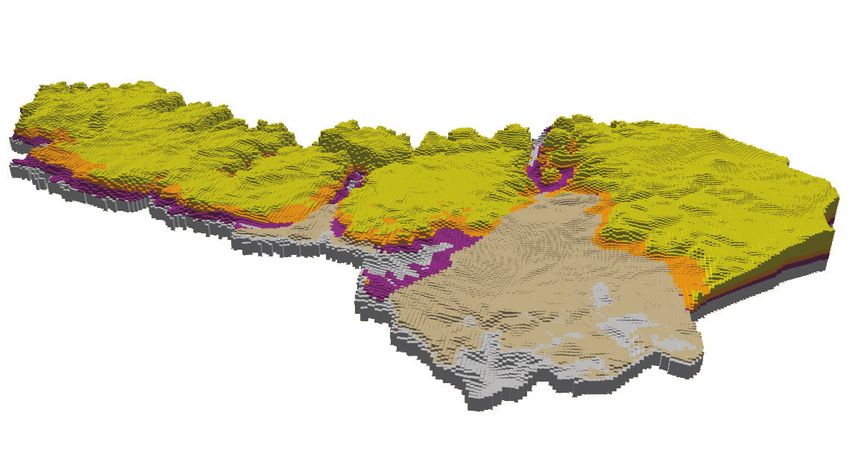
Major Hydrostratigraphic Contacts of the Truxton Basin
and Hualapai Plateau, Northwestern Arizona, Developed
from Airborne Electromagnetic Data
By Lyndsay B. Ball

Abstract                                                          of Reclamation, has undertaken an airborne electromagnetic
                                                                  (AEM) and magnetic survey of the Hualapai Plateau and Trux-
      The area surrounding the Grand Canyon has spectacu-         ton basin. These data have been used to interpret the concealed
lar outcrop exposure in the modern canyon walls, leading to       geologic structure and to refine the regional hydrostratigraphic
stratigraphic contact delineations that are well constrained      framework (fig. 1).
near canyons yet poorly constrained where the terrain remains           The resistivity of geologic materials varies by several
undissected and relatively unexplored by boreholes. An            orders of magnitude (Palacky, 1988). Electrical current in
airborne electromagnetic and magnetic survey of the west-         geologic materials is primarily carried through a combination
ern Hualapai Indian Reservation and surrounding areas was         of electrolytic conduction through pore fluids and surface con-
undertaken to support the development of a three-dimensional      duction along grains, and, as such, subsurface bulk resistivity
hydrostratigraphic framework of the Truxton basin and             is sensitive to groundwater salinity, volumetric water content,
Hualapai Plateau. These data were used to develop models          lithologic and mineral composition, and the presence of clay.
of the resistivity structure with total depths of investigation   The greater Grand Canyon area has a broad lithologic range,
ranging from 200 meters in the most conductive parts of the       including alluvial and volcanic deposits, limestone, siltstone,
Truxton basin to more than 600 meters in the higher resistivity   sandstone, shale, and crystalline rocks, leading to a substantial
areas underlying the Hualapai Plateau. The modeled resistiv-      range in resistivity values. Resistivity contrasts can therefore
ity structure was used in conjunction with geologic maps,         serve as an indicator of the characteristic change in lithologic
well lithologic records, and results from gravity models of the   composition that occurs between some geologic formations
depth to bedrock to develop high-resolution regional interpre-    and can be used to interpret the contacts between hydrostrati-
tations of the elevation of the Muav Limestone-Bright Angel       graphic units.
Shale contact and the top of the crystalline basement. These            The electromagnetic method is commonly used to esti-
contacts are conceptualized to serve as the base of the Paleo-    mate resistivity structure. Because electromagnetic instru-
zoic limestone aquifers primarily underlying the Hualapai         ments are inductive and do not require direct ground contact,
Plateau and the Tertiary-Quaternary sedimentary and volcanic      these systems can be deployed using a variety of platforms
aquifers of the Truxton basin, respectively.                      ranging from borehole tools deployed in wells to sensors
                                                                  towed by aircraft. Airborne geophysical surveys, including
                                                                  AEM surveys, allow high-resolution exploration at regional
                                                                  scales and over areas with limited accessibility or difficult
Introduction                                                      terrain that would otherwise be impractical to survey using
                                                                  ground-based geophysics and with the spatial continuity not
     Near the Grand Canyon in northwestern Arizona, the           possible through borehole measurements.
geologic structure defining the regional hydrostratigraphy
is well defined in outcrop in the deeply incised canyons but      Purpose and Scope
poorly defined where the terrain remains undissected or
bedrock is buried by sediments and volcanic deposits. The              This work is part of a larger study of the groundwater
limited distribution of boreholes and geologic observations       resources of the western Hualapai Indian Reservation and
across large areas leads to uncertainty in the geometry of        Truxton basin. The results of this study are presented in five
hydrostratigraphic units, hindering the development and evalu-    chapters: chapter A provides an overview of the objectives
ation of groundwater flow models. As part of a broader study      and overall findings of the study, a brief summary of previous
of the groundwater resources of the western Hualapai Indian       USGS investigations of region, and basic hydrogeologic
Reservation (see Mason, Knight, and others, 2020), the U.S.       context (Mason, Knight, and others, 2020); chapter B
Geological Survey (USGS), in cooperation with the Bureau          provides an overview of the regional geology and hydrology
2 Geophysical and Hydrogeologic Characterization of the Truxton Basin and Hualapai Plateau
114° 113°30'
A
D
NA
VA
IZO
NE
S h i vw i t s Plateau
4,000,000
AR GRAND CANYON
NATIONAL PARK
Lake
rado R i v e r
Mead
lo
Co
36°
Quartermaster
Grand Canyon West Canyon
C o c o ni no
3,980,000
Horse Flat P l a teau
Canyon
A' Gr Meriwhitica
A an Canyon
d HUALAPAI INDIAN
Grapevine
Canyon Ca RESERVATION
ny
on
Hu
Hindu
al
Canyon
ap
Diamond Creek
3,960,000
ai
Canyon
Pl
at
ea
B B'
Peach Springs
u
Canyon
P l a i n Ta n k F'
Gr
an
Fl a t
M
Hu
d
Milkweed
us
W
al
Canyon
C'
ic
C
as
ap
3,940,000
Au
M
h
ai
Cl
ou
br
iff
nt
ey
Va
s
66
ai
lle
ns
Va
35°30' Peach
y
lle
Truxton Springs D'
EXPLANATION D
y
ash
Hualapai Indian Reservation nW
uxto
Grand Canyon National Park Tr E'
Geophysical flight line E Map area
3,920,000
A A'
Section shown in figures 3 and 7
Others ARIZONA
Co
Truxton basin tto
nw
Groundwater model extent oo
d F
Cl
Kingman iff 40
(3 miles) s
220,000 240,000 260,000 280,000 300,000
Base from 2012 U.S. Geological Survey 100-meter digital data 0 10 20 MILES
Universal Transverse Mercator, Zone 12 North
North American Datum of 1983 0 10 20 KILOMETERS
Figure 1. Map of the Grand Canyon West airborne geophysical survey area showing flight lines, the groundwater
model extent, the Truxton basin, and major geographic features. Bold flight lines labeled A–A’ through F–F’ correspond
to sections shown in parts A–F of figures 3 and 7.
(Mason, Bills, and Macy, 2020); chapter C describes gravity geophysical data acquired in March 2018 over the Truxton
measurements and modeling of the depth to bedrock in the basin and Hualapai Plateau. Interpretations of major
central part of the Truxton basin (Kennedy, 2020); and chapter hydrostratigraphic contacts encompassing the full survey area
E discusses the development and results of a groundwater flow and pertinent to the groundwater modeling effort are presented
model of the Truxton basin (Knight, 2020). and discussed. The airborne geophysical data described in
This chapter (chap. D) describes the design and this report are available online at https://doi.org/10.5066/
acquisition, processing, and inverse modeling of airborne
men20-2162_fig01 P91OLJN3 (Ball and others, 2020).
Major Hydrostratigraphic Contacts of the Truxton Basin and Hualapai Plateau from Airborne Electromagnetic Data   3

Survey Area Description                                              Valley through Truxton Wash (fig. 1). Several geographic
                                                                     features delineate the margins of the Truxton basin: the Music
      The airborne geophysical survey covered an area along          Mountains to the west, Plain Tank Flat to the north, and
the south rim of the western Grand Canyon extending from             the Cottonwood Cliffs to the south and east (fig. 1). In the
near Lake Mead to the intersection of Peach Springs Canyon           northeastern part of the Truxton basin, well logs indicate that
with the Colorado River (fig. 1), referred to herein as the          basin-fill sediments overlie the lower Paleozoic sequence of
Grand Canyon West survey area. The survey encompassed an             Muav Limestone, Bright Angel Shale, and Tapeats Sandstone
area of 3,070 square kilometers (km2) and included most of           (Mason, Bills, and Macy, 2020). In the rest of the basin, the
the area hydrogeologically upgradient of the Colorado River          primary aquifer consists of Paleocene and younger alluvial and
along the southern side of the reach described above. The            lacustrine sediments that are overlying Proterozoic crystalline
region receives relatively low precipitation (160 cm/yr),          others, 2006; Bills and Macy, 2016).
and there is slightly greater rainfall at higher elevations and            Several regional geologic structures are present in the
greater evapotranspiration potential at lower elevations (Bills      Grand Canyon West survey area (fig. 2). The Hurricane
and Macy, 2016). Regional aquifers are primarily recharged by        Fault is the largest displacement feature in the area. The fault
precipitation at higher elevations in the western and southern       extends into Utah where stratigraphic separations of more than
parts of the survey area, and groundwater is conceptualized to       2 km are documented (Stenner and others, 1999; Fenton and
generally flow northeast following the regional geologic dip.        others, 2001), and as much as 400 m of separation has been
Modern topography, paleocanyons, and geologic structures             mapped near Diamond Creek (Billingsley and others, 2006)
may act as local to regional controls on groundwater flow.           (figs. 1, 2). This active down-to-the-west normal fault trends
      The Grand Canyon West survey area includes the Huala-          north-northeast. The southernmost mapped extent of the fault
pai Plateau and the Truxton basin. The Hualapai Plateau is a         terminates near the Cottonwood Cliffs (Beard and Lucchitta,
high-elevation area south of the Grand Canyon that is dis-           1993). The similarly oriented Toroweap fault is about 10 km
sected by deep northeast-trending canyons extending from             east of the Hurricane Fault and has about 300 m of separation
the Grand Wash Cliffs in the west to the Aubrey Valley and           near Diamond Creek (Twenter, 1962). The Meriwhitica fault
Coconino Plateau in the east (fig. 1). Sedimentary rocks             extends across the Colorado River near Horse Flat Canyon,
overlie crystalline basement composed of Proterozoic gran-           transitions to a down-to-the-east monocline to the south,
ite, gneiss, and schist (fig. 2, units Xg and Xm). Most of the       and becomes obscured by volcanic deposits near Milkweed
plateau’s thick (hundreds of meters) sedimentary sequences           Canyon. Horse Flat monocline is mapped about 10 km west of
consist of east-northeast dipping Cambrian to Pennsylvanian          Meriwhitica monocline and is similarly oriented down to the
rocks, including the Tapeats Sandstone, Bright Angel Shale,          east. These monoclines and faults may place local to regional
Muav Limestone, Temple Butte Formation (primarily dolo-              controls on groundwater flow as changes in regional dip alter
mite), and Redwall Limestone (fig. 2, unit M_); the undivided        aquifer geometry, aquifers become hydrologically separated or
Supai Group is present at the surface in the northeastern part       juxtaposed with aquitards, and (or) through enhanced sec-
of the plateau in places (fig. 2, unit P*) (Richard and oth-         ondary permeability near folds and the possible presence of
ers, 2000; Billingsley and others, 2006). The Tonto Group            structurally distinct fault zones that may act as hydrogeologic
includes the Tapeats Sandstone, Bright Angel Shale, and Muav         barriers, conduits, or combined conduit-barriers to flow (Caine
Limestone, which are the most hydrogeologically significant          and others, 1996).
units and reflect gradational changes in depositional setting.             Paleocanyons related to Paleocene through Eocene
As such, the Tapeats-Bright Angel contact is characterized by        erosional stripping of the southwestern Colorado Plateau
interlayered sandstone and shale, which transitions to mostly        preserve a northeast-trending paleodrainage system that may
shale into the Bright Angel. Similarly, the upper parts of the       place modern controls on groundwater flow (see, for example,
Bright Angel Shale contain numerous limestone layers that            Twenter, 1962; Elston and Young, 1991; Young, 2001; Young
transition to predominantly limestone into the Muav (Huntoon,        and Hartman, 2014) (fig. 2). Where buried, these channels
1977). Tertiary volcanic deposits, primarily basalt and andesite     are in part responsible for the variable depth to basement and
flows and tuffs, are present at the surface in parts of this area,   associated aquifer thickness documented in wells (Natural
particularly near the Music Mountains (fig. 1; fig. 2, units         Resource Consulting Engineers, 2011). The paleocanyon
Tv and Tby). Tertiary-Quaternary deposits are found in the           sediments consist of locally derived gravel supported by a
form of semiconsolidated to consolidated alluvial sediments,         consolidated to semiconsolidated weathered arkosic matrix
fine-grained lacustrine deposits, eolian sands, and landslide        interbedded with volcanic deposits (Twenter, 1962; Young,
deposits (fig. 2, units Tso, Tsy, Qo, and Q). These deposits         2001; Billingsley and others, 2006). These sediments have
are present in paleocanyons, as surficial deposits, and in mod-      been reported to be in excess of 300 m thick in Hindu and
ern ephemeral washes (Billingsley and others, 2006).                 Milkweed Canyons (Twenter, 1962). Faulting has likely
      The Truxton basin is a relatively low-lying area adjacent      played a role in both the development and modern discontinu-
to the southern part of the Hualapai Plateau, where surface          ity of individual paleocanyons, particularly with respect to
water drains primarily to the southwest towards Hualapai             channels near the Hurricane Fault (Young, 2001).
4 Geophysical and Hydrogeologic Characterization of the Truxton Basin and Hualapai Plateau
114° 113°30'
A
D
QTb
NA
VA
P
IZO
NE
Tby P
4,000,000
AR
Lake Tsy
T
FAUL
Mead M
olo P
C
r ado
WEAP
Ri
ver
TORO
36° P
Qo
3,980,000
N E
INE
CLI
Tv
O CL
NO
A A'
MO
ICA MONOCLINE
N
LT
Xm
MO
AU
E
E
ONOCLIN
AN
Xg
NF
E AP
RIC
TIO
OW
H UR
RA
Tso
E FLAT M
PA
Xg
TOR
SE
MERIWHIT
3,960,000
HORS
Xm
u paleoca
B Hind nyon B'
QTs Tb eed
M i lkw
M P
GR
F'
AN
Qy
D
E
W
LIN
AS
A U LT
C' NOC
H
C
3,940,000
FA
O
M
YF
UL
P
T
AUBRE
Tso EA
OW
Billingsley and
R
TO
35°30' others, 2006 Tsy
Q
D o n
ny D'
LT
ca
FAU
Yg a leo
np
NE
Xg Q to M
E Trux
ICA
E'
HURR
TKg
3,920,000
Map area
Xg
Xm
ARIZONA
Xmv Tv
Xms
Xm Qo F Arizona Bureau of Tb
Beard and Geology and Mineral
Lucchitta, 1993 Technology, 1988
220,000 240,000 260,000 280,000 300,000
Base from 2012 U.S. Geological Survey 100-meter digital data 0 10 20 MILES
Universal Transverse Mercator, Zone 12 North
North American Datum of 1983 0 10 20 KILOMETERS
EXPLANATION
Geologic map units from Richard and others, 2000 Regional fault—Includes
Q Quaternary surficial deposits, undivided TKg Early Tertiary to Late Cretaceous granitic rocks approximately located,
concealed, or inferred faults.
QTb Holocene to middle Pliocene basaltic rocks P Permian sedimentary rocks Bar and ball on downthrown
Qy Holocene surficial deposits P Permian to Pennsylvanian sedimentary rocks block
Qo Early Pleistocene to late Pliocene surficial deposits M Mississippian, Devonian, and Cambrian Regional monocline
QTs Early Pleistocene to late Miocene basin deposts sedimentary rocks Interpreted paleocanyon
Tsy Pliocene to middle Miocene deposits
Yg Middle Proterozoic granitic rocks Geophysical flight line
Xg Early Proterozoic granitic rocks A A' Section shown in figures 3 and 7
Tby Pliocene to late Miocene basaltic rocks
Tb Late to middle Miocene basaltic rocks
Xms Early Proterozoic metasedimentary rocks Others
Tv Middle Miocene to Oligocene volcanic rocks
Xmv Early Proterozoic metavolcanic rocks Groundwater model extent
Tso Oligocene to Paleocene? sedimentary rocks
Xm Early Proterozoic metamorphic rocks Extent of other geologic mapsMajor Hydrostratigraphic Contacts of the Truxton Basin and Hualapai Plateau from Airborne Electromagnetic Data 5
Figure 2 (page 4). Map of the Grand Canyon West airborne geophysical survey area showing flight lines and regional geologic units and
structures. Bold flight lines labeled A–A’ through F–F’ correspond to sections shown as parts A–F of figures 3 and 7. Regional faults modi-
fied from Arizona Bureau of Geology and Mineral Technology (1988), Beard and Lucchitta (1993), Richards and others (2000), and Billings-
ley and others (2006); regional monoclines from Billingsley and others (2006); interpreted paleocanyons from Elston and Young (1991).
Methods altitude of 35 m; actual sensor altitude averaged 53 m above
land surface with wide variability resulting from the dissected
canyon terrain. Owing to aviation safety limitations, flights
were not attempted below the canyon rim, resulting in data
Airborne Geophysical Data Acquisition, gaps over many of the deeper side canyons as well as the
Processing, and Inversion Grand Canyon itself.
SkyTEM Surveys ApS performed preliminary basic data
In March 2018, airborne electromagnetic and mag- processing. This processing included merging all sensor data
netic data were acquired by SkyTEM Surveys ApS (Aarhus, to a uniform 10-hertz (Hz) sampling frequency, tilt correc-
Denmark) using the SkyTEM-312 helicopter-borne transient tion, and positional shifts to the center of the airframe. Gaps
electromagnetic system and a Geometric G822A cesium vapor in altimeter and GPS data were linearly interpolated. Magnetic
magnetometer. Transient electromagnetic systems use a pulse data processing consisted of diurnal corrections using a locally
of electrical current through a large loop of wire to generate deployed base-station magnetometer, removal of the Interna-
a primary time-varying magnetic field. This primary mag- tional Geomagnetic Reference Field, and calculation of the
netic field induces electrical current to flow in the subsurface, residual magnetic anomaly. Preliminary AEM data processing
leading to secondary magnetic fields that vary, in part, as a included primary-field correction to early-time data, normal-
function of the resistivity structure of the sampled geologic ization for transmitter moment, and adaptive noise filtering.
volume. The resulting decay in the secondary magnetic field is Data acquisition and contractor-performed processing are
measured after the transmitter is turned off in a receiver coil. described in more detail in the supporting documentation and
The SkyTEM-312 AEM system uses dual-moment transmit- contractor’s report available in the digital data release (Ball
ters housed in a rigid airframe. The high-moment transmitter and others, 2020).
(~500,000 ampere square meters [A m2]) maximizes the depth Detailed AEM data processing included additional
of investigation through a multi-turn loop with larger effective altimeter processing, manual culling of cultural noise, applica-
transmitter area and higher current; the low-moment transmit- tion of averaging filters to improve signal-to-noise ratios, and
ter (~4,000 A m2) achieves a faster turn-off time by using a removal of low-signal data through a combination of filters
lower current and smaller effective transmitter area, allowing and manual culling. Signal strength varies with the geologic
early-time data collection and improved sensitivity to shallow structure of the survey area and is notably higher in the Trux-
resistivity structure (Sørensen and Auken, 2004). Receiver ton basin and southern Hualapai Plateau where alluvial sedi-
coils rigidly attached near the back of the airframe measure ments and shallow shale form relatively conductive terrain.
the vertical and horizontal components of the secondary field. The thick high-resistivity carbonate units underlying much of
Ancillary positional instruments including Global Positioning the Hualapai Plateau result in substantially lower signal-to-
System (GPS) receivers, laser altimeters, and inclinometers noise ratios, particularly in the northernmost part of the survey
are mounted to the airframe and record the sensor’s geo- area where carbonates are thickest. Because of the variability
graphic location, height above ground, and airframe orien- in the AEM data, two different data processing approaches
tation. Detailed specifications of the SkyTEM-312 system were applied to the data (table 1). The primary “light averag-
deployed during the Grand Canyon West survey are provided ing” processing scheme used a narrow single-break trapezoi-
in the contractor’s report included with the digital data release dal averaging window and was applied across the full survey
(Ball and others, 2020). area. The secondary “heavy averaging” processing scheme
The airborne geophysical survey consisted of 1,637 line used a wider double-break trapezoidal averaging window to
kilometers flown over an area encompassing the groundwater boost signal-to-noise ratios. The heavy-averaging scheme
flow model domain (fig. 1; Knight, 2020). The survey was was applied to flight lines over the plateau areas where resis-
flown with a nominal 4-km flight-line separation over the tive carbonate units are thick and the geologic structure is
Hualapai Plateau. A higher resolution 1-km flight-line separa- relatively uniform and flat lying. The objective of applying
tion was used over the Truxton basin, the Music Mountains, the heavy-averaging scheme was to maximize the utility of
and Plain Tank Flat where the groundwater modeling effort the AEM data for interpreting hydrostratigraphic contacts at
was expected to require higher resolution information and depth. In the relatively conductive Truxton basin or in loca-
where targeted hydrostratigraphic contacts were shallower tions where the Bright Angel Shale is within the upper few
and more likely to be well resolved by the AEM system. hundred meters of the land surface, similarly heavy averaging
The Grand Canyon West survey area presented challenging of the AEM data was unnecessary to improve signal-to-noise
topography for survey design and data acquisition. In general, levels, as signal is naturally higher in these areas and heavy
the survey altitude was draped to the terrain with a nominal averaging results in a loss of lateral resolution. The primary6 Geophysical and Hydrogeologic Characterization of the Truxton Basin and Hualapai Plateau
light-averaging scheme is particularly advantageous where the heavily averaged data to guide the interpretation of the
the resistivity structure is complex and varies across relatively depth to geologic contacts of interest. In contrast to the fixed
small distances, such as the near the Hurricane Fault. AEM thickness and depth of layers of the smooth model, the mini-
data from structurally complex areas that have been heav- mum-layer model allows the layer interface depths to vary in
ily averaged can be difficult to accurately model and are less addition to resistivity, but for a smaller number of layers. This
useful for geologic interpretation. Data processing procedures approach can result in more accurate layer elevations where
are described in more detail in the supporting documentation the simplified minimum-layer model is appropriate to repre-
provided with the digital data release (Ball and others, 2020). sent the data and local geologic structure, especially at greater
Numerical inverse modeling is used to estimate resistiv- depths where the layers of the smooth model are relatively
ity structure from AEM data. To meet the objectives of this thick. Inversion model parameters were chosen on the basis
study (estimation of hydrostratigraphic contacts), deterministic of iterative tests of multiple parameter combinations, where
laterally constrained inversions were developed using Aar- models were validated by a combination of model misfits to
husINV (Auken and Christiansen, 2004; Auken and others, the AEM data and accurate recovery of estimated formation
2014) implemented in Aarhus Workbench software (Aarhus contact elevations extrapolated from outcrop observations.
Geosoftware, Aarhus, Denmark). For the full survey area, Three-layer models were developed with interfaces at 20 and
“smooth” inverted resistivity models were developed using the 300 m depth as a starting model domain. Layers 1 and 2 have
lightly averaged data with 32 fixed-depth layers that increase starting resistivities of 1,000 ohm-m and layer 3 has a starting
in thickness as the layer interface depth increases from 5 to resistivity of 100 ohm-m, as a proxy for the Paleozoic carbon-
700 m. The starting resistivity for all model layers was 300 ates overlying the Bright Angel Shale. Lateral constraints were
ohm-meters (ohm-m). Relatively weak lateral (1.6) and verti- moderately firm (1.2), as the geologic structure of the plateau
cal (4.0) constraints on resistivity were chosen to allow rapid areas tends to be relatively uniform and flat lying.
transitions in resistivity between layers and soundings; weak Some soundings in the AEM dataset exhibit induced
constraints were considered to be most appropriate for the polarization (IP) effects that hinder the development of accu-
local geologic structure where abrupt transitions in rock types rate resistivity models through the inversion approach used
are common. A cumulative sensitivity-based AEM depth of here. These effects are caused by a combination of the pres-
investigation (DOI) was calculated for each sounding using ence of chargeable materials and the specific resistivity struc-
the approach developed by Christiansen and Auken (2012) and ture. Airborne IP effects can be measurable where chargeable
implemented in Aarhus Workbench to determine the depth at materials, such as metallic minerals, clay, and (or) fine-grained
which the model transitions from being well constrained by materials are present in the shallow near surface and are
the data to having reduced data sensitivity. directly underlain by highly resistive materials. These effects
In addition to the fixed-layer smooth models, “minimum were observed primarily on the Hualapai Plateau where thin
layer” models were also developed for the plateau areas using Tertiary-Quaternary alluvium and lower Pennsylvanian-upper
Table 1. Airborne electromagnetic data processing filters and inversion settings
[s, seconds; LM, low moment; HM, high moment; LCI, laterally constrained inversion; na, not applicable. All times are relative to the beginning of the transmitter
turn-off]
Processing scheme Trapezoidal Transmitter Receiver Window Inversion type Number Lateral Vertical
averaging moment gate time (s) width (s) of model constraint constraint
sounding layers
distance (s)
Heavy averaging 3 LM 1e-5 8 Minimum-layer 3 1.2 na
5e-5 12 LCI
HM 1e-4 8
5e-4 12
1e-3 16
Light averaging 1.5 LM 1e-5
6 Smooth LCI 32 1.6 4.0
1e-4 8
HM 1e-4 6
1e-3 8Major Hydrostratigraphic Contacts of the Truxton Basin and Hualapai Plateau from Airborne Electromagnetic Data 7
Mississippian clastic rocks are present on the surface and contributes to the gradational resistivity signature. The
underlain by limestone. IP effects were also found in some minimum-layer models, where both layer thickness and resis-
parts of the Truxton basin where thin alluvial cover over- tivity are modeled, were used in places to guide the interpreta-
lies resistive crystalline rocks. Where the IP component is a tion of contact elevations. Because the depths to individual
substantial part of the total measured response of the AEM model layers are determined on the basis of the AEM data
system, the resistivity models derived from the resistivity-only and not fixed as they are in the smooth models, they have the
inversion can become inaccurate (Viezzoli and others, 2017). freedom to more accurately reflect a discrete contact eleva-
Where IP effects were observed, the entire sounding was tion and can help reduce the ambiguity of interpreting across a
removed, resulting in data gaps in areas. gradational resistivity transition, particularly at greater depths.
Where smooth and minimum-layer models both perform well,
Interpretation Approach such as near Plain Tank Flat, the Music Mountains, and the
southern parts of the Hualapai Plateau where the depth to the
Two major hydrostratigraphic contacts were delineated Muav-Bright Angel contact is between about 300 and 500 m,
using the inverted resistivity models derived from the AEM both inversion results were used simultaneously to determine
data: the Muav Limestone-Bright Angel Shale contact and the the contact elevations. Where the Muav-Bright Angel contact
top of the crystalline basement (herein, basement surface). exceeds about 500 m in depth, such as in the northeastern
On the Hualapai Plateau, the Rampart Cave Member of the Hualapai Plateau and near the rim of the Grand Canyon, the
lower Muav Limestone is conceptualized to be the primary elevation of the top of layer 3 in the minimum-layer model
aquifer, with the underlying Bright Angel Shale acting as the was selected where models were laterally consistent and nor-
aquifer base. This conceptualization has been suggested by malized data misfits were less than 1.5. These criteria ensured
numerous previous investigators and is supported by obser- that the models adequately represent the data where used for
vations of springs along this contact in canyon exposures interpretation. In these same areas, where the targeted hydro-
(see, for example, Twenter, 1962; Huntoon, 1977). In much stratigraphic contacts are relatively deep, the basement surface
of the Truxton basin, erosion has removed most or all of the was commonly not resolved below the conductive Bright
Paleozoic sequence. Subsequent deposition of sediments and Angel Shale. In these instances, the interpreted basement sur-
volcanic materials in a network of paleocanyons and across face was draped below the Muav-Bright Angel contact by 125
the Truxton valley have led to a heterogenous aquifer where to 150 m; the distance between the Muav-Bright Angel contact
the sedimentary and volcanic deposits directly overlie crystal- and the basement surface was estimated using a combination
line basement. These paleocanyon and basin-fill deposits are of the observed thicknesses of the Bright Angel Shale and
conceptualized as the Truxton aquifer, with the crystalline Tapeats Sandstone in nearby outcrop (Billingsley and others,
basement acting as the aquifer base. 2006) and the interpreted thickness where both contacts were
Inverted resistivity models serve as the primary founda- reasonably well resolved in the smooth models.
tion of the hydrostratigraphic interpretation. Manual inter- Independent information about the geologic structure
pretation of the basement surface and the Muav-Bright Angel was used to inform the interpretation of the inverted resistiv-
contact were made by picking the elevation at which the ity models. Observations of contact elevations in outcrop
resistivity structure transitions from relatively low resistivity and surficial geologic maps (Arizona Bureau of Geology
sediments to high-resistivity crystalline rock, or high-resistiv- and Mineral Technology, 1988; Beard and Lucchitta, 1993;
ity limestone to low-resistivity shale, respectively. The smooth Billingsley and others, 2006) were used as controls for
models with fixed layer thicknesses were used independently developing an understanding of the resistivity signature of the
throughout the Truxton basin and across parts of the Hualapai target contacts throughout the survey area, as were lithologic
Plateau where the Muav-Bright Angel contact and the base- descriptions from drillers’ logs from the limited available well
ment surface are relatively shallow (8 Geophysical and Hydrogeologic Characterization of the Truxton Basin and Hualapai Plateau
Results and Discussion 2006). Where a transition in resistivity can be resolved below
the Bright Angel Shale, the crystalline basement appears as a
high-resistivity unit (>500 ohm-m) (fig. 3, unit X); where the
basement exceeds about 500 m in depth, it typically cannot be
Regional Resistivity Structure resolved below the Bright Angel Shale (for example, fig. 3A).
The Tapeats Sandstone, a relatively thin (A
Geologic map Base from Billingsley and others, 2006
Tv
500 m
A A'
0
−500
Dtb
Distance, in meters
235,000 240,000 245,000 250,000
Easting UTM 12N
Inverted resistivity section
1,800 WEST EAST
QT Hualapai Plateau
Tv
1,600 Grapevine Canyon
1,400 t m
1,200 X Mr/Dtb/m
ba
1,000
Elevation, in meters
ba
800
600
0 5,000 10,000 15,000 20,000
Distance, in meters
B
Geologic map Base from Billingsley and others, 2006
1,500 Dtb
1,000
500 B B'
0
−500
−1,000
−1,500
Distance, in meters
245,000 250,000 255,000 260,000 265,000 270,000 275,000 280,000
Easting UTM 12N
Inverted resistivity section
1,800 WEST Tv Hualapai Plateau EAST
Milkweed Canyon Hindu Canyon
QT
1,600
QT
Meriwhitica
1,400 Dtb/m monocline QT/Ts
1,200 Mr/Dtb/m
ba
Mr/Dtb/m
1,000
Elevation, in meters
X
800 ba
600
0 5,000 10,000 15,000 20,000 25,000 30,000 35,000
Distance, in meters
Figure 3 (pages 9–12). Sections of smooth inverted resistivity models for selected flight lines (locations shown on figs. 1, 2) with mapped and interpreted
geologic features. A plan-view geologic map showing the flight-line location is shown above each section. Geologic structures such as faults and monoclines
are shown with apparent dips where indicated on maps (for example, the Hurricane Fault) or interpretable from the resistivity sections; structures shown as
Major Hydrostratigraphic Contacts of the Truxton Basin and Hualapai Plateau from Airborne Electromagnetic Data 9
vertical if orientation is unknownC
Geologic map Base from Billingsley and others, 2006
1,500
1,000
500 C C'
0
−500
−1,000
−1,500
Distance, in meters
250,000 255,000 260,000 265,000 270,000 275,000 280,000 285,000
Easting UTM 12N
Inverted resistivity section
1,800 WEST Tv Music Mountains EAST
Plain Tank Flat Truxton basin
1,600 m Dtb/m QT
Ts X Hurricane Fault m Mr/Dtb/m
1,400 ba Mr/Dtb/m
QT/Ts ba
1,200 m
ba X
1,000 X
Elevation, in meters
paleocanyon above Milkweed Canyon
800
0 5,000 10,000 15,000 20,000 25,000 30,000 35,000
Distance, in meters
D
Geologic map Bases from Billingsley and others, 2006 (top) and modified from Arizona Bureau of Geology and Mineral Technology, 1988 (bottom)
2,000
1,000
D D'
0
−1,000
−2,000
Distance, in meters
255,000 260,000 265,000 270,000 275,000 280,000 285,000 290,000 295,000
Easting UTM 12N
Inverted resistivity section
1,800 WEST Hualapai Plateau EAST
Truxton basin M
Hurricane Fault
1,600 Truxton Mr/Dtb/m
Tv QT/Ts (town)
10 Geophysical and Hydrogeologic Characterization of the Truxton Basin and Hualapai Plateau
1,400 X
ba
1,200 Tv Ts X
Ts
1,000
Elevation, in meters
800
600
0 5,000 10,000 15,000 20,000 25,000 30,000 35,000 40,000 45,000
Distance, in meters
Figure 3 (pages 9–12). —ContinedE
Geologic map Base modified from Arizona Bureau of Geology and Mineral Technology, 1988
1,000
500
E E'
0
−500
−1,000
Distance, in meters
255,000 260,000 265,000 270,000 275,000 280,000
Easting UTM 12N
Inverted resistivity section
1,800 WEST EAST
Truxton basin
1,600 Hurricane Fault m
Tv Tv QT
Tv QT/Tv
1,400 ba
Ts?
Ts X X
1,200 Ts? X
X
1,000
Elevation, in meters
800
600
0 5,000 10,000 15,000 20,000 25,000
Distance, in meters
F
Geologic map Base modified from (left) Arizona Bureau of Geology and Mineral Technology, 1988 and (right) Billingsley and others, 2006
1,500
1,000
500
F F'
0
−500
−1,000
−1,500
Distance, in meters
3,915,000 3,920,000 3,925,000 3,930,000 3,935,000 3,940,000 3,945,000
Northing UTM 12N
Inverted resistivity section
1,800 SOUTH NORTH
Truxton basin Peach Springs Canyon
1,600
Tv
1,400 Tv/QT Hurricane Fault
X Ts ba
1,200 m QT/
Ts
1,000
Elevation, in meters
X
800 ba
600
0 5,000 10,000 15,000 20,000 25,000 30,000 35,000
Distance, in meters
Figure 3 (pages 9–12). —Contined
Major Hydrostratigraphic Contacts of the Truxton Basin and Hualapai Plateau from Airborne Electromagnetic Data 11EXPLANATION
Geologic groupings from this study This study Billingsley and others, 2006 This study Arizona Bureau of Geology and This study Richard and others, 2000
Mineral Technology, 1988
QT Tertiary-Quaternary sedimentary QT Qs Stream-channel deposits QT Q Quaternary surficial deposits,
deposits, undifferentiated QT Qg Younger gravel undivided
QT Qay Young alluvial fan deposits
Tv Tertiary volcanic rocks QT Qgo Older gravel -- QTb Holocene to middle Pliocene
QT Qls Landslide deposits basaltic rocks
Ts Tertiary sedimentary deposits, QT Tf Fanglomerates
undifferentiated QT QTg Old gravel deposits -- Qy Holocene surficial deposits
Volcanic rocks
M Supai Group sedimentary units QT Tg Young gravel and sedimentary QT Qo Early Pleistocene to late Pliocene
Tr Rhyolite and trachyte
deposits Tv surficial deposits
Tb Basalt and basaltic andesite
Mr Redwall Limestone
Tv Tv Andesite flows and basalt flows, -- QTs Early Pleistocene to late Miocene
Dtb Temple Butte Formation undivided Mr MDu Mississippian/Devonian sedimentary basin deposts
Dtb rocks—Undifferentiated; includes
Tonto Group Tv Tp Quartz monzonite pluton Redwall Limestone and Temple QT Tsy Pliocene to middle Miocene
Butte dolomite deposits
m Muav Limestone
Ts Tgc Paleozoic-clast conglomerate
m tu Cambrian sedimentary rocks—Tonto
ba Bright Angel Shale Tv Tby Pliocene to late Miocene basaltic
Ts Ts1 Old gravel and sedimentary ba Group, undifferentiated; includes rocks
deposits Muav Limestone, Bright Angel
t Tapeats Sandstone t
Shale, and Tapeats Sandstone -- Tb Late to middle Miocene basaltic
M Ms Wescogame Formation, rocks
X Crystalline basement
X Granitic plutonic rocks
Manakacha Formation, and Pg
Watahomigi Formation, Tv Tv Middle Miocene to Oligocene
undivided X Pgn Gneissic rocks volcanic rocks
Mr Mr Redwall Limestone, undivided Ts Tso Oligocene to Paleocene?
sedimentary rocks
Dtb Dtb Temple Butte Formation
-- TKg Early Tertiary to Late Cretaceous
Tonto Group granitic rocks
m m Muav Limestone
-- P Permian sedimentary rocks
ba ba Bright Angel Shale
M P Permian to Pennsylvanian
t t Tapeats Sandstone sedimentary rocks
X Xgr Granite, granitic pegmatite, and Mr m M Mississippian, Devonian, and
aplite ba t Cambrian sedimentary rocks
X Xu Dtb
Crystalline rocks, undifferentiated
-- Yg Middle Proterozoic granitic rocks
12 Geophysical and Hydrogeologic Characterization of the Truxton Basin and Hualapai Plateau
Resistivity, in ohm-meters A A' Geophysical flight line X Xg Early Proterozoic granitic rocks
Mapped faults on resistivity
2,000 plots Early Proterozoic metasedimentary
X Xms
1,000 rocks
Mapped geologic structures X Xmv Early Proterozoic metavolcanic
100 on resistivity plots rocks
X Xm Early Proterozoic metamorphic
Inferred structures on rocks
10 resistivity plots
5 Although the units of Richard and others (2000) shown in
figure 2 are not shown in figure 3, their correlation to the
units in this study is shown here.
Figure 3 (pages 9–12). —ContinedMajor Hydrostratigraphic Contacts of the Truxton Basin and Hualapai Plateau from Airborne Electromagnetic Data 13
Paleozoic sequence is absent (Natural Resource Consulting such as the Hurricane Fault and Meriwhitica monocline, are
Engineers, 2011). East of the Hurricane Fault, Paleozoic rocks apparent in the surfaces (figs. 5–7) where they have substantial
may underlie the surficial sediments. Crystalline rocks are influence on the elevation of the hydrostratigraphic contacts.
exposed at the surface near the southern extent of the basin or Regional faults in particular appear smoother than typical of
underlie thin alluvial cover or remnants of the Bright Angel planar structures, owing in part to the regional focus of the
Shale or Tapeats Sandstone (fig. 3E, unit X). The basement interpretation, the relatively large distance between flight lines
rocks tend to be more resistive (>500–1,000 ohm-m) but requiring interpolation of contact positions between lines, and
also have a more complex resistivity character than the more the anticipated resolution of the numerical groundwater model
uniformly resistive limestone units, which is not uncommon in (300 m x 300 m model cells). Smaller faults and monoclines
metasedimentary and (or) fractured crystalline rock complexes with lower displacements are apparent in many locations in
(fig. 3D, E; fig. 4B, C, D, circle 1). the inverted resistivity models (fig. 3) but were not explicitly
The low- and moderate-resistivity sediments of the included in the interpreted hydrostratigraphy owing to its
central part of Truxton basin show a general northeast trend regional-scale focus.
following the previously mapped paleocanyons (fig. 4). These
sediments appear to be thickest near the town of Truxton Muav Limestone-Bright Angel Shale Contact
(figs. 3D, 4). A high point in the crystalline basement south of
Truxton (fig. 4B, C, circle 2) appears to separate this channel The elevation of the Muav Limestone-Bright Angel Shale
into two structural lows. The western low follows the trend (_m-_ba) contact was delineated as the base of the aquifer
of a paleocanyon interpreted by Elston and Young (1991) for the Paleozoic limestone formations that are present pre-
(fig. 4B, C, circle 3). The eastern low mostly aligns with the dominantly on the Hualapai Plateau (figs. 5, 7). The inverted
downthrown side of the Hurricane Fault, although the complex resistivity model sensitivity to individual geologic layers var-
geometry of the northern extent of this low suggests that it ies as a function of the relative depth, thickness, and resistivity
may have an erosional origin and may also be a paleocanyon contrast of the interlayered units. As such, the relative resistor-
(fig. 4B, C, circle 4). To the north, as the land surface elevation over-conductor signature of the interpreted Muav-Bright
drops towards the Colorado River, a high-resistivity block Angel contact reflects the depth of transition from predomi-
correlated to the Paleozoic sequence appears to separate the nantly limestone to predominantly shale and is an aggregated
paleocanyon sediments of the greater Truxton basin from the representation of the typically gradational contact between
conductive sediments in lower Peach Springs Canyon (fig. 3F, the two formations. Inverted model sections were evaluated
units QT/Ts; fig. 4D, circle 5). This section of the Hurricane in the context of model quality and observations from geo-
Fault is mapped as a relatively complex zone containing logic maps to create a series of interpretational control points
several fault strands (Billingsley and others, 2006). Given the defining the three-dimensional (3-D) contact position. Owing
relatively high resistivity of both the basement and limestone, to the relatively deep nature of the Muav-Bright Angel contact
the geometric complexity of the faults, and the structural across the northeastern plateau and the associated low AEM
damage zone that may be associated with the fault, it’s signal-to-noise ratio, the minimum-layer inverted resistivity
difficult to accurately interpret the stratigraphy of this region models were used as the primary resistivity structure guiding
or to assess the hydrologic connectivity of the sedimentary fill interpretation in the northeastern part of the survey area (fig.
of the Truxton basin to lower Peach Springs Canyon. 7A, B). The top of layer 3 in the minimum-layer models was
used as a proxy for contact elevation where the layer interface
occurs above the estimated AEM DOI, where normalized
Delineation of Major Hydrostratigraphic model residuals were below 1.5 suggesting that the AEM data
Contacts could be effectively modeled using this stratigraphic scenario,
and where the top of layer 3 could be correlated to the general
The interpreted hydrostratigraphic contact elevation trend in the elevation of Muav-Bright Angel contact expected
surfaces are intended to be a regional-scale representation from interpolations between outcrop observations in cliff faces
for groundwater modeling of the Paleozoic limestone and and canyons. Where the Muav-Bright Angel contact is within
Truxton aquifers (figs. 5, 6). As such, these surfaces are the upper few hundred meters of the land surface and (or)
not intended to represent internal structure or variations in where the resistivity structure showed more complexity than
permeability within individual formations. In many locations, the three-layer scenario, such as near the margins of the Grand
variations in resistivity correlate to internal structure, such Wash Cliffs, near Grapevine Canyon, and near Plain Tank Flat,
as the contrasts between volcanic and sedimentary deposits the smooth models served as the primary interpretation source
in the Truxton basin (fig. 3D, E, F, units Tv, Ts, and QT) (fig. 7, all sections).
or layering within the Paleozoic sequence that may indicate More than 1,000 Muav-Bright Angel control points
changes in porosity, saturation, or lithology (fig. 3C, units Mr/ were established from the inverted resistivity models. These
Dtb/_m). The hydrostratigraphic surfaces also do not attempt control points were supplemented with outcrop control points
to explicitly represent individual faults or other geologic derived from the digitized contact location in the 1:100,000-
structures. Stratigraphic separation along regional structures, scale Peach Springs quadrangle (Billingsley and others,14 Geophysical and Hydrogeologic Characterization of the Truxton Basin and Hualapai Plateau
A. 10 meters B. 100 meters
114° 113°30'
36°
5 5
35°30'
3
1
2 4
C. 200 meters D. 400 meters
5 5
Map area
3
ARIZONA
1 1
2 4
Base from 2012 U.S. Geological Survey 100-meter digital data 0 10 20 MILES
Universal Transverse Mercator, Zone 12 North
North American Datum of 1983 0 10 20 KILOMETERS
EXPLANATION
Resistivity, in Fault—Includes approximately
ohm-meters located, concealed, or
2,000 inferred faults Figure 4. Maps showing smooth inverted resistivity models at
1,000
Regional depths near 10 m (A), 100 m (B), 200 m (C), and 400 m (D) below
Other mapped fault land surface. Numbered circles identify features described in
100 Regional monocline the text. See figure 2 for references related to geologic map
Interpreted paleocanyon extents, regional faults, regional monoclines, and interpreted
Groundwater model extent paleocanyons; other mapped faults from Beard and Lucchitta
10
5 Extent of geologic maps (1993) and Billingsley and others (2006).Major Hydrostratigraphic Contacts of the Truxton Basin and Hualapai Plateau from Airborne Electromagnetic Data 15
2006). Outcrop elevations were defined by the USGS National Angel contact is at a higher elevation immediately east of
Elevation Dataset (NED) 1-arc-second digital elevation the paleocanyon, the higher resistivity unit underlying the
model (U.S. Geological Survey, 2016). Control points were conductive fill of Milkweed Canyon is interpreted to be
gridded into a 3-D surface using the minimum curvature crystalline basement. The Muav-Bright Angel contact was
method with a 300-m cell resolution to be consistent with the interrupted at the apparent buried margins of the paleocanyon
anticipated resolution of the groundwater model domain. The to reflect the likely erosion of the Paleozoic sequence.
resulting grid was smoothed to remove interpolation artifacts Elston and Young (1991) interpreted an interconnected
between control points and to create a geologically realistic paleocanyon between modern Milkweed and Hindu Canyons
surface (fig. 5). The final grid was clipped where its elevation (fig. 5). Although the resistivity underlying both features is
exceeded the NED to accurately represent the modern low (fig. 7B, C), modern hydrogeologic connectivity of the
hydrogeologic discontinuity created by canyons that presently Tertiary sediments in a single paleocanyon does not appear
dissect the Hualapai Plateau. likely based on the inverted resistivity models. The deep
In the Truxton basin and upper Milkweed Canyon, topographic incision of modern Milkweed Canyon has created
erosion has removed part or all of the Paleozoic sequence a hydrologic disconnect from sediments in Hindu Canyon,
including the Muav-Bright Angel contact. In the upper suspending them at a modern elevation of about 1,400 m.
Milkweed paleocanyon, the Bright Angel Shale is interpreted In modern Hindu Canyon, the transition to higher resistivity
to be absent (fig. 5, circle 1; fig. 7C). The resistivity materials underlying the conductive sediments is likely to
underlying the mapped surficial volcanic deposits is notably indicate a contact between sediments and limestone, based
lower (You can also read


