The Guadalfeo Monitoring Network (Sierra Nevada, Spain): 14 years of measurements to understand the complexity of snow dynamics in semiarid regions
←
→
Page content transcription
If your browser does not render page correctly, please read the page content below
Earth Syst. Sci. Data, 11, 393–407, 2019
https://doi.org/10.5194/essd-11-393-2019
© Author(s) 2019. This work is distributed under
the Creative Commons Attribution 4.0 License.

            The Guadalfeo Monitoring Network (Sierra Nevada,
           Spain): 14 years of measurements to understand the
            complexity of snow dynamics in semiarid regions
                      María J. Polo, Javier Herrero, Rafael Pimentel, and María J. Pérez-Palazón
        Fluvial Dynamics and Hydrology Research Group – Andalusian Institute for Earth System Research (IISTA),
                                    University of Cordoba, Córdoba, 14071, Spain
                                     Correspondence: María J. Polo (mjpolo@uco.es)

                              Received: 30 September 2018 – Discussion started: 12 November 2018
                         Revised: 25 February 2019 – Accepted: 4 March 2019 – Published: 19 March 2019

       Abstract. This work presents the Guadalfeo Monitoring Network in Sierra Nevada (Spain), a snow mon-
       itoring network in the Guadalfeo Experimental Catchment, a semiarid area in southern Europe representa-
       tive of snowpacks with highly variable dynamics on both annual and seasonal scales and significant topo-
       graphic gradients. The network includes weather stations that cover the high mountain area in the catch-
       ment and time-lapse cameras to capture the variability of the ablation phases on different spatial scales.
       The data sets consist of continuous meteorological high-frequency records at five automatic weather stations
       located at different altitudes ranging from 1300 to 2600 m a.s.l. that include precipitation, air temperature,
       wind speed, air relative humidity and the short- and longwave components of the incoming radiation, dating
       from 2004 for the oldest station (2510 m a.s.l.) (https://doi.org/10.1594/PANGAEA.895236); additionally, daily
       data sets of the imagery from two time-lapse cameras are presented, with different scene area (30 m × 30 m,
       and 2 km2 , respectively) and spatial resolution, that consist of fractional snow cover area and snow depth
       from 2009 (https://doi.org/10.1594/PANGAEA.871706) and snow cover maps for selected dates from 2011
       (https://doi.org/10.1594/PANGAEA.898374). Some research applications of these data sets are also included
       to highlight the value of high-resolution data sources to improve the understanding of snow processes and distri-
       bution in highly variable environments. The data sets are available from different open-source sites and provide
       both the snow hydrology scientific community and other research fields, such as terrestrial ecology, riverine
       ecosystems or water quality in high mountains, with valuable information of high potential in snow-dominated
       areas in semiarid regions.

1   Introduction                                                  i.e. hydropower production, drinking water and irrigation
                                                                  (Barnett et al., 2005), these areas require a particular scien-
Warming trends in climate cause an alarming change in             tific focus. Great efforts have been taken in mountain hydrol-
snow patterns over mountainous areas (Liston and Hiem-            ogy in large mountainous ranges (Mankin and Diffenbaugh,
stra, 2011). The dominant role of snowfall over these areas       2015; Mernild et al., 2017), specifically the world’s major
is being shifted to a rainfall–snowfall regime, which changes     mountain ranges (Marty et al., 2017; Verbyla et al., 2017;
the snow accumulation dynamics (Musselman et al., 2017).          Rizzi et al., 2018). However, there are a significant num-
Evaposublimation and snowmelt have also altered their be-         ber of mountainous areas situated in warmer and drier mid-
haviour, with a clear impact on the hydrological response         latitudes, where snowmelt also constitutes the main compo-
and changes in both the timing and availability of water          nent of the total water resources during the summer season.
resources. Taking into account that one-sixth of the total        This is the case of semiarid Mediterranean mountainous ar-
Earth’s population depends on snowmelt for water resources,       eas (Fayad et al., 2017), for instance, Sierra Nevada (south-

Published by Copernicus Publications.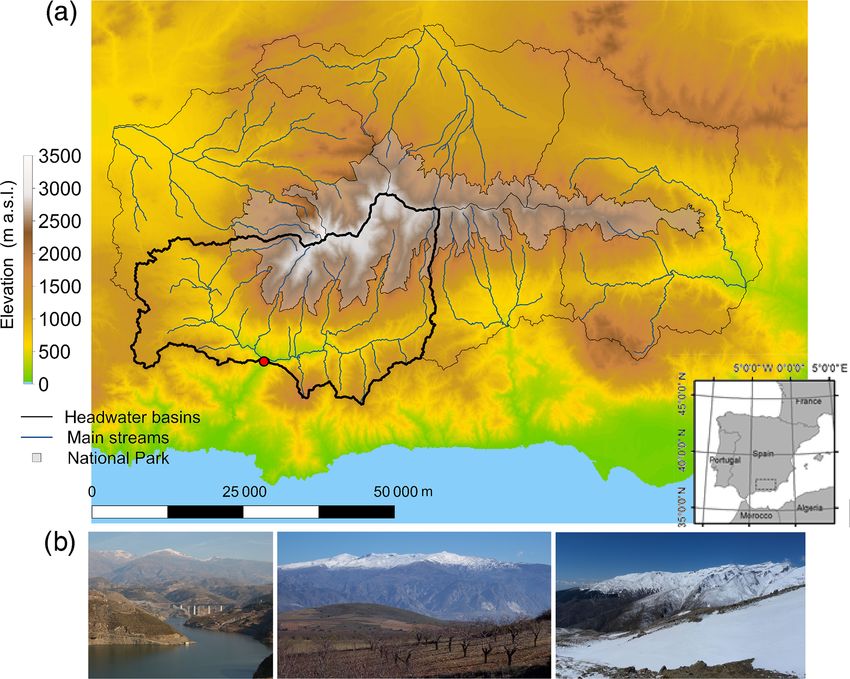
394                                              M. J. Polo et al.: The Guadalfeo Monitoring Network (Sierra Nevada, Spain)

ern Spain; Perez-Palazón et al., 2018), the eastern part of        since monitoring efforts are concentrated in the agricultural
the Pyrenees (Spain; López-Moreno et al., 2009), the Atlas         areas in mid-latitudes and low altitudes.
mountain range (northern Morocco; Marchane et al., 2015),             Sierra Nevada (Spain) is a clear example of a high moun-
Mount Etna and the southern Calabrian mountains (Italy;            tain area in a semiarid context. This 80 km long mountain
Senatore et al., 2011), the southern face of the Alps (France      range runs parallel to the shoreline of the Mediterranean Sea
and Italy), the Taurus Mountains (Turkey), Mount Lebanon           in southern Spain, with frequent snowfall from November
and the Anti-Lebanon Mountains (Lebanon; Mhawej et al.,            to April in the area above 2000 m a.s.l. that usually under-
2014), Sierra Nevada (USA; Molotch and Meromy, 2014),              goes much ablation before the summer. Its proximity to the
and the Andes (Chile; Favier et al., 2009; Váldés-Pineda et        sea favours the coexistence of Mediterranean and alpine cli-
al., 2014). Moreover, the majority of them comprise spots          mates within just a 40 km distance. Its particular location and
or areas with high environmental value, in many cases bio-         steep topographic gradient make Sierra Nevada a region rec-
sphere reserves with an outstanding amount of endemism.            ognized as one of the most important reservoirs of biodiver-
Thus, these regions also constitute natural laboratories where     sity in Europe, with the presence of a large number of en-
warming trends are not only being noticed but also have sig-       demic species (Heywood, 1995; Blanca, 2002; Anderson et
nificant impacts on the snow dynamics. Consequently, they          al., 2011), as well as being a major ski resort in southern Eu-
are locations where these effects can be evaluated early, pro-     rope during the spring. The projections of future climate in
vided the availability of key observations to analyse the ma-      this area (Pérez-Palazón et al., 2018) point out the enhance-
jor drivers of change (López-Moreno et al., 2017). A large         ment of the variability of the snowfall regime and the in-
number of current studies are focused on reproducing the           creased frequency of ablation cycles during the season. How-
most likely future climate scenarios and their impacts and         ever, the weather network was restricted to the area below
trying to establish strategies to adapt to and mitigate these      1500 m a.s.l. until the beginning of the 21st century, mostly
changes (Andrew and Sauquet, 2017; Ergon et al., 2018).            concentrated below 1000 m a.s.l., and a significant gap was
However, the intrinsic variability of climate and the large        found to not only estimate snowfall but also analyse tempera-
spatial coverage of the snowpack in these areas, with fre-         ture and precipitation regimes in the mountains. The southern
quently patchy behaviour, not only at the end of the snow sea-     face of Sierra Nevada is the headwater area of the Guadalfeo
son, but also during the autumn and winter due to the differ-      River basin and constitutes the major water source for ur-
ent accumulation–ablation cycles, in Mediterranean moun-           ban supply and high-value crop irrigation in the coastal ar-
tain regions pose an opportunity to study the impact of the        eas downstream, where there is a big reservoir, built in 2002,
climate trends on snow occurrence and persistence and to an-       to face drought periods and the increasing development of
ticipate likely changes in higher latitudes.                       coastal tourism and related facilities.
   Snow distribution in warm mid- and low-latitude loca-              This work presents the monitoring network implemented
tions is more variable and irregular than in northern regions.     in Sierra Nevada since 2004 to study the snow dynamics in
(1) Several accumulation–melting cycles occur throughout           this area and its hydrological impacts. The Guadalfeo Mon-
the year, with very different duration (Pimentel et al., 2017c).   itoring Network comprises five automatic weather stations
(2) A wide range of snow depth states is usually found, gen-       located above 1300 m a.s.l., mainly in the Guadalfeo River
erally closer to the order of magnitude of the surrounding         basin, that were gradually installed during 2004–2017; addi-
microrelief (1–1000 mm) (Anderton et al., 2004). (3) A par-        tionally, three time-lapse cameras complement the network
ticular patchy snow distribution, ranging from 1 m2 to hun-        and provide high-resolution images of the snow cover area
dreds of square metres (Pimentel et al., 2017a), is one of the     on different spatial scales from 2009. The Guadalfeo Net-
major consequences of extremely variable conditions over           work has been developed and maintained since then by the
these regions (i.e. high level of solar radiation between pre-     Fluvial Dynamics and Hydrology Research Group from the
cipitation events, mild winters followed by cool springs and       Andalusian Institute for Earth System Research. The data
vice versa and the alternance of severe drought periods and        set included consists of a 13-year series of weather vari-
highly torrential wet seasons). All these variability sources      ables (2004–2018), a 7-year series of snow observations
make an accurate, continuous and well distributed monitor-         from terrestrial imagery (2009–2016) and a number of snow
ing network necessary that is able to capture the main pro-        cover maps from a second camera on selected dates (dur-
cesses related to snow dynamics, both meteorological forc-         ing 2011–2013), from which snow modelling (Herrero et
ing and snow properties, and ultimately their impact on the        al., 2009, 2011), weather variables’ analysis and mapping
river flow. However, the difficult access to mountainous areas     (Aguilar et al., 2010; Aguilar and Polo, 2011; Herrero and
complicates the installation and maintenance of meteorologi-       Polo, 2012), snowmelt–evaposublimation partitioning (Her-
cal stations and somehow limits continuous surveys and field       rero and Polo, 2016), subgrid-scale effects of patchy snow
campaigns being carried out in practice to monitor the snow        conditions (Pimentel et al., 2015, 2017c) and other snow-
properties. Hence, there is usually a lack of weather stations     related processes or impacts have been studied (Millares et
in high mountain areas, which increases in semiarid regions        al., 2009, 2014; Gómez-Beas et al., 2012; Gómez-Giráldez et

Earth Syst. Sci. Data, 11, 393–407, 2019                                            www.earth-syst-sci-data.net/11/393/2019/
M. J. Polo et al.: The Guadalfeo Monitoring Network (Sierra Nevada, Spain)                                                    395

al., 2014; Egüen et al., 2016; Pimentel et al., 2017a; López-      versicolor and Festuca Clementei). Some isolated spots of
Moreno et al., 2017; Algarra et al., 2019).                        reforested conifers can also be found in this area but never
                                                                   in elevations higher than 2500 m a.s.l. In contrast, outside of
                                                                   the snow area, small oak, poplar and chestnut tree forests and
2   The Guadalfeo River basin                                      traditional agriculture are the dominant areas.
                                                                      The monitoring resources in the Guadalfeo Experimen-
The Guadalfeo River basin is one of the five main watersheds       tal Catchment consist of the Guadalfeo Network (Fig. 2),
whose headwaters belong to the Sierra Nevada mountain              whose weather and camera stations are mostly located in
range in southern Spain (Fig. 1). Its location on the south-       this catchment, all of them above 1200 m a.s.l.; other weather
western face of Sierra Nevada results in a predominant south-      station networks operated by public national and regional
ern orientation, with high insolation rates during the year        agencies (mostly below 1000 m a.s.l.); the Refugio Poqueira
and a proximity to the Mediterranean Sea, which makes this         experimental site (surrounding area of PG2 in Fig. 2) at
watershed a very particular environment due to the coexis-         2500 m a.s.l., where snow and soil are monitored by addi-
tence of a Mediterranean climate in the lower elevations and       tional instrumentation and systematic field campaigns for
an alpine climate in the headwaters of the catchment. This         snow monitoring are carried out; and gauge stations in
main south-facing aspect changes in the western zones, as the      the main streams and inflow estimations to the reservoirs,
higher hillsides are north-oriented. Low-population areas and      both operated by the River Basin District of the Andalusian
marginal agriculture (supported by snowmelt-fed historical         Mediterranean Basins.
irrigation systems) are found in the mountains, whereas the
coast and the bottom valley are densely populated, with the
                                                                   3     The Guadalfeo Network
local economy based on tropical-crop-growing and tourism.
The highest area of the catchment (above 1000–1500 m a.s.l.)       The Guadalfeo Network was specifically designed to both fill
is included in the Sierra Nevada National Park, which is           the gap in the weather station distribution above 1000 m a.s.l.
also a biosphere reserve. There are two reservoirs in the          in Sierra Nevada and monitor the weather and snow regime
watershed: Béznar (56 hm3 maximum capacity) and Rules              in the snow-dominated areas. Figure 2 shows the location of
(111 hm3 maximum capacity). The first one is located in the        the automated weather stations (PG points) and camera lo-
Ízbor River, a tributary of the Guadalfeo River, whose flow        cations for terrestrial imagery acquisition, including their re-
comes from the north-oriented area within the catchment,           spective associated scenes, together with the reservoirs and
and the second one is located in the Guadalfeo River main          gauge stations in the river network. The weather stations have
stream and collects water from the whole southern face and         been sequentially installed since 2004 and they are equipped
the outflow from the Béznar reservoir. Additionally, small         to monitor the radiation components. The following points
dams for hydropower generation are present upstream of the         describe the network in detail.
reservoirs in the snow-dominated areas in the mountains. The
location of Rules dam is selected as the output of the water-
shed, since the flow regime is modified downstream and the         3.1    Weather stations
available records cannot then be used to reproduce the natural     Five weather stations are currently included in the Guadalfeo
fluvial regime; moreover, the daily inflow data to the reser-      Network (red dots in Fig. 2). Table 1 and Fig. 3 show, re-
voir are used for the closure of the water and energy balance      spectively, the equipment installed at each station and the
on the catchment scale.                                            chronological sequence of the network development and data
   The Guadalfeo Experimental Catchment comprises the              acquisition. Three domains can be identified in the stations’
contributing area to the Rules dam, a control point of in-         distribution:
flow to the reservoir. This upstream catchment has an area of
1058 km2 , with an average elevation of 1418 m a.s.l, ranging          – PG1 (November 2005) and PG2 (November 2004)
from 300 to 3479 m a.s.l. The average annual precipitation               are the highest stations of the network (around
is very variable, even in consecutive years, and ranges from             2500 m a.s.l.); they are located in two of the main head-
approximately 300 to 1200 mm in dry and wet years, respec-               water subbasins within the catchment, in the Bérchules
tively. The average daily temperature in the Guadalfeo basin             and Poqueira valleys, respectively. PG4 (October 2012)
for the last 40 years was 12.4 ◦ C (Pérez-Palazón et al., 2015),         is also located in the Poqueira River subbasin at a lower
which is higher than values recorded in other alpine climates            elevation than PG2 to capture the altitudinal gradient,
with similar altitudes. These average values are calculated              which is particularly important in this valley due to the
over a reference period (1690–2000) with all meteorolog-                 steepness of the terrain.
ical information available in the catchment for this period
(red and black dots in Fig. 2). The vegetation in the snow-            – PG3 (August 2009) is located outside of the Sierra
dominated area, mainly above 2000 m a.s.l., is composed of               Nevada mountain range, in the left margin of the
pastures and low shrubs (Hormathophylla spinosa, Genista                 Guadalfeo River in the Contraviesa Mountains, exactly

www.earth-syst-sci-data.net/11/393/2019/                                              Earth Syst. Sci. Data, 11, 393–407, 2019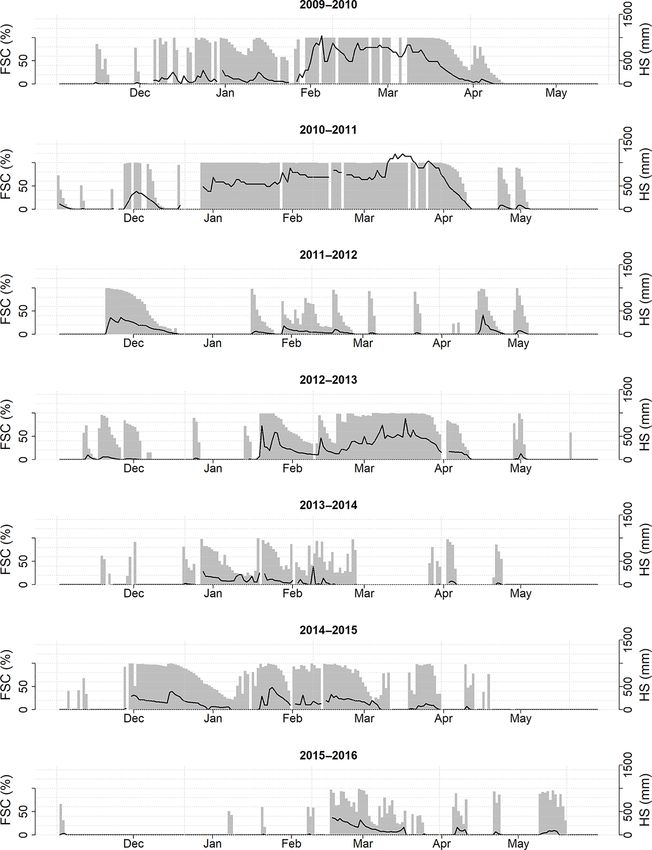
396 M. J. Polo et al.: The Guadalfeo Monitoring Network (Sierra Nevada, Spain)
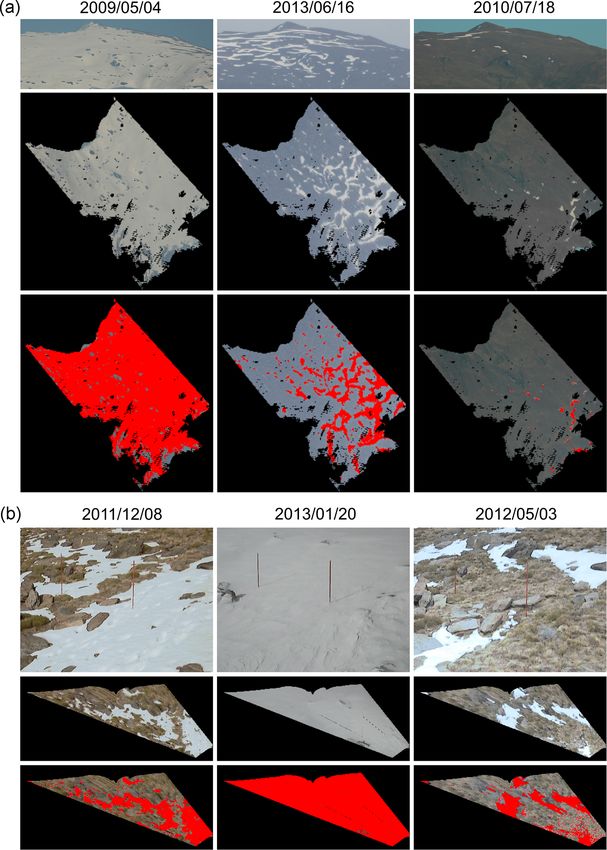
Figure 1. The Guadalfeo Experimental Catchment study site in Sierra Nevada (Spain). (a) Topography of the area, major fluvial streams
and limits of the catchment (black line); the red circle corresponds to the Rules dam, the closure of the catchment, and the greyish area is the
National Park domain. The inset shows the location in Spain. (b) Some representative views.
in the crest of the range; this area lacked stations to cap- video images). As a result, any suspicious 5 min record is
ture the altitudinal gradients of the meteorological vari- removed from the series; to generate hourly series, only pe-
ables, and this point was needed to improve the precipi- riods with fewer than two removals are kept (i.e. a maximum
tation distribution and, thus, the hydrological modelling uncertainty of 8.33 % is due to gaps in the record), and only
of the inflows to the Rules reservoir, which also receives days with complete hourly values are included in the daily
runoff from this area. Moreover, sea influence is also series. No gap filling is done on the resulting series on any
relevant on this location. timescale to keep the original data set, and it is up to the user
to apply any gap-filling technique if required. Additionally,
– Finally, PG5 (March 2017) is so far the only station in periodic calibration of the solar radiation, temperature and
the network that is located outside of the Guadalfeo Ex- relative humidity sensors is performed on an annual basis by
perimental Catchment; its location was chosen as a first means of portable calibrated sensors provisionally installed
step to fill the gap of meteorological information in the beside each station. The fraction of removed records varies
north-western area of Sierra Nevada. depending on the variable but is generally below 0.01 % in
the network.
All the stations monitor six weather variables: precipi- No correction is done on the data to account for poten-
tation, temperature, relative humidity of the air, incoming tial snow undercatch; the pluviometers above 1500 m a.s.l.
shortwave radiation (not measured by PG1), wind and at- are equipped with either Alter or Tretyakov shields to im-
mospheric pressure (Table 1). The incoming longwave ra- prove snow catching; the different field tests performed at
diation is additionally measured at PG2, PG3 and PG5. At the stations sites showed negligible undercatch amounts dur-
each station, a data logger records 5 min averages of 5 s sam- ing the most frequent events. The mean value of wind speed
pling rate observations; data are transmitted via modem to during snowfall events ranges between 3.1 and 4.8 m s−1 at
the Andalusian Institute for Earth System Research, where stations PG1 to PG4 (with mode values ranging from 1 to
they undergo a quality-control process. This quality control 2.5 m s−1 ) and 0.8 m s−1 at station PG5 (with a mode value of
consists of standard limit checking, intercomparison of val- 1 m s−1 ). However, under extreme conditions this might not
ues for each variable with the nearby stations and internal hold; during the study period the maximum wind speed reg-
checking of the values of a given variable in the context of istered ranged from 12.1 m s−1 (PG3) and 24.7 m s−1 (PG1).
the whole set of information at the same station (including
Earth Syst. Sci. Data, 11, 393–407, 2019 www.earth-syst-sci-data.net/11/393/2019/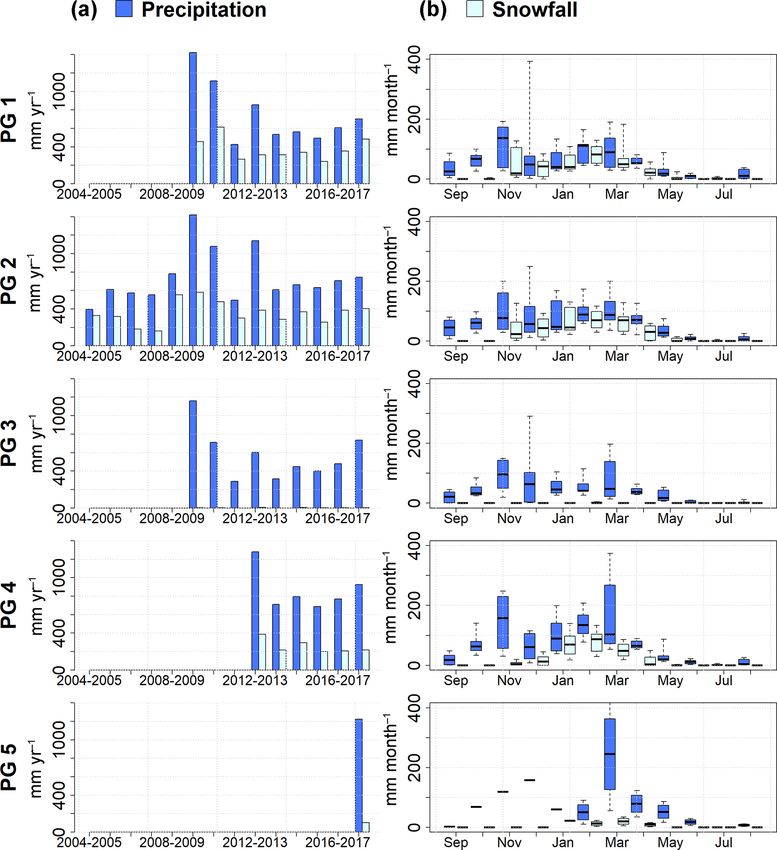
M. J. Polo et al.: The Guadalfeo Monitoring Network (Sierra Nevada, Spain)                                                                  397

Figure 2. The Guadalfeo Network in Sierra Nevada (Spain). PG, weather stations (red circles); C, time-lapse cameras (crossed circles); S,
the camera scenes (red rectangles; S2 is a near-field scene and cannot be represented due to its size). Black points identify the location of
weather stations belonging to other meteorological networks in the Sierra Nevada area. The limits of the Guadalfeo Experimental Catchment
(black line), the main river streams (blue line), gauge stations (blue triangles) and reservoirs (blue areas) are included over the elevation map
of the area.

                                                                           3.2   Terrestrial imagery

                                                                           Currently, the Guadalfeo Network includes three time-lapse
                                                                           cameras (Fig. 2), all located above 1200 m a.s.l., which cover
                                                                           different scenes associated with different spatial scales. Ta-
                                                                           ble 2 shows selected characteristics of each camera together
                                                                           with an example image to illustrate the scene they capture.
                                                                           Two of them (C2 and C3) are both located and cover a scene
                                                                           in the highest region of the Guadalfeo Experimental Catch-
                                                                           ment but with different spatial scale and resolution.
                                                                              C2, at the Refugio Poqueira experimental site in the sur-
                                                                           roundings of PG2, covers a 30 m × 30 m scene (equivalent
Figure 3. Recording period and data availability for each weather
                                                                           to the spatial resolution of the Landsat TM sensors) and is
station and variable in the Guadalfeo Network (Sierra Nevada,
Spain) since 2004.
                                                                           devoted to the microscale effects on snow ablation; it also
                                                                           complements the information recorded by the weather sta-
                                                                           tion, since it provides sub-daily measurements of snow depth
Again, the data are delivered without any modification so that             (by means of calibrated rods easy to identify from the im-
interested users can decide whether they are correct or not for            ages) and estimations of snow-covered area in the scene (af-
their own applications, provided that the wind data are also               ter processing of the images).
included in the data set.                                                     C3 covers a larger scene (500 m × 500 m) and provides
   With very few exceptions, the stations have been record-                sub-daily estimations of snow cover area on the hillslope
ing data on a continuous basis since their deployment; PG1                 scale, as a validation data source for the results from C2.
had some initial problems and was reinstalled at the end of                   Finally, C1 is focused over a larger hillslope in the only
summer 2009 (Fig. 3).                                                      subbasin of the Guadalfeo Experimental Catchment on the
                                                                           northern face of Sierra Nevada; this camera covers the largest
                                                                           scene (2 km2 ) in the network, and the images provide both

www.earth-syst-sci-data.net/11/393/2019/                                                       Earth Syst. Sci. Data, 11, 393–407, 2019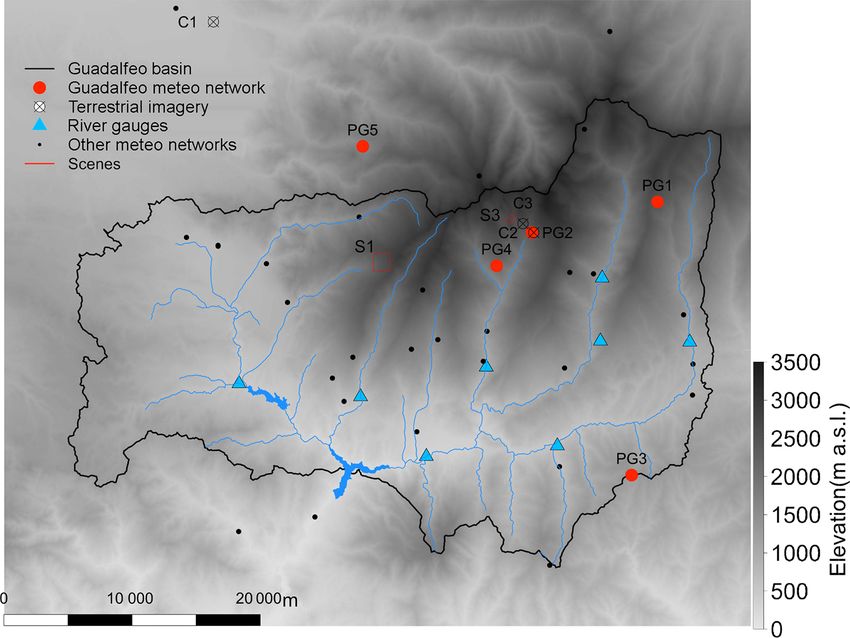
398 M. J. Polo et al.: The Guadalfeo Monitoring Network (Sierra Nevada, Spain)
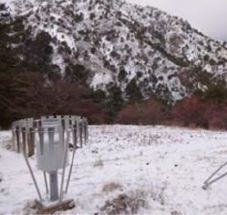
Table 1. Main characteristics of the weather stations in the Guadalfeo Network: elevation (m a.s.l.), date of installation and instruments. In
situ pictures are also shown.
ID PG1 PG2 PG3 PG4 PG5
Elevation 2470 2510 1332 2141 1675
Installation Nov 2005 Nov 2004 Aug 2009 Oct 2012 Mar 2017
operational operational operational operational operational
Rain gauge OTT Pluvio 2 Geonor T-200B Young 52203 OTT Pluvio 2 OTT Pluvio 2 &
Young 52203
Temperature Campbell Scientific Vaisala Vaisala Vaisala Campbell
Relative CS215 HMP45C HMP45C HMP45C CS HC2S3
humidity
Pyranometer – Kipp & Zonnen Hukseflux Hukseflux Hukseflux
SP Lite LP02-05 LP02-05 LP02-05
Pyrgeometer – Kipp & Zonen Hukseflux Hukseflux Hukseflux
CGR3 IR02 IR02 IR02
Alpine Wind Young Young Young Young Young
Monitor 05103-45 05103-45 05103-45 05103-45 05103-45
Barometer CS100, Druck CS100, CS100, CS100,
Setra 278 RPT410F Setra 278 Setra 278 Setra 278
monitoring of the snow cover area evolution on this area and mine pole and no-pole pixels in a predefined search window
ground-truth data for the validation of and/or filling of the that isolates the poles in the images (Pimentel et al., 2015,
snow cover area maps from satellite sources. 2017a). The accuracy of the observations from the camera
The terrestrial images are processed in a two-step method- data was estimated to be 0.075 m2 m−2 for the snow cover
ology: georeferencing and colour detection. Georeferencing fraction (SCF) and 50 mm for the height of snow (HS). The
uses a digital elevation model (DEM) to provide the im- associated error for SCF is due to the combined effects of
age with spatial coordinates by means of a standard auto- both the georeferencing process and the snow detection al-
matic computer vision algorithm (Foley, 1996; Fiume, 2014). gorithm; the former depends on the relationship between the
Secondly, for the detection of snow pixels, a clustering K- number of pixels in the images and the resolution of the local
means algorithm is applied (MacQueen, 1967) that classi- DEM, and the latter is related to the accuracy of the K-means
fies the pixels in the image into two clusters: snow-covered algorithm used. In the case of HS, the error depends on the
and snow-free pixels (Pimentel et al., 2015); finally, the snow position of the rods installed in the control area and also on
cover area in the image is calculated by aggregation of pixels the accuracy of the clustering algorithm used.
in each cluster. Additionally, the snow depth, h, was obtained
in each image using the red-painted poles installed in the
scene area and using the same clustering algorithm to deter-
Earth Syst. Sci. Data, 11, 393–407, 2019 www.earth-syst-sci-data.net/11/393/2019/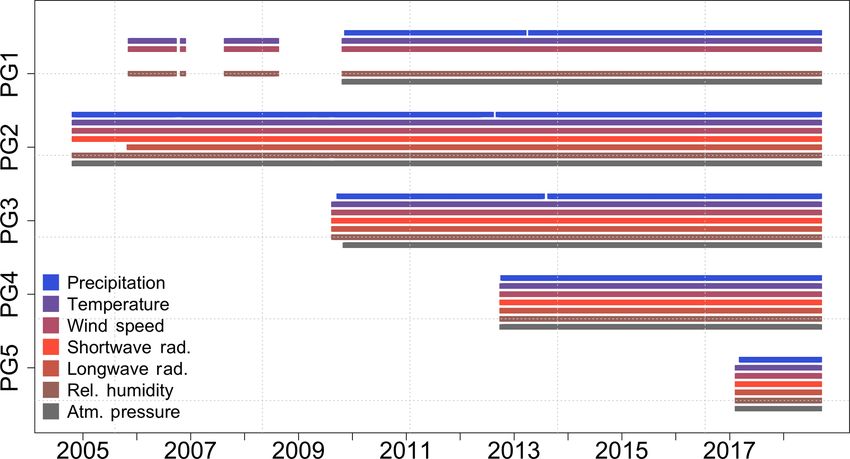
M. J. Polo et al.: The Guadalfeo Monitoring Network (Sierra Nevada, Spain) 399
Table 2. Main characteristics of the time-lapse cameras in the Guadalfeo Network: elevation (m a.s.l.), date of installation, instruments,
frequency and spatial resolution. In situ pictures of both their locations and scenes are also shown. Dates are provided as yyyy/mm/dd.
ID C1 C2 C3
Name Caballo hillside Refugio Poqueira Veleta-Carihuela
Camera Campbell CC5MPX CC640 Campbell MOBOTIX M25
Scientific
Installation 2011/11/20 2009/07/22 2011/12/09
operational operational operational
Temporal 13 images day−1 5 images day−1 13 images day−1
resolution
Spatial Hillside (∼ 2 km) Detail (∼ 30 m) Hillside (∼ 500 m)
scale
Photo 2592 pixels × 1944 pixels 640 pixels × 504 3000 pixels × 2000
resolution pixels pixels
4 Data description gradient along the same altitudinal line (Fig. 2); their respec-
tive annual temperature intervals and descriptors mainly re-
4.1 Meteorological data from the weather stations flect the altitude level within the Sierra Nevada range, and the
mean monthly descriptors show the clear seasonal pattern in
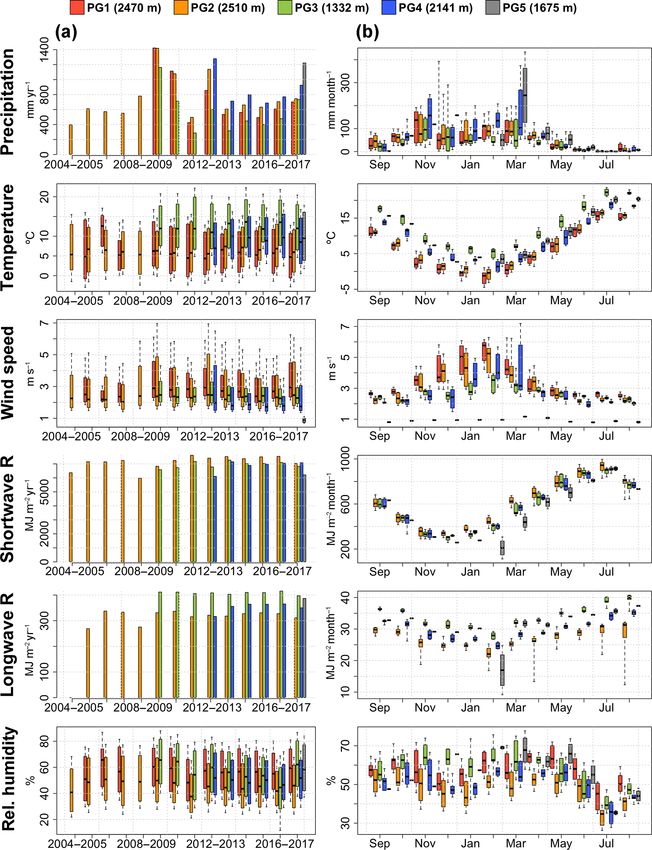
Figure 4 shows the temporal evolution of the meteorologi-
this latitude.
cal data registered in each station of the Guadalfeo Network
Regarding the precipitation regime, PG2–PG4 show the
during the period 2004–2017 on an annual basis, together
maximum altitudinal band on the southern face around
with their seasonal distribution within the year by means of
1900–2200 m a.s.l., already identified in other works (Pérez-
their monthly descriptor during the monitoring period at each
Palazón et al., 2018) and the decline of precipitation along
site. The different graphs illustrate relevant features of the
the west–east axis (PG2–PG1) associated with the major tra-
climate regime in high mountain areas in semiarid regions,
jectories of the Atlantic cyclonic fronts in this region. Au-
as expressed in the Introduction: (i) the high variability of the
tumn and late winter–early spring are the seasons during
precipitation and temperature regimes on different timescales
which most of the precipitation is concentrated, November
and the seasonality of the precipitation pattern; (ii) the larger
and March being the most variable months; very scarce pre-
temperature interval on a local basis, due to the spring and
cipitation is found from June to August at all sites.
summer periods, much warmer than other snow domains in
Wind speed can reach high values during the snow season
higher latitudes; (iii) the importance of the radiation com-
in the snow domain sites (PG1, PG2, PG4), which has a clear
ponents, with higher amounts of incoming radiation on an
impact on evaposublimation rates and snow redistribution in
annual level, especially during spring–summer periods; and
these areas (Herrero and Polo, 2016).
(iv) the influence of the proximity to the sea, with air rela-
The local incoming radiation components reflect the an-
tive humidity annual intervals rather stable during the study
nual evolution of the solar cycle, with the minimum solar
period for a given station.
activity reported during 2007–2009 and a minimum around
The distribution of the different stations in the network al-
January 2009 (NOAA, 2016), which corresponds with the
lows some spatial comparison, despite the different duration
annual incoming shortwave radiation in 2008–2009 in Fig. 4
of the time series at each site (Fig. 3). PG5 is the only sta-
(1 September 2008–31 August 2009); the incoming long-
tion on the northern face of Sierra Nevada, and it only has
wave radiation also shows this regime to be 1 order of mag-
1 year of records; PG1, PG2, and PG4 are located on the
nitude lower than the shortwave component on an annual
southern face, and PG3 is on the southern water divide of
basis. The altitudinal gradient among the different stations
the Guadalfeo River basin (outside of the snow-dominated
can also be observed from the annual values of both compo-
area in the watershed). PG2–PG4 trace a north–south gradi-
nents: the shortwave annual value increases with height on
ent in the same valley, whereas PG2–PG1 trace a west–east
www.earth-syst-sci-data.net/11/393/2019/ Earth Syst. Sci. Data, 11, 393–407, 2019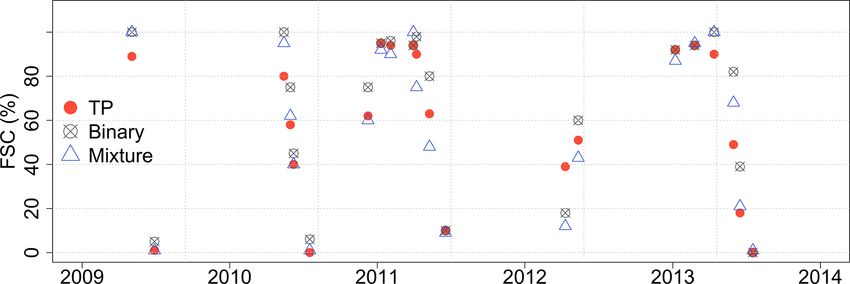
400                                                M. J. Polo et al.: The Guadalfeo Monitoring Network (Sierra Nevada, Spain)

Figure 4. Annual and monthly descriptors of the meteorological variables monitored during 2004–2017 by each weather station in the
Guadalfeo Network. Column (a) shows annual precipitation, annual mean daily temperature, annual mean daily wind speed, annual incoming
short- and longwave radiation and annual mean air relative humidity. Column (b) shows mean monthly precipitation, temperature, wind
speed, incoming short- and longwave radiation and air relative humidity. Box plots show the median values (black line), the interval range
and the 10th and 90th percentiles (whiskers) of each sample (series duration in Fig. 3).

the southern face of Sierra Nevada (PG4-PG2), and PG3 and              vals range larger than those usually found in snow domains
PG5 show the influence of their location (southern position            in higher latitudes; both the precipitation regime and vicin-
in the network and northern face of Sierra Nevada, respec-             ity to the sea influence the local values found at each site.
tively), whereas the longwave annual value reflects the differ-        The seasonal pattern also reflects the seasonal pattern of pre-
ent temperature range, as expected. The seasonal distribution          cipitation, with local maximum values and the largest vari-
follows a clear pattern during the year, with minimum val-             ability being mainly concentrated in autumn and late winter–
ues in December and February for the short- and longwave               early spring; extremely dry conditions in July can also be
components, respectively, as expected.                                 observed.
   Finally, the air humidity annual values show the influence
of the semiarid context of this mountain range, with inter-

Earth Syst. Sci. Data, 11, 393–407, 2019                                                  www.earth-syst-sci-data.net/11/393/2019/
M. J. Polo et al.: The Guadalfeo Monitoring Network (Sierra Nevada, Spain)                                                            401

Table 3. Selected statistical annual descriptors of the daily fractional snow cover (FSC) and height of snow (HS) during the snow season
(1 November–31 May) in the C2 scene at the Refugio Poqueira experimental site in the Guadalfeo Experimental Catchment (located by PG2,
2510 m a.s.l.; Fig. 2). SD refers to standard deviation.

                                                     FSC (%)                            HS (mm)
                                         mean     mode     median     SD     mean    mode     median      SD
                           2009–2010      0.54        0      0.68    0.43     220         0        82    291
                           2010–2011      0.62        1      0.99    0.45     375         0       341    367
                           2011–2012      0.23        0      0.00    0.33      42         0         0     81
                           2012–2013      0.42        0      0.35    0.42     129         0        11    191
                           2013–2014      0.28        0      0.18    0.33      33         0         0     66
                           2014–2015      0.44        0      0.41    0.42      80         0         0    110
                           2015–2016      0.19        0      0.00    0.31      30         0         0     74
                           Total          0.41        0      0.29    0.42     140         0        11    239

4.2   Snowpack variables from terrestrial imagery
Figure 5 shows selected images from C1 and C2 cameras
in the Guadalfeo Network during the period 2009–2016, to-
gether with the resulting snow maps in each scene for differ-
ent dates.
   As described in Sect. 3, C2 is implemented in the experi-
mental site in Refugio Poqueira, and the 30 m × 30 m scene
it covers corresponds to the surrounding area of the weather
station PG2 at 2510 m a.s.l. This is the longest time series of
images in the network, and its spatial resolution and scale
allows snow depth to be monitored. The 7-year time series
of both fractional snow cover (FSC) in the scene area and
snow depth on a daily basis is represented in Fig. 6 for each
year in this period, and Table 3 includes some statistical an-
nual descriptors of both variables during the snow season
(1 November–31 May).
   The results clearly show the extremely high variability of
the snow cover fraction in this site and the relevance of the
ablation processes during the snow season, with null values
for the mode of FSC and snow depth all the years, with the
exception of 2010–2011, which exhibited a deep and persis-
tent snowpack during the season (Fig. 6). The variation co-
efficient ranges between 0.73 and 1.63 around a global value
of 1 for the study period, being lower or close to 1 for the
years with longer persistence of the snowpack in the site and
higher than 1 for lower persistence conditions.
   The snow depth shows a higher variability, with variation
coefficient values ranging between 0.98 and 2.47 around a
global value of 1.71 for the study period and the same pattern
                                                                      Figure 5. Selected examples of the images, georeferenced pro-
described for FSC.
                                                                      jections and snow maps (red pixels) from the time-lapse cameras
   2009–2010 and 2010–2011 are representative years of per-
                                                                      (a) C1 (2 km2 ) and (b) C2 (30 m × 30 m) in the Guadalfeo Network
sistent snowpacks from autumn to spring, even though sev-             that illustrate the patchy pattern of the spatial distribution of the
eral phases of complete ablation took place during the snow           snow in the study site.
season. On the other hand, other years show a clear predomi-
nance of snow-free periods. This annual variability results in
highly significant differences in the annual snowmelt fraction           On the other hand, in the study period, three different years
(and volume) feeding aquifers and surface waters.                     are found with scarcity of snow: 2011–2012, 2013–2014 and
                                                                      2015–2016, with similar orders of magnitude for both FSC

www.earth-syst-sci-data.net/11/393/2019/                                                 Earth Syst. Sci. Data, 11, 393–407, 2019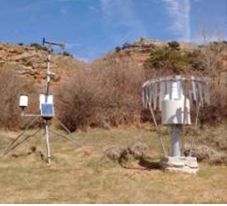
402                                               M. J. Polo et al.: The Guadalfeo Monitoring Network (Sierra Nevada, Spain)

Figure 6. Snow variables retrieved from the images of the time-lapse camera C2 in the Guadalfeo Network. Evolution of the observed daily
fractional snow cover (FSC) and height of snow (HS) from the 30 m × 30 m scene during the snow season (1 November–31 May) during
each hydrological year of the period 2009–2016.

and snow depth on an annual basis. However, significant dif-          mines the available water volume input to the water systems
ferences are found in their respective seasonal patterns of           in the basin and the fluvial recession flows (Aguilar and Polo,
snow persistence. From Fig. 6, it can be easily observed that         2016).
autumn, winter and late winter–early spring, respectively, are
the snow persistence seasons in each of these three years,
whereas the highest number of days without snow in this               4.3   Data applications for research and operational
site are concentrated in winter, spring and autumn, respec-                 capabilities
tively. This seasonal variability has an expected impact on           The presented data have been used in different research
the pattern of the ablation phases (Pimentel et al., 2017c)           works on the snow dynamics in Mediterranean regions and as
and the timing of the peak flows of snowmelt but also on              input data sources to operational applications of these results.
the partitioning of snowmelt–evaposublimation fluxes from             Figure 7 shows the importance of snowfall at each station in
the snowpack (Herrero and Polo, 2016) that finally deter-             the Guadalfeo Monitoring Network on both an annual and

Earth Syst. Sci. Data, 11, 393–407, 2019                                                www.earth-syst-sci-data.net/11/393/2019/
M. J. Polo et al.: The Guadalfeo Monitoring Network (Sierra Nevada, Spain)                                                             403

Figure 7. Precipitation and snowfall in the weather stations of the Guadalfeo Network in Sierra Nevada (Spain). Column (a) shows annual
precipitation and snowfall at each station during the 2004–2016 period. Column (b) shows mean monthly precipitation and snowfall at each
station during the study period; box plots show the mean values (black line), interval range and the 10th and 90th percentiles (whiskers) of
each sample (series duration in Fig. 3).

monthly basis (Pérez-Palazón et al., 2018). The snowfall–                  The snow season usually extends from November to April,
rainfall classification is calculated on an hourly basis by us-         with some occurrences of sometimes heavy snowfall in May–
ing a threshold temperature of 0 ◦ C at each station.                   June at the highest stations.
   The altitudinal gradient of precipitation does not directly             The monitoring of the incoming radiation components led
correlate with that associated with snowfall. PG1 and PG2               to the validation of the conclusions of the first attempt to
show the highest values of annual snowfall, with similar                model the snowpack accumulation–ablation cycles in the
monthly patterns and volumes; PG4 records higher precipita-             Refugio Poqueira experimental site (Herrero et al., 2009).
tion amounts but results in lower snowfall values, especially           This work estimated the sublimation rates from an energy
during autumn. The short recording period of PG5 prevents               balance model, but no direct observations were available at
any further analysis; as expected due to the location on the            that time. From the incoming longwave radiation measure-
northern face of Sierra Nevada, the recorded annual precipi-            ments at station PG2, an empirical expression for the atmo-
tation is higher than its southern sister stations, but its occur-      spheric emissivity was derived (Herrero and Polo, 2012), and
rence mainly during the late winter–early spring decreased              different field campaigns were done to measure and validate
the amount of snowfall during this particular year. PG3 is              the estimated snowmelt–evaposublimation fluxes on a sea-
not located in a snow domain area.                                      sonal and annual scales at this experimental site (Herrero
                                                                        and Polo, 2016). The results highlight the importance of the
                                                                        evaposublimation fraction in mountain areas in semiarid re-

www.earth-syst-sci-data.net/11/393/2019/                                                    Earth Syst. Sci. Data, 11, 393–407, 2019
404 M. J. Polo et al.: The Guadalfeo Monitoring Network (Sierra Nevada, Spain)
gions and the need for considering this component in the
water balance in these catchments to avoid overestimations
of the contribution of the snowpack to the water volumes in
aquifers and reservoirs from the observed snow cover area in
the headwater zone.
The fractional snow cover and snow depth time series from
the time-lapse camera imagery constitute key information
for studying the microscale effects on the snowpack abla-
tion dynamics and the patchy pattern evolution. These ef-
fects need to be quantified in the distributed modelling of
snow to prevent both over- and underestimations of the snow
water equivalent in the snowpack when the energy and mass
balance equations are solved over the cell area of a gridded
representation of the snow cover area. The analysis of both
the dynamics and timing during the season of the accumu-
Figure 8. Snow depletion curves on a cell basis retrieved from the
lation and ablation phases in the Refugio Poqueira experi- data from the images of the time-lapse camera C2 at Refugio Po-
mental site (S2–C2 and PG2 in Fig. 2) led to the retrieval of queira in the Guadalfeo Network. Different accumulation (Curve 0)
different depletion curves, which were associated with dif- and ablation (Curve 1–4) patterns relate the dimensionless frac-
ferent antecedent conditions during the snow season; there- tional snow cover (SCF∗ ) and snow depth (h∗ ) at the 30 m × 30 m
fore, a decision tree could be applied in the workflow of the scene during the snow season (1 November–31 May) from data dur-
model to better approximate the actual fractional snow cover ing the 2009–2013 period. Adapted from Pimentel et al. (2017b).
and snow depth on a pixel basis (Pimentel et al., 2017c).
Figure 8 shows the dimensionless version of these depletion
curves, with a single accumulation pattern but four poten-
tial patterns depending on the antecedent conditions during
the snow season. Curve 0 describes the accumulation phase,
which is initially very fast and slows down to close to 50 % of
the maximum snow cover area and reaches a maximum snow
depth threshold, beyond which the area is completely cov-
ered. Curve 1 to 4 describe the ablation phase under different
conditions: large amounts of snow from long accumulation Figure 9. Comparison between the observed fractional snow cover
phases, with a very compact state and a high level of meta- (FSC) evolution (2009–2014) in the camera C2 scene area from the
morphism (Curve 1) or from short accumulation and non- Guadalfeo Network (TP, red dots) and the estimated value from two
persistent phases (Curve 2); lower amounts of snow accu- different retrieval algorithms based on Landsat TM data: a binary
mulated during autumn–winter with longer snowmelt phases approach (snow–no snow) and a fractional approach from a spec-
(Curve 3) or spring, with quick ablation due to the warmer tral mixture algorithm (FSC in every pixel of the satellite image).
conditions (Curve 4). Adapted from Pimentel et al. (2017a).
Finally, the data set from the cameras covering the
hillslope-scale scenes (C1 and C3) constitutes valuable
ground-truth information for the remote sensing community not provide long time series to analyse trends and changes in
working on the retrieval of snow products. Figure 9 shows the the snow regime, Landsat data being the most adequate data
analysis of the performance of two different algorithms for source in terms of long series and high spatial resolution in
quantifying the snow cover area on large areas from Land- these highly heterogeneous snow pattern domains.
sat TM images (Pimentel et al., 2017a) by means of their
comparison with the snow maps of the 2 km2 scene from C1
images (Fig. 3 and Table 2). In addition to the expected con- 5 Data availability
clusion about a fractional approach being more accurate than
a binary algorithm for snow cover area estimations, it must All data presented in this work are available from different
be highlighted that the data allowed the quantification of the open-access sources. The weather stations in the Guadalfeo
over- and underestimation level through each approach for Network are maintained by the Fluvial Dynamics and Hy-
different states of the snowpack, together with the identifi- drology Research Group of the Andalusian Institute for Earth
cation of states for which both algorithms provided similar System Research (University of Cordoba), and the data sets
results or failed in achieving an adequate approximation. De- are included and updated in the CLIMA public database
spite the current availability of high spatial resolution satel- of the Andalusian regional government. The meteorolog-
lite data sources, such as the Sentinel missions, these can- ical hourly and daily data sets are provided as .txt files
Earth Syst. Sci. Data, 11, 393–407, 2019 www.earth-syst-sci-data.net/11/393/2019/M. J. Polo et al.: The Guadalfeo Monitoring Network (Sierra Nevada, Spain) 405
at https://doi.org/10.1594/PANGAEA.895236 (Polo et al., ing these data and discussing the outcomes of this research
2018). work with the snow community in INARCH (International
The fractional snow cover and snow depth data set Network for Alpine Research Catchment Hydrology) opens
at Refugio Poqueira site (camera C2) can be down- a collaborative framework for new and wider opportunities
loaded from https://doi.org/10.1594/PANGAEA.871706 (Pi- to answer relevant scientific questions and share scientific
mentel et al., 2017b); the snow cover maps for se- knowledge from different mountain regions in the world.
lected dates from 2011 (camera C1) are available Moreover, the availability of the information from open-
from https://doi.org/10.1594/PANGAEA.898374 (Polo et al., access platforms offers other application and research fields
2019). validated data sets in research branches such as remote sens-
The updated meteorological records and quasi-real-time ing of the snowpack but also ecology, water quality or fire
representation of the snow cover area in the Guadalfeo Ex- risks, among others, widening the international community
perimental Catchment can also be accessed at http://www. of potential users and multidisciplinary interactions.
uco.es/dfh/snowmed/ (last access: 30 August 2018; in Span-
ish).
Author contributions. MJP and JH designed the Guadalfeo
Monitoring Network (GMN) and coordinate it. JH is responsible
6 Final summary for installing and maintaining the GMN. RP, MJPP and JH pro-
cessed GMN data and produced the associated data sets presented
in this paper. MJP prepared the manuscript with contributions from
This work presents the Guadalfeo Monitoring Network in the
all authors. RP prepared the final figures.
Guadalfeo Experimental Catchment, Sierra Nevada (south-
ern Spain), an alpine headwater area in a semiarid region
with steep topography and sea–climate influence. The data
Competing interests. The authors declare that they have no con-
sets include both meteorological time series from the weather flict of interest.
stations in the network and fractional snow cover area and
snow depth time series retrieved from imagery from time-
lapse cameras at selected points in the network. Different Special issue statement. This article is part of the special is-
examples of research applications are also included to high- sue “Hydrometeorological data from mountain and alpine research
light the value of these research monitoring networks to ac- catchments”. It is not associated with a conference.
quire high-resolution and high-quality data sets, absolutely
essential for capturing the significant scales of the snowpack
regime in these highly heterogeneous areas. Acknowledgements. The Guadalfeo Monitoring Network
The data shown are representative of the main issues char- (GMN) is the extension of the initial weather station at Refu-
acterizing high mountain climate in semiarid catchments and gio Poqueira in 2004 within the framework of the Guadalfeo
provided the research team with the basis for further un- Project (Andalusian Regional Government), coordinated by
derstanding the major drivers of the snow accumulation– Miguel A. Losada from the Andalusian Institute for Earth System
Research at the University of Granada, whose continuous support
ablation patterns, the interaction of the microrelief or the
and inspiration made the creation of the Fluvial Dynamics and
partitioning of snowmelt and evaposublimation under differ- Hydrology research group in 2009 possible, which has been
ent predominant conditions. The significant gradients of the responsible for the GMN ever since. The authors thank both
snowpack regime found in Sierra Nevada both in the north– J. Ignacio López-Moreno and Simon Gascoin for their comments
south and west–east axes still pose questions to be answered and contributions to the final version of this paper.
in a context of increasing variability of the climatic drivers This study was supported by the following research projects
in these regions, where the associated impacts, not only on funded by the Spanish Ministry of Economy and Development
water availability during the dry season and years, but also (MINECO): Research Project CGL 2014-58508R, “Global mon-
on the operational design and exploitation of the water stor- itoring system for snow areas in Mediterranean regions: trends
age systems (reservoirs, aquifers, etc.), constitute an issue of analysis and implications for water resource management in Sierra
priority from both the scientific and technical point of view. Nevada”, and Research Project CGL 2011-25632, “Snow dynamics
in Mediterranean regions and its modelling at different scales. Im-
The Guadalfeo Network is a live structure that keeps on
plication for water management”. This study was also co-financed
expanding, funded by different research projects and spe- by the European Regional Development Fund (ERFD). The annual
cific actions of infrastructure investment and maintaining. A editions of the Research Program of the University of Cordoba also
new weather station has recently started recording data at contributed to the instrumentation renewal and maintenance.
2500 m a.s.l. on the northern face of Sierra Nevada, and the The authors want to acknowledge the International Network for
Refugio Poqueira experimental site (PG2) has been equipped Alpine Research Catchment Hydrology (INARCH) for the opportu-
with additional sensors (snow water equivalent measurement nity to share individual research experiences and data. The contin-
and a 4-component pyrgeometer) to gain deeper understand- uous support of the Natural and National Park of Sierra Nevada has
ing of snow processes in this area. The possibility of shar-
www.earth-syst-sci-data.net/11/393/2019/ Earth Syst. Sci. Data, 11, 393–407, 2019406 M. J. Polo et al.: The Guadalfeo Monitoring Network (Sierra Nevada, Spain)
also been determinant for the development of this line of research Favier, V., Falvey, M., Rabatel, A., Praderio, E., and López,
since 2002. D.: Interpreting discrepancies between discharge and pre-
cipitation in high-altitude area of Chile’s Norte Chico
region (26–32◦ S), Water Resour. Res., 45, W02424,
Review statement. This paper was edited by John Pomeroy and https://doi.org/10.1029/2008WR006802, 2009.
reviewed by Simon Gascoin and J. Ignacio López-Moreno. Fayad, A., Gascoin, S., Faour, G., López-Moreno, J. I., Drapeau,
L., Le Page, M., and Escadafal, R.: Snow hydrology in Mediter-
ranean mountain regions: A review, J. Hydrol., 551, 374–396,
2017.
References Fiume, E. L.: The Mathematical Structure of Raster Graphics, Aca-
demic Press, London, UK, 2014.
Aguilar, C. and Polo, M. J.: Generating reference evapo- Foley, J. D.: Computer Graphics: Principles and Practice, Addison-
transpiration surfaces from the Hargreaves equation at wa- Wesley Professional, Boston, MA, USA, 1996.
tershed scale, Hydrol. Earth Syst. Sci., 15, 2495–2508, Gómez-Beas, R., Moñino, A., and Polo, M. J.: Development of a
https://doi.org/10.5194/hess-15-2495-2011, 2011. management tool for reservoirs in Mediterranean environments
Aguilar, C. and Polo, M. J.: Assessing minimum envi- based on uncertainty analysis, Nat. Hazards Earth Syst. Sci., 12,
ronmental flows in nonpermanent rivers: The choice 1789–1797, https://doi.org/10.5194/nhess-12-1789-2012, 2012.
of thresholds, Environ. Modell. Softw., 79, 120–134, Gómez-Giráldez, P. J., Aguilar, C., and Polo, M. J.: Natural veg-
https://doi.org/10.1016/j.envsoft.2016.02.003, 2016. etation covers as indicators of the soil water content in a
Aguilar, C., Herrero, J., and Polo, M. J.: Topographic effects semiarid mountainous watershed, Ecol. Indic., 46, 524–535,
on solar radiation distribution in mountainous watersheds and https://doi.org/10.1016/j.ecolind.2014.06.024, 2014.
their influence on reference evapotranspiration estimates at Herrero, J. and Polo, M. J.: Parameterization of atmo-
watershed scale, Hydrol. Earth Syst. Sci., 14, 2479–2494, spheric longwave emissivity in a mountainous site for all
https://doi.org/10.5194/hess-14-2479-2010, 2010. sky conditions, Hydrol. Earth Syst. Sci., 16, 3139–3147,
Algarra, J. A., Cariñanos, P., Herrero, J., Delgado-Capel, M., https://doi.org/10.5194/hess-16-3139-2012, 2012.
Ramos-Lorente, M. M., and Díaz de la Guardia, C.: Tracking Herrero, J. and Polo, M. J.: Evaposublimation from the snow in
Montane Mediterranean grasslands: Analysis of the effects of the Mediterranean mountains of Sierra Nevada (Spain), The
snow with other related hydro-meteorological variables and land- Cryosphere, 10, 2981–2998, https://doi.org/10.5194/tc-10-2981-
use change on pollen emissions, Sci. Total Environ., 649, 889– 2016, 2016.
901, https://doi.org/10.1016/j.scitotenv.2018.08.311, 2019. Herrero, J., Polo, M. J., Moñino, A., and Losada, M. A.: An energy
Anderson, R. S., Jiménez-Moreno, G., Carrión, J. S., and balance snowmelt model in a Mediterranean site, J. Hydrol., 371,
Pérez-Martínez, C.: Postglacial history of alpine vegeta- 98–107, https://doi.org/10.1016/j.jhydrol.2009.03.021, 2009.
tion, fire, and climate from Laguna de Río Seco, Sierra Herrero, J., Polo, M. J., and Losada, M. A.: Snow evolution in Sierra
Nevada, southern Spain, Quaternary Sci. Rev., 30, 1615–1629, Nevada (Spain) from an energy balance model validated with
https://doi.org/10.1016/j.quascirev.2011.03.005, 2011. Landsat TM data, edited by: Neale, C. M. U. and Maltese, A.,
Anderton, S. P., White, S. M., and Alvera, B.: Evalua- 817403, https://doi.org/10.1117/12.898270, 2011.
tion of spatial variability in snow water equivalent for a Heywood, V. H.: The Mediterranean flora in the context of world
high mountain catchment, Hydrol. Process., 18, 435–453, diversity, Ecología Mediterránea, 21, 11–18, 1995.
https://doi.org/10.1002/hyp.1319, 2004. Liston, G. E. and Hiemstra, C. A.: The Changing Cryosphere: Pan-
Andrew, J. and Sauquet, E.: Climate Change Impacts and Water Arctic Snow Trends (1979–2009), J. Climate, 24, 5691–5712,
Management Adaptation in Two Mediterranean-Climate Water- https://doi.org/10.1175/JCLI-D-11-00081.1, 2011.
sheds: Learning from the Durance and Sacramento Rivers, Water, López-Moreno, J. I., Goyette, S., and Beniston, M.: Impact of cli-
9, 126, https://doi.org/10.3390/w9020126, 2017. mate change on snowpack in the Pyrenees: Horizontal spatial
Barnett, T. P., Adam, J. C., and Lettenmaier, D. P.: Po- variability and vertical gradients, J. Hydrol., 374, 384–396, 2009.
tential impacts of a warming climate on water avail- López-Moreno, J. I., Gascoin, S., Herrero, J., Sproles, E. A.,
ability in snow-dominated regions, Nature, 438, 303–309, Pons, M., Alonso-González, E., Hanich, L., Boudhar, A., Mus-
https://doi.org/10.1038/nature04141, 2005. selman, K. N., Molotch, N. P., Sickman, J., and Pomeroy, J.:
Blanca, G.: Flora amenazada y endémica de Sierra Nevada, Conse- Different sensitivities of snowpacks to warming in Mediter-
jería de Medio Ambiente, Junta de Andalucía, Granada, Spain, ranean climate mountain areas, Environ. Res. Lett., 12, 074006,
2002. https://doi.org/10.1088/1748-9326/aa70cb, 2017.
Egüen, M., Aguilar, C., Solari, S., and Losada, M. MacQueen, J. B.: Some methods for classification and analysis
A.: Non-stationary rainfall and natural flows model- of multivariate observations, Proceeding, Fifth Symposium on
ing at the watershed scale, J. Hydrol., 538, 767–782, Math, Statistics, and Probability, 21 June–18 July 1965, Berke-
https://doi.org/10.1016/j.jhydrol.2016.04.061, 2016. ley, CA, USA, 281–297, 1967.
Ergon, Å., Seddaiu, G., Korhonen, P., Virkajärvi, P., Belloc- Mankin, J. S. and Diffenbaugh, N. S.: Influence of temperature
chi, G., Jørgensen, M., Østrem, L., Reheul, D., and Volaire, and precipitation variability on near-term snow trends, Clim. Dy-
F.: How can forage production in Nordic and Mediter- nam., 45, 1099–1116, https://doi.org/10.1007/s00382-014-2357-
ranean Europe adapt to the challenges and opportunities 4, 2015.
arising from climate change?, Eur. J. Agron., 92, 97–106,
https://doi.org/10.1016/j.eja.2017.09.016, 2018.
Earth Syst. Sci. Data, 11, 393–407, 2019 www.earth-syst-sci-data.net/11/393/2019/M. J. Polo et al.: The Guadalfeo Monitoring Network (Sierra Nevada, Spain) 407 Marchane, A., Jarlan, L., Hanich, L., Boudhar, A., Gascoin, S., Tav- Pimentel, R., Herrero, J., and Polo, M. J.: Quantifying Snow ernier, A., Filali, N., le Page, M., Hagolle, O., and Berjamy, B.: Cover Distribution in Semiarid Regions Combining Satel- Assessment of daily MODIS snow cover products to monitor lite and Terrestrial Imagery, Remote Sensing, 9, 995, snow cover dynamics over the Moroccan Atlas mountain range, https://doi.org/10.3390/rs9100995, 2017a. Remote Sens. Environ., 160, 72–86, 2015. Pimentel, R., Herrero, J., and Polo, M. J.: Snow Cover Marty, C., Schlögl, S., Bavay, M., and Lehning, M.: How much Fraction (SCF) and snow depth obtained using ter- can we save? Impact of different emission scenarios on fu- restrial photography (2009–2013) in the control area ture snow cover in the Alps, The Cryosphere, 11, 517–529, Refugio Poqueira (Sierra Nevada, Spain), PANGAEA, https://doi.org/10.5194/tc-11-517-2017, 2017. https://doi.org/10.1594/PANGAEA.871706, 2017b. Mernild, S. H., Liston, G. E., Hiemstra, C. A., Malmros, J. K., Yde, Pimentel, R., Herrero, J., and Polo, M. J.: Subgrid parameteri- J. C., and McPhee, J.: The Andes Cordillera. Part I: snow distri- zation of snow distribution at a Mediterranean site using ter- bution, properties, and trends (1979–2014), Int. J. Climatol., 37, restrial photography, Hydrol. Earth Syst. Sci., 21, 805–820, 1680–1698, https://doi.org/10.1002/joc.4804, 2017. https://doi.org/10.5194/hess-21-805-2017, 2017c. Mhawej, M., Faour, G., Fayad, A., and Shaban, A.: Towards an en- Polo, M. J., Herrero, J., Pimentel, R., and Pérez- hanced method to map snow cover areas and derive snow-water Palazón, M. J.: Meteorology data of Guadalfeo Mon- equivalent in Lebanon, J. Hydrol., 513, 274–282, 2014. itoring Network (Sierra Nevada, Spain), PANGAEA, Millares, A., Polo, M. J., and Losada, M. A.: The hydrological re- https://doi.org/10.1594/PANGAEA.895236, 2018. sponse of baseflow in fractured mountain areas, Hydrol. Earth Polo, M. J., Herrero, J., Pimentel, R., and Pérez-Palazón, Syst. Sci., 13, 1261–1271, https://doi.org/10.5194/hess-13-1261- M. J.: Snow cover maps (C1) of Guadalfeo Moni- 2009, 2009. toring Network (Sierra Nevada, Spain), PANGAEA, Millares, A., Polo, M. J., Moñino, A., Herrero, J., and Losada, https://doi.org/10.1594/PANGAEA.898374, 2019. M. A.: Bedload dynamics and associated snowmelt influence Rizzi, J., Nilsen, I. B., Stagge, J. H., Gisnås, K., and Tallaksen, L. in mountainous and semiarid alluvial rivers, Geomorphology, M.: Five decades of warming: impacts on snow cover in Norway, 206, 330–342, https://doi.org/10.1016/j.geomorph.2013.09.038, Hydrol. Res., 49, 670–688, https://doi.org/10.2166/nh.2017.051, 2014. 2018. Molotch, N. and Meromy, L.: Physiographic and climatic controls Senatore, A., Mendicino, G., Smiatek, G., and Kunstmann, H.: Re- on snow cover persistence in the Sierra Nevada Mountains, Hy- gional climate change projections and hydrological impact anal- drol. Process, 28, 4573–4586, 2014. ysis for a Mediterranean basin in Southern Italy, J. Hydrol., 399, Musselman, K. N, Clark, M., Liu, C., Ikeda, K., and Rasmussen, 70–92, 2011. R.: Slower snowmelt in a warmer world, Nat. Clim. Change, 7, Valdés-Pineda, R., Pizarro, R., García-Chevesich, P., Valdés, J. 214–119, https://doi.org/10.1038/nclimate3225, 2017. B., Olivares, C., Vera, M., Balocchi, F., Pérez, F., Vallejos, C., NOAA: http://www.swpc.noaa.gov/, last access: 8 September 2016. Fuentes, R., Abarza, A., and Helwig, B.: Water governance in Pérez-Palazón, M. J., Pimentel, R., Herrero, J., Aguilar, C., Perales, Chile: Availability, management and climate change, J. Hydrol., J. M., and Polo, M. J.: Extreme values of snow-related vari- 519, 2538–2567, https://doi.org/10.1016/j.jhydrol.2014.04.016, ables in Mediterranean regions: trends and long-term fore- 2014. casting in Sierra Nevada (Spain), Proc. IAHS, 369, 157–162, Verbyla, D., Hegel, T., Nolin, A., van de Kerk, M., Kurkowski, T., https://doi.org/10.5194/piahs-369-157-2015, 2015. Prugh, L., Verbyla, D., Hegel, T., Nolin, A. W., van de Kerk, M., Pérez-Palazón, M. J., Pimentel, R., and Polo, M. J.: Climate Trends Kurkowski, T. A., and Prugh, L. R.: Remote Sensing of 2000– Impact on the Snowfall Regime in Mediterranean Mountain Ar- 2016 Alpine Spring Snowline Elevation in Dall Sheep Mountain eas: Future Scenario Assessment in Sierra Nevada (Spain), Wa- Ranges of Alaska and Western Canada, Remote Sensing, 9, 1157, ter, 10, 720, https://doi.org/10.3390/w10060720, 2018. https://doi.org/10.3390/rs9111157, 2017. Pimentel, R., Herrero, J., Zeng, Y., Su, Z., and Polo, M. J.: Study of Snow Dynamics at Subgrid Scale in Semi- arid Environments Combining Terrestrial Photography and Data Assimilation Techniques, J. Hydrometeorol., 16, 563–578, https://doi.org/10.1175/JHM-D-14-0046.1, 2015. www.earth-syst-sci-data.net/11/393/2019/ Earth Syst. Sci. Data, 11, 393–407, 2019
You can also read