Seismic monitoring of urban activity in Barcelona during the COVID-19 lockdown - Solid Earth
←
→
Page content transcription
If your browser does not render page correctly, please read the page content below
Solid Earth, 12, 725–739, 2021
https://doi.org/10.5194/se-12-725-2021
© Author(s) 2021. This work is distributed under
the Creative Commons Attribution 4.0 License.

Seismic monitoring of urban activity in Barcelona
during the COVID-19 lockdown
Jordi Diaz1 , Mario Ruiz1 , and José-Antonio Jara2
1 Geo3Bcn-CSIC,       c/ Solé Sabarís sn, Barcelona, Spain
2 Institut   Cartogràfic i Geològic de Catalunya, Barcelona, Spain

Correspondence: Jordi Diaz (jdiaz@geo3bcn.csic.es)

Received: 6 November 2020 – Discussion started: 27 November 2020
Revised: 3 February 2021 – Accepted: 17 February 2021 – Published: 26 March 2021

Abstract. During the COVID-19 pandemic lockdown, the                 spacing of 2–3 km. The objective of the project was to ac-
city of Barcelona was covered by a dense seismic network             quire data of scientific interest to investigate the feasibility
consisting of up to 19 seismic sensors. This network has pro-        of ambient-noise studies based on tomographic and interfer-
vided an excellent tool to investigate in detail the background      ometric methods in urban environments but also to promote
seismic-noise variations associated with the lockdown mea-           the knowledge about seismology and Earth sciences among
sures. Permanent stations facilitate comparing the seismic           high school students. The network was deployed in Septem-
noise recorded during the lockdown quieting with long-term           ber 2019, and 50 % of the sites were instrumented using the
variations due to holiday periods. On the other hand, the data       low-cost Raspberry Shake devices, which provide online ac-
acquired by the dense network show the differences between           cess to the data in real time, thus facilitating the involvement
sites located near industrial areas, transportation hubs or res-     of the students. An unexpected result of this deployment has
idential areas. The results confirm that the quieting of human       been the possibility of studying in detail the seismic-noise
activity during lockdown has resulted in a reduction in seis-        variations within the city of Barcelona during the quieting
mic vibrations in the 2–20 Hz band that is clearly higher than       associated with the COVID-19 lockdown.
during holiday seasons. This effect is observed throughout              As background seismic vibrations (often referred to as
the city, but only those stations not affected by very proxi-        “seismic noise”) at frequencies above 1 Hz are mainly domi-
mal sources of vibration (construction sites, industries) are        nated by human activities (i.e., Díaz et al., 2017), lockdown
clearly correlated with the level of activity denoted by other       measurements applied to mitigate the COVID-19 pandemic,
indicators. Our contribution demonstrates that seismic am-           including the suppression of industrial and commercial activ-
plitude variations can be used as a proxy for human activity         ities and movement restrictions, have had a clear effect on the
in urban environments, providing details similar to those of-        seismic-noise levels. This has been reported on a global scale
fered by other mobility indicators.                                  by Lecocq et al. (2020a), showing how the progressive imple-
                                                                     mentation of restrictions in different parts of the world could
                                                                     be monitored using publicly accessible seismic data. Several
                                                                     regional studies have documented these noise variations in
1   Introduction                                                     China (Xiao et al., 2020), India (Somala, 2020), Brazil (Dias
                                                                     et al., 2020), northern Italy (Poli et al., 2020) or Sicily (Can-
Connecting students with seismology is a challenge in coun-          nata et al., 2021). On a local scale, Lindsey et al. (2020) have
tries not affected by strong earthquakes. In order to mitigate       used a ∼ 5 km long fiber-optic cable in Palo Alto (California,
this problem, the SANIMS research project included the de-           USA) to acquire distributed acoustic sensing (DAS) data and
ployment of a seismic network within the city of Barcelona,          analyze the seismic-noise variations during the COVID-19
with most of the instruments installed in the facilities of sec-     pandemic. However, as far as we know, there are no stud-
ondary schools (Diaz et al., 2020). The network included             ies available that explore variations in seismic noise within
up to 19 seismic sensors, distributed with an inter-station

Published by Copernicus Publications on behalf of the European Geosciences Union.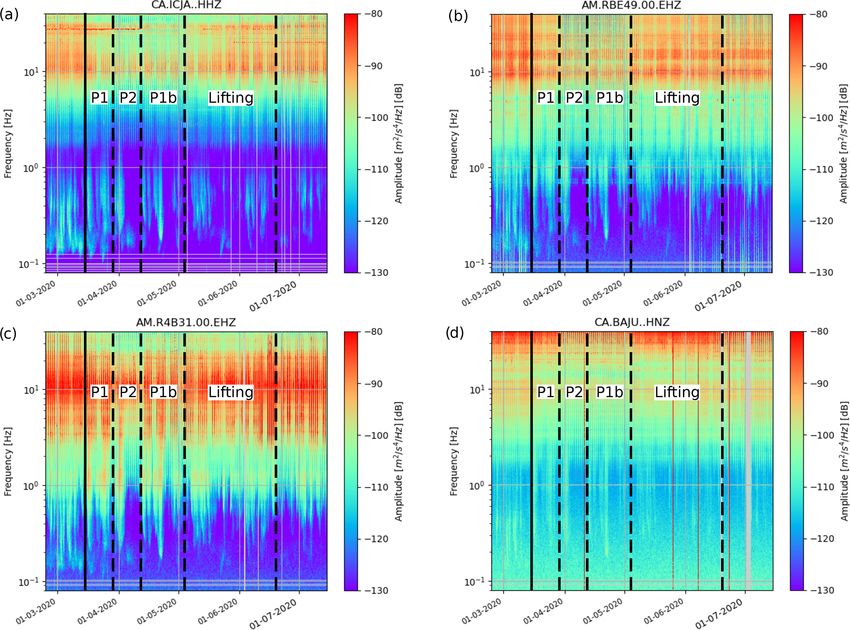
726                                                          J. Diaz et al.: Seismic monitoring of urban activity in Barcelona

a large city during the COVID-19 lockdown period with a            with large dynamic range sensors and data loggers and ac-
space between sites on the order of 2–3 km. This contribu-         quire data at 200 sps.
tion focuses on analyzing such variations, which can be im-           The SANIMS temporary array, active from Septem-
portant depending on the specific location of each site. In        ber 2019 to September 2020, consisted of six three-
addition, the availability of long-term data in the permanent      component short-period sensors (GeoSpace 2 Hz) with ded-
stations makes it possible to put the noise reduction due to       icated data loggers and eight one-component Raspberry
the COVID-19 lockdown in Barcelona into context.                   Shake seismometers equipped with 4.5 Hz sensors (Anthony
   Following the increasing number of COVID-19 cases               et al., 2018). These instruments, designed primarily for “am-
during February and early March 2020, measures to miti-            ateur seismologist” users, have proved to be useful for re-
gate the pandemic effects started in Barcelona on Thursday,        search projects interested in acquiring quality data and ad-
13 March, with the cancellation of all face-to-face classes        dressing outreach objectives (Plaen et al., 2020; Subedi et
in schools and universities. The next day, the prime min-          al., 2020). All the data acquired by the SANIMS array were
ister declared the state of alarm, and announced the first         transmitted in near-real time using wired ethernet connec-
lockdown measures (phase 1), effective from 00:00 on Sun-          tions and processed in the Geo3Bcn data center. The data
day, 15 March. Citizens were ordered to stay indoors, ex-          acquired by the 3D seismometers can be accessed using
cept for basic activities such as commuting to workplaces,         the YS code (Diaz and Schimmel, 2019), while the data
buying food and medicine, or dealing with emergency situa-         from the Raspberry Shake instruments are distributed using
tions. Stores, retail stores, cafes and restaurants were closed,   the AM network code (Raspberry Shake et al., 2016). The
and remote work was recommended in all possible cases.             investigated zone covers an area of approximately 10 km2
Two weeks later, as of Sunday, 29 March, the lockdown re-          within the city of Barcelona, although a couple of sites are
strictions were reinforced with a generalized closure of ser-      located outside the municipality. The geometry of the net-
vices, industry and construction activity. These strict mea-       work has been chosen to sample the main geological units
sures, hereinafter referred to as “phase 2”, were applied for      of the Barcelona area, with sites installed in the Holocene
2 weeks and, in practice, resulted in an almost total quar-        terranes near the sea, above the Pleistocene sediments of the
antine. On 12 April, during the Easter holidays, these re-         Barcelona plain and in the hills where Paleozoic rocks out-
strictions were lifted, reverting to the initial lockdown terms    crops (Fig. 1). This temporary array acquires data at 100 sps,
for 3 more weeks (phase 1b). On 4 May, the plan to ease            except for one of the Raspberry Shake instruments (R59E2),
the lockdown began. The so-called “de-escalation” included         which uses a rate of 50 sps.
four phases, each of which had a minimum duration of 2                As a first processing stage, the instrumental response is
weeks. Citizens were allowed to go out for short walks, then       removed following standard procedures and the data are dis-
shops and restaurants were reopened under restrictive mea-         played as seismic acceleration, expressed in nm s−2 . Next,
sures, and commercial and industrial activities gradually re-      the frequency content of the seismic data is analyzed us-
sumed. However, face-to-face courses in schools and univer-        ing the power spectra density (PSD), which provides a good
sities were suspended for the remainder of the 2019–2020           quantification of the energy levels recorded at the differ-
academic year. Finally, the state of alarm expired at midnight     ent frequency bands. PSD is calculated using a Obspy im-
on Sunday, 21 June, and the country began the so-called “new       plementation (Krischer et al., 2015) of the classical PQLX
normal”, which includes measures such as the obligation to         (IRIS- PASSCAL Quick Look eXtended) software (Mcna-
wear a mask in public areas or restrictions on the number of       mara et al., 2009). Data processing is based on the pub-
people allowed in shops and restaurants.                           licly available SeismoRMS software package (Lecocq et al.,
                                                                   2020b). The data are divided into 30 min windows with 50 %
                                                                   of overlap and the PSD of each window is computed using
                                                                   the Welch method. Following Lecocq et al. (2020a), the de-
2   Data and processing                                            fault PQLX parameters have been modified slightly to im-
                                                                   prove the frequency resolution and increase the spectra dy-
Barcelona city center is instrumented by a permanent net-          namic. The corresponding spectrograms show the power of
work made up of three accelerometers managed by the Insti-         the seismic acceleration, expressed in decibels (dB) refer-
tut Cartogràfic i Geològic de Catalunya and one broadband          enced to 1 m2 s−4 Hz−1 . To make the comparison with the
station managed by the Geo3Bnc-CSIC institute, all of them         spectrograms easier, the seismic-noise variations are dis-
integrated into the CA network (Institut Cartogràfic i Ge-         cussed in terms of power, without converting the data to ac-
ològic de Catalunya, 1984). An additional accelerometer, is        celeration, velocity or displacement.
operational at the Fabra Observatory, located in the hills sur-
rounding the city. The broadband instrument is a Nanomet-
rics Trillium T120P sensor, with a flat response extended to
periods of 120 s and using an acquisition rate of 250 samples
per second (sps). The accelerometric stations are equipped

Solid Earth, 12, 725–739, 2021                                                         https://doi.org/10.5194/se-12-725-2021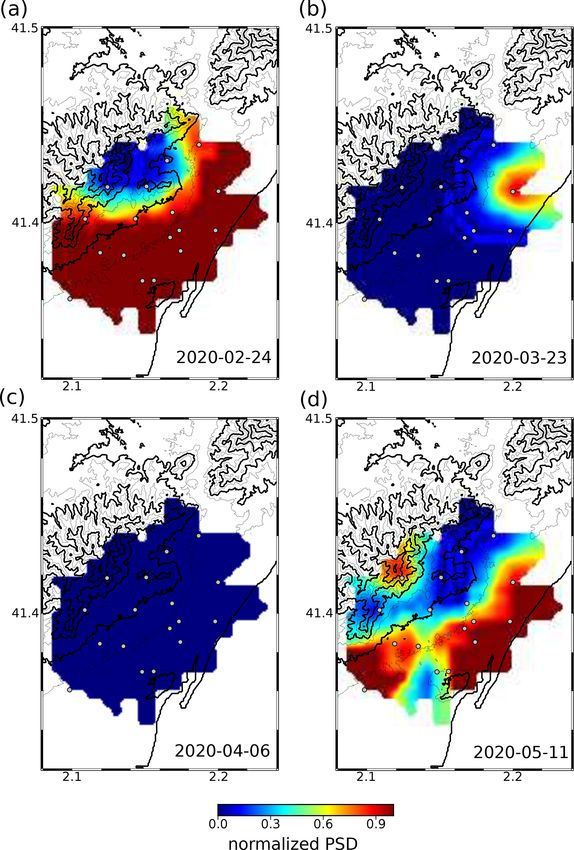
J. Diaz et al.: Seismic monitoring of urban activity in Barcelona 727
Figure 1. Location plan of the available seismic stations on the geotechnical map of Barcelona. The color code for the different types of
instruments used is shown at the top-left corner. Road map from © OpenStreetMap contributors 2020, distributed under a Creative Commons
BY-SA License.
3 Results tions also show a significant reduction in the 35–45 Hz band,
this is not a general feature. Therefore, we have focused our
3.1 Identification of the frequency band of interest analysis on the seismic signals within 2–20 Hz band, calcu-
lating the averaged noise power within this band.
To analyze the effects of the COVID-19 quieting on seismic
data, we must first identify the frequency range where this ef- 3.2 Diurnal and weekly noise power variation patterns
fect is best identified by inspecting the spectrograms at each during normal activity
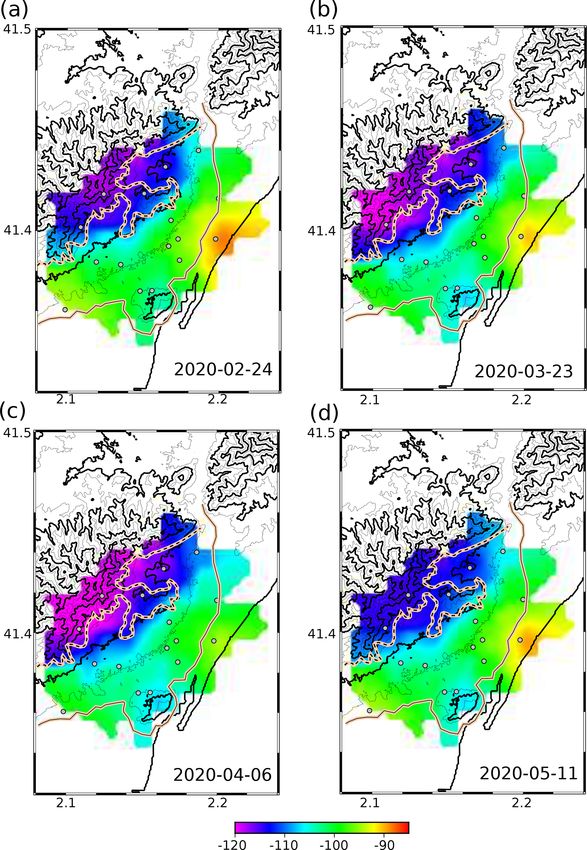
station. Figure 2 shows the spectrograms of four representa-
tive sites for the time period beginning 3 weeks before clo- Before we get into the discussion on the lockdown effects,
sure and ending 3 weeks after the end of the state of alarm we will review the general trends in noise variation during
(24 February–12 July 2020). Supplement Fig. S1 shows the periods of normal activity. Figure 3 shows the time variation
spectrograms for the 19 stations available. in the power spectra between 2 and 20 Hz for the 2-week in-
Spectrograms show that human-related activity dominates terval just before the lockdown. The selected sites correspond
above 2.0 Hz for most stations, confirming the previous re- to the ICJA broadband station, located near one of the main
sults presented by Diaz et al. (2017). Below 1 Hz, in the fre- road accesses to the city: an accelerometer installed in the
quency range commonly known as the microseismic peak, historical city center (BAJU) and two short-period stations
the spectrograms show a large similarity between all the sta- installed in secondary schools (R888C and R4B31), one of
tions, as the origin of the signal is related to the interaction of them in an area with industrial activity.
oceanic waves (i.e., Díaz, 2016). The energy reduction dur- The first observation is the clear difference between the
ing the lockdown period can be identified at all the stations noise power between day and night. This variation, observed
for frequencies up to 20–25 Hz. Although some of the sta- systematically, has an average value close to 15 dB, although
https://doi.org/10.5194/se-12-725-2021 Solid Earth, 12, 725–739, 2021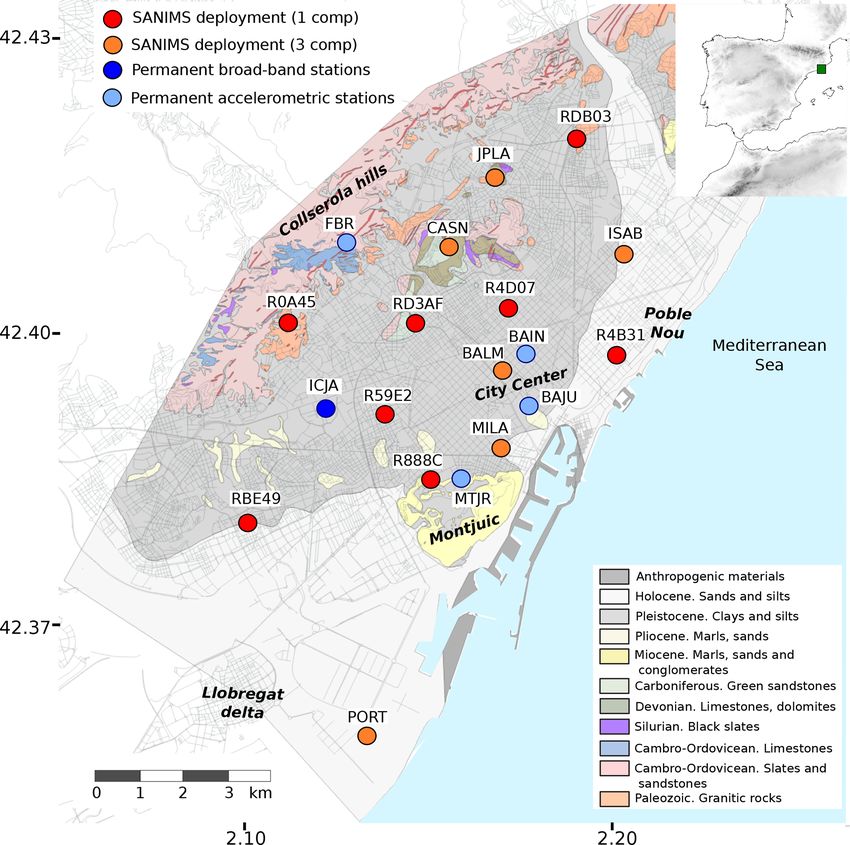
728                                                          J. Diaz et al.: Seismic monitoring of urban activity in Barcelona

Figure 2. Spectrograms for period from 24 February to 14 July 2020 corresponding to the ICJA, RBE49, R4B31 and BAJU sites. The solid
lines mark the beginning of the lockdown period and the dashed lines show the different lockdown phases in Barcelona (P1: phase 1; P2:
phase 2; P1b: phase 1b). Data are expressed as dB relative to 1 m2 s−4 Hz−1 .

some of the stations in high schools show variations greater         only during the morning, following the students’ schedule.
than 20 dB, which denotes the great influence of students’           A remarkable example of citizen activities monitored by the
activities. High energy levels are mostly observed between           variations in seismic noise can be identified at station ICJA
07:00 and 19:00 LT, although in some places, particularly            (Fig. 3a); the two peaks observed during the afternoon of
those located near the main entrances of the city, the time in-      7 March 2020 correspond to people arriving and leaving the
terval with the highest energy begins earlier. The time inter-       Football Club Barcelona stadium for a Spanish league foot-
val with minimum energy is shorter, generally lasting around         ball match, played at 18:00 between FCB and Real Sociedad.
5 h, between midnight and 05:00. Typically, the maximum
power during Saturdays and Sundays is around 5 dB lower              3.3   Generic trends in power spectral variations during
than during working days. Most sites show an additional re-                the COVID-19 lockdown
duction on Sundays around 2–3 dB. Minimum levels are gen-
erally observed during Sunday through Monday nights, while           As discussed in Sect. 3.1, the effect of the quieting dur-
power during Friday and Saturday nights is often higher than         ing COVID-19 is best detected in the 2–20 Hz band. This
during weekday nights, reflecting more nighttime activity in         effect is most marked during the more common working
the city during the weekends.                                        hours range, which can be assumed to be 09:00–19:00 in
   The graphs for each station display a wealth of details           Barcelona. Therefore, we have used this frequency band and
that reveal the activities near each site. Most sites show a         time range to calculate the daily mean values of the power
fairly steep increase in noise in the morning, while the de-         spectral density. Figure 4 shows the results for all the avail-
cline in the afternoon is more gradual, showing that many of         able stations. The first 3 weeks, corresponding to the pre-
the city’s activities begin around 08:00, while their end times      lockdown period, are included for reference. As expected,
are less uniform (schools, offices and stores usually close be-      weekends are marked by an energy minimum. The most
tween 16:00 and 21:00). For some of the stations in high             prominent observations are as follows: (i) for most of the sta-
schools (i.e., Fig. 3b) the maximum amplitudes are reached           tions, each lockdown phase has a well-differentiated mean

Solid Earth, 12, 725–739, 2021                                                            https://doi.org/10.5194/se-12-725-2021
J. Diaz et al.: Seismic monitoring of urban activity in Barcelona                                                                       729

Figure 3. Trends in power acceleration variation in the 2–20 Hz band prior to lockdown at the ICJA (broadband), R888C, R4B31 (short-
period stations installed in high schools) and BAJU (accelerometer located downtown). Data are expressed as dB relative to 1 m2 s−4 Hz−1 .
Red line marks the beginning of the lockdown period. Green shading indicates weekdays.

Table 1. Site description and differences in power amplitude observed between the different lockdown phases for all investigated seismic sta-
tions. Pre/lock1: power amplitude difference between normal period and lockdown phase 1. Pre/lock2: power amplitude difference between
normal period and lockdown phase 2. Pre/new norm: power amplitude difference between normal period and “new normality” period. See
text for the details.

           Network     Station    Pre/lock1    Pre/lock2      Pre/new     Site description
           code        code            (dB)         (dB)    norm (dB)
           CA          ICJA                5            6            2    Geo3Bcn, University area.
           CA          MTJR                4            5            1    ICGC site, Montjuic Park
           CA          BAJU                4            5            2    Administration building, center of town
           CA          BAIN                3            4            1    Administration building, center of town
           CA          FBR                 3            3            0    Fabra Observatory, Collserola Hills
           YS          BALM                5            6            3    Inst. Balmes high school, center of town
           YS          JPLA               12           13           10    Inst. J. Pla high school (Horta)
           YS          ISAB                2            4            1    Inst. Infanta Isabel high school (Sant Martí)
           YS          CASN                –            –            –    Particular home, residential area
           YS          MILA                3            4            2    Inst. Mila i Fontanals high school (Raval)
           YS          PORT                2            4            0    Barcelona Port
           AM          RDB03               8            9            5    Sagrada Familia school (Sant Andreu)
           AM          RD3AF               3            4            2    Inst. Montserrat high school (Sant Gervasi)
           AM          RBE49               5            6            2    Tecla Sala school (Hospitalet Llobregat)
           AM          R888C               6            6            3    Inst. XXV Olimpiada high school, near Montjuic Park
           AM          R59E2               4            4            2    Maristes Les Corts high school (Sants)
           AM          R4D07               5            6            2    Inst. La Sedeta high school (Eixample)
           AM          R4B31               3            6            0    Voramar school (Poble Nou)
           AM          R0A45              17           18            5    Inst. Costa i Llobera high school (Collserola)

https://doi.org/10.5194/se-12-725-2021                                                                  Solid Earth, 12, 725–739, 2021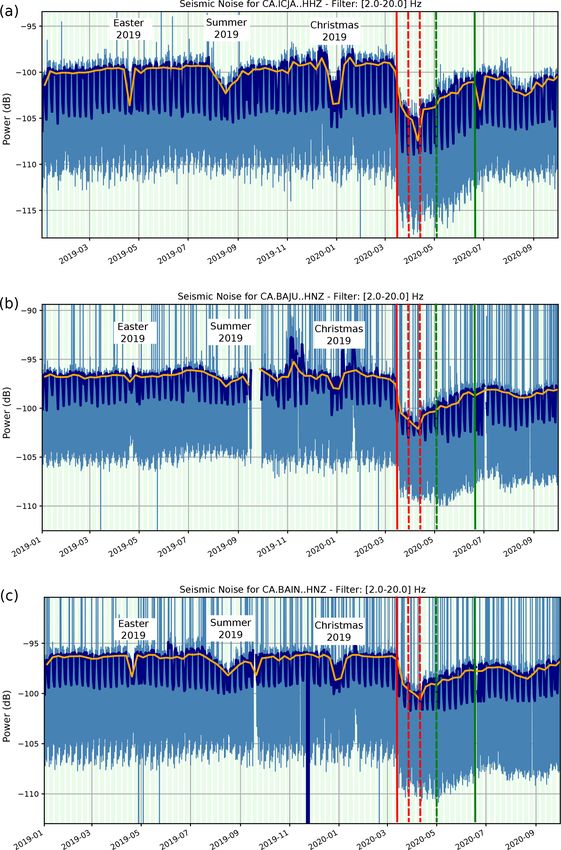
730 J. Diaz et al.: Seismic monitoring of urban activity in Barcelona
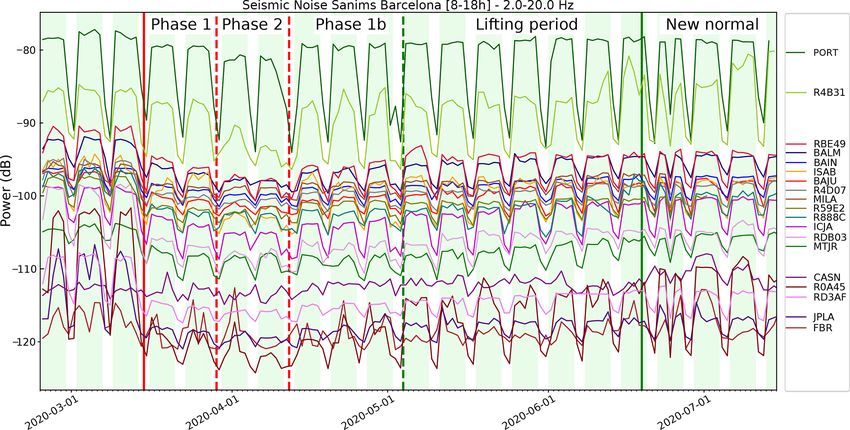
amplitude value; (ii) there are large variations in amplitude 3.4 Site-dependent characteristics of power variations
between sites; (iii) the details of the amplitude changes differ during the COVID-19 lockdown
significantly between groups of stations.
Most of the stations have maximum values around The relatively large number of sites within Barcelona makes
−90/−95 dB. However, a couple of stations (PORT, R4B31) it possible to analyze in detail the variations in power and
are much louder, with reference values between −80 and to study the influence of very local noise sources, which can
−90 dB. On the other hand, some of the sites within the city eventually distort the interpretation of the results. Figure 7
(JPLA, RD3AF, CASN) have low values around −105/ − shows the power amplitude in the 2–20 Hz band measured
110 dB. The minimum values are observed for FBR, a sta- every 15 min (light blue line) and the daily mean value dur-
tion located in the Collserola Hills that surround Barcelona, ing business hours (dark blue line) for some selected sites.
outside the city and relatively far from roads and train tracks, Supplement Fig. S3 presents the same information for all the
and R0A45, installed in a high school within the city but near sites. In these figures, the light blue lines show the power
the Collserola Hills. amplitude evaluated every 15 min and the dark blue ones
To obtain a global picture of the noise power variations show the daily average value during business hours (09:00–
in the city, we have calculated an average power amplitude 19:00 LT). The orange lines show the mean value of the busi-
profile for the entire network. The profiles obtained for each ness hour amplitudes for an interval of 1 week, smoothing
station (Fig. 4) have been normalized to the 0–1 range and out the weekend lows and facilitating the discussion of the
the results averaged to obtain a mean profile (Fig. 5) that can long-term variations.
be regarded as a summary of the results discussed in this con- During working hours, the drop in noise power following
tribution. the onset of the quieting measures has a mean value of 4 dB
Despite the large differences in values between the sites, for phase 1 of lockdown (Table 1). The reduction is more
these normalized profiles show that the temporal evolution prominent for those sites located in schools (BALM, JPLA,
of the background vibration in the 2–20 Hz band is consistent ISAB, MILA, RDB03, RD3AF, RBE49, R888C, R59E2,
for most of the sites. During phase 1, the mean power level R4B31, R0A45), reaching in some cases values of up to
gradually decreases to reach a minimum during the 2-week 17 dB. This large reduction reveals the impact of very close
period of maximum restrictions (phase 2) and then increases sources of vibration (in this case, the movement of students in
smoothly until mid-July, without reaching pre-lockdown val- school) on the seismic data. During the stricter phase 2 lock-
ues. The reduction is also clearly shown during the weekends down period, one additional dB of reduction is observed for
(minimum values in Fig. 5) and in the difference between most of the sites, although in a couple of cases the decrease
weekdays and weekends, which is minimal during the sec- is greater. The reduction also affects periods with low levels,
ond week of phase 2. such as the weekends (lows in the dark blue lines) or night
To take advantage of the large number of stations avail- periods (lows in the light blue lines). During lockdown, the
able, we have represented the same information as daily difference in energy levels between weekdays and weekends
maps. The normalized values are located on a city map, grid- is also drastically reduced. While in the days before lock-
ded using a nearest-neighbor algorithm and presented as Sup- down this difference is around 5 dB, at the peak of the quiet-
plement Fig. S2. Figure 6 summarizes the information show- ing it remains between 2 and 3 dB. As discussed above, most
ing the images of four Mondays, each corresponding to one of the stations share a fairly similar pattern of variation, but
of the lockdown phases. Although the maps may include some of them have clearly different results. Figure 7 displays
some spurious effects due to the interpolation procedure, they the variation in power for several sites showing the general
provide visual information on the variation in the seismic variation trend (Fig. 7a–d) and for most of the sites where
power, denoting clearly differentiated pre-lockdown, lock- particular characteristics have been identified (Fig. 7e–h).
down phases 1 and 2, and lifting periods. In pre-lockdown The ICJA station (Fig. 7a) is installed in the basement of
times, most of the stations have their highest absolute values, the Geo3Bcn institute, located within a university campus
thus appearing in the maps with normalized values close to 1 and near one of the main roads into the city. Díaz et al. (2017)
(Fig. 6a). During lockdown phases 1 and 1b most of the sites have documented a close relationship between seismic noise
remain below average, except for a couple that are affected around 10 Hz and the traffic entering and exiting from the
by local sources of noise that will be discussed in the next city. The changes in seismic power are smooth, with a pro-
section (Fig. 6b). During the weeks with stricter lockdown gressive decrease during the first 2 weeks and a clear mini-
measures (Fig. 6c) all stations have the lowest power and the mum during the phase 2 lockdown. During phase 1b, the in-
normalized values are close to zero. During the lifting period crease is constant and continues during the period of lifting.
(Fig. 6d) the sites progressively increase in amplitude. Note Station RBE49 (Fig. 7b) is located in the Tecla Sala school,
that weekends and holidays (13 April, 1 May, 1 and 24 June) in the center of Hospitalet de Llobregat, an independent city
are identified in the daily snapshots by their low power levels forming a continuous urban environment with Barcelona. As
(Fig. S2). with all stations located in schools, student activity is a ma-
jor source of vibrations around 10 Hz. This is evidenced here
Solid Earth, 12, 725–739, 2021 https://doi.org/10.5194/se-12-725-2021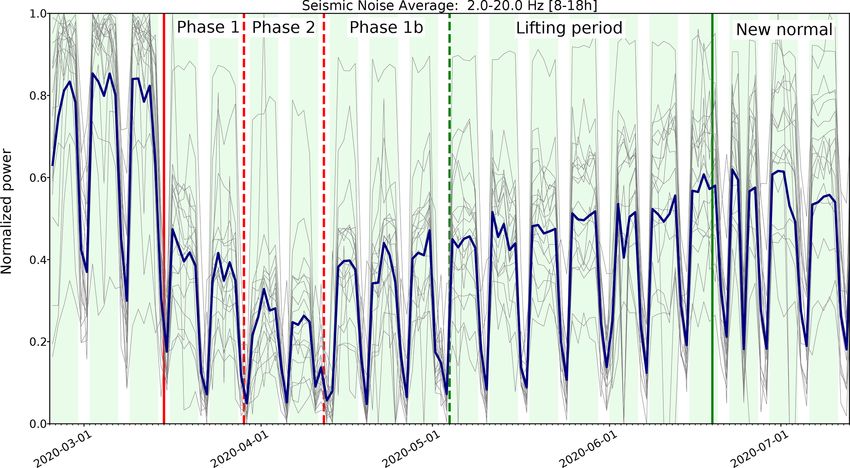
J. Diaz et al.: Seismic monitoring of urban activity in Barcelona                                                                        731

Figure 4. Variation in the power of the seismic acceleration in the 2–20 Hz band for all the investigated sites, expressed in dB. The colored
lines show the daily average during business hours. The vertical bars show the start dates of the phase 1 lockdown period (solid red bar), the
period with stricter measures (phase 2, dashed red lines) and the beginning of the lifting period (dashed green line) and the so-called “new
normal” (solid green line). Light green shadings show weekdays.

Figure 5. Normalized power in the 2–20 Hz band during working hours for all the stations (gray lines) and the corresponding mean profile
(blue line). Bars as in Fig. 4.

by the lower noise observed on Friday, 13 March, just be-                to monuments such as Casa Batlló and Casa Milà. The seis-
fore the start of the lockdown, when schools were already                mic results here show a greater difference between lockdown
closed. The pattern is similar to that of ICJA, although a par-          phases 1 and 2, suggesting that the effect of strict closure was
ticular increase can be observed during the first week after             more effective in the city center. The last example of sites
the start of the release measures. Face-to-face classes did not          that register quite similar noise variations is BAJU (Fig. 7d),
restart in Barcelona until September 2020, but the increase              an accelerometer located in an administrative building in the
probably reflects the activity of the school to prepare online           historical center of the city, near shopping centers and tourist
courses and materials. The BALM seismometer (Fig. 7c) is                 attractions. The results are consistent with previously men-
also installed in a high school, located in this case in the cen-        tioned examples, although some specificities can be high-
ter of Barcelona, in the Eixample neighborhood and close                 lighted. For example, the noise level is not stable during the

https://doi.org/10.5194/se-12-725-2021                                                                   Solid Earth, 12, 725–739, 2021
732 J. Diaz et al.: Seismic monitoring of urban activity in Barcelona
industrial factory, Industries Waldes is located right in
front of the school. This factory, still in full activity, is
specialized in the production of buttons, snaps, metal fittings
and other metal accessories and uses heavy machinery
(https://waldes.es/en/company/, last access: 19 March 2021).
Following the government’s guidelines, industry only closed
during phase 2 of the lockdown, explaining the reduction
in seismic noise during this period. Noise levels are also
abnormally high in mid-June and mid-July, during a period
with almost normal levels of urban activity. This seems to
be related to the activity at a large construction site located
about 150 m from the sensor. Station PORT, located next to
one on the main container terminal in the port of Barcelona
and approximately 1 km away from one of the largest
water treatment plants in Europe (https://www.amb.cat/
en/web/ecologia/aigua/instalacions-i-equipaments/detall/
-/equipament/edar-del-prat-de-llobregat/276285/11818,
last access: 19 March 2021), seems also to be dominated
by nearby sources of noise related to industrial activities,
resulting is a noise reduction limited to the 2 weeks of
total closure of activity (Fig. S3). The results for these sites
show that vibration sources located near the seismic sensor
can dominate the signal and disturb the interpretation of
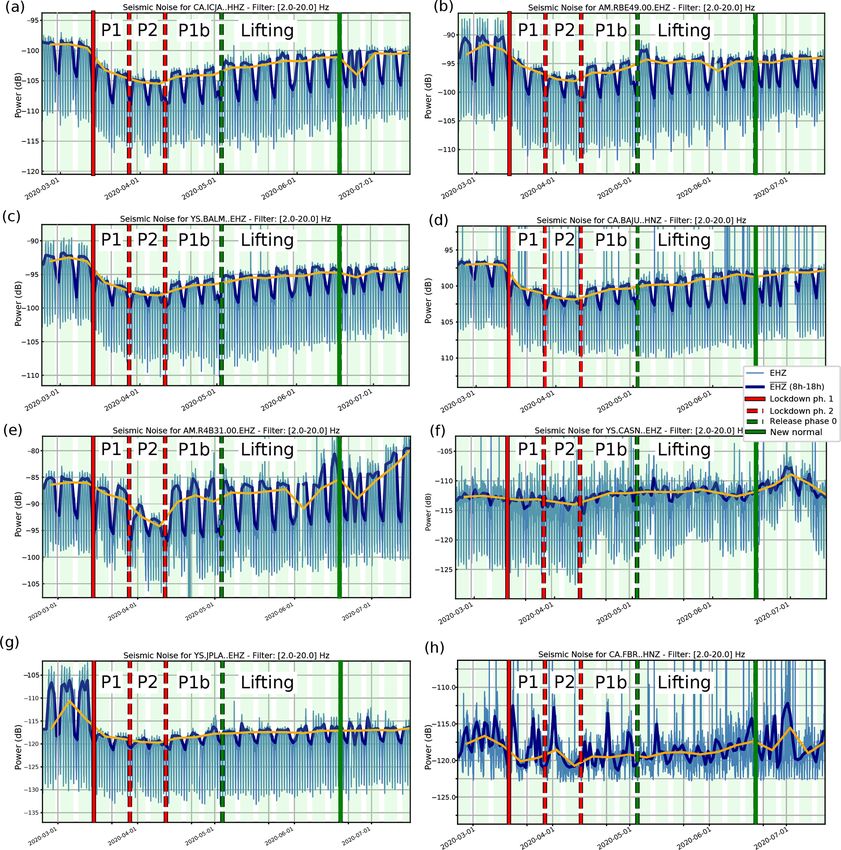
the data in terms of general human activity. Station CASN
(Fig. 7f) was installed in the basement of a private house
located in the Paleozoic hills near Park Güell, relatively far
from large avenues and industrial areas. In this case, the
seismic noise does not reproduce the lockdown quieting
clearly, although the weekly mean value (orange line) shows
a small decrease during phases 1 and 2 and a slight but
Figure 6. Daily maps representing the normalized power in the 2– constant increase thereafter. The sharp change observed at
20 Hz band during working hours. Each image corresponds to a most sites is not observed here. We think that the increase
Monday (Fig. S2 shows all the daily snapshots). (a) Pre-lockdown in the vibrations generated by the family members, usually
period. (b) Lockdown phase 1. (c) Lockdown phase 2. (d) Lifting working or studying at other places but staying at home
period. Topographic contours are included for reference (thick lines: since the beginning of the lockdown, compensates for the
100 m interval; thin lines: 50 m interval). general decrease in seismic noise, thus masking the change
related to the start of lockdown. It can be noted that similar
observations are been reported in social media by users of
2 weeks of the phase 2 period, with the second one clearly the Raspberry Shake citizen seismic network. Figure 7g
being quieter. Also note that the difference between week- shows the results of the Inst. Josep Pla high school, located
days and weekends and between day and night appears to be in the Horta neighborhood. Here, contrary to the situation
smaller than for the previous cases. described for R4B31, the influence of students on seismic
If we focus on stations having abnormal results, we can noise is enormous, as reflected in the very sharp decrease as
first comment on the results of station R4B31, located in the of Friday, 13 March. The noise level during business hours
Voramar school in the Poble Nou neighborhood, in an area decreases by more than 12 dB and remains 10 dB below the
of old wetlands and swamps close to the beach (Fig. 7e). usual values until the end of the investigated time period.
The noise reduction during the lockdown phase 1 is modest, This is interpreted as being due to the quiet environment
despite the fact that students were staying at home. The only around the site, away from large avenues and industry axes
time period with a large noise reduction is during lockdown and next to a medium-sized urban park. Finally, the data
phase 2 and, in particular, during the second week of this acquired at the FBR station (Fig. 7h), located in the hills
phase. Also note that during phase 1b and during the period outside the city, shows that, although a decrease in the
when the measures were lifted the power reaches values weekly averages can be observed following the beginning of
that are very similar to those of the pre-lockdown period, lockdown, the variations in power follow a clearly different
contrary to what is observed in most sites. To understand pattern than for most of the sites. The spectrogram for this
these results, we visited the area and noticed that a historical station (Fig. S1) shows that the seismic-noise variation in the
Solid Earth, 12, 725–739, 2021 https://doi.org/10.5194/se-12-725-2021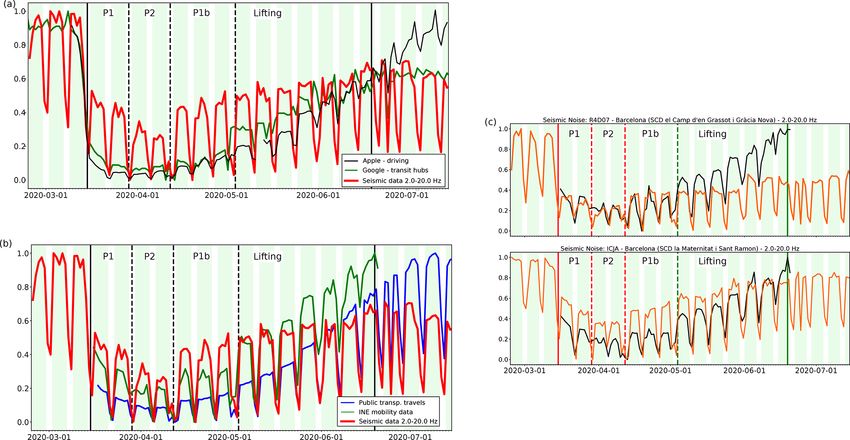
J. Diaz et al.: Seismic monitoring of urban activity in Barcelona                                                                             733

Figure 7. Variations in the PSD of the seismic acceleration in the 2–20 Hz band for representative stations. (a–d) Sites that follow the general
trend. (e–h) Sites with particular characteristics (see text). Light blue line: data every 15 min. Dark blue line: daily mean value during business
hours (09:00–19:00). Orange line: weekly mean average during working hours.

2–20 Hz band is very similar to that observed for frequencies                  To better discuss the differences between the different sta-
below 1 Hz, a range for which wind and oceanic waves                        tions, we have mapped the absolute power values in the 2–
are widely acknowledged to be that the dominant sources                     20 Hz range, following the same approach discussed pre-
of noise (i.e., Díaz, 2016). Therefore, we conclude that                    viously for the normalized data. Figure S4 show all the
for this station, with low levels of human activity nearby,                 snapshots, while Fig. 8 shows the images corresponding to
the lower-frequency seismic sources extend to the 2–20 Hz                   four Mondays at different lockdown phases. During the pre-
band.                                                                       lockdown period (Fig. 8a) there is a rough correlation be-
                                                                            tween the seismic noise and the geologic zonation, with

https://doi.org/10.5194/se-12-725-2021                                                                       Solid Earth, 12, 725–739, 2021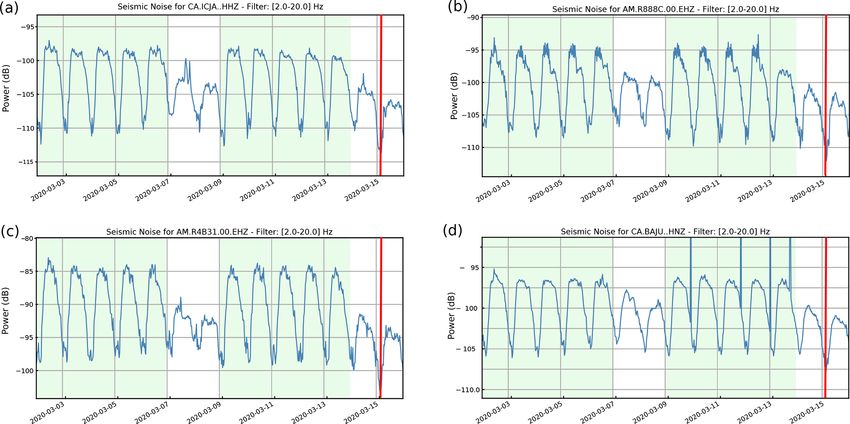
734                                                           J. Diaz et al.: Seismic monitoring of urban activity in Barcelona

lower noise for stations located in Precambrian hills and
higher levels in the sites located in the recent Quaternary sed-
iments. This correlation between geology and seismic ampli-
fication is a well-known feature that has been documented
at the scale of the Iberian Peninsula, where high seismic
noise is observed over sedimentary basins and minimum val-
ues are found over hard-rock regions (Custódio et al., 2014;
Díaz et al., 2010). However, in an urban environment such as
Barcelona, this relationship has to be treated with caution, as
the Quaternary areas include most of the city center, the area
most affected by human activity. After the beginning of the
restrictive measures (Fig. 8b), the noise distribution changes
slightly, with the area with low noise levels extending to-
wards the city center. The reddish spot near the coast cor-
responds to station R4B31, affected by an industrial factory
located nearby and located over the most recent Holocene
sediments. During the stricter lockdown interval (Fig. 8c) the
activity at this factory was suppressed, and this is reflected in
the seismic-noise maps, which can be more directly related
to geology. Figure 8b and c show that during the lockdown
phase, the Miocene areas around Montjuic have lower am-
plification than the zone covered by Quaternary sediments, a
feature not observed in normal times. During the lifting pe-
riod (Fig. 8d) the vibrations affecting R4B31 reappear and
noise levels progressively recover, although without reach-
ing the pre-lockdown levels. The area with lowest noise pro-
gressively reduces, although it remains larger than in pre-
lockdown times. The snapshots in Fig. S4 also show the am-
plitude decrease during weekends and holidays.
   Therefore, during lockdown phase 2, with minimal hu-
                                                                    Figure 8. Daily maps representing the real power values in the 2–
man activity, the geographical variations in seismic energy         20 Hz band during working hours. Each image corresponds to a
are mostly due to the amplification factor related to the sub-      Monday (Fig. S4 shows all the daily snapshots). (a) Pre-lockdown
soil geology, and the maps are highly consistent with the mi-       period. (b) Lockdown phase 1. (c) Lockdown phase 2. (d) Lifting
crozonation map proposed by Cid et al. (2001) and with the          period. The dashed line marks the limit of the Paleozoic materi-
results based on the analysis of fundamental resonance fre-         als in the hills that surround Barcelona. The solid line marks the
quency using the horizontal to vertical spectral ratio (HVSR)       boundary between the areas covered by Holocene and Pleistocene
by Cadet et al. (2011). This direct relationship is less clear      materials (see Fig. 1).
during normal human activity periods, as industries and traf-
fic close to each station strongly disturb the seismic power.
                                                                    2019, the average weekly noise decreases for all the sites, but
3.5   Long-term noise power variations                              this is particularly visible at the ICJA station, where the de-
                                                                    crease reaches 4 dB. The 2019 summer holidays are clearly
To put the decrease in seismic noise into perspective, we           identified in the seismic data by a decrease throughout the
have calculated the power variation since January 2019 for          month of August, the traditional period of holidays in Spain.
three permanent seismic stations located within Barcelona:          This quieting is a little less marked than during the Easter
the ICJA broadband station and the BAIN and BAJU ac-                holidays but it lasts for a period of 4 weeks. During both hol-
celerometers (Fig. 9). As for Fig. 7, light blue lines show         iday periods, BAJU shows a less prominent decrease than
data every 15 min, dark blue lines represent the average dur-       the other stations. This site is located in a tourist area of
ing working hours and orange lines show the weekly average          the city center, and we can hypothesize that the increase in
during working hours. In this case, the data in the figure ex-      tourist activity during the holidays can offset the decrease in
tend until the 30 September 2020. The spikes often observed         the activity of local citizens. The 2019 Christmas period is
for the BAIN and BAJU sites are related to data transmission        also well reflected in the seismic data, with a decline lasting
problems and are not relevant for the discussion.                   about 2 weeks and reaching similar values as those during the
   All three sites show a similar pattern, although small dif-      Easter holidays. A significant increase is observed at BAJU
ferences can be identified. During the Easter holidays of           at the beginning of November 2019. This increase, only ob-

Solid Earth, 12, 725–739, 2021                                                           https://doi.org/10.5194/se-12-725-2021
J. Diaz et al.: Seismic monitoring of urban activity in Barcelona 735 Figure 9. Long-term (1 January 2019–30 September 2020) PSD of the seismic accelerations in the 2–20 Hz band. (a) ICJA broadband seismometer. (b) BAJU accelerometer. (c) BAIN accelerometer. Color code as in Fig. 7. served for this site, remains unexplained due to a lack of local 2 weeks with stricter closure, the maximum noise levels dur- site information. ing business hours are clearly below the levels observed dur- As clearly shown in the data presented in Fig. 9, the ef- ing the holidays and weekends. As mentioned early, during fects of the COVID-19 lockdown have a much greater im- the release period, the power increases smoothly but does not pact in the seismic power of the 2–20 Hz band than the usual reach the pre-lockdown levels. During 2020, the Easter hol- holiday seasons. During lockdown phase 1 the decrease is idays were coincident with the lockdown period and could only slightly greater than during the holidays, but during the not be clearly identified in the data. By contrast, even in the https://doi.org/10.5194/se-12-725-2021 Solid Earth, 12, 725–739, 2021
736                                                          J. Diaz et al.: Seismic monitoring of urban activity in Barcelona

context of limited citizen activity, the August holidays have      phone activity but comes directly from transportation opera-
a clear impact in the seismic-noise levels.                        tors. The absolute number of daily validations ranges from a
                                                                   low of 72 797 on 12 April, during the second week of phase 2
                                                                   lockdown to 1 893 739 on 9 July. As in previous cases, the
4   Seismic data and mobility patterns                             use of public transportation begins to increase during phase
                                                                   1b, but in this case the data show a very constant rate, both
From the data analyzed in the previous sections, it is clear       on weekdays and on weekends, until mid-July. Finally, we
that seismic power in the 2–20 Hz band can be used as a            have inspected the data provided by the Spanish Institute of
proxy to monitor the level of anthropogenic activity in an         Statistics (INE, https://www.ine.es/covid/tabla.htm, last ac-
urban environment. Verifying mobility patterns during lock-        cess: 19 March 2021) on the mobility at the scale of the small
down periods is an important tool to analyze the efficacy of       zones, chosen to include around 20 000 inhabitants each (in
the different lockdown strategies adopted by civil authorities.    the case of Barcelona, the this means more than 70 zones).
The exceptionality of this period has led several large com-       The data are based on the information provided by the three
panies such as Google, Apple or Facebook to agree to make          main mobile phone operators in Spain on the location of mo-
their mobility data public for a limited period. Similarly, the    bile phone devices and show the percentage of the population
main mobile phone operators have shared data related to the        moving from their home during each day as referenced to the
mobility of the devices under their control with government        value between the 18 and 21 November 2019 (Monday to
agencies. Other mobility indicators can be the number of           Thursday). Only the data corresponding to the lockdown pe-
ticket validations in public transportation systems and the es-    riod have been opened. We have calculated the mean values
timations of vehicle movements in the city, obtained from          of these data for all the mobility areas of Barcelona and rep-
vehicle counters installed in representative locations. In order   resented them as a green line in Fig. 10b, normalized to the
to evaluate the real usefulness of seismic data to be used as a    0–1 range.
monitoring tool, we have compared our results with some of             As expected, the overall correlation between the different
these indicators.                                                  indicators is good, all of them highlighting the decrease in
   Some of the indicators provided by large communication          activity during the lockdown period. However, some signifi-
companies as Google or Apple are shown in Fig. 10a together        cant differences can be observed between them. The seismic
with the averaged seismic data. The indicators are normal-         data clearly show the decrease in activity during phase 1 and
ized to the 0–1 range to make a visual comparison possi-           phase 2, with the minimum level observed during the second
ble. The black line shows the data provided by Apple (https:       week of phase 2. During phase 1b, the average seismic am-
//covid19.apple.com/mobility, last access: 19 March 2021)          plitude quickly recovers the levels of phase 1, a fact that is
regarding the relative number of address requests on Ap-           also observed in the INE mobility data and in the number of
ple Maps from people driving vehicles around the Barcelona         public transportation validations (Fig. 10b) but not so clearly
area, compared to 13 January 2020 (Monday). Apple data             in the data from Apple and Google. The main differences be-
show a sharp decline during the first week of phase 1 and          tween the different indicators appear during the end of the re-
remain fairly stable until the beginning of phase 1b. Dur-         lease phase and the beginning of the new normal period. Pub-
ing phase 1b and the lifting period, the indicator increases at    lic transportation validations increase at a fairly constant rate
an increasing rate. In mid-July, the indicator returned to pre-    from the end of March to mid-July, while Google’s public
lockdown levels. The green line in Fig. 10a shows the change       transportation estimations show a marked increase at the be-
in activity in places related to public transportation such as     ginning of phase 1b and stabilize from the end of June. When
metro, bus and train stations, as provided by Google for the       comparing the INE mobility estimations and Apple’s esti-
Barcelona area (https://www.google.com/covid19/mobility/,          mate for driving activity, significant differences can be iden-
last access: 19 March 2021). These data refer to the me-           tified, for example, in the relative amplitude during weekdays
dian value for the same day of the week during January             and weekends. Apple’s data for July have a maximum value
2020 and hence do not show the weekday–weekend varia-              on Friday that does not appear in other indicators, such as
tion. During lockdown phases 1, 2 and 1b, the pattern is sim-      the volume of traffic in and around the city. Therefore, each
ilar to Apple’s data. However, during the first weeks of the       indicator has its own peculiarities and none of them can be
lifting period, the increase is more marked. In contrast, dur-     regarded as a ground-truth reference.
ing the new normal period, the indicator remains fairly con-           The most relevant difference between the seismic data and
stant. Turning now to the datasets made available through          other indicators is the fact that seismic power has remained
public institutions, we have first analyzed the data provided      almost stable since the end of May and has not recovered
by the Barcelona transportation authority (https://www.atm.        its pre-lockdown level, while the other indicators continue to
cat/web/ca/covid19.php, last access: 19 March 2021) regard-        increase during June and July until they recover their levels.
ing the number of validations of trips in public transportation    This fact can be understood by assuming that seismic noise
systems within the city, including bus, metro and tramway          arises from two main sources: traffic and movement in the
(blue line in Fig. 10b). This dataset is not based on mobile       vicinity of the sensor, normally due to the activity of peo-

Solid Earth, 12, 725–739, 2021                                                          https://doi.org/10.5194/se-12-725-2021
J. Diaz et al.: Seismic monitoring of urban activity in Barcelona 737
Figure 10. Mobility data from different sources compared to seismic data. (a) Normalized mean seismic power during business hours (09:00–
19:00) vs. mobility data from Apple and Google. (b) Normalized mean seismic power during business hours vs. the number of validations of
public transportation and the INE mobility data averaged for the Barcelona area. (c) Normalized power (orange line) during business hours
for stations R4D07 (upper panel) and ICJA (lower panel) and INE mobility data for the corresponding mobility zones (black lines).
ple in the building, such as students in high school or work- 5 Conclusions
ers in the office. This hypothesis is confirmed by compar-
ing the seismic-noise level at each site with the INE data
for each mobility zone. Figure 10c shows two clearly dif- As a summary, we can conclude that seismic data in the 2–
ferent cases. Station R4D07, located in a secondary school 20 Hz band are a good proxy of the local anthropogenic ac-
near Sagrada Familia, shows a good match between mobility tivity. The effects of the lockdown measures taken after the
and seismic data during phases 1, 2 and 1b, but afterwards outbreak of the COVID-19 pandemic are clearly seen at most
mobility continues to increase while seismicity remains sta- sites, as previously documented at a worldwide scale (i.e.,
ble. On the other hand, in the ICJA station the seismic and Lecocq et al., 2020a). The variations in seismic power over
mobility indicators have a more similar evolution, although time make it possible to distinguish between the different
the difference between weekdays and weekends is greater for phases of lockdown, at least in a similar way to other mo-
the seismic data during the lockdown period. This site is lo- bility indicators. Comparing this with previous data acquired
cated near one of the main access roads into Barcelona, a fact by the permanent seismic stations in Barcelona, we can con-
that may explain the greater relative contribution of traffic. clude that the quieting during lockdown is clearly higher than
From these observations, we conclude that background seis- the noise lowering observed during holiday periods. Having
mic vibrations in the 2–20 Hz band are related to the traffic a dense seismic network deployed over the city has provided
volume only up to a certain threshold, above which further the opportunity to analyze in detail the effects of the lock-
increases in traffic do not affect the seismic data. The second down measures on the 19 available sites, showing that the
main source of vibrations in this band is related to human ac- mean results accurately reproduce the human activity pattern
tivity near the seismometer. The daily variations in seismic but also that significantly different results are obtained for
amplitude in this frequency band does not correlate with the some sites, where nearby and specific noise sources domi-
subway schedule during the pandemic, which confirms pre- nate the recorded signal. Seismic noise between 2 and 20 Hz
vious contributions where it was stated that the subway trans- is mostly sensitive to traffic, industrial and construction ac-
portation system produces vibrations at frequencies ranging tivities at distances of a few hundred meters and can hence
mostly between 20 and 40 Hz (Díaz et al., 2017; Green et al., be regarded as a proxy to monitor these human activities. Our
2017; Hinzen, 2014). results suggest that above a certain threshold, the increase in
traffic is no longer reflected in the seismic data. This thresh-
https://doi.org/10.5194/se-12-725-2021 Solid Earth, 12, 725–739, 2021738 J. Diaz et al.: Seismic monitoring of urban activity in Barcelona
old value is probably related to the distance between the seis- Author contributions. JD, MR and JAJ worked on the data acquisi-
mometer and the source area and to the attenuation proper- tion, processing and analysis. JD wrote the paper and prepared the
ties of the subsoil. Compared to other mobility indicators, figures, with contributions from all co-authors.
seismic data have some important advantages; the data are
open and their availability does not depend on the decisions
of private companies; traffic and industrial activities are ag- Competing interests. The authors declare that they have no conflict
gregated; the installation and maintenance of the sensors is of interest.
easy; and there are well-established protocols to share the
data in near-real time. This opens the door to the systematic
Special issue statement. This article is part of the special issue “So-
use of seismic sensors as tools to monitor human activity in
cial seismology – the effect of COVID-19 lockdown measures on
urban areas. This monitoring can be crucial in times of crisis seismology”. It is not associated with a conference.
that involve changes in the usual mobility patterns, but it can
also be of practical use in regular times.
We also want to highlight the value of operating an urban Acknowledgements. We acknowledge the Geo3Bcn-CSIC
seismic network for the dissemination of Earth sciences, in LabSis Laboratory (http://labsis.geo3bcn.csic.es, last access:
particular if some of the stations are installed in secondary 19 March 2021) for making their seismic station available for
schools. Having these instruments available in the classroom this experiment. We want to thank the secondary school teachers
is a great opportunity to develop students’ interest not only involved in this research project for their collaboration and help:
in seismology or Earth sciences, but also, more generally, Xavier Valbuena (Escola Tecla Sala), Antoni Cirera (Inst. Costa
to promote the use of scientific methodologies. Collabora- Llobera), Nuria Prat, Olaia Iglesias (Inst. Balmes), Xavier Pie,
tion with educational centers has led to three high school re- Fina Brull (Inst. Infanta Isabel d’Aragó), Miguel Manzano (Inst.
search projects based on the analysis of seismic data, despite Montserrat), Gemma Briones (Escola Voramar), Oscar Arribas
(Inst. Milà i Fontanals), Robert Barriche (Escola Sagrada Familia,
the scarce presence of Earth sciences in Spanish curricula.
Sant Andreu), Angel Domingo (Maristes Sants-Les Corts), Elisa
Seismic records in urban environments also provide an op- Rodriguez (Inst. Josep Pla), Angel Mota, Omar Marín (Inst. La
portunity to access the media and have a significant impact Sedeta) and Carles Sanchiz (Inst. XXV Olimpiada). We also want
on social networks; the COVID-19 lockdown has been an to thank Dani Ruiz, Jordi Vila and Joaquim Cortés, from the Dep.
extraordinary opportunity in this regard, but even at regular de Medi Ambient of the Port de Barcelona for facilitating the in-
times, the detection of sporting or musical events, extreme stallation of one of the sites. Finally, we thank the National Institute
weather phenomena, controlled explosions, disturbances in of Statistics (INE) and the Autoritat del Transport Metropolità de
the public transportation system, etc., can be of interest to a l’àrea de Barcelona (ATM) for sharing detailed mobility data.
public unfamiliar with Earth sciences.
Financial support. This research has been supported by the
Code availability. This work has benefited from open-source ini- Ministerio de Ciencia, Innovación y Universidades (grant no.
tiatives such as Obspy (Krischer et al., 2015) and GMT (Wessel et RTI2018-095594-B-I00), and the Generalitat de Catalunya (grant
al., 2013). Data analysis has been done using the publicly available no. 2017SGR1022).
SeismoRMS code kindly distributed by Thomas Lecocq (Lecocq et
al., 2020b). We acknowledge support of the publication fee by the CSIC
Open Access Publication Support Initiative through its Unit of
Information Resources for Research (URICI).
Data availability. The seismic data acquired by the CA network
can be found in the Institut Cartográfic i Geológic de Catalunya
repository (Institut Cartogràfic i Geològic de Catalunya, 1984). Review statement. This paper was edited by Koen Van Noten and
Seismic data for the AM network can be found in the Raspberry reviewed by Andrea Cannata and Koen Van Noten.
Shake repository (Raspberry Shake et al., 2016). Data from the
YS stations will be available from the ORFEUS Data Center are
available on request from the corresponding author and will be dis-
tributed publicly at the end of the embargo period. References
Anthony, R. E., Ringler, A. T., Wilson, D. C., and Wolin, E.: Do
Supplement. The supplement related to this article is available on- Low-Cost Seismographs Perform Well Enough for Your Net-
line at: https://doi.org/10.5194/se-12-725-2021-supplement. work? An Overview of Laboratory Tests and Field Observations
of the OSOP Raspberry Shake 4D, Seis. Res. Lett., 90, 219–228,
https://doi.org/10.1785/0220180251, 2019.
Cadet, H., Macau, A., Benjumea, B., Bellmunt, F., and Figueras,
S.: From ambient noise recordings to site effect assessment: The
case study of Barcelona microzonation, Soil Dyn. Earthq. Eng.,
Solid Earth, 12, 725–739, 2021 https://doi.org/10.5194/se-12-725-2021J. Diaz et al.: Seismic monitoring of urban activity in Barcelona 739 31, 271–281, https://doi.org/10.1016/j.soildyn.2010.07.005, F. C., Diaz, J., Donner, S., Evangelidis, C. P., Evers, L., Fauville, 2011. B., Fernandez, G. A., Giannopoulos, D., Gibbons, S. J., Girona, Cannata, A., Cannavò, F., Di Grazia, G., Aliotta, M., Cassisi, C., De T., Grecu, B., Grunberg, M., Hetényi, G., Horleston, A., Inza, Plaen, R. S. M., Gresta, S., Lecocq, T., Montalto, P., and Sciotto, A., Irving, J. C. E., Jamalreyhani, M., Kafka, A., Koymans, M. M.: Seismic evidence of the COVID-19 lockdown measures: a R., Labedz, C. R., Larose, E., Lindsey, N. J., McKinnon, M., case study from eastern Sicily (Italy), Solid Earth, 12, 299–317, Megies, T., Miller, M. S., Minarik, W., Moresi, L., Márquez- https://doi.org/10.5194/se-12-299-2021, 2021. Ramírez, V. H., Möllhoff, M., Nesbitt, I. M., Niyogi, S., Ojeda, Cid, J., Susagna, T., Goula, X., Chavarria, L., Figueras, S., Fleta, J., J., Oth, A., Proud, S., Pulli, J., Retailleau, L., Rintamäki, A. E., Casas, A., and Roca, A.: Seismic zonation of Barcelona based on Satriano, C., Savage, M. K., Shani-Kadmiel, S., Sleeman, R., numerical simulation of site effects, Pure Appl. Geophys., 158, Sokos, E., Stammler, K., Stott, A. E., Subedi, S., Sørensen, M. 2559–2577, https://doi.org/10.1007/PL00001186, 2001. B., Taira, T., Tapia, M., Turhan, F., van der Pluijm, B., Vanstone, Custódio, S., Dias, N. A., Caldeira, B., Carrilho, F., Carvalho, S., M., Vergne, J., Vuorinen, T. A. T., Warren, T., Wassermann, J., Corela, C., Díaz, J., Narciso, J., Madureira, G., Matias, L., and and Xiao, H.: Global quieting of high-frequency seismic noise Haberland, C.: Ambient noise recorded by a dense broadband due to COVID-19 pandemic lockdown measures, Science, 369, seismic deployment in Western Iberia, Bull. Seismol. Soc. Am., 1338–1343, https://doi.org/10.1126/science.abd2438, 2020a. 104, 2985–3007, https://doi.org/10.1785/0120140079, 2014. Lecocq, T., Massin, F., Satriano, C., Vanstone, M., and Megies, Dias, F. L., Assumpção, M., Peixoto, P. S., Bianchi, M. B., Collaço, T.: SeismoRMS – A simple Python/Jupyter Notebook pack- B., and Calhau, J.: Using Seismic Noise Levels to Monitor Social age for studying seismic noise changes Version 1.0, Zenodo, Isolation: An Example From Rio de Janeiro, Brazil, Geophys. https://doi.org/10.5281/zenodo.3820046, 2020b. Res. Lett., 47, 1–9, https://doi.org/10.1029/2020GL088748, Lindsey, N. J., Yuan, S., Lellouch, A., Gualtieri, L., Lecocq, T., and 2020. Biondi, B.: City-Scale Dark Fiber DAS Measurements of Infras- Díaz, J.: On the origin of the signals observed across tructure Use During the COVID-19 Pandemic, Geophys. Res. the seismic spectrum, Earth-Sci. Rev., 161, 224–232, Lett., 47, 1–8, https://doi.org/10.1029/2020GL089931, 2020. https://doi.org/10.1016/j.earscirev.2016.07.006, 2016. Mcnamara, D. E., Hutt, C. R., Gee, L. S., Benz, H. M., and Bu- Diaz, J. and Schimmel, M.: SANIMS [Data set], Inter- land, R. P.: A Method to Establish Seismic Noise Baselines for national Federation of Digital Seismograph Networks, Automated Station Assessment, Seism. Res. Lett., 80, 628–637, https://doi.org/10.7914/SN/YS_2019, 2019. https://doi.org/10.1785/gssrl.80.4.628, 2009. Díaz, J., Villaseñor, A., Morales, J., Pazos, A., Córdoba, D., Pul- Plaen, R. S. M., Márquez-Ramírez, V. H., Pérez-Campos, X., and gar, J., García-Lobón, J. L., Harnafi, M., Carbonell, R., and Gal- Ramón, F.: Seismic signature of the COVID-19 lockdown at the lart, J.: Background noise characteristics at the IberArray broad- city-scale: A case study with low-cost seismometers in the city of band seismic network, Bull. Seismol. Soc. Am., 100, 618–628, Querétaro, Mexico, 1–17, https://doi.org/10.5194/se-2020-194, https://doi.org/10.1785/0120090085, 2010. 2020. Díaz, J., Ruiz, M., Sánchez-Pastor, P. S., and Romero, P.: Urban Poli, P., Boaga, J., Molinari, I., Cascone, V., and Boschi, L.: Seismology: On the origin of earth vibrations within a city, The 2020 coronavirus lockdown and seismic monitoring of Sci. Rep., 7, 15296, https://doi.org/10.1038/s41598-017-15499- anthropic activities in Northern Italy, Sci. Rep., 10, 1–8, y, 2017. https://doi.org/10.1038/s41598-020-66368-0, 2020. Diaz, J., Schimmel, M., Ruiz, M., and Carbonell, R.: Raspberry Shake Community: OSOP, S.A., Gempa GmbH, Rasp- Seismometers Within Cities: A Tool to Connect berryShake network, https://doi.org/10.7914/SN/AM, 2016. Earth Sciences and Society, Front. Earth Sci., 8, 1–7, Somala, S. N.: Seismic noise changes during COVID-19 pandemic: https://doi.org/10.3389/feart.2020.00009, 2020. a case study of Shillong, India, Nat. Hazards, 103, 1623–1628, Green, D. N., Bastow, I. D., Dashwood, B., and Nip- https://doi.org/10.1007/s11069-020-04045-1, 2020. press, S. E. J.: Characterizing Broadband Seismic Noise Subedi, S., Hetényi, G., Denton, P., and Sauron, A.: Seismology in Central London, Seismol. Res. Lett., 88, 113–124, at School in Nepal: A Program for Educational and Citizen Seis- https://doi.org/10.1785/0220160128, 2017. mology Through a Low-Cost Seismic Network, Front. Earth Sci., Hinzen, K.: Subway-Induced Vibrations in Cologne Cathedral, Seis. 8, 73, https://doi.org/10.3389/feart.2020.00073, 2020. Res. Lett., 85, 631–638, https://doi.org/10.1785/0220140003, Wessel, P., Smith, W. H. F., Scharroo, R., Luis, J., and Wobb, F.: 2014. Generic Mapping Tools: improved version released, Eos, 45, Institut Cartogràfic I Geològic De Catalunya: Catalan Seismic 409–410, https://doi.org/10.1002/2013EO450001, 2013. Network, International Federation of Digital Seismograph Net- Xiao, H., Eilon, Z. C., Ji, C., and Tanimoto, T.: COVID- works, https://doi.org/10.7914/SN/CA, 1984. 19 Societal Response Captured by Seismic Noise in Krischer, L., Megies, T., Barsch, R., Beyreuther, M., Lecocq, T., China and Italy, Seismol. Res. Lett., 91, 2757–2768, Caudron, C., and Wassermann, J.: ObsPy: A bridge for seismol- https://doi.org/10.1785/0220200147, 2020. ogy into the scientific Python ecosystem, Comput. Sci. Discov., 8, 1–17, https://doi.org/10.1088/1749-4699/8/1/014003, 2015. Lecocq, T., Hicks, S. P., Van Noten, K., van Wijk, K., Koelemei- jer, P., De Plaen, R. S. M., Massin, F., Hillers, G., Anthony, R. E., Apoloner, M.-T., Arroyo-Solórzano, M., Assink, J. D., Büyükakpınar, P., Cannata, A., Cannavo, F., Carrasco, S., Cau- dron, C., Chaves, E. J., Cornwell, D. G., Craig, D., den Ouden, O. https://doi.org/10.5194/se-12-725-2021 Solid Earth, 12, 725–739, 2021
You can also read