Eurasian autumn snow link to winter North Atlantic Oscillation is strongest for Arctic warming periods
←
→
Page content transcription
If your browser does not render page correctly, please read the page content below
Earth Syst. Dynam., 11, 509–524, 2020
https://doi.org/10.5194/esd-11-509-2020
© Author(s) 2020. This work is distributed under
the Creative Commons Attribution 4.0 License.

             Eurasian autumn snow link to winter North Atlantic
             Oscillation is strongest for Arctic warming periods
                  Martin Wegmann1 , Marco Rohrer2,3,a , María Santolaria-Otín4 , and Gerrit Lohmann1
            1 Alfred  Wegener Institute, Helmholtz Centre for Polar and Marine Research, Bremerhaven, Germany
                    2 Oeschger   Centre for Climate Change Research, University of Bern, Bern, Switzerland
                                  3 Institute of Geography, University of Bern, Bern, Switzerland
                 4 Institut des Géosciences de l’Environnement, Université Grenoble-Alpes, Grenoble, France
                                              a now at: Axis Capital, Zurich, Switzerland

                                 Correspondence: Martin Wegmann (martin.wegmann@awi.de)

                                Received: 8 November 2019 – Discussion started: 20 November 2019
                             Revised: 28 March 2020 – Accepted: 6 April 2020 – Published: 29 May 2020

       Abstract. In recent years, many components of the connection between Eurasian autumn snow cover and win-
       tertime North Atlantic Oscillation (NAO) have been investigated, suggesting that November snow cover distri-
       bution has strong prediction power for the upcoming Northern Hemisphere winter climate. However, the non-
       stationarity of this relationship could impact its use for prediction routines. Here we use snow products from
       long-term reanalyses to investigate interannual and interdecadal links between autumnal snow cover and atmo-
       spheric conditions in winter. We find evidence for a negative NAO-like signal after November with a strong
       west-to-east snow cover gradient, which is valid throughout the last 150 years. This correlation is consistently
       linked to a weak stratospheric polar vortex state. Nevertheless, decadal evolution of this link shows episodes of
       decreased correlation strength, which co-occur with episodes of low variability in the November snow index.
       By contrast, periods with high prediction skill for winter NAO are found in periods of high November snow
       variability, which co-occur with the Arctic warming periods of the 20th century, namely the early 20th-century
       Arctic warming between 1920 and 1940 and the ongoing anthropogenic global warming at the end of the 20th
       century. A strong snow dipole itself is consistently associated with reduced Barents–Kara sea ice concentration,
       increased Ural blocking frequency and negative temperature anomalies in eastern Eurasia.

1   Introduction                                                   seasonal to decadal predictions of the state of the winter NAO
                                                                   are high-priority research for many climate science centres
                                                                   (Jung et al., 2011; Kang et al., 2014; Scaife et al., 2014, 2016;
As the leading climate variability pattern affecting winter cli-   Smith et al., 2016; Dunstone et al., 2016; Wang et al., 2017;
mate over Europe (Thompson and Wallace, 1998), the North           Athanasiadis et al., 2017).
Atlantic Oscillation (NAO) has been extensively studied over          Together with the rapid warming of the Arctic and the in-
the last decades (Wanner et al., 2001; Hurrell and Deser,          creased frequency of severe winters over Eurasia and North
2010; Moore and Renfrew, 2012; Pedersen et al., 2016; Deser        America (Yao et al., 2017; Cohen et al., 2018; Kretschmer
et al., 2017). The NAO has been defined as the variability         et al., 2018; Overland and Wang, 2018), recent studies have
of the pressure gradient between Iceland (representing the         highlighted the state of the Northern Hemispheric cryosphere
edge of the polar front) and the Azores (representing the          as a useful predictor for the boreal wintertime (December–
subtropical high ridge). The sign of the NAO is related to         January–February, DJF) NAO (Cohen et al., 2007, 2014;
weather and climate patterns stretching from local to conti-       Vihma, 2014; Garcia-Serrano et al., 2015; Cohen, 2016, Or-
nental scales. Since its variability has severe socioeconomic,     solini et al., 2016; Crasemann et al., 2017; Warner, 2018).
ecological and hydrological impacts for adjacent continents,

Published by Copernicus Publications on behalf of the European Geosciences Union.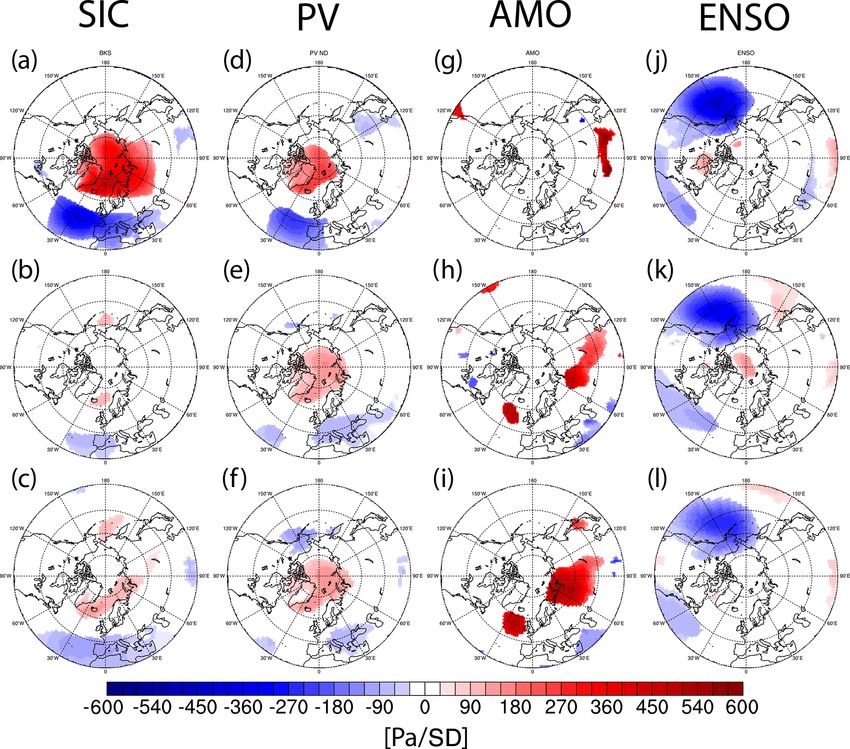
510                                                                           M. Wegmann et al.: Eurasian snow link to NAO

Although both systems seem to be connected (Cohen et al.,          state that the enhanced snow cover in winter is a product of
2014; Furtado et al., 2016; Gastineau et al., 2017), the emerg-    the negative NAO rather than a precursor. Sun et al. (2019)
ing main hypothesis connects reduced autumn Barents–Kara           highlight the importance of elevated North Atlantic sea sur-
sea ice concentration and increased Siberian snow cover with       face temperatures for the development of a Eurasian snow
a negative NAO state in the following winter months (Cohen         dipole in autumn. This warming of the North Atlantic favours
et al., 2014).                                                     reduced sea ice cover for the European part of the Arc-
   The proposed mechanism behind this hypothesis is a              tic, which triggers a high-pressure anomaly over the north-
multi-step process, starting with autumn sea ice loss for the      ern Ural Mountains via increased ocean-to-atmosphere heat
European Arctic, followed by altered tropospheric circula-         fluxes, transporting cold air masses towards the south of its
tion due to elevated Rossby wave numbers, vertical propaga-        eastern flank.
tion of said Rossby waves upward into the stratosphere and            The possible impact of the Siberian snow on the strato-
consequently a weakening of the polar vortex (see Cohen et         sphere and eventually on the NAO is well discussed in Hen-
al., 2014, for an in-depth discussion). With the weakening         derson et al. (2018). Although observational NAO prediction
(or the reversal) of the polar vortex, a stratospheric warming     studies with Siberian snow showed great success in the past
signal manifests itself. This signal propagates slowly back        (Cohen and Entekhabi, 1999; Saito et al., 2001; Cohen et al.,
into the troposphere, where it manifests itself as a negative      2007, 2014; Han and Sun, 2018), links between snow and the
NAO, connected to the concurrent cold winters for Eurasia          stratosphere still seem to be missing or too weak in model
(Kretschmer et al., 2018).                                         studies (Furtado et al., 2015; Handorf et al., 2015; Tyrrell
   In recent years, many components of this pathway have           et al., 2018; Gastineau et al., 2017; Peings et al., 2017),
been investigated, especially concerning the increased fre-        whereas nudging realistic snow changes to high-resolution
quency of cold winters over Europe and the emergence of            models seems to improve the prediction skill (Orsolini and
the counter-intuitive “warm Arctic–cold continent” (WACC)          Kvamsto, 2009; Orsolini et al., 2016; Tyrrell et al., 2019).
pattern over Eurasia (Petoukhov and Semenov, 2010; Vihma,          Moreover, even though the stratosphere–surface connection
2014). However, there remains substantial uncertainty about        is now reasonably well established (Kretschmer et al., 2018),
the impact of Arctic sea ice in terms of location (Zhang et al.,   the timing and location of the snow cover used for the pre-
2016; Luo et al., 2017; Screen 2017; Kelleher and Screen,          diction is, as with sea ice, still debated (Yeo et al., 2016;
2018), timing (Honda et al., 2009; Overland et al., 2011; In-      Gastineau et al., 2017). As an additional caveat, Peings et
oue et al., 2012; Suo et al., 2016; Sorokina et al., 2016; King    al. (2013) and more recently Douville et al. (2017) showed
et al., 2016; Screen, 2017; Wegmann et al., 2018a; Blackport       that the proposed autumn snow-to-winter NAO relationship
and Screen, 2019) or whether sea ice can be used as a predic-      is non-stationary for the 20th century. A possible modula-
tor or forcing at all based on the contrasting results of model    tor for that relationship might be the phase of the Quasi Bi-
studies (McCusker et al., 2016; Collow et al., 2017; Peder-        ennial Oscillation (QBO) (Tyrrell et al., 2018; Peings et al.,
sen et al., 2016; Boland et al., 2017; Crasemann et al., 2017;     2017; Douville et al., 2017). Peings (2019) argues that nei-
Ruggieri et al., 2017; Garcia-Serrano et al., 2017; Francis,       ther snow nor sea ice anomalies trigger the stratospheric con-
2017; Screen et al., 2018; Mori et al., 2019; Hoshi et al.,        ditions needed to produce winter extremes and that instead
2019; Blackport et al., 2019; Romanowksy et al., 2019).            high tropospheric blocking frequency over northern Europe
   The interplay between Arctic sea ice and Siberian snow          leads to the cryosphere anomalies.
is much less explored. Ghatak et al. (2010) showed that re-           Here, we follow up on the definition of a November
duced autumn polar sea ice leads to the emergence of in-           Eurasian snow cover dipole (Ye and Wu, 2017; Gastineau et
creased Siberian winter snow cover, especially so in the east-     al., 2017; Han and Sun, 2018), which was identified to pro-
ern part of Eurasia. This dipole signal was amplified in cou-      vide predictive power for the following winter months at the
pled climate model runs for the 21st century, where sea ice        end of the 20th century. It is, however, unclear if this pre-
is substantially diminished. In an observational study, Yeo        diction skill is stable for time periods further back than 30
et al. (2017) point out that the moisture influx from the open     years and how it evolves in periods of high Arctic sea ice
Arctic ocean into the Eurasian continent contributes to the in-    cover. In this study we address the question of (a) the non-
crease in snow cover, a mechanism described by Wegmann et          stationarity of the Eurasian snow cover to winter European
al. (2015). Gastineau et al. (2017) found that reduced sea ice     surface climate relationship in the 20th century, (b) the im-
is connected to a distinct November snow dipole over Eura-         portance of snow versus sea ice as a predictor and (c) possi-
sia, both in reanalysis and model data. They further state that    ble precursors/modulators of the sea-ice–snow–stratosphere
the snow component is a statistically more powerful predic-        chain. With this we aim to contribute to the understanding of
tor than sea ice for the atmosphere in the following winter.       impacts of cryosphere variability on mid-latitude circulation
This relationship was also found in a range of climate mod-        (Francis, 2017; Henderson et al., 2018; Cohen et al., 2020).
els, albeit with weaker links. Xu et al. (2019) found the same     To this end, we utilize centennial reanalyses and reconstruc-
correlation in observational and model data, however looking       tion data, where we focus on the transition from October to
at winter climate only. Based on their analysis, the authors       November to DJF to facilitate the idea of seasonal prediction.

Earth Syst. Dynam., 11, 509–524, 2020                                                https://doi.org/10.5194/esd-11-509-2020
M. Wegmann et al.: Eurasian snow link to NAO                                                                                511

   This paper is organized as follows. Sect. 2 describes the     indices from reanalyses with snow indices using the NOAA
data and methods used. In Sect. 3, we introduce the snow         Climate Data record of Northern Hemisphere snow cover ex-
cover indices and their interannual prediction value. Sec-       tent (Robinson et al., 2012), which incorporates satellite data,
tion 4 investigates interdecadal shifts in the correlation be-   does not highlight any meaningful differences (Supplement
tween snow cover and NAO as well as possible determining         Fig. S2). All snow indices are normalized and linearly de-
factors. The results are discussed in Sect. 5 and finally sum-   trended with respect to their overall time period. Generally,
marized in Sect. 6.                                              we found the long-term reanalyses to be of comparable qual-
                                                                 ity to MERRA2 during the overlapping periods.
                                                                    Besides snow properties we use detrended atmospheric
2     Data and methods
                                                                 and near-surface anomaly fields from all three reanalyses.
2.1    Atmospheric reanalyses
                                                                 Moreover, as Douville et al. (2017), we use the field-averaged
                                                                 (60–90◦ N) 10 hecto-pascal (hPa) geopotential height (GPH)
To evaluate long-term reanalyses, we use snow cover, snow        anomalies in ERA20C as a surrogate for polar vortex (PV)
depth and atmospheric properties from the MERRA2 reanal-         strength. Although ERA20C only assimilates surface pres-
ysis (Gelaro et al., 2017). MERRA2 has a dedicated land sur-     sure, correlation between this stratospheric index in ERA20C
face module and was found to reproduce local in situ snow        and MERRA2 during the overlapping time periods is higher
conditions over Russia very well (Wegmann et al., 2018b).        than 0.9.
For a detailed description of how MERRA2 computes snow              The ERA20C 10 hPa November–December mean GPH
properties, see, e.g., Orsolini et al. (2019).                   shows remarkable interannual agreement with state-of-the-
   To cover the 20th century and beyond, we include two          art reanalyses that assimilate upper-air data for the period
long-term reanalyses in this study, namely the NOAA-             1958–2010 (see Supplement Fig. S3). Moreover, MERRA2
CIRES 20th-century reanalysis Version 2c (20CRv2c) (Cram         and ERA20C 10 hPa GPH anomalies agree best over the
et al., 2015) as well as the Centre for Medium-Range             northern polar regions with correlation coefficients of >0.9
Weather Forecasts (ECMWF) product ERA-20C (ERA20C;               for the period 1981–2010 (see Supplement Fig. S3). This
Poli et al., 2016). From the ERA20C product we use snow          fact supports the extended value of the ERA20C polar strato-
depth, whereas from 20CRv2c we investigate snow depth            sphere. Before 1958, the quality of the ERA20C stratosphere
and snow cover. Both reanalyses were found to represent in-      is difficult to assess, but the comparison with reconstructions
terannual snow variations over Eurasia remarkably well. For      of 100 hPa GPH zonal means shows very good agreement for
an in-depth discussion of their performance and their tech-      late autumn and winter months (see Supplement Fig. S4). As
nical details concerning snow computation, see Wegmann           the 20CRv2c ensemble mean dilutes the interannual variabil-
et al. (2017b). We also performed the same analysis using        ity signal back in time with increased variability within the
the coupled ECMWF reanalysis CERA20C (Laloyaux et al.,           ensemble members, we use the deterministic run of ERA20C
2018) but found no added knowledge gain over ERA20C.             for the following stratosphere analyses.
Thus, we do not include CERA20C in any further analysis.            We use 6-hourly 500 hPa GPH fields (GPH500) to cal-
   We use detrended anomalies of these three reanalysis          culate monthly blocking frequencies according to Rohrer
products to extend the October and November index pro-           et al. (2018). Blockings are computed according to the ap-
posed by Han and Sun (2018) into the past, where the             proach introduced by Tibaldi and Molteni (1990) and are
November index is in essence the snow dipole described by        defined as reversals of the meridional GPH500 gradient. In
Gastineau et al. (2017) using maximum covariance analysis        accordance with Scherrer et al. (2006) the one-dimensional
(Fig. 1). Whereas the October index is just calculated as the    Tibaldi and Molteni (1990) algorithm is extended to the two
field average snow cover, the November index is computed as      dimensions by varying the latitude between 35 and 75◦ in-
the difference between the eastern and the western field av-     stead of a fixed latitude.
erages. It should be noted that Han and Sun (2018) found the
                                                                   i. GPH500 gradient towards the pole:
November index to be linked to a negative NAO and colder
Eurasian near-surface temperatures, whereas the October in-                          GPH500ϕ+dϕ − GPH500ϕ
                                                                      GPH500GP =
dex was correlated with warmer than usual temperatures over                                    dϕ
Eurasia and a southward-shifted jet. However, since many                                  m
studies focus on northern Eurasian October snow cover as                           < −10 ◦                                   (1)
                                                                                           lat
the predictor for winter climate, we will include it nonethe-
less. MERRA2 and 20CRv2c offer snow cover as well as              ii. GPH500 gradient towards the Equator:
snow depth as a post-process output; however, ERA20C only                             GPH500ϕ − GPH500ϕ−dϕ     m
offers snow depth. We refrained from converting it to snow            GPH500GE =                           > 0◦     (2)
                                                                                               dϕ               lat
cover ourselves but found the index based on snow depth to
be extremely similar (also see Supplement Fig. S1) to the          Blocks by definition are persistent and quasi-stationary
same index using snow cover. Moreover, comparing snow            high-pressure systems that divert or severely slow down the

https://doi.org/10.5194/esd-11-509-2020                                             Earth Syst. Dynam., 11, 509–524, 2020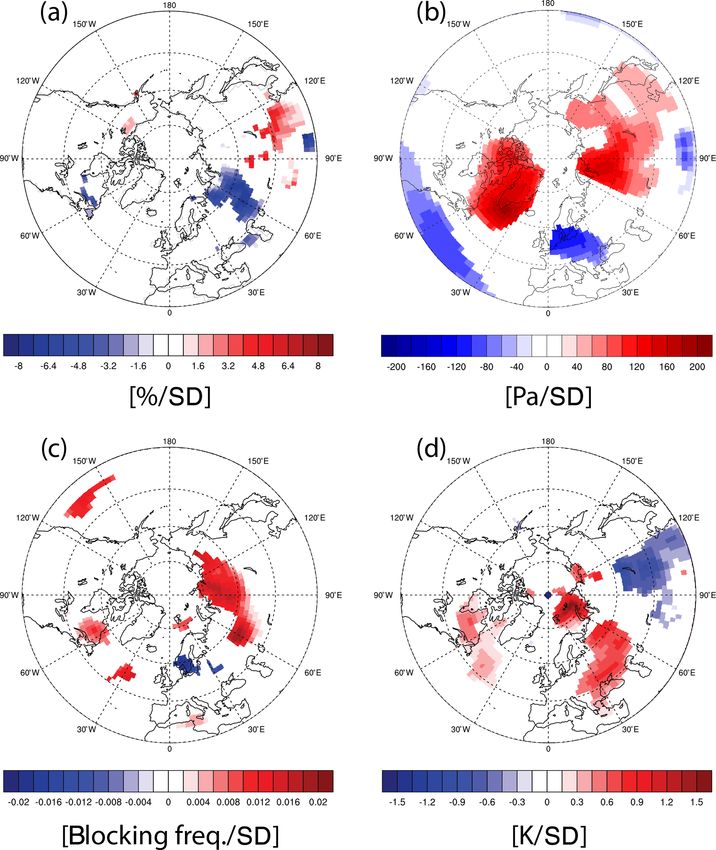
512                                                                               M. Wegmann et al.: Eurasian snow link to NAO

Figure 1. (a) Regions for October and November snow index used in this study. (b) Linearly detrended and standardized October snow
index comparison for the 20th century for snow cover (SC) and snow depth (SD) variables. Panel (c) same as (b) but for the November snow
dipole.

prevailing westerly winds in the mid-latitudes. They influ-           sea ice index (Supplement Fig. S5), AMO index and ENSO
ence regional temperature and precipitation patterns for an           index and only found significant autocorrelation in the BKS
extended period. Therefore, not all blocks that fulfil the two        sea ice and AMO time series. We assess the significance of
above-mentioned conditions are retained. We only include              a regression coefficient in a regression model by dividing the
blocks that have a minimum lifetime of 5 d and a minimum              estimated coefficient over the standard deviation of this esti-
overlap of the blocked area of 70 % (At+1 ∩ At > 0.7 · At )           mate. For statistical significance we expect the absolute value
in our blocking catalogue. This largely follows the criteria          of the t ratio to be greater than 2 or the p value to be less than
defined by Schwierz et al. (2004).                                    the significance level (α = 0.05). The degrees of freedom are
                                                                      determined as (n-k), where k is the parameters of the esti-
2.2   Climate reconstructions                                         mated model and n the number of observations.

To be as independent as possible with regard to the reanalyses
we use a wide array of climate index reconstructions for the          3     Results
20th century:
                                                                      3.1    Interannual links
  – Atlantic Multidecadal Oscillation (AMO): for the AMO
    index we take October values based on the Enfield et              In the following paragraphs, we investigate the year-to-
    al. (2003) study. We choose October to allow for a cer-           year relationship between the snow indices and the follow-
    tain feedback lag with the atmosphere and to have de-             ing winter sea level pressure (SLP) fields. For this we use
    cent prediction value for the upcoming snow and NAO               MERRA2 for a 35-year-long period ranging from 1981 to
    indices.                                                          2015, ERA20C for a 110-year-long window ranging from
  – El Niño–Southern Oscillation (ENSO): we choose                    1901 to 2010 and 20CRv2c for a 160-year-long window
    the ENSO3.4 reconstruction based on the HadIS-                    ranging from 1851 to 2010.
    STv1 Rayner et al. (2003) sea surface temperatures                   Figure 2 shows the linear regression fields of DJF SLP
    (SSTs). As with the AMO, we select October values to              anomalies projected onto the respective snow indices in Oc-
    allow for a reaction time in the teleconnections.                 tober and November. For October, we find no NAO-like pres-
                                                                      sure anomaly appears to be significantly correlated with the
  – NAO: we use the extended Jones et al. (1997) NAO in-              snow index in each of the three reanalysis products and
    dex for DJF from the Climate Research Unit (CRU).                 respective time windows (Fig. 2a, b, c). Instead, negative
                                                                      SLP anomalies dominate northern Eurasia in MERRA2, with
  – Sea ice: we use the monthly sea ice reconstruction
                                                                      high-pressure anomalies towards the Himalayan Plateau. The
    by Walsh et al. (2017), which covers the period 1850–
                                                                      110-year-long regression in ERA20C shows significant neg-
    2013, to create a Barents–Kara (65–85◦ N, 30–90◦ E)
                                                                      ative anomalies over the Asian part of Russia, reaching as
    sea ice index for November.
                                                                      far south as Beijing. A second significant negative SLP pat-
  We checked for autocorrelation in the time series of the            tern appears along the Pacific coast of Canada. Finally, SLP
snow indices, stratospheric index, Barents–Kara Sea (BKS)             anomalies in 20CRv2c support the main SLP patterns shown

Earth Syst. Dynam., 11, 509–524, 2020                                                     https://doi.org/10.5194/esd-11-509-2020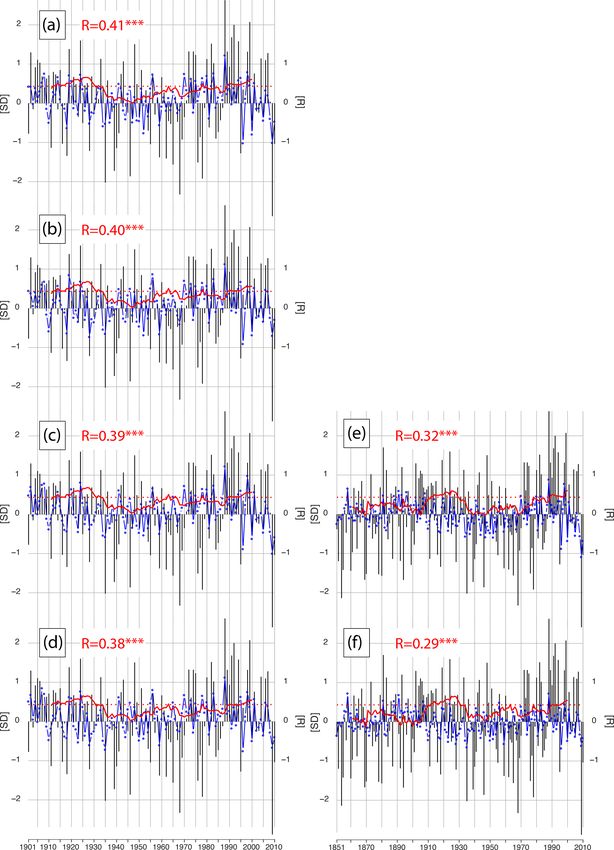
M. Wegmann et al.: Eurasian snow link to NAO 513
by ERA20C but reduce the extent of negative anomalies over
Eurasia and increase the extent of the negative anomalies
over the North Pacific.
The DJF SLP anomaly patterns change substantially when
projected onto the November snow index (Fig. 2d, e, f). All
three reanalysis products show negative NAO-like pressure
anomalies with significantly positive anomalies over Iceland
and the northern North Atlantic and significantly negative
anomalies south of ca. 45◦ N, including Portugal and the
Azores. As expected, MERRA2 shows the strongest anoma-
lies due to the shorter regression period; however, inter-
estingly, ERA20C, with the 110-year-long analysis period,
shows less large-scale significance for positive anomalies in
high latitudes compared to the 150-year-long investigation
period in 20CRv2c (even though non-significant anomalies
cover roughly the same area as in 20CRv2c (not shown)).
This hints at decadal variations in the strength of the regres-
sion but could also be due to biases in the reanalyses.
To check for such biases we compared all reanalyses with
the SLP reconstruction dataset HadSLP2r (Allen and Ansell,
2006) and found that for the regression analysis using the
time period 1901–2010, 20CRv2c overestimates the polar
sea level pressure response, whereas ERA20C is much closer
to HadSLP2r (see Supplement Fig. S6). This would indeed
support the notion of decadal variations in the strength of the
relationship between predictor and predictand. However, it is
worth highlighting that this overestimation for 20CRv2c is
not visible for the 1851–2010 period, during which regres-
sion anomalies resemble HadSLP2r much more closely.
We investigate other possible predictors for wintertime
NAO via regressed anomalies onto the November BKS ice
concentration, November–December mean polar GPH at
10 hPa, October AMO and October ENSO indices (Fig. 3).
The periods for MERRA2 and ERA20C are identical in
Fig. 2, whereas the anomaly plots for 20CRv2c use the max-
Figure 2. DJF sea level pressure (pascal per 1 SD) anomalies pro-
imum period covered in the reconstructions, namely 1851– jected onto snow indices (see Fig. 1) for October (a, b, c) and
2010 in the sea ice reconstruction, 1856–2010 in the AMO November (d, e, f) for (a) and (d) MERRA2 covering 1981–2015,
reconstruction, 1901–2010 for the polar 10 hPa GPH index (b, e) ERA20C covering 1901–2010 and (c, f) 20CRv2c covering
taken from ERA20C and 1870–2010 for the ENSO recon- 1851–2010. Only anomalies >95 % significance level are shown.
struction.
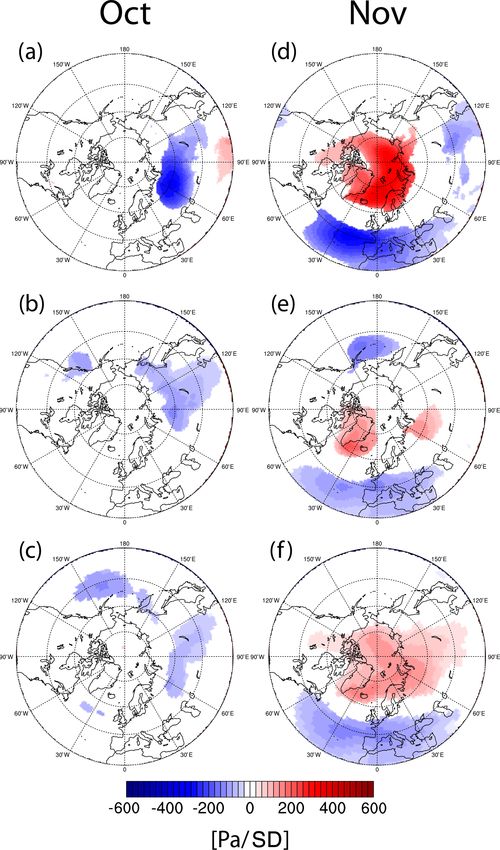
As can be seen from Fig. 3, the 35-year-long analysis in
MERRA2 shows November sea ice concentration and early Looking at the regression patterns in the centennial reanal-
winter stratospheric heights regress to a similar SLP pattern yses, the NAO-like pattern in the SLP anomalies regressed
as the November snow index. Positive SLP anomalies over onto sea ice and stratospheric GPH can still be seen; how-
Iceland and Greenland combined with negative anomalies ever, the extent and strength are substantially reduced com-
over southern Europe and the adjacent North Atlantic form pared to MERRA2 as well as compared to the regression us-
a negative NAO-like pattern in DJF (Fig. 3a). On the other ing November snow as a predictor. Again, ERA20C shows
hand, the interannual signals in the October AMO and ENSO a decrease in the significant anomalies regressed onto sea
indices do not point towards such a pressure distribution. The ice compared to 20CRv2c, with possible reasons already dis-
small interannual changes and low frequency of the AMO cussed above. Elevated geopotential heights at 10 hPa con-
combined with the short sample period inhibit most of the sistently increase polar sea level pressure in the following
significance, only southern Eurasia shows regions with ele- winter months; however, the impact over the European and
vated SLP. As expected, anomalies regressed on the ENSO North Atlantic domain severely decreases in the centennial
index show significance mostly for the North Pacific and reanalyses.
North American regions.
https://doi.org/10.5194/esd-11-509-2020 Earth Syst. Dynam., 11, 509–524, 2020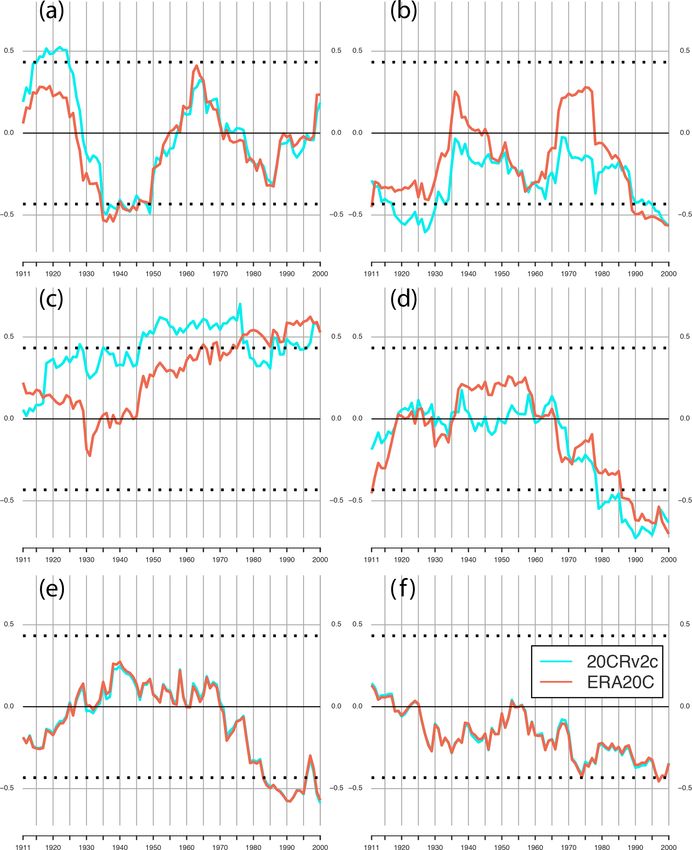
514 M. Wegmann et al.: Eurasian snow link to NAO
icant lower-troposphere warming is shown between 60 and
90◦ N for October. The warming signal then dominates the
stratosphere and upper troposphere in December, after which
the strongest anomalies subside into the lower stratosphere
and tropopause in January and February. This development
of atmospheric temperatures is mirrored in the evolution of
the polar vortex, where a reduction in the polar vortex and
strengthening of the subtropical jet is seen together with the
emergence of the November snow dipole, after which the re-
gion of strongest anomalies migrates from the stratosphere to
the upper troposphere.
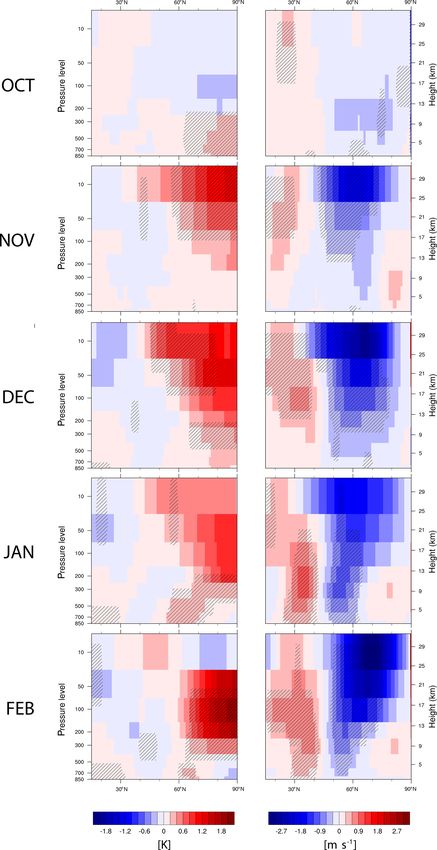
To address the physical reasons as to how the low sea
ice and high snow indices are connected, climate anoma-
lies are regressed onto BKS ice concentrations for Novem-
ber (Fig. 5). Compared to factors such as AMO and ENSO,
BKS sea ice shows a distinct snow cover dipole coinciding
with a high-pressure anomaly over the BKS and the north-
ern Ural mountains, which supports a regional atmospheric
Figure 3. DJF sea level pressure (Pa/SD) anomalies projected onto blocking and cold air advection on its eastern flank. This
BKS ice concentration in November (a, b, c), polar 10 hPa GPH cold air anomaly supports increased snow cover over eastern
November–December mean (d, e, f), October AMO (g, h, i) and Eurasia, while relatively warm temperatures reduce the snow
October ENSO indices (j, k, l) for (a, d, g, j) MERRA2 covering cover over eastern Europe. It should be noted that October
1981–2015, (b, e, h, k) ERA20C covering 1901–2010 and (c, f, i, BKS ice concentration shows qualitatively the same pattern
l) 20CRv2c covering 1851–2010. Regression values for BKS ice for November snow cover anomalies (not shown); however,
concentrations were multiplied by −1 to aid comparability. Only this is not statistically significant.
anomalies >95 % significance level are shown.
3.2 Interdecadal links
SLP anomalies regressed onto the AMO index show sig- The interdecadal evolution of the November snow index is
nificant positive SLP regions for large parts of Eurasia as shown in Fig. 6. The 21-year running means of the nor-
well as positive anomalies over the North Atlantic west of malized time series of AMO, BKS ice and snow hint at a
Great Britain. Interesting to note in 20CRv2c is the very multidecadal frequency, similar in wave length to the AMO
strong high-pressure anomaly reaching from the BKS to the and BKS ice anomalies. Even though we refrain from cor-
southern part of the Ural mountains, a prominent feature of- relating these time series due to the 21-year filter (Trenary
ten found for years with positive AMO and negative sea ice and DelSole, 2016), we find the possible mechanism behind
concentration and frequently linked to a high frequency of the decadal co-occurrence of warm North Atlantic SSTs, re-
Ural blockings (UBs). SLP distribution after El Niño events duced sea ice and increased snow cover gradient to be phys-
does not change considerably, irrespective of the dataset and ically plausible (Luo et al., 2017). As Luo et al. (2017) point
time period used. A strong Pacific signal shows the northern out, warm North Atlantic water reduces the BKS ice con-
part of the Pacific North American pattern (PNA), with nega- centration, which decreases the meridional temperature gra-
tive SLP anomalies over the eastern North Pacific. Given the dient and strong westerly winds, which in turn supports high
autocorrelation in the AMO and BKS sea ice index, the sig- pressure over the Ural mountains and, with that, cold air ad-
nificance in Fig. 2a, b and c as well as Fig. 2g, h and i might vection towards eastern Eurasia. It should be noted, however,
be severely lower due to the reduced number of degrees of that the AMO and the November snow index are out of phase
freedom. between 1880 and 1920, where uncertainties in both products
To investigate the vertical development of climate anoma- are largest.
lies connected with the November snow dipole, Fig. 4 shows The more critical question is the interdecadal evolution of
the zonal mean anomalies of zonal wind and temperature the relationship between the predictor and the predictand.
in ERA20C projected onto the ERA20C November snow Similar to Peings et al. (2013) and Douville et al. (2017),
index (for an evaluation with an upper-air climate recon- we apply a 21-year running correlation covering the period
struction, see Supplement Fig. S7). The temporal evolution 1901–2010 to examine the stationarity of the relationship and
of the anomalies ranging from October to February shows differences between 20CRv2c and ERA20C.
that stratospheric warming occurs simultaneously within the Figure 7 summarizes the correlation over time for multiple
same month as a positive snow cover dipole, with no strato- pairs of climate variables. As Fig. 7b points out, the sign of
spheric warming leading that development. Instead, signif- the November snow to winter NAO relationship in 20CRv2c
Earth Syst. Dynam., 11, 509–524, 2020 https://doi.org/10.5194/esd-11-509-2020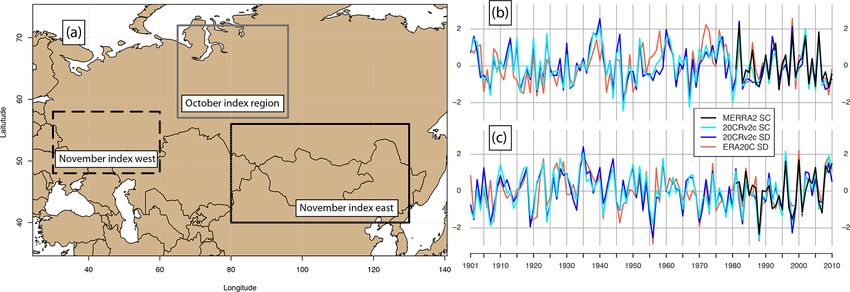
M. Wegmann et al.: Eurasian snow link to NAO                                                                                 515

                                                                  Figure 5. 20CRv2c November anomalies projected onto BKS ice
                                                                  concentration in November covering 1851–2010. Regression values
                                                                  for BKS ice concentrations were multiplied by −1 to aid compara-
                                                                  bility. (a) November snow cover (%/SD) anomalies projected onto
                                                                  BKS ice concentration in November, (b) November SLP (Pa/SD)
                                                                  anomalies projected onto BKS ice concentration in November, (c)
                                                                  November atmospheric blocking (blocking per season/SD) anoma-
                                                                  lies projected onto BKS ice concentration in November and (d)
                                                                  November 2 m temperature (K/SD) anomalies projected onto BKS
                                                                  ice concentration in November. Only anomalies >95 % significance
                                                                  level are shown.

                                                                  periods of pronounced negative correlations during the early
                                                                  20th-century Arctic warming and the 1980s. Emerging since
Figure 4. Zonal mean (180◦ E–180◦ W, 15–90◦ N) (left) tempera-    the 1970s is a negative relationship shown in Fig. 7e between
ture anomalies and (right) zonal mean zonal wind anomalies pro-   BKS ice reduction (multiplied by −1 to aid comparability)
jected onto snow indices in November for ERA20C covering 1901–    and the formation of a negative NAO signal in the following
2010. Shading indicates 95 % significance level.                  winter, with very weak negative correlations for the ETCAW.
                                                                     Together with the emergence of the sea-ice-to-NAO re-
                                                                  lationship, negative correlations between BKS sea ice and
is negative throughout the whole 20th century. Periods with       November snow index (Fig. 7d) as well as between strato-
negative correlations can be found at the beginning and the       spheric warming and winter NAO strengthen towards the end
end of the century, with relatively weak correlation during       of the 20th century (Fig. 7f). This strengthening is also found
the 1930s and 1970s. The periods of strong negative corre-        in ERA20C for the correlation between November snow and
lations overlap with commonly known Arctic warming pe-            a following stratospheric warming, wheres 20CRv2c shows
riods, the early 20th-century Arctic warming (ETCAW) and          consistently positive correlation values throughout the 20th
the ongoing recent Arctic warming in the context of anthro-       century (Fig. 7c).
pogenic global warming. Even stronger decadal variability            Overall, the 20CRv2c November snow index shows a
can be seen for the running correlations between the Octo-        more stationary relationship with tropospheric and strato-
ber snow index and winter NAO-like signal (Fig. 7a), with         spheric winter circulation than ERA20C. Possible explana-

https://doi.org/10.5194/esd-11-509-2020                                              Earth Syst. Dynam., 11, 509–524, 2020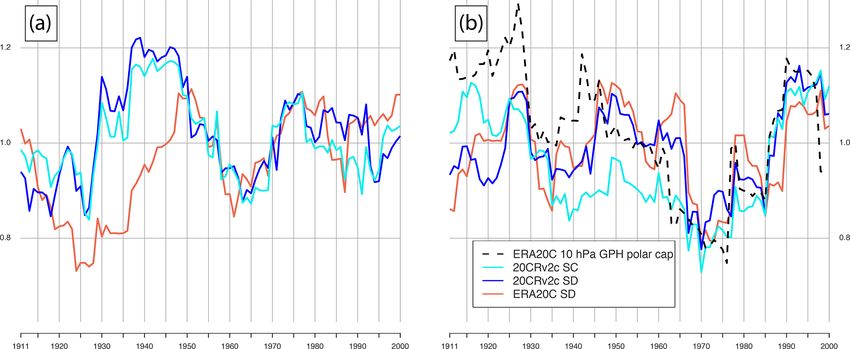
516                                                                         M. Wegmann et al.: Eurasian snow link to NAO

                                                                 determined by the least-squares calculations. Moreover, we
                                                                 perform (b) and (d) also for the period 1851–2010.
                                                                    Figure 8 shows original and predicted normalized DJF
                                                                 NAO values together with the 21-year running correlation of
                                                                 both indices. Overall correlation values are low but signifi-
                                                                 cant for the 110-year time period (ranging from 0.41 to 0.38),
                                                                 but specific periods of high correlation emerge for both Arc-
                                                                 tic warm periods, the first one being centred around 1925 and
                                                                 the second one being centred around the year 2000 with both
                                                                 periods reaching correlation coefficients above 0.6. The mul-
                                                                 tiple regression prediction model with three different predic-
                                                                 tors performs best, with a significant correlation to the orig-
                                                                 inal NAO variability of 0.41 for 110 years (Fig. 8a). Nev-
                                                                 ertheless, November snow cover seems to add most of the
                                                                 prediction skill, since the decrease in correlation coefficient
Figure 6. The 21-year running means of (a) November snow in-     between the multiple regression model with three predictors
dex from 20CRv2c, (b) November BKS ice concentration and (c)     and the simple linear regression model with just November
October AMO.                                                     snow cover as a predictor is 0.03. Moreover, periods of high
                                                                 correlation coefficients align with periods of strong negative
                                                                 relationships in Fig. 7b.
tions for this behaviour will be discussed in the following         For the same empirical prediction model using 160 years,
section.                                                         the overall correlation coefficients decrease to around 0.3.
   For all of the linear relationships shown in Fig. 7 we per-   As expected, the same periods of increased prediction skill
formed a Durbin–Watson test to check for serial correlation      emerge (Fig. 8e and f) and the added prediction skill of sea
between two variables and did not find any compelling in-        ice is low. It should be noted, however, that sea ice increases
dication of co-dependence in any case (see Supplement Ta-        prediction skill during the current Arctic warming period, as
ble S1). Moreover, we investigated different running correla-    well as the end of the 19th century, with the second-highest
tion windows (11, 21, 25 and 31 years) and find that the main    correlation coefficients centred around 1890 (not shown).
outcome of the analysis is not dependent on the choice of the
correlation window (see Supplement Fig. S8).
   Based on the results from Fig. 7 (and the overall signif-     4   Discussion
icance of linear relationships; see Supplement Fig. S9) we
investigate very basic linear multiple and simple regression     We used a variety of reanalyses and reconstructions to ad-
models to predict the upcoming DJF NAO index sign and as-        dress some of the open questions regarding the relationship
sess the contributions to the prediction skill by November sea   between Eurasian snow cover and the state of the NAO in the
ice, November snow cover and November–December mean              following winter.
stratospheric conditions. For the period 1901–2010 we inves-        Given the highly discussed research topic of Northern
tigate three different multiple regression models with           Hemisphere sea ice cover and snow cover impact on mid-
  a. DJF NAO (t) = a1 × Nov. snow cover (t) + b1 ×               latitude circulation (Cohen et al., 2020), as well as the high-
     Nov. BKS sea ice (t) + c1 × ND 10 hPa GPH(t),               lighted need to investigate relationships over several decades
                                                                 (Kolstad and Screen, 2019), we investigated a promis-
  b. DJF NAO (t) = a1 × Nov. snow cover (t) + b1 ×               ing November west–east snow cover dipole over Eurasia
     Nov. BKS sea ice (t),                                       (Gastineau et al., 2017; Han and Sun, 2018) and its rela-
                                                                 tionship to the DJF NAO state up to the middle of the 19th
  c. DJF NAO (t) = a1 × Nov. snow cover (t) + b1 ×               century to cover 150 years of internal and external climate
     ND 10 hPa GPH (t) and one simple linear regression          forcings. Given the importance for seasonal prediction, we
     model,                                                      addressed the question of the stationarity of said relationship
 d. DJF NAO (t) = a1 × Nov. snow cover (t),                      as well as its context within other common Northern Hemi-
                                                                 spheric predictors.
where DJF NAO is the standardized NAO index calculated              Compared to Gastineau et al. (2017) and Han and Sun
by EOF analysis of 20CRv2c SLP data, Nov. snow cover is          (2018), we could extend the reanalysis study period from 35
the November 20CRv2c snow cover index, Nov. BKS sea ice          to 150 years and highlighted the consistently negative sign
is the Walsh et al. (2017) November BKS sea ice index and        of the snow–NAO relationship in the 20CRv2c dataset. Par-
ND 10 hPa GPH is the ERA20C November–December mean               tial correlations for 110 years show that reduced BKS sea ice
10 hPa GPH index, with a1, b1 and c1 being the constants         shows a similar response in DJF SLP anomalies; however,

Earth Syst. Dynam., 11, 509–524, 2020                                              https://doi.org/10.5194/esd-11-509-2020
M. Wegmann et al.: Eurasian snow link to NAO 517
Figure 7. The 21-year centred running correlation time series between (a) October snow index and DJF NAO, (b) November snow index and
DJF NAO, (c) November snow index and mean November–December polar 10 hPa GPH index, (d) November snow index and November
BKS ice concentration, (e) November BKS ice concentration multiplied by −1 to aid comparability and DJF NAO, and (f) mean November–
December polar 10 hPa GPH and DJF NAO index. Black dashed line indicating the 95 % confidence level for a two-sided Student’s t test
assuming independence and normal distribution.
its statistical importance, and therefore its quality as being Moreover, the monthly evolution of vertical temperature
the prime predictor, is less than the November snow index anomalies related to a high snow cover supports the theoret-
(see Supplement Table S2 for partial correlations). This is ical framework (Cohen et al., 2014; Henderson et al., 2018)
also found in simple multiple regression prediction models, for a Eurasian snow-cover-to-stratosphere link in reanalyses
whereas the November snow cover index incorporated the for at least the 20th century and probably before. We found
major share of the prediction power. Extending the analysis surface cooling and snow cover expansion east of the sea ice
of Gastineau et al. (2017) to 150 years further underlines the anomaly, where cold air is advected on the eastern side of a
lack of snow–atmosphere feedback in most of the CMIP5 Ural blocking anomaly (Fig. 5). The increased geopotential
models and reduces the probability that the snow–NAO link heights and the related Rossby wave energy reach the strato-
is due to random internal variability at the end of the 20th sphere (Supplement Fig. S7), where a stratospheric warming
century. and a slowdown of the polar vortex manifests itself (Fig. 4).
These anomalies reach the troposphere in January and Febru-
https://doi.org/10.5194/esd-11-509-2020 Earth Syst. Dynam., 11, 509–524, 2020518 M. Wegmann et al.: Eurasian snow link to NAO
Figure 8. Comparison of 1901–2010 20CRv2c DJF standardized NAO values based on EOF analysis with predicted values from multiple
and simple linear regression models showing (a) multiple linear regression model with November snow cover index, November BKS sea
ice index and ND 10 hPa geopotential height index with an overall correlation of 0.41, (b) multiple linear regression model with November
snow cover index and ND 10 hPa geopotential height index with an overall correlation of 0.4, (c) multiple linear regression model with
November snow cover index and November BKS sea ice index with an overall correlation of 0.39, and (d) simple linear regression model
with November snow cover index and November BKS sea ice index with an overall correlation of 0.38. Panels (e) and (f) same as (c) and (d)
but for the period 1851–2010. Left y axis indicates standard deviation; right y axis indicates correlation coefficient. Red dashed line indicates
95 % significance level for a 21-year period.
ary, where they express themselves as a negative NAO signal Peings et al. (2013) and the follow-up study by Douville
(Fig. 2). It is noteworthy that all of these features are signif- et al. (2017) found that the October and October–November
icantly correlated with the November snow cover index for mean snow cover over a broader region of northern Eurasia
more than 100 years. and its relationship to the wintertime NAO is indeed not sta-
tionary over time. We found a strong relationship between the
Earth Syst. Dynam., 11, 509–524, 2020 https://doi.org/10.5194/esd-11-509-2020M. Wegmann et al.: Eurasian snow link to NAO 519 reduced variance of the snow index time series with the re- Peings (2019) performed model experiments with nudged duction in correlation strength of snow cover and the winter- November Ural blocking fields, BKS ice and snow anoma- time NAO (Fig. 9). The reduction in variance is even stronger lies. The author found that UB events are not triggered by in ERA20C than in 20CRv2c, which would explain the less reduced sea ice, but in fact lead sea ice decrease. More- stationary correlations in ERA20C. Furthermore, such peri- over, more November snow alone did not lead to an increase ods of low snow variability coincide with a reduction in po- in blocking frequency, nor to a stratospheric warming. The lar vortex variability, hinting even more so at possible links study highlights the UB events as a primary predictor for a between November snow and stratospheric temperatures in negative NAO and the WACC pattern. On the other hand, Luo the following month. Together with the snow cover index, et al. (2019) established a causal chain via a stratospheric the November BKS sea ice index shows increased variabil- pathway from reduced sea ice to a reduced potential vortic- ity with strengthened negative correlation to DJF NAO at the ity gradient and increased blocking events leading to cold end of the 20th century (see Supplement Fig. S11). extremes over Eurasia. We computed the field average of These periods of increased variability in the November the blocking frequency within the domain of Peings (2019) snow cover index co-occur arguably with the common Arctic (10◦ W–80◦ E, 45–80◦ N) and could find a strong correlation warming periods of the 20th century, the ETCAW (Wegmann with the WACC pattern over time, but only for DJF blocking et al., 2016; Hegerl et al., 2018) and the recent ongoing Arctic events (not shown). warming, with peak variance and correlation values centred We found a correlation of November UB events with win- around the years 1920 and 2000. Interestingly, October snow tertime NAO, which, however, is still weaker than the re- cover index and BKS sea ice index variability peaks slightly lationship with the November snow dipole, as well as our after the ETCAW around the year 1945. Analysing tempera- BKS ice index (see Supplement Fig. S10). Moreover, block- ture anomalies (not shown) for all three periods reveals more ings within the domain of Peings (2019) (10◦ W–80◦ E, 45– continental warming over Russia for the period 1911–1930, 80◦ N) are not related to a snow dipole whatsoever, neither in whereas warming between 1936 and 1955 is located very October nor in November (see Supplement Fig. S10). That much on the Kara Sea coast of Russia. Both the October said, we want to highlight the fact that the blocking pattern snow index and the BKS sea ice index are thus impacted emerging in Fig. 5 is mostly outside of the boundaries of by the locally increased near-surface temperatures during the this UB index (10◦ W–80◦ E, 45–80◦ N) and thus might not latter period. Generally, Arctic warming periods appear to in- be caught by our study. Furthermore, Peings (2019) applies crease the variability of cryospheric predictors considerably a very general snow cover increase in his nudging experi- and thus strengthen their value in seasonal prediction frame- ment, rather than a snow dipole with a west-to-east gradient. works. Given the importance of stratospheric variability for Finally, although we focused here on the connection to the seasonal prediction and the apparent relationship between NAO, we did not find strong significant correlations between snow cover variability and stratospheric variability (Fig. 9), autumn snow and winter WACC. As pointed out by Peings it can be expected that the cryosphere–stratosphere pathway (2019), the most important driver for the WACC signal is is also considerably stronger in Arctic warm periods than for the Ural blocking, for which we found strong correlations cold periods. Moreover, in our statistical analysis, we found throughout the 20th century (not shown). no indication of a stratospheric precursor of November snow Overall, we advocate the importance of the signal-to-noise cover anomalies. ratio rather than mean states for the evolution of the Novem- In accordance with the shorter time frame analysis of Sun ber snow to winter NAO relationship. In our statistical anal- et al. (2019), decadal variability of the November snow cover ysis, we did not find any indication of a centennial relation- index seems mostly dominated by low-frequency variability ship between the autumn ENSO or autumn QBO sign and in the AMO and subsequently reduced or increased polar sea the variability of the relationship between November snow ice concentration. This mechanism is also supported by the cover and DJF NAO (not shown). As mentioned above we results of Luo et al. (2017), who highlighted the decadal re- found the strongest influence to be the increased variability lationship between a positive AMO, reduced sea ice and in- of the system due to energy uptake. creased Ural blocking for the second half of the 20th cen- That said, a source of uncertainty is the disagreement be- tury. Looking at this mechanism on an interannual basis, we tween ERA20C and 20CRv2c when it comes to the stationar- showed a robust strengthening of the November snow dipole ity of the relationship. 20CRv2c shows negative correlation with decreasing BKS ice concentration, circulation changes throughout the whole 20th century, whereas ERA20C flips over the BKS region and consequently cold air advection to- the sign of the correlation in the late 1930s and late 1970s. wards the eastern part of the snow dipole region for a pe- The same relationship but using October snow shows high riod of 150 years. With this, our results support recent stud- agreement between the two datasets, and the same is the case ies, which point to the counter-intuitive mechanism of Arctic for the correlations between snow and stratospheric GPH. We warming and increased continental snow cover via sea ice therefore conclude that the information stored in the Novem- reduction and circulation changes (Cohen et al., 2014; Weg- ber snow cover in 20CRv2c is slightly different to the in- mann et al., 2015; Yeo et al., 2016; Gastineau et al., 2017). formation stored in the ERA20C snow depth. Wegmann et https://doi.org/10.5194/esd-11-509-2020 Earth Syst. Dynam., 11, 509–524, 2020
520                                                                           M. Wegmann et al.: Eurasian snow link to NAO

Figure 9. The 21-year running standard deviation time series of (a) October snow index and (b) November snow index in ERA20C and
20CRv2c (snow cover and snow depth). Dashed black line shows running standard deviation of 10 hPa November–December mean GPH
over the polar regions.

al. (2017b) found that Eurasian November snow depth shows             Furthermore, our analysis of centennial time series sup-
much larger disagreement between 20CRv2c and ERA20C                ports studies pointing out the link of autumn snow to strato-
than the same snow depth in October. In the same study, the        spheric circulation as well as the co-occurrence between re-
authors found decadal trends (although linear trend subtrac-       duced BKS ice concentration and increased snow cover in
tion for all predictor time series was done for this study) in     eastern Eurasia. The latter mechanism is triggered via the
ERA20C snow depth, which might impact the running corre-           development of an atmospheric high-pressure anomaly adja-
lations. Finally, since snow depths are relatively low in Octo-    cent to the BKS sea ice anomaly, which transports moisture
ber, differences between using snow cover and snow depth           and cold air along its eastern flank into the continent. The in-
might be less important from an energy transfer point of           terdecadal evolution of the November snow index also points
view.                                                              towards co-dependence with high North Atlantic SSTs and
   The disagreement between ERA20C and 20CRv2c may                 subsequently reduced sea ice.
also be related to uncertainties and inhomogeneities in both          Extending the investigation period from 35 to 110 and up
reanalyses. Many studies showed that both ERA20C and               to 150 years increases the confidence in recently proposed
20CRv2c are not suitable for trend analysis and may include        physical mechanisms behind cryospheric drivers of atmo-
radical shifts in atmospheric circulation, particularly over the   spheric variability and decreases the probability of random
Arctic (e.g. Dell’Aquila et al., 2016; Rohrer et al., 2019).       co-variability between the Arctic cryosphere changes and
However, Rohrer et al. (2019) showed that although trends in       mid-latitude climate.
centennial reanalyses may be spurious, at least in the North-         For future studies regarding seasonal prediction, we em-
ern Hemisphere year-to-year variability of mid-tropospheric        phasize the use of the November snow dipole concerning a
circulation is in agreement even in the early 20th century.        prediction of the winter NAO state. Nevertheless, periods of
                                                                   weak correlation might occur again, especially since it is un-
5   Conclusions                                                    certain how the sea-ice-to-snow relationship will change with
                                                                   stronger anthropogenic global warming, once the Arctic is
Several reconstruction and reanalysis datasets were used to        ice-free in summer or the local warming is strong enough to
examine the link between autumn snow cover, ocean sur-             override the counter-intuitive snow cover increase. Thus, fur-
face conditions and the NAO pattern in winter for the whole        ther studies are needed to investigate the interplay between
20th century and into the 19th century. We found evidence          Arctic sea ice and continental snow distribution. Future ex-
for a manifestation of a negative NAO signal after Novem-          periments should take into account year-to-year variability
ber with a strong west-to-east snow cover gradient, with this      and realistic distribution of snow cover if links to the strato-
relationship being significant for the last 150 years. Inter-      sphere are to be examined.
decadal variability for this relationship seems to be linked
to Arctic warm periods, which increase the variability of the
cryospheric predictors considerably. As a result, increased        Data availability. The MERRA2 reanalysis data are pub-
variability in the predictors helps to generate a better sea-      licly available at the NASA EARTHDATA repository
                                                                   (https://disc.gsfc.nasa.gov/datasets?keywords="MERRA-2"&
sonal prediction estimation.
                                                                   page=1&source=Models%2FAnalysesMERRA-2, National Aero-

Earth Syst. Dynam., 11, 509–524, 2020                                                 https://doi.org/10.5194/esd-11-509-2020
M. Wegmann et al.: Eurasian snow link to NAO 521
nautics and Space Administration, 2017). The ERA20C reanalysis Review statement. This paper was edited by Gabriele Messori
data are publicly available at the ECMWF data repository (https: and reviewed by three anonymous referees.
//apps.ecmwf.int/datasets/data/era20c-moda/levtype=sfc/type=an/,
European Centre for Medium-Range Weather Forecast, 2016). The
20CRv2c reanalysis data are publicly available at the NOAA Earth References
System Research Laboratory repository (https://www.esrl.noaa.
gov/psd/data/gridded/data.20thC_ReanV2c.html, National Oceanic Allan, R. and Ansell, T.: A New Globally Complete Monthly His-
and Atmospheric Administration, 2015). The blocking algorithm torical Gridded Mean Sea Level Pressure Dataset (HadSLP2):
is publicly available at https://github.com/marco-rohrer/TM2D 1850–2004, J. Climate, 19, 5816–5842, 2006.
(Rohrer, 2018). The AMO reconstruction data are a pub- Athanasiadis, P. J., Bellucci, A., Scaife, A. A., Hermanson, L., Ma-
licly available at the NOAA Earth System Research Labo- teria, S., Sanna, A., Borrelli, A., MacLachlan, C., and Gualdi, S.:
ratory (https://www.esrl.noaa.gov/psd/data/timeseries/AMO/, A multisystem view of wintertime NAO seasonal predictions, J.
National Oceanic and Atmospheric Administration, 2001). Climate, 30, 1461–1475, 2017.
The Niño 3.4 reconstruction is publicly available at the Blackport, R. and Screen, J. A.: Influence of Arctic Sea Ice Loss in
GCOS Working Group on Surface Pressure repository Autumn Compared to That in Winter on the Atmospheric Circu-
(https://www.esrl.noaa.gov/psd/gcos_wgsp/Timeseries/Nino34/, lation, Geophys. Res. Lett., 46, 2213–2221, 2019.
National Oceanic and Atmospheric Administration, 2003). The Blackport, R., Screen, J. A., van der Weil, K., and Bintanja, R.:
NAO reconstruction is publicly available at the Climate Research Minimal influence of reduced Arctic sea ice on coincident cold
Unit repository (https://crudata.uea.ac.uk/cru/data/nao/, Climate winters in mid-latitudes, Nat. Clim. Change, 9, 697–704, 2019.
Research Unit, 1997). The Walsh et al. (2017) sea ice concentration Boland, E. J., Bracegirdle, T. J., and Shuckburgh, E. F.: Assessment
reconstruction is publicly available at the National Snow and Ice of sea ice-atmosphere links in CMIP5 models, Clim. Dyn., 49,
Data Center repository (https://nsidc.org/data/g10010, National 683–702, 2017.
Snow & Ice Data Center, 2017). Climate Research Unit: North Atlantic Oscillation Index, available
at: https://crudata.uea.ac.uk/cru/data/nao/ (last access: 5 May
2020), 1997.
Supplement. The supplement related to this article is available Cohen, J.: An observational analysis: Tropical relative to Arctic in-
online at: https://doi.org/10.5194/esd-11-509-2020-supplement. fluence on midlatitude weather in the era of Arctic amplifica-
tion, Geophys. Res. Lett., 43, 5287–5294, 2016.
Cohen, J. and Entekhabi, D.: Eurasian snow cover variability
and Northern Hemisphere climate predictability, Geophys. Res.
Author contributions. MW devised the study, the main concep-
Lett., 26, 345–348, 1999.
tual ideas and the proof outline. MR assisted with data availability
Cohen, J., Barlow, M., Kushner, P. J., and Saito, K.: Stratosphere–
and performed the blocking algorithm. MW wrote the paper in con-
troposphere coupling and links with Eurasian land surface vari-
sultation with MSO and GL, who aided in interpreting the results.
ability, J. Climate, 20, 5335–5343, 2007.
Cohen, J., Screen, J. A., Furtado, J. C., Barlow, M., Whittleston, D.,
Coumou, D., Francis, J., Dethloff, K., Entekhabi, D., Overland,
Competing interests. The authors declare that they have no con- J., and Jones, J.: Recent Arctic amplification and extreme mid-
flict of interest. latitude weather, Nat. Geosci., 7, 627–637, 2014.
Cohen, J., Pfeiffer, K., and Francis, J. A.: Warm Arctic episodes
linked with increased frequency of extreme winter weather in the
Acknowledgements. The Twentieth Century Reanalysis Project United States, Nat. Commun., 9, 1–12, 2018.
datasets are supported by the U.S. Department of Energy, Office Cohen, J., Zhang, X., Francis, J., Jung, T., Kwok, R., Overland,
of Science Innovative and Novel Computational Impact on Theory J., Ballinger, T., Bhatt, U., Chen, H., Coumou, D., Feldstein,
and Experiment (DOE INCITE) programme and the Office of Bi- S., Gu, H., Handorf, D., Henderson, G., Ionita, M., Kretschmer,
ological and Environmental Research (BER), and by the National M., Laliberte, F., Lee, S., Linderholm, H. W., Maslowski W., Pe-
Oceanic and Atmospheric Administration Climate Program Office. ings, Y., Pfeiffer, K., Rigor, I., Semmler, T., Stroeve, J., Taylor,
The ECMWF 20th Century Reanalyses and model simulations are P. C., Vavrus, S., Vihma, T., Wang, S., Wendisch, M., Wu, Y.,
supported by the EU FP7 project ERA-CLIM2. We thank Morgan and Yoon: J.: Divergent consensuses on Arctic amplification in-
Gray for editorial support. fluence on midlatitude severe winter weather, Nat. Clim. Chang.,
10, 20–29, 2020.
Collow, T. W., Wang, W., Kumar, A., and Zhang, J.: How well can
Financial support. This research has been supported by Swiss the observed Arctic sea ice summer retreat and winter advance
National Science Foundation (grant no. 143219). be represented in the NCEP Climate Forecast System version
2?, Clim. Dyn., 49, 1651–1663, 2017.
The article processing charges for this open-access Cram, T. A., Compo, G. P., Yin, X., Allan, R. J., McColl, C., Vose,
publication were covered by a Research R. S., Whitaker, J. S., Matsui, N., Ashcroft, L., Auchmann, R.,
Centre of the Helmholtz Association. and Bessemoulin, P.: The international surface pressure databank
version 2, Geosci. Data J., 2, 31–46, 2015.
Crasemann, B., Handorf, D., Jaiser, R., Dethloff, K., Nakamura, T.,
Ukita, J., and Yamazaki, K.: Can preferred atmospheric circula-
https://doi.org/10.5194/esd-11-509-2020 Earth Syst. Dynam., 11, 509–524, 2020522 M. Wegmann et al.: Eurasian snow link to NAO tion patterns over the North-Atlantic-Eurasian region be associ- atmospheric winter teleconnections, Geophysi. Res. Lett., 42, ated with arctic sea ice loss?, Polar Sci., 14, 9–20, 2017. 2367–2377, 2015. Dell’Aquila, A., Corti, S., Weisheimer, A., Hersbach, H., Peubey, Hegerl, G. C., Brönnimann, S., Schurer, A., and Cowan, T.: The C., Poli, P., Berrisford, P., Dee, D., and Simmons, A.: Bench- early 20th century warming: anomalies, causes, and conse- marking Northern Hemisphere midlatitude atmospheric synop- quences, Wiley Interdiscip. Rev. Clim.. Sci., 9, e522, 2018. tic variability in centennial reanalysis and numerical simula- Henderson, G. R., Peings, Y., Furtado, J. C., and Kushner, P. J.: tions, Geophys. Res. Lett., 43, 5442–5449, 2016. Snow–atmosphere coupling in the Northern Hemisphere, Nat. Deser, C., Hurrell, J. W., and Phillips, A. S.: The role of the North Clim. Change, 8, 954–963, 2018. Atlantic Oscillation in European climate projections, Clim. Honda, M., Inoue, J., and Yamane, S. : Influence of low Arctic Dyn., 49, 3141–3157, 2017. sea-ice minima on anomalously cold Eurasian winters, Geophys. Douville, H., Peings, Y., and Saint-Martin, D.: Snow-(N) AO re- Res. Lett., 36, L08707, https://doi.org/10.1029/2008GL037079, lationship revisited over the whole twentieth century, Geophys. 2009. Res. Lett., 44, 569–577, 2017. Hoshi, K., Ukita, J., Honda, M., Nakamura, T., Yamazaki, K., Dunstone, N., Smith, D., Scaife, A., Hermanson, L., Eade, R., Miyoshi, Y., and Jaiser, R.: Weak Stratospheric Polar Vortex Robinson, N., Andrews, M., and Knight, J.: Skilful predictions Events Modulated by the Arctic Sea-Ice Loss, J. Geophys. Res.- of the winter North Atlantic Oscillation one year ahead, Nat. Atmos., 124, 858–869, 2019. Geosci., 9, 809–814, 2016. Hurrell, J. W. and Deser, C.: North Atlantic climate variability: the Enfield, D. B., Mestas-Nuñez, A. M., and Trimble, P. J.: The At- role of the North Atlantic Oscillation, J. Marine Syst., 79, 231– lantic multidecadal oscillation and its relation to rainfall and river 244, 2010. flows in the continental US, Geophys. Res. Lett., 28, 2077–2080, Inoue, J., Hori, M. E., and Takaya, K: The role of Barents Sea ice 2001. in the wintertime cyclone track and emergence of a warm-Arctic European Centre for Medium-Range Weather Forecast: Atmo- cold-Siberian anomaly, J. Climate, 25, 2561–2568, 2012. spheric Reanalysis of the 20th Century, available at: https://apps. Jones, P. D., Jonsson, T., and Wheeler, D.: Extension to the North ecmwf.int/datasets/data/era20c-moda/levtype=sfc/type=an/ (last Atlantic Oscillation using early instrumental pressure observa- access: 5 May 2020), 2016. tions from Gibraltar and south-west Iceland, Int. J. Climatol., 17, Francis, J. A.: Why are Arctic linkages to extreme weather still up 1433–1450, 1997. in the air?, B. Am. Meteorol. Soc., 98, 2551–2557, 2017. Jung, T., Vitart, F., Ferranti, L., and Morcrette, J. J.: Ori- Furtado, J. C., Cohen, J. L., Butler, A. H., Riddle, E. E., and Kumar, gin and predictability of the extreme negative NAO A.: Eurasian snow cover variability and links to winter climate in winter of 2009/10, Geophys. Res. Lett., 38, L07701, the CMIP5 models, Clim. Dyn., 45, 2591–2605, 2015. https://doi.org/10.1029/2011GL046786, 2011. Furtado, J. C., Cohen, J. L., and Tziperman, E.: The combined in- Kang, D., Lee, M. I., Im, J., Kim, D., Kim, H. M., Kang, H. S., fluences of autumnal snow and sea ice on Northern Hemisphere Schubert, S. D., Arribas, A., and MacLachlan, C.: Prediction of winters, Geophys. Res. Lett., 43, 3478–3485, 2016. the Arctic Oscillation in boreal winter by dynamical seasonal García-Serrano, J., Frankignoul, C., Gastineau, G., and De La Cà- forecasting systems, Geophys. Res. Lett., 41, 3577–3585, 2014. mara, A.: On the predictability of the winter Euro-Atlantic cli- Kelleher, M. and Screen, J.: Atmospheric precursors of and re- mate: lagged influence of autumn Arctic sea ice, J. Climate., 28, sponse to anomalous Arctic sea ice in CMIP5 models, Adv. At- 5195–5216, 2015. mos. Sci., 35, 27–37, 2018. Gastineau, G., García-Serrano, J., and Frankignoul, C.: The influ- King, M. P., Hell, M., and Keenlyside, N.: Investigation of the at- ence of autumnal Eurasian snow cover on climate and its link mospheric mechanisms related to the autumn sea ice and win- with Arctic sea ice cover, J. Climate, 30, 7599–7619, 2017. ter circulation link in the Northern Hemisphere, Clim. Dyn., 46, Gelaro, R., McCarty, W., Suárez, M. J., Todling, R., Molod, A., 1185–1195, 2016. Takacs, L., Randles, C. A., Darmenov, A., Bosilovich, M. G., Re- Kolstad, E. W. and Screen, J. A.: Non-Stationary Relationship be- ichle, R., Wargan, K., Coy, L., Cullather, R., Draper, C., Akella, tween Autumn Arctic Sea Ice and the Winter North Atlantic Os- S., Buchard, V., Conaty, A., da Silva, A. M., Gu, W., Kim, G.- cillation, Geophys. Res. Lett., 46, 7583–7591, 2019. K., Koster, R., Lucchesi, R., Merkova, D., Nielsen, J. E., Par- Kretschmer, M., Coumou, D., Agel, L., Barlow, M., Tziperman, E., tyka, G., Pawson, S., Putman, W., Rienecker, M., Schubert, S. and Cohen, J.: More-persistent weak stratospheric polar vortex D., Sienkiewicz, M., and Zhao, B.: The modern-era retrospective states linked to cold extremes, B. Am. Meteorol. Soc., 99, 49– analysis for research and applications, version 2 (MERRA-2), J. 60, 2018. Climate, 30, 5419–5454, 2017. Laloyaux, P., de Boisseson, E., Balmaseda, M., Bidlot, J. R., Broen- Ghatak, D., Frei, A., Gong, G., Stroeve, J., and Robinson, D.: nimann, S., Buizza, R., Dalhgren, P., Dee, D., Haimberger, L., On the emergence of an Arctic amplification signal in terres- Hersbach, H., Kosaka, Y., Martin, M., Poli, P., Rayner, N., Ruste- trial Arctic snow extent, J. Geophysi. Res.-Atmos., 115, D24105, meier, E., and Schepers, D.: CERA-20C: A coupled reanalysis https://doi.org/10.1029/2010JD014007, 2010. of the Twentieth Century, J. Adv. Model. Earth Syst., 10, 1172– Han, S. and Sun, J.: Impacts of Autumnal Eurasian Snow Cover 1195, 2018. on Predominant Modes of Boreal Winter Surface Air Tempera- Luo, D., Chen, Y., Dai, A., Mu, M., Zhang, R., and ture Over Eurasia, J. Geophys. Res.-Atmos., 123, 10079–10091, Ian, S.: Winter Eurasian cooling linked with the Atlantic 2018. multidecadal oscillation, Environ. Res. Lett., 12, 125002, Handorf, D., Jaiser, R., Dethloff, K., Rinke, A., and Cohen, J.: Im- https://doi.org/10.1088/1748-9326/aa8de8, 2017. pacts of Arctic sea ice and continental snow cover changes on Earth Syst. Dynam., 11, 509–524, 2020 https://doi.org/10.5194/esd-11-509-2020
You can also read