Using movement, diet, and genetic analyses to understand Arctic charr responses to ecosystem change
←
→
Page content transcription
If your browser does not render page correctly, please read the page content below
Vol. 673: 135–149, 2021               MARINE ECOLOGY PROGRESS SERIES
                                                                                                Published September 2
https://doi.org/10.3354/meps13775                 Mar Ecol Prog Ser

                                                                                                  OPEN
                                                                                                  ACCESS

         Using movement, diet, and genetic analyses
          to understand Arctic charr responses to
                     ecosystem change
D. Cote1,*, J. B. Dempson1, M. Piersiak1, K. Layton2, S. Roul1, R. Laing3, J. Angnatok4,
                                     I. Bradbury1
           1
               Northwest Atlantic Fisheries Centre, Fisheries and Oceans Canada, St. John’s, NL A1C 5X1, Canada
                      2
                       School of Biological Sciences, University of Aberdeen, Aberdeen AB24 2TZ, UK
                                     3
                                       Nunatsiavut Government, Nain, NL A0P 1L0, Canada
                                         4
                                           Putjotik Fisheries, Nain, NL A0P 1L0, Canada

      ABSTRACT: Arctic charr Salvelinus alpinus are a commercially and culturally valued species for
      northern Indigenous peoples. Climate shifts could have important implications for charr and those
      that rely on them, but studies that evaluate responses to ecosystem change and the spatial scales
      at which they occur are rare. We compare marine-phase habitat use, long-term diet patterns, and
      trends in effective population size of Arctic charr from 2 areas (Nain and Saglek) of Nunatsiavut,
      Labrador, Canada. Tagged charr in both areas frequently occupied estuaries but some also used
      other habitats that extended to the headland environments outside of their natal fjords. Despite
      the relatively small distances separating these study areas (< 200 km), we observed differences in
      habitat use and diet. Northern stocks (including Saglek) were more reliant on invertebrates than
      southern stocks (e.g. Nain), for which capelin and sand lance were important prey. The use of
      coastal headlands also varied, with Saglek charr occupying these environments more frequently
      than those from Nain, which only used these habitats in 1 year of the study. Long-term commercial
      catches also indicate that the tendency for Nain charr to stay within fjords varies annually and
      relates to capelin availability. Despite the demonstrated capacity to alter diet and habitat use to
      changing environmental conditions, notable declines in effective population size were associated
      with the regime shift of the 1990s in the northwest Atlantic. Collectively, these results demonstrate
      that behavioral plasticity of Arctic charr may be insufficient to deal with the large environmental
      perturbations expected to arise from a changing climate.

      KEY WORDS: Diet · Telemetry · Effective population size · Long-term monitoring · Labrador ·
      Nunatsiavut

                   1. INTRODUCTION                               ern extents of their range, anadromy is a common life
                                                                 history trait (Klemetsen et al. 2003) that allows charr
  Arctic charr Salvelinus alpinus are an iconic Arctic           to quickly increase somatic reserves in productive
species native to a wide latitudinal gradient (Johnson           coastal environments before returning to freshwater
1980) that extends from the Arctic to north temperate            to reproduce and overwinter (Klemetsen et al. 2003).
regions (Reist et al. 2013). Across this range, this               Behavioral plasticity is also common within anadro-
species exhibits a variety of adaptations (Dallaire et           mous populations of charr. At sea, for example, charr
al. 2021) including remarkable phenotypic diversity              occupy habitats that range from sheltered estuaries
within both freshwater resident and anadromous life              to coastal headlands, show variation in marine resi-
histories (Klemetsen et al. 2003). In all but the south-         dency times (Dempson & Kristofferson 1987, Gulseth
                                                                 © The authors and Fisheries and Oceans Canada 2021. Open
*Corresponding author: dave.j.cote@gmail.com                     Access under Creative Commons by Attribution Licence. Use,
                                                                 distribution and reproduction are unrestricted. Authors and
                                                                 original publication must be credited.
                                                                 Publisher: Inter-Research · www.int-res.com
136 Mar Ecol Prog Ser 673: 135–149, 2021 & Nilssen 2000, Klemetsen et al. 2003, Spares et al. our understanding of the capacity of fauna to accom- 2015, Moore et al. 2016, Harris et al. 2020), occupy a modate ecological change. For example, a regime variety of thermal habitats (Rikardsen et al. 2007a, shift coinciding with unusually cold ocean tempera- Spares et al. 2012, Harris et al. 2020, Mulder et al. tures and lower productivity occurred in the north- 2020), and consume diverse prey often dominated by west Atlantic in the 1990s (Pedersen et al. 2017). This pelagic fish and plankton (e.g. amphipods), but also time period was also associated with changes in spe- items such as insects and benthic organisms (Demp- cies distributions and abundance (Colbourne 2004, son et al. 2002, Klemetsen et al. 2003, Rikardsen et Rose 2005a, Carscadden et al. 2013), as well as the al. 2007b, Spares et al. 2012, Davidsen et al. 2020). decline of many important commercial fishery popu- Despite this plasticity, marine habitat use within popu- lations (Bundy et al. 2009, Mills et al. 2013, Pedersen lations can remain stable across years, even during et al. 2017). During this period the abundance of changing environmental conditions (Harris et al. 2020). capelin Mallotus villosus declined in coastal areas of While researchers have documented phenotypic Newfoundland and Labrador (Buren et al. 2019), variation over wide geographic scales, less is known affecting the diets of a variety of fish, bird, and mar- about how behavioral variation and plasticity are ine mammal species (Taggart et al. 1994, Lawson & manifested over extended temporal and smaller spa- Stenson 1995, Montevecchi & Myers 1997, Bryant et tial scales (but see Dempson & Kristofferson 1987, al. 1999, Rowe et al. 2000, Dempson et al. 2002) in- Dempson et al. 2002, Davidsen et al. 2020), particu- cluding Arctic charr (Dempson et al. 2002). As cli- larly across latitudinal gradients over which climate mate change progresses, other broad redistributions responses are likely to occur in the near future. Such of species (Perry et al. 2005, Rose 2005b) and produc- information is important to detect and interpret the tivity are expected (Moore et al. 2018), which could responses of Arctic charr to the rapidly changing have important repercussions on species like Arctic Arctic (Reist et al. 2006, Power et al. 2012, Dallaire et charr. al. 2021, Layton et al. 2021). In this study, we (1) apply acoustic telemetry data The challenges to understanding variability and to evaluate spatial differences in marine habitat use plasticity in Arctic charr behavior are two-fold: (1) by Arctic charr from 2 regions of northern Labrador there is a scarcity of data sets of appropriate spatial (Saglek Fjord and Nain Bay); (2) evaluate if observed and temporal scales and (2) there is a lack of data patterns in habitat use are stable over time as associating behavior with biotic environmental vari- inferred by historical diet and catch data from Nain ables such as prey availability. Though considerable Bay; and (3) use existing hindcasted indices of effec- research is available on the marine movements of tive population size to assess whether population- Arctic charr (e.g. Bégout Anras et al. 1999, Spares et specific responses in diet and habitat use were suffi- al. 2015, Moore et al. 2016, Harris et al. 2020), it is dif- cient to safeguard Nain Bay populations during times ficult to sustain these projects over extended tempo- of strong environmental change. ral periods across a latitudinal gradient while concur- rently monitoring biotic/abiotic variables of interest. One area where extensive behavioral data exist is in 2. MATERIALS AND METHODS Nunatsiavut, northern Labrador, Canada, where con- ventional mark-recapture tagging studies have been 2.1. Study area conducted over several decades and supported by diet and morphometric studies (Dempson & Kristof- Our study was conducted in the coastal waters of ferson 1987, Power et al. 2000, Dempson et al. 2002, the Nunatsiavut region of Labrador, Canada, a land 2008). These studies provide a baseline that, when claim area established for the Labrador Inuit. The coupled with contemporary telemetry and genomic orientation of the northern Labrador coastline lends methods, can be used to explore spatial and temporal itself well to studying potential climate change re- variation in Arctic charr marine movement behavior sponses, since conditions in southern areas may fore- and links to marine-phase diets. shadow expected changes further north and there- Evaluating threats to southern sub-Arctic anadro- fore help to predict future effects of climate change mous populations from further climate shifts and pre- (Layton et al. 2021). The coastal waters of this area dicting changes to more northerly populations will extend 20 km offshore and encompass 48 690 km2. depend on understanding the adaptability of local Labrador Inuit are a critical part of this ecosystem, populations and their capacity to deal with ecosys- relying on species such as Arctic charr for subsis- tem shifts. Past environmental disruptions can inform tence and economic opportunities.
Cote et al.: Arctic charr responses to ecosystem change 137
2.2. Acoustic telemetry We used an array of Vemco acoustic receivers
(VR2W and VR2ARs, Innovasea) to monitor the
Movements of Arctic charr were followed in 2 coastal marine movements of Arctic charr from the summer
regions of Nunatsiavut separated by approximately of 2018 to autumn of 2019. Receivers were posi-
200 km (Fig. 1). Saglek Fjord is 65 km in length, 14 km tioned to monitor habitat use and the timing of
at its widest point, and is bathymetrically character- migration events to and from the marine environ-
ized by 7 underwater basins (80 to 256 m) separated ment of tagged animals through the course of their
by sills (Brown et al. 2012, Simo-Matchim et al. 2017). marine residency period. Consequently, we placed
The second region, hereafter referred to as Nain, is receivers in river estuaries, gateways within, and at
occupied by charr of the Nain stock complex (Demp- the seaward extent of fjords to track exits to the
son et al. 2002; our Fig. 1), and is more geographically coastal headlands. The more complex nature and
complex due to the presence of islands that extend variety of migratory pathways off Nain required
outside of Anaktalak Bay, Nain Bay, Tikkoatokak more receivers for coverage. In total, we deployed
Bay, and Webb Bay. The Nain region is approximately 43 receivers between our 2 study sites: 25 were
50 km wide with maximum depths reaching at least deployed off Nain and 18 in Saglek Fjord (Fig. 1).
110 m (Nutt 1953), though its bathymetry remains Of the 43 receivers deployed, 23 (15 in Nain and 8
largely unmapped. Sea ice is common to both regions, in Saglek) were VR2-ARs that were recovered with
occurring typically from November to mid-June or acoustic releases. The remaining receivers were
early July (McCarney et al. in press). VR2Ws and recovered with ground lines.
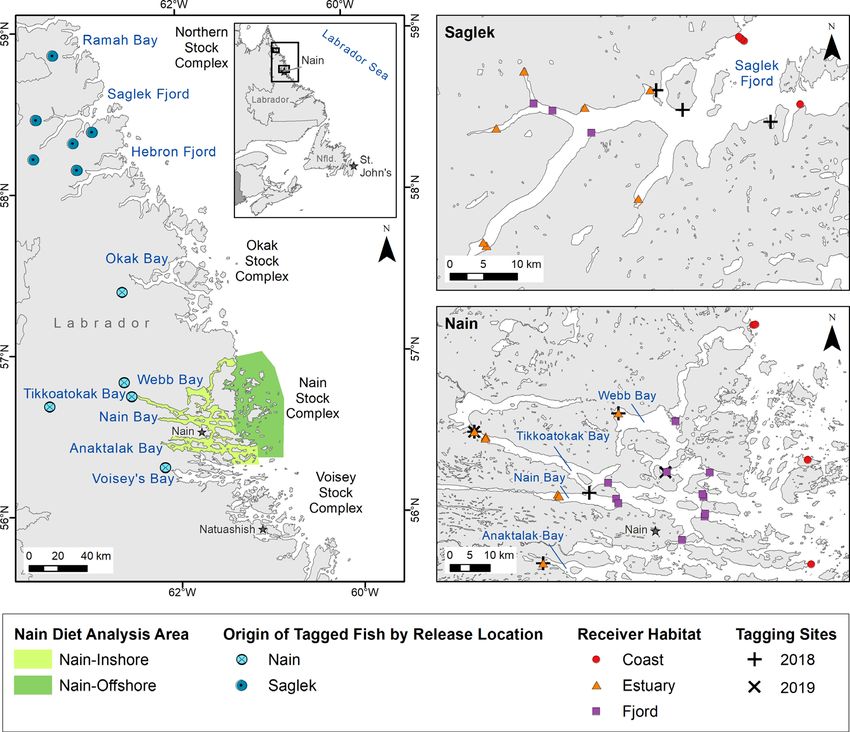
Fig. 1. Stock complexes of Arctic charr in northern Labrador, Canada as defined by Dempson & Kristofferson (1987). Ramah
Bay, Saglek Fjord, and Hebron Fjord comprise the areas of the northern stock. River origin of fish tagged in marine environ-
ments of Nain and Saglek are shown at the point where rivers empty/drain into the ocean. One fish tagged in Nain originated
from the Okak stock complex. Right panels indicate receiver locations and tagging areas within the 2 study systems (Saglek
Fjord and Nain). Different habitat types are denoted by receiver color and shape138 Mar Ecol Prog Ser 673: 135–149, 2021
We tagged charr in 2018 in Saglek Fjord (July 25− son 2019), as described by Layton et al. (2020). Only
26, 2018) at Torr Bay, Branagin Island, and Jens assignments with a probability of >0.80 were reported.
Haven Island, and in Nain (August 2−4, 2018) at Previous work suggests assignment accuracy using
Webb Bay, Tikkoatokak Bay, Nain Bay, and Anakta- these loci and baseline is approximately 90%.
lak Bay (Fig. 1, see Table S1 in the Supplement at
www.int-res.com/articles/suppl/m673p135_supp.pdf).
We also tagged charr in Nain in Webb Bay (July 31) 2.4. Diet analysis
and Tikkoatokak Bay (August 1) in 2019. Fish were
collected using either barbless, single hook fishing We examined temporal and spatial variation in
lines or 4½ inch (11.5 cm) gillnets. Tagged fish in charr diet using long-term monitoring data collected
Saglek ranged from 45.7 to 64.0 cm (mean 53.7 cm), from 5680 individuals harvested in the northern
whereas those from Nain ranged from 41.5 to 63.5 cm Labrador charr fishery (1982−2008). This dataset was
(mean 50.4 cm) (Table S1). Based on fish length, we a temporally extended version of that explored by
estimated ages to range from to 7 to 14 yr (Dempson Dempson (1995) and Dempson et al. (2002) and was
et al. 2008). Once captured, we measured length, reanalyzed within a multivariate framework to focus
and took a small clip of tissue (~1 cm2) from the cau- on prey community differences among stock com-
dal fin to genetically assign a subset of fish to their plexes and fishing areas (Fig. 1). Samples were col-
natal river (see Section 2.3). Prior to release, tagged lected in all 27 years from inshore areas of Nain
charr were allowed to recover in a plastic tub equipped (1982−2008) but only subsets of years were collected
with air pumps and flowing sea water. In total, 95 fish for other stocks, which ranged from 6 (Okak) to 22
(40 in Saglek, 44 in Nain in 2018, and 11 in Nain in (offshore Nain) years of data (Table S2).
2019) had uniquely coded Vemco V13 (36 [length] × Prey from charr stomachs were identified accord-
13 mm [diam.], 9.2 g in air, tag life: 602 d) or V13T (46 ing to fish and invertebrate taxa and categorized by
× 13 mm, 9.7 g in water, tag life: 498 d) transmitters sur- abundance and biomass metrics as described in Demp-
gically implanted in their abdominal cavities. Trans- son et al. (2002). Additionally, for the years 1988−
mitters emitted pulses at random intervals between 2008, quartiles of stomach fullness (i.e. 0 = empty and
60 and 120 s to minimize signal collisions that might 4 = full) were recorded for each fish and converted to
occur if multiple tags were in close proximity. percent fullness. To reduce autocorrelation of sam-
We filtered our data of suspected mortality or tag- ples, we averaged stomach content biomass by sam-
shedding events (i.e. removing individuals that consis- pling day and charr fishing area (Fig. 1). We used the
tently remained in the vicinity of a receiver beyond Bray-Curtis Index (Bray & Curtis 1957) to analyze
normal migration periods), grouping the remaining community similarity and dissimilarity in biomass.
data into individual detection events at specific re- We identified prey taxa that typified (i.e. contributed
ceivers using the R package GLATOS (https://gitlab. most to within-group similarity values) stocks and
oceantrack.org/GreatLakes/glatos). Occupancy was months, and discriminated (i.e. contributed most to
measured in 3 different habitat types using detec- dissimilarity values) among groups using SIMPER
tions on receivers located in estuarine (immediate (PRIMER 7). Differences in prey communities across
proximity of a freshwater input), fjord, and coastal stocks, years, and months were evaluated through
(headlands outside of fjords) habitats (Fig. 1). PERMANOVA (PERMANOVA+1.0.3; 9999 permuta-
tions), a permutation-based multivariate analog of
ANOVA (Anderson 2001). Since the full model had a
2.3. Genetic assignment to river of origin significant interaction between year and month, we
analyzed 3 more simple models: (1) a model applied
Populations of Arctic charr on the Labrador Coast to the entire diet dataset with fixed terms for stock
mix in the marine environment (Dempson & Kristof- and month, and a stock × month interaction; (2) for
ferson 1987, Layton et al. 2020). We used tissue sam- Saglek data, a model with fixed terms for year, month,
ples from 72 of the 84 fish tagged in 2018 (40 in and a year × month interaction term; and (3) for Nain,
Saglek and 32 in Nain; Table S1) to extract DNA and a model that included the capture area (Inshore/Off-
genotype 111 genome-wide microsatellite loci fol- shore) along with month, year, and all interaction
lowing Layton et al. (2020). Individual fish were terms. We presented these data using multi-dimen-
assigned to river or region of origin (reporting group) sional scaling (MDS) of centroids. Centroids (repre-
using a Bayesian mixed stock fishery analysis in the sentations of multivariate central tendency) were
R package rubias (Anderson 2017, Moran & Ander- derived from Principal Coordinates Analysis (PCO)Cote et al.: Arctic charr responses to ecosystem change 139
(Gower 1966) and used to simplify visual representa- analyses indicated that the fish tagged in Saglek
tions of biomass data. We also evaluated the consis- Fjord originated from within Saglek (Southwest Arm
tency of interannual seriation in diets from charr River [n = 13], Kiyuktok Brook [n = 7], Pangertok
caught in inshore and offshore areas of Nain by com- Brook [n = 1], Ugjuktok River [n = 2]), or neighboring
paring stock-specific annual centroid similarity matri- waterbodies within 50 km such as Hebron Fjord
ces using a permutation test of Spearman’s rank cor- (Ikarut River [n = 11]) and Ramah Bay (Stecker River
relation coefficients (RELATE algorithm in PRIMER [n = 2]) (Fig. 1). Fish tagged in the Nain stock com-
version 7; 999 permutations). plex originated from Nain Bay (Fraser River [n = 1],
We further examined temporal data of stomach Kamanatsuk Brook [n = 7], Kingurutik River [n = 8]),
fullness for Nain charr to evaluate whether food southern Anaktalak Bay (Ikadlavik Brook [n = 7]),
availability explained patterns in marine migration to and Webb Bay (Ikinet Brook [n = 1]) (Fig. 1). Tagged
offshore areas. Stomach fullness patterns across years fish from Saglek (mean length 53.7 cm) were signifi-
for July and August for inshore and offshore stocks cantly longer (t = 3.22, p = 0.002) than those from
were visualized with Generalized Additive Models Nain (mean length 50.4 cm).
(shrinkage cubic regression spline, mgcv package
v.1.8-31, Wood 2019) in R (v.3.6.3, R Core Team
2020). We also applied a linear model to evaluate if 3.2. Movement
there was a negative relationship between stomach
fullness of the inshore stock and the proportion of We acquired telemetry data for 75 charr: 29 from
charr captured offshore in Nain’s commercial fishery. Saglek and 46 from Nain (38 tagged in 2018 and 8
Such a relationship would provide support for the tagged in 2019). From our initial group of tagged fish,
hypothesis that Nain area charr are more likely to we were unable to detect 19 after tagging occurred,
undertake more extensive marine migrations in years and assumed they left our array, had a malfunction-
where food availability was low in inshore areas. ing transmitter or died beyond detection of our re-
ceivers. We excluded an additional individual due to
suspected mortality or tag shedding (e.g. Lacroix et
2.5. Effective population size al. 2004). Data for this fish consisted of a continuous
string of detections on 1 receiver extending from
We evaluated responses of charr populations to roughly the date of tagging through winter months
shifts in diet using effective population size (Ne) data and no detections on other receivers in the subse-
derived from Layton et al. (2021). Briefly, Layton et quent year. Among the remaining fish, 1 individual
al. (2021) used LinkNe (Hollenbeck et al. 2016), a appeared to die or shed a tag after previous, distinct
method that combines estimates of recombination movements and therefore post-mortality data for
rate with linkage disequilibrium, to estimate Ne from this fish were also excluded. Three other individuals
1900−2013 with 968 single nucleotide polymorph- were detected only once (all in estuaries), which was
isms (SNPs) from an 87k SNP array (Nugent et al. insufficient to make a detection event within the
2019) that had corresponding linkage map informa- GLATOS package and thus they were also excluded
tion (Nugent et al. 2017). LinkNe was run with bins of from further analysis.
0.05 Morgans and including only SNPs with minor We last detected the majority of tagged charr in
allele frequency exceeding 0.05. We binned esti- both Saglek (23 of 29) and Nain (24 of 44) in 2018 in
mates by generation, and approximate years were estuaries of the study area. It was assumed that the re-
calculated assuming a generation time of 4 yr. Here, mainder overwintered in rivers outside the respective
we extracted Ne data for 8 populations from the Nain study areas. Moreover, we only detected a subset of
region from 1990−2013. the fish tagged in 2018 (45%, n = 13 in Saglek and
34%, n = 15 in Nain) the following year. Migration
timing into freshwater in 2018 (t29 = 1.55, p = 0.131)
3. RESULTS and to the ocean in 2019 (t12 = −0.58, p = 0.58) did not
differ across study locations. The mean date of migra-
3.1. Genetic assignments of tagged fish tion into rivers was August 9 for Nain fish and August
16 for Saglek fish. Mean dates of migration back to
Bayesian mixed stock fishery analysis assigned 72 the marine environment were June 6 and June 4 for
tagged fish to a river but only 55 (75%) surpassed the Nain and Saglek respectively (Fig. 2A). We did not de-
80% assignment certainty threshold (Table S1). These tect tagged individuals in more than 1 study region.140 Mar Ecol Prog Ser 673: 135–149, 2021
A Habitat Coast Estuary Fjord
2018 2019
Nain
Fish
Saglek
Oct 01
Jul 30
Jun 03
Jun 10
Jun 17
Jun 24
May 20
May 27
Jul 01
Jul 08
Jul 15
Jul 22
Jul 29
Aug 06
Aug 13
Aug 20
Aug 27
Sep 03
Sep 10
Sep 17
Sep 24
Aug 05
Aug 12
Aug 19
Aug 26
Sep 02
Sep 09
B Location Nain Saglek
May June July
60
40
20
% of tagged fish
0
August September October
60
40
20
0
Estuary Fjord Coast Estuary Fjord Coast Estuary Fjord Coast
Habitat
Fig. 2. (A) Detections (D) of Arctic charr in different habitats (estuary, fjord, and coast) across 2018 (left panel) and 2019 (right
panel) in Nain and Saglek. Rows of detections represent multiple records of individual fish. (B) Number of Arctic charr de-
tected by receivers in estuarine, fjord and coastal habitats by month during 2018 and 2019 in waters off Nain (n = 45) and
Saglek (n = 27)Cote et al.: Arctic charr responses to ecosystem change 141
Seventy-two individuals generated marine habitat 3.3. Diet and changes to effective population size
occupancy information over the 2018 and 2019 mon-
itoring period. We recorded 345 occupancy events Charr diets along the north coast of Labrador re-
for 27 fish in Saglek, and 232 events from 45 fish in vealed considerable variation at spatial scales within
Nain (37 tagged in 2018 and 8 tagged in 2019). Of and among study regions (p < 0.001; Fig. 3A), and at
these fish, we observed 93% occupying estuarine temporal scales of months to decades (Fig. 3B). At the
environments in both Saglek and Nain during the largest spatial scales, the Northern stock was most
marine residency period but with a greater propor- unique with a diet that included a higher proportion
tion of Saglek charr utilizing fjord or coastal environ- of non-fish prey such as amphipods (Table 1). In con-
ments (78 and 63%, respectively) compared to Nain trast, diets of charr captured in Nain Inshore largely
(27 and 16%, respectively) (Fig. 2B). Moreover, in comprised fish such as capelin and sand lance
Nain the use of fjords and coastal habitats only oc- Ammodytes spp. (Table 1). Charr in Nain Offshore
curred in 2019 even for fish detected in both study maintained an intermediate level of piscivory rela-
years (Fig. 2A). Tagged fish did not use coastal head- tive to Nain Inshore and Northern charr (Fig. 3A,
land areas until June, and their occupancy only Table 1). Diets of charr from other areas (e.g. Okak
became relatively high in July and August for Saglek and Voiseys) were more similar to Nain Inshore
and peaked in August for Nain. We detected only a (Fig. 3A). With the exception of Cottid sculpins and
small percentage of individuals at coastal receivers Parathemisto amphipods (Nain Inshore only), biomass
in September and we detected no fish in these areas of all prey taxa was lower in charr from the Northern
by October. area.
A Kangeklualuk Bay Nachvak Fjord
Anaktalak Bay Okak Bay
Voiseys Bay
Webb Bay Tikkoatokak Bay
Hebron Fjord
Nain Bay
Antons
Black Island
Area
Nain Inshore
Nain Offshore Dog Island Saglek Fjord
Northern
Okak
Voisey 2D Stress: 0.09
B 1987
1986
1986 1988
1985
Fig. 3. (A) Spatial patterns of Arc- 198
1991
tic charr diets for fish captured at 1999
1997
commercial fishing locations of 1994
1983 1996
the northern Labrador Coast (see 2002 2001 2000 2002 1995
Fig. 1 for locations). (B) Patterns 19841987 1999
1998
of Arctic charr diets across years 1984 2007 2004199
1990 2006 2004 2007
1985 2008 2001 1995 1996
for charr caught in Nain Inshore 2005 1989 2008
1994
and Nain Offshore. Lines indi- 1983 2005 1993 1992
cate the time series progression 1982
2006 1992
for each area. Proximity of points
in these non-metric multidimen-
Area
sional scaling plots reflect diet 1993
Nain Inshore
similarity (Bray-Curtis) of PCO- Nain Offshore 1990
2D Stress: 0.18
derived centroids142 Mar Ecol Prog Ser 673: 135–149, 2021
Table 1. Prey items differentiating diet among Arctic charr captured in northern stocks (including Saglek Fjord, see Fig. 1) and
in inshore and offshore areas of Nain. Dissimilarity scores are derived using the Bray-Curtis Index
Nain Inshore vs. Nain Offshore Nain Inshore average Nain Offshore average Dissimilarity Cumulative
Taxa diet biomass (g) diet biomass (g) contribution (%) dissimilarity (%)
Capelin 11.9 5.9 21.4 21.4
Sculpins (Cottid) 3.2 6.8 12.4 33.8
Sand lance 5.0 4.8 10.9 44.8
Amphipod (Parathemisto spp.) 1.7 4.8 9.1 53.9
Sculpin (Myoxocephalus) 1.7 4.5 8.8 62.7
Amphipod (Hyperid) 1.6 3.4 7.4 70.1
Nain Inshore vs. Northern Nain Inshore average Northern average Dissimilarity Cumulative
Taxa diet biomass (g) diet biomass (g) contribution (%) dissimilarity (%)
Capelin 11.9 2.5 21.7 21.7
Sculpins (Cottid) 3.2 6.3 14.4 36.0
Amphipod (Parathemisto spp.) 1.7 6.9 13.3 49.3
Sand lance 5.0 0.8 11.8 61.1
Fish (unidentified) 3.9 1.0 7.7 68.7
Sculpin (Myoxocephalus) 1.7 0.8 5.0 73.7
Nain Offshore vs. Northern Nain Offshore average Northern average Dissimilarity Cumulative
Taxa diet biomass (g) diet biomass (g) contribution (%) dissimilarity (%)
Sculpins (Cottid) 6.8 6.3 16.0 16.0
Amphipod (Parathemisto spp.) 4.6 6.9 14.9 30.9
Capelin 5.9 2.5 11.9 42.8
Sand lance 4.8 0.8 8.8 51.6
Sculpin (Myoxocephalus) 4.5 0.8 8.6 60.2
Amphipod (Hyperid) 3.4 1.1 7.0 67.1
Pteropods 2.0 0.3 4.8 71.9
The degree of variability explained by temporal areas but that the difference between the 1990s and
scales varied by area. The model for Nain charr had 2000s in the Nain Offshore area was weaker and
a significant year × month interaction term so we only marginally significant (p = 0.046 compared to
examined month-specific differences separately. We p < 0.001 for the others). Interestingly, this decadal
observed diet differences for captured fish among pattern was shared across the Nain areas (Inshore
areas (Inshore and Offshore) and years in Nain for and Offshore) as the correlation in interannual pat-
both July (p < 0.001 for both area and year) and terns was significant across the years when data was
August (p = 0.001 for area; p = 0.03 for year), whereas available for both locations (rho = 0.351, p = 0.004).
we only detected differences in the Northern stock Capelin appeared to be a key driver of the observed
across years (p = 0.002) and not months (p = 0.48). For temporal patterns in Nain, especially compared to
Nain Inshore stocks, capelin tended to be abundant other fish prey such as sand lance (Fig. 4). Effective
in charr stomachs in July (but also present in August). population size of charr in Nain Inshore also showed
Decadal patterns were also evident (Fig. 3B), with interannual patterns with a mean decline of 34.3%
samples from the 1980s grouping very differently (range 32.9−36.8%) between the first (1990) and
from those in the early 1990s and an intermediate second (2001) time point that corresponds to declines
state observed in the 2000s. While not a planned sta- in capelin in their diets (Fig. 4). All populations
tistical comparison, we assessed decadal groupings recovered by the third time point to a mean of
within a PERMANOVA framework for Nain Inshore 95.9% (range 83.0−109.6%) of their original popula-
and Nain Offshore areas. The full model that in- tion size.
cluded decade and area as fixed effects had a signif- Charr sampled from Nain Offshore for diet analy-
icant interaction. When each area was run sepa- ses were generally larger in most years than those
rately, pairwise comparisons showed that all decades captured within the fjords of Nain (Fig. 5A). More-
were significantly different from one another in both over, mean sizes of fish sampled from Nain OffshoreCote et al.: Arctic charr responses to ecosystem change 143
A Nain Inshore Nain Offshore
40
Capelin
Lance
30 Hyperiid
Sculpin
Weight (g)
20
10
0
83
88
93
98
03
08
83
88
93
98
03
08
19
19
19
19
20
20
19
19
19
19
20
20
Year
B Anaktalik Fraser Ikadlivik
300
250
200
150
Ikinet Kamanatsuk Kingurutik
300
250
Ne
Fig. 4. (A) Average weight of
prey items in diets of individual 200
charr (solid lines; grey shaded 150
areas represent 95% CIs of the
90
95
00
05
10
GAM smoothing function) from Puttuaalu Reid
19
19
20
20
20
Nain Inshore and Nain Offshore 300
from 1986−2008 and (B) corre-
sponding estimates of effective 250
population size (Ne) (number of 200
individuals) in rivers associated
with Nain Bay from 1990−2013 150
that were derived from Layton et
90
95
00
05
10
90
95
00
05
10
al. (2021). Error bars represent
19
19
20
20
20
19
19
20
20
20
95% confidence intervals Year
did not vary across years to the same degree as those 4. DISCUSSION
captured from Nain Inshore (Fig. 5A). Stomach full-
ness data also revealed differences between the 2 Arctic charr demonstrated the capacity to buffer
areas over the time series (Fig. 5B). In Nain Offshore, the effects of broad environmental change through
stomach fullness was more consistent (typically aver- shifts in habitat use and diet. While behavioral plas-
aging in the 50−60% range), with notable exceptions ticity is an important trait for dealing with a variable
in 1996 and 2001. In contrast, Nain Inshore stomach environment, it was insufficient to fully safeguard
fullness was consistently lower than Offshore through- populations from the broad ecosystem changes expe-
out the late 1980s and 1990s before exceeding Off- rienced in the 1990s, even in areas that were under
shore values in the early 2000s and peaking in 2005. less harvesting pressure (Layton et al. 2021). It is
Across all years, there was a tendency for more charr likely, however, that behavioral plasticity has played
to be captured in commercial fisheries offshore of a key role in the observed recovery in effective pop-
Nain when stomach fullness of Nain Inshore charr ulation size of charr in our study area and other parts
was low (F1, 20 = 12.51, p = 0.002, R2 = 0.385; Fig. 5C). of the Labrador Coast (Layton et al. 2021) despite
Such a pattern was also found when using catch per only a partial recovery of capelin in their diets.
unit effort (CPUE) as response variable (F1, 20 = 6.60; Charr are generalist feeders utilizing a variety of
p = 0.018, R2 = 0.248). fish and invertebrate taxa (Klemetsen et al. 2003),144 Mar Ecol Prog Ser 673: 135–149, 2021
A Area: Nain Inshore Nain Offshore
55
Fork length (cm)
50
45
40
1980 1985 1990 1995 2000 2005 2010
Year
B
80
Stomach fullness index
70
60
50
40
30
1980 1985 1990 1995 2000 2005 2010
Year
C
1995
% of Nain fish captured offshore
75
1990 1988 1987
1993 1998
1997 1996
50 19941992 1999
1989
1991 2000
25
2002 2006
2005
2001 2003 2004
2007
2008
0
40 50 60 70 80
Average stomach fullness of Nain inshore fish (%)
Fig. 5. Changes to average (A) fork length and (B) stomach fullness of Arctic charr sampled for diet analyses from Nain Inshore
and Nain Offshore. (C) Catch of Arctic charr captured in Nain Offshore compared to stomach fullness of charr captured in
Nain Inshore. Trend lines in (A) and (B) represent GAM cubic regression smoothers with 95% confidence intervals. Trend line
in (C) indicates the linear model and shaded area represents 95% confidence intervalsCote et al.: Arctic charr responses to ecosystem change 145 which enhances their capacity to endure fluctuating In comparison to some other anadromous species prey bases. In addition to varying across stocks, diet (e.g. Atlantic and Pacific salmon), charr do not range composition changed across months during the far from natal rivers during the marine phase (Demp- marine phase and also shifted over decadal scales, son & Kristofferson 1987, Spares et al. 2015, Moore et presumably in response to prey availability. In al. 2016, Layton et al. 2021; in this study < 50 km) and southern portions of our study area, where piscivory accordingly, are constrained to foraging on local prey on capelin was most prominent (Dempson et al. assemblages. However, our results suggest that within 2002, 2008), we observed year to year diet variation. this range, charr can adjust foraging habitats de- Capelin abundance and distribution in the north pending on local conditions. Other studies have doc- Atlantic is dynamic (Carscadden et al. 2013) and low umented plasticity in foraging over diel (Spares et al. capelin abundance was a characteristic of the 2012, Mulder et al. 2020) and seasonal timeframes regime shift documented in the 1990s (Pedersen et (Harris et al. 2020) during the marine phase of charr. al. 2017, Buren et al. 2019) that was captured in diet For example, Harris et al. (2020) observed that forag- studies of Atlantic cod (Taggart et al. 1994), harp ing patterns (i.e. diving behavior) shifted to deeper seals Phoca groenlandica (Lawson & Stenson 1995), waters as the summer season progressed. Unlike this and murres Uvia spp. (Bryant et al. 1999). For exam- study, however, these authors did not observe forag- ple, capelin was ‘virtually absent’ in the diet of At- ing patterns to change across years, despite different lantic cod on the coast of Labrador in 1991 and 1992 environmental conditions. Certainly, there is an ex- (Taggart et al. 1994). On the Gannet Islands of pectation that foraging plasticity of Arctic charr has Labrador, feeding on capelin by murres dropped by limits when dealing with environmental change. A up to 75% in the early 1990s and shifted to daubed genomic study across several regions of northern shannies Lumpenus maculatus (Bryant et al. 1999), Canada (including Labrador) showed region-specific whereas harp seals shifted to a diet dominated by adaptations to marine conditions, specifically to sum- Arctic cod in the late 1980s and early 1990s (Lawson mer sea surface temperature, salinity, tides, turbidity, & Stenson 1995). The timing and nature of these and air temperature (Dallaire et al. 2021). Further- diet shifts correspond to those observed in charr in more, population level impacts have coincided with Nain, which became more similar to those observed extreme environmental conditions (Layton et al. 2021), from Northern fjords (i.e. dominated by inverte- including the populations tracked in this study. brates and sculpins). Charr migrate to marine habitats to increase Associated with diet shifts away from capelin was a growth (Gross et al. 1988). They do this by occupying tendency for Nain charr to be captured at the coastal physiologically advantageous habitats (temperature headlands in commercial fisheries. The combination and salinity) and seeking out rich feeding areas. of the absence of capelin and the low stomach full- Estuaries appear to meet these conditions (Harris et ness of charr remaining in inshore areas suggest that al. 2020). However, the observation that charr under- charr in Nain will adjust foraging behavior, leaving take potentially costly migrations to coastal head- to search for capelin or other prey when it is not lands when capelin are in low abundance indicates available closer to natal rivers. Tagged individuals in the importance of this prey species to Nain charr Nain also showed the capacity to change foraging populations. Where available, capelin provide a habitats; altering their use of fjord and coastal habi- comparably rich food source for charr (Lawson et al. tats from one year to the next. Based on specimens 1998, Fall & Fiksen 2020) and perhaps, in addition to obtained for diet analyses, charr caught in the Nain earlier maturation and frequent spawning (Dempson Offshore area were frequently larger than those from 1995, Power et al. 2005), this explains why commer- Nain Inshore areas. This pattern was noted previ- cial harvests from the Nain stock complex were sus- ously where commercial fishery samples of charr tained at high levels (averaged 70.5 tonnes annually; from inshore bays were generally smaller beginning 2116 tonnes total from 1977 to 1989) despite harvest in the early 1990s by comparison with those caught rates averaging 42% of the exploitable stock (Demp- offshore (Dempson 1995, Dempson et al. 2004). While son 1995). part of this could have been associated with temporal Over time, diet studies of Nain charr reflect 3 eco- differences either in the timing of migrations back to system states, beginning with abundant capelin in freshwater or timing of sampling (Dempson 1995), it the 1980s, followed by very low capelin abundance in is also likely that offshore areas provided enhanced the 1990s, and intermediate abundance in the early feeding opportunities as evidenced from higher stom- 2000s. Since that time, local knowledge holders have ach fullness data. yet to observe capelin rebound to the levels observed
146                                       Mar Ecol Prog Ser 673: 135–149, 2021

in the 1980s (J. Angnatok pers. obs.). These trends           able. Whether these trends are caused by more con-
are generally mirrored in capelin bycatch off north-          centrated fishing effort near communities or deterio-
ern Labrador (Carscadden et al. 2013). In contrast,           rating environmental conditions is not known.
capelin were more consistently at low biomass in                 Telemetry data provide insights that can be diffi-
charr stomachs from northern fjords (Saglek, Hebron,          cult to obtain using conventional mark-recapture tech-
and Ramah) compared to Nain and Okak (Andrews                 niques. For example, timing of migration to and from
& Lear 1956, present study). Unfortunately, we have           marine habitats (Dempson & Green 1985, Dempson
no contemporary surveys to establish the current              & Kristofferson 1987, Bégout Anras et al. 1999,
state of the prey base on the Labrador Coast. Tem-            Gulseth & Nilssen 2000, Jensen & Rikardsen 2012,
perate species like capelin are expected to become            Moore et al. 2016), occupancy patterns of different
increasingly common in the north as the climate               marine habitats (Dempson & Kristofferson 1987,
warms (Reist et al. 2006, Carscadden et al. 2013, Tai         Spares et al. 2015, Moore et al. 2016), and foraging
et al. 2019), and could provide an expanded prey              behavior (inferred from diving data; Spares et al.
base for more northern fish populations. Indeed,              2012, Harris et al. 2020, Mulder et al. 2020) are more
researchers have already reported capelin in charr            difficult to quantify with conventional techniques.
diets of Arctic populations in recent years (Spares et        Estuaries were a key marine habitat to charr in both
al. 2012, McNicholl et al. 2017, Harris et al. 2020).         study areas, with charr spending considerable time
   Predicting responses of charr to climate change            in these areas early in summer. Similar observations
remains challenging. Northward expansion of key               were found in Frobisher Bay (Spares et al. 2015) and
prey like capelin could provide an important food             Cambridge Bay (Moore et al. 2016, Harris et al. 2020)
source for the low productivity coastal ecosystems            in Arctic regions of Canada. Estuaries are important
found along the north coast of Labrador (Murdoch et           habitats that provide favorable thermal environments
al. 2015). Comparisons of Ungava and Labrador                 and access to food resources (Spares et al. 2015), and
showed that slightly elevated temperatures coupled            possibly refuges from higher salinity waters (Harris
with higher local productivity were associated with           et al. 2020). The mechanism driving heightened use
notably better growth of Ungava charr (Murdoch et             of other marine habitats in Saglek remains unknown.
al. 2015). Conversely, the concomitant ecosystem              It may be driven by differences in productivity be-
changes that facilitate the northward expansion of            tween the 2 regions, but the productivity patterns of
prey may have negative effects on charr. For exam-            coastal habitats off Labrador remain poorly under-
ple, growth is dependent on interactions between              stood (McCarney et al. in press). An alternate expla-
water temperature, prey availability, and seasonal            nation is that estuaries of both areas have compara-
phenologies (Power et al. 2012, Murdoch et al. 2015).         ble productivity but that Nain estuaries may be more
Charr growth is most efficient at lower temperatures          attractive in years when they experience influx of
when food is limited (Larsson & Berglund 2005).               migratory prey like capelin. Certainly, tagged charr
Therefore, it is possible that increases in prey avail-       in Nain illustrated that motivation to incorporate
ability may not overcome the reduced growth effi-             other non-estuarine habitats can vary from year to
ciency associated with warmer water. Positive bene-           year.
fits to charr are further limited by the potential for           There are few studies (but see Dempson & Kristof-
increased competition from temperate salmonids                ferson 1987, Dempson et al. 2002, Spares et al. 2012)
(Power et al. 2012) and existing population adapta-           that link observations of marine behavior of charr to
tions that make it difficult for anadromous charr to          spatial and temporal variation in diet. Complemen-
thrive in warmer conditions (Layton et al. 2021). Such        tary data streams such as these (i.e. diet and commer-
factors might drive populations with partial migra-           cial harvests) provide a more robust and holistic pic-
tion (i.e. exhibit both anadromous and resident life          ture of charr behavior while in the ocean and illustrate
histories) to shift to resident life histories as the ben-    the importance of long-term datasets. Even in this
efits of anadromy fade (Davidsen et al. 2020, Layton          circumstance, where historical diet and commercial
et al. 2021). In Nain, despite recovering effective           catch data did not temporally overlap with contem-
population sizes of local populations and improving           porary telemetry data, our confidence in the likeli-
capelin abundance in charr diets, local harvesters            hood that marine behavioral differences observed
have reported charr to be smaller and in lower abun-          across Saglek and Nain charr populations persist
dance (Dempson et al. 2008, J. Angnatok pers. obs.);          over time is bolstered by the consistency of diet dif-
an indication that the fishery, although greatly re-          ferences among fjords over decadal scales. The com-
duced from earlier times, is becoming less sustain-           plexity of dynamic prey fields and small-scale spatial
Cote et al.: Arctic charr responses to ecosystem change                                147

variation in marine behavior, super-imposed upon a                  murres at the Gannet Islands, Labrador. Can J Zool 77:
changing climate, is a challenge to predicting and                  1278−1287
                                                                 Bundy A, Heymans JJ, Morissette L, Savenkoff C (2009)
managing responses of charr to commercial and food                  Seals, cod and forage fish: a comparative exploration of
fisheries. Understanding how productivity cycles                    variations in the theme of stock collapse and ecosystem
fluctuate in conjunction with changing environmen-                  change in four Northwest Atlantic ecosystems. Prog
tal conditions will help to predict subsequent impacts              Oceanogr 81:188−206
                                                                 Buren AD, Murphy HM, Adamack AT, Davoren GK and oth-
on the marine behavior of local charr populations.
                                                                    ers (2019) The collapse and continued low productivity of
While our study shows charr are capable of surviving                a keystone forage fish species. Mar Ecol Prog Ser 616:
regime shifts in part by altering habitat use, prey                 155−170
community shifts expected with climate change (Perry             Carscadden JE, Gjøsæter H, Vilhjálmsson H (2013) A com-
                                                                    parison of recent changes in distribution of capelin (Mal-
et al. 2005, Rose 2005b) will add to other climate-
                                                                    lotus villosus) in the Barents Sea, around Iceland and in
related stressors that are expected to have wide-                   the Northwest Atlantic. Prog Oceanogr 114:64−83
spread impacts on anadromous charr populations                   Colbourne EB (2004) Decadal changes in the ocean climate
(Layton et al. 2021). With this in mind, recent con-                in Newfoundland and Labrador waters from the 1950s to
cerns about the health of charr populations near Nain               the 1990s. J Northwest Atl Fish Sci 34:43−61
                                                                 Dallaire X, Normandeau É, Mainguy J, Tremblay JÉ,
suggest renewed monitoring efforts of charr and the                 Bernatchez L, Moore JS (2021) Genomic data support
coastal ecosystem are needed to support sustainable                 management of anadromous Arctic Char fisheries in
management of this critical cultural (Berkes 2018)                  Nunavik by highlighting neutral and putatively adaptive
and commercial (Power & Reist 2018) resource.                       genetic variation. Ecol Appl 14:1880–1897
                                                                 Davidsen JG, Power M, Knudsen R, Sjursen AD, Kjærstad
                                                                    G, Rønning L, Arnekleiv JV (2020) Marine trophic niche-
Acknowledgements. The extensive datasets used in this               use and life history diversity among Arctic charr Salveli-
study were reliant on the dedication and innovation of many         nus alpinus in southwestern Greenland. J Fish Biol 96:
residents of Nunatsiavut (Food Skills and Environmental             681−692
Research Program), technicians and biologists from DFO           Dempson JB (1995) Trends in population characteristics of
(J. Seiden, D. Lancaster, M. Shears, M. Bloom, S. Duffy),           an exploited anadromous Arctic charr, Salvelinus alpi-
the Nunatsiavut Government (P. McCarney, C. Andersen,               nus, stock in northern Labrador. Nord J Freshw Res 71:
L. Pijogge), Oceans North (S. Pain), and the captains and           197−216
crew of the ‘What’s Happening’ and the ‘Safe Passage’. Sug-      Dempson JB, Green JM (1985) Life history of anadromous
gestions by 3 anonymous reviewers also greatly improved             Arctic charr, Salvelinus alpinus, in the Fraser River,
the manuscript. Funding for this research was provided in           northern Labrador. Can J Zool 63:315−324
part by ArcticNet and DFO Oceans.                                Dempson JB, Kristofferson AH (1987) Spatial and temporal
                                                                    aspects of the ocean migration of anadromous Arctic
                   LITERATURE CITED                                 char. Am Fish Soc Symp 1:340−357
                                                                 Dempson JB, Shears M, Bloom M (2002) Spatial and tempo-
Anderson EC (2017) Rubias — genetic stock identification            ral variability in the diet of anadromous Arctic charr,
   (GSI) in the tidyverse. https://github.com/eriqande/rubias       Salvelinus alpinus, in northern Labrador. Environ Biol
Anderson MJ (2001) A new method for non-parametric mul-             Fishes 64:49−62
   tivariate analysis of variance. Aust Ecol 26:32−46            Dempson JB, Shears M, Furey G, Bloom M (2004) Review
Andrews CW, Lear E (1956) The biology of Arctic char                and status of north Labrador Arctic charr, Salvelinus
   (Salvelinus alpinus L.) in northern Labrador. J Fish Res         alpinus. CSAS Res Doc 2004/070
   Board Can 13:843−860                                          Dempson JB, Shears M, Furey G, Bloom M (2008) Resilience
Bégout Anras ML, Gyselman EC, Jorgenson JK, Kristoffer-             and stability of north Labrador Arctic charr, Salvelinus
   son AH, Auras L (1999) Habitat preferences and resi-             alpinus, subject to exploitation and environmental vari-
   dence time for the freshwater to ocean transition stage of       ability. Environ Biol Fishes 83:57–67
   Arctic charr. J Mar Biol Assoc UK 79:153−160                  Fall J, Fiksen Ø (2020) No room for dessert: a mechanistic
Berkes F (2018) Arctic fish, northern cultures, and tradi-          model of prey selection in gut-limited predatory fish.
   tional ecological knowledge. In: Coad BW, Reist JD (eds)         Fish Fish 21:63−79
   Marine fishes of Arctic Canada. Canadian Museum of            Gower JC (1966) Some distance properties of latent root and
   Nature, Toronto, p 57–60                                         vector methods used in multivariate analysis. Biometrika
Bray JR, Curtis JT (1957) An ordination of the upland forest        53:325−338
   communities of southern Wisconsin. Ecol Monogr 27:            Gross MR, Coleman RM, McDowall RM (1988) Aquatic pro-
   325−349                                                          ductivity and the evolution of diadromous fish migration.
Brown T, Reimer K, Sheldon T, Bell T (2012) A first look at         Science 239:1291−1293
   Nunatsiavut Kangidualuk (‘fjord’) ecosystems. In: Allard      Gulseth OA, Nilssen KJ (2000) The brief period of spring
   M, Lemay M (eds) Nunavik and Nunatsiavut: from sci-              migration, short marine residence, and high return rate
   ence to policy. An Integrated Regional Impact Study              of a northern Svalbard population of Arctic Char. Trans
   (IRIS) of climate change and modernization. ArcticNet,           Am Fish Soc 129:782–796
   Quebec City, p 271−301                                        Harris LN, Yurkowski DJ, Gilbert MJH, Else BGT and oth-
Bryant R, Jones IL, Hipfner JM (1999) Responses to changes          ers (2020) Depth and temperature preference of anadro-
   in prey availability by common murres and thickbilled            mous Arctic char Salvelinus alpinus in the Kitikmeot Sea,
148 Mar Ecol Prog Ser 673: 135–149, 2021 a shallow and low-salinity area of the Canadian Arctic. Moore JK, Fu W, Primeau F, Britten GL and others (2018) Mar Ecol Prog Ser 634:175−197 Sustained climate warming drives declining marine bio- Hollenbeck CM, Portnoy DS, Gold JR (2016) A method for logical productivity. Science 359:1139−1143 detecting recent changes in contemporary effective pop- Moran BM, Anderson EC (2019) Bayesian inference from ulation size from linkage disequilibrium at linked and the conditional genetic stock identification model. Can J unlinked loci. Heredity 117:207−216 Fish Aquat Sci 76:551−560 Jensen JLA, Rikardsen AH (2012) Archival tags reveal that Mulder IM, Morris CJ, Dempson JB, Fleming IA, Power M Arctic charr Salvelinus alpinus and brown trout Salmo (2020) Marine temperature and depth use by anadro- trutta can use estuarine and marine waters during win- mous Arctic char correlates to body size and diel period. ter. J Fish Biol 81:735−749 Can J Fish Aquat Sci 77:882−893 Johnson L (1980) The Arctic charr, Salvelinus alpinus. In: Murdoch A, Dempson JB, Martin F, Power M (2015) Tem- Balon EK (ed) Charrs, salmonid fishes of the genus perature−growth patterns of individually tagged anadro- Salvelinus. Dr. W. Junk Publishers, The Hague, p 15–98 mous Arctic charr Salvelinus alpinus in Ungava and Klemetsen A, Amundsen PA, Dempson JB, Jonsson B, Jons- Labrador, Canada. Ecol Freshwat Fish 24:193−203 son N, O’Connell MF, Mortensen E (2003) Atlantic Nugent CM, Easton AA, Norman JD, Ferguson MM, Danz- salmon, Salmo salar L., brown trout, Salmo trutta L., and mann RG (2017) A SNP based linkage map of the Arctic Arctic charr Salvelinus alpinus (L.): a review of aspects of charr (Salvelinus alpinus) genome provides insights into their life histories. Ecol Freshwat Fish 12:1−59 the diploidization process after whole genome duplica- Lacroix GL, Knox D, McCurdy P (2004) Effects of implanted tion. G3 (Bethesda) 7:543−56 dummy acoustic transmitters on juvenile Atlantic Nugent CM, Leong JS, Christensen KA, Rondeau EB and salmon. Trans Am Fish Soc 133:211−220 others (2019) Design and characterization of an 87k SNP Larsson S, Berglund I (2005) The effect of temperature on genotyping array for Arctic charr (Salvelinus alpinus). the energetic growth efficiency of Arctic charr (Salveli- PLOS ONE 14:e0215008 nus alpinus L.) from four Swedish populations. J Therm Nutt DC (1953) Certain aspects of oceanography in the Biol 30:29−36 coastal waters of Labrador. J Fish Res Board Can 10: Lawson JW, Stenson GB (1995) Historic variation in the diet 177−186 of harp seals (Phoca groenlandica) in the northwest At- Pedersen EJ, Thompson PL, Ball RA, Fortin MJ and others lantic. In: Blix AS, Walløe L, Ulltang Ø (eds) Whales, (2017) Signatures of the collapse and incipient recovery Seals, Fish and Man: Proc Int Symp Biol Mar Mamm N of an overexploited marine ecosystem. R Soc Open Sci 4: East Atl, 29 November to 1 December, 1994, Dev Mar 170215 Biol, Elsevier Press, Amsterdam, p 261−269 Perry AL, Low PJ, Ellis JR, Reynolds JD (2005) Climate Lawson JW, Magalhäes AM, Miller EH (1998) Important change and distribution shifts in marine fishes. Science prey species of marine vertebrate predators in the north- 308:1912−1915 west Atlantic: proximate composition and energy den- Power M, Reist JD (2018) Salvelinus alpinus. In: Coad BW, sity. Mar Ecol Prog Ser 164:13−20 Reist JD (eds) Marine fishes of Arctic Canada. Canadian Layton KKS, Dempson JB, Snelgrove PVR, Duffy SJ and oth- Museum of Nature, Toronto, p 283–289 ers (2020) Resolving fine-scale population structure and Power M, Dempson JB, Power G, Reist JD (2000) Environ- fishery exploitation using sequenced microsatellites in a mental influences on an exploited anadromous Arctic northern fish. Evol Appl 13:1055−1068 charr stock in Labrador. J Fish Biol 57:82−98 Layton KKS, Snelgrove PVR, Dempson JB, Kess T and others Power M, Dempson JB, Reist JD, Schwartz CJ, Power G (2021) Genomic evidence of past and future climate-linked (2005) Latitudinal variation in fecundity among Arctic loss in a migratory Arctic fish. Nat Clim Chang 11:158−165 charr populations in eastern North America. J Fish Biol McCarney P, Cote D, Laing R, Wells N and others (in press) 67:255−273 Biophysical and ecological overview of a study area Power M, Dempson JB, Doidge B, Michaud W and others within the Labrador Inuit Settlement Area zone. DFO (2012) Arctic charr in a changing climate: predicting pos- Can Sci Adv Sec Res Doc 2018 sible impacts of climate change on a valued northern McNicholl DG, Wolki B, Ostertag S (2017) Traditional eco- species In: Allard M, Lemay M (eds) Nunavik and Nunatsi- logical knowledge and local observations of Capelin avut: from science to policy. An Integrated Regional (Mallotus villosus) in Darnley Bay, NT. Can Manuscr Rep Impact Study (IRIS) of climate change and moderniza- Fish Aquat Sci 3144 tion. ArcticNet, Quebec City, p 199–221 Mills KE, Pershing AJ, Sheehan TF, Mountain D (2013) Cli- R Core Team (2020) R: a language and environment for sta- mate and ecosystem linkages explain widespread de- tistical computing. R Foundation for Statistical Comput- clines in North American Atlantic salmon populations. ing, Vienna. www.r-project.org Glob Change Biol 19:3046−3061 Reist JD, Wrona FJ, Prowse TD, Power M, Dempson JB, Montevecchi WA, Myers RA (1997) Centurial and decadal King JR, Beamish RJ (2006) An overview of effects of cli- oceanographic influences on changes in northern gan- mate change on selected Arctic freshwater and anadro- net populations and diets in the north-west Atlantic: mous fishes. Ambio 35:381−387 implications for climate change. ICES J Mar Sci 54: Reist JD, Power M, Dempson JB (2013) Arctic charr (Salveli- 608−614 nus alpinus): a case study of the importance of under- Moore JS, Harris LN, Kessel ST, Bernatchez L, Tallman RF, standing biodiversity and taxonomic issues in northern Fisk AT (2016) Preference for nearshore and estuarine fishes. Biodiversity (Nepean) 14:45−56 habitats in anadromous Arctic char (Salvelinus alpinus) Rikardsen AH, Diserud OH, Elliott JM, Dempson JB, from the Canadian high Arctic (Victoria Island, Nunavut) Sturlaugsson J, Jensen AJ (2007a) The marine tempera- revealed by acoustic telemetry. Can J Fish Aquat Sci 73: ture and depth preferences of Arctic char and sea trout. 1434−1445 Fish Oceanogr 16:436−447
Cote et al.: Arctic charr responses to ecosystem change                                149

Rikardsen AH, Dempson JB, Amundsen PA, Bjørn PA, Fin-             Spares AD, Stokesbury MJW, O’Dor RK, Dick TA (2012)
   stad B, Jensen AJ (2007b) Temporal variability in marine          Temperature, salinity and prey availability shape the
   feeding of sympatric Arctic charr and sea trout. J Fish           marine migration of Arctic char, Salvelinus alpinus, in a
   Biol 70:837−852                                                   macrotidal estuary. Mar Biol 159:1633−1646
Rose GA (2005a) Capelin (Mallotus villosus) distribution and      Spares AD, Stokesbury MJW, Dadswell MJ, O’Dor RK, Dick
   climate: a sea ‘canary’ for marine ecosystem change.              TA (2015) Residency and movement patterns of Arctic
   ICES J Mar Sci 62:1524−1530                                       charr Salvelinus alpinus relative to major estuaries.
Rose GA (2005b) On distributional responses of North Atlantic        J Fish Biol 86:1754−1780
   fish to climate change. ICES J Mar Sci 62:1360−1374            Taggart CT, Anderson J, Bishop C, Colbourne E and others
Rowe S, Jones IL, Chardine JW, Elliot RD, Veitch BG (2000)           (1994) Overview of cod stocks, biology, and environment in
   Recent changes in the winter diet of murres (Uria spp.) in        the northwest Atlantic region of Newfoundland, with em-
   coastal Newfoundland waters. Can J Zool 78:495−500                phasis on northern cod. ICES Mar Sci Symp 198:140−157
Simo-Matchim AG, Gosselin M, Poulin M, Ardyna M,                  Tai TC, Steiner NS, Hoover C, Cheung WWL, Sumaila UR
   Lessard S (2017) Summer and fall distribution of phyto-           (2019) Evaluating present and future potential of arctic
   plankton in relation to environmental variables in                fisheries in Canada. Mar Policy 108:103637
   Labrador fjords, with special emphasis on Phaeocystis          Wood S (2019) Package ‘mgcv’. https://cran.r-project.org/
   pouchetii. Mar Ecol Prog Ser 572:19−42                            web/packages/mgcv/mgcv.pdf

Editorial responsibility: Konstantinos Stergiou,                  Submitted: December 2, 2020
 Thessaloniki, Greece                                             Accepted: May 28, 2021
Reviewed by: 3 anonymous referees                                 Proofs received from author(s): August 24, 2021
You can also read