DANGEROUS BY DESIGN - Smart Growth America
←
→
Page content transcription
If your browser does not render page correctly, please read the page content below
2019

                                 Source: April Bertelsen, PBOT

                  DANGEROUS
                  BY DESIGN

Source: Stephen Lee Davis, SGA      Source: Dr. Scott Crawford
SMART GROWTH AMERICA is a national organization dedicated to researching, advocating for, and leading
coalitions to bring better development to more communities nationwide. From providing more sidewalks to ensuring
that more homes are built near public transportation or that productive farms remain a part of our communities, smart
growth helps make sure people across the nation can live in great neighborhoods. Learn more at
www.smartgrowthamerica.org.

The NATIONAL COMPLETE STREETS COALITION, a program of Smart Growth America, seeks to fundamentally
transform the look, feel, and function of the roads and streets in our communities, by changing the way most roads
are planned, designed, and constructed. Complete Streets policies direct transportation planners and engineers to
consistently design with all users in mind. Learn more at www.smartgrowthamerica.org/complete-streets.
This project was made possible by the following organizations:

                              AARP is the nation’s largest nonprofit, nonpartisan organization dedicated to
                              empowering Americans 50 and older to choose how they live as they age. With nearly
                              38 million members and offices in every state, the District of Columbia, Puerto Rico and
                              the U.S. Virgin Islands, AARP works to strengthen communities and advocate for what
matters most to families with a focus on healthy security, financial stability and personal fulfillment. The AARP Livable
Communities initiative works nationwide to support the efforts of neighborhoods, towns, cities, counties and rural
areas to be livable for people of all ages.

Websites: AARP.org and AARP.org/Livable | Email: Livable@AARP.org | Free Newsletter: AARP.org/Livable-Subscribe
Facebook: /AARPLivableCommunities | Twitter: @AARPLivable | 601 E Street NW, Washington, D.C. 20049

                           Founded in 1899, the AMERICAN SOCIETY OF LANDSCAPE ARCHITECTS is the
                           professional association for landscape architects in the United States, representing
more than 15,000 members. The Society’s mission is to advance landscape architecture through advocacy,
communication, education, and fellowship. Sustainability has been part of ASLA’s mission since its founding and is an
overarching value that informs all of the Society’s programs and operations. ASLA has been a leader in demonstrating
the benefits of green infrastructure and resilient development practices through the creation of its own green roof, co-
development of the SITES® Rating System, and the creation of publicly-accessible sustainable design resources.
Learn more at www.asla.org.

                             NELSON\NYGAARD CONSULTING ASSOCIATES is an internationally recognized firm
                             committed to developing transportation systems that promote vibrant, sustainable, and
                             accessible communities. We plan and design connected complete streets that put people
                             first. Learn more at www.nelsonnygaard.com.

In addition, thank you to the following individuals for your support and for adding your voices to call for safer streets:

John David Carson                         Morgan Palmer                             Daniel P Stephens
Barb Chamberlain                          Joe Roskowski                             John D Thompson
Rich Harrison                             Elizabeth Schilling
Janet Manry                               John Siekmeier

Project Team: The primary author of the language in this report was Heather Zaccaro. Jordan Chafetz and Sophie
Schonfeld conducted all analyses and created the maps and figures throughout this report. This project was
conducted under the leadership and guidance of Emiko Atherton, Stephen Lee Davis, and Michael Rodriguez.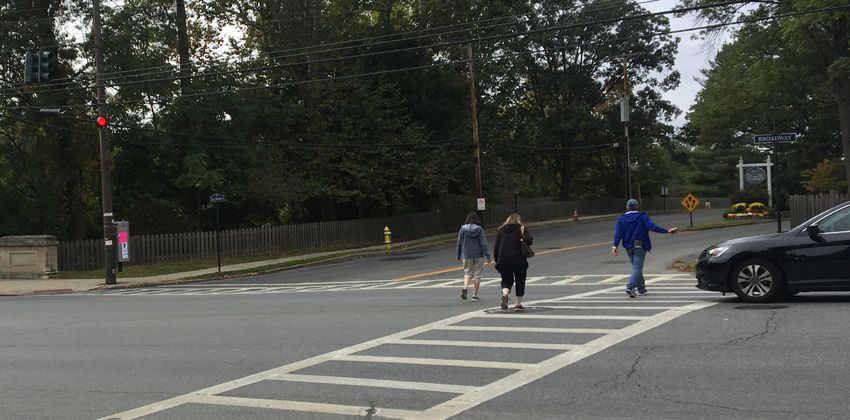
DANGEROUS BY DESIGN Executive Summary
EXECUTIVE SUMMARY
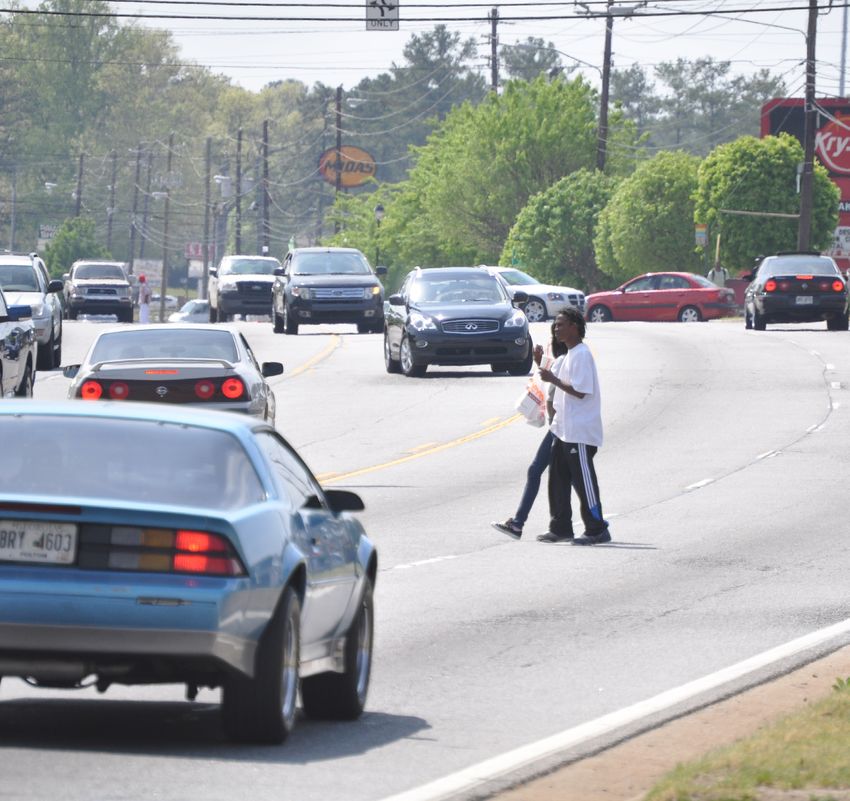
Between 2008 and 2017, drivers struck and killed which we designed for the movement of vehicles,
49,340 people who were walking on streets all across haven’t changed. In fact, we are continuing to design
the United States. That’s more than 13 people per streets that are dangerous for all people. Furthermore,
day, or one person every hour and 46 minutes. It’s the federal and state policies, standards, and funding
equivalent of a jumbo jet full of people crashing—with mechanisms still produce roads that prioritize high
no survivors—every single month. speeds for cars over safety for all people.
In the past decade, the number of people To reverse this trend and save lives, we need
struck and killed while walking increased to protect all users of the transportation
by 35 percent. 2016 and 2017 were the two system through our policies, programs, and
highest years since 1990 for the number funding.
of people who were killed by drivers while
walking.
This report ranks states and metropolitan areas
around the country using our “Pedestrian Danger
2 Index”, or PDI. This index measures how deadly it is
for people to walk based on the number of people
struck and killed by drivers while walking, controlling
for the number of people that live in that state or
metro area and the share of people who walk to work.
The 2019 edition of Dangerous by Design includes
traffic deaths that occurred between 2008 and 2017
from the Fatality Analysis Reporting System (FARS), a
national database of all fatal traffic crashes.
What this report shows is that our streets
Federal funds,
aren’t getting safer. Even more so, while policies, and
traffic deaths impact every community in
the United States, states and metropolitan
standards helped to
areas across the southern continental United create this problem
States, older adults, people of color, and and have a role in
people walking in low-income communities
bear a higher share of this harm. improving the streets
Why is this happening? We’re not walking more,
we build tomorrow.
and we’re only driving slightly more than we were
back in 2008. What is happening is that our streets,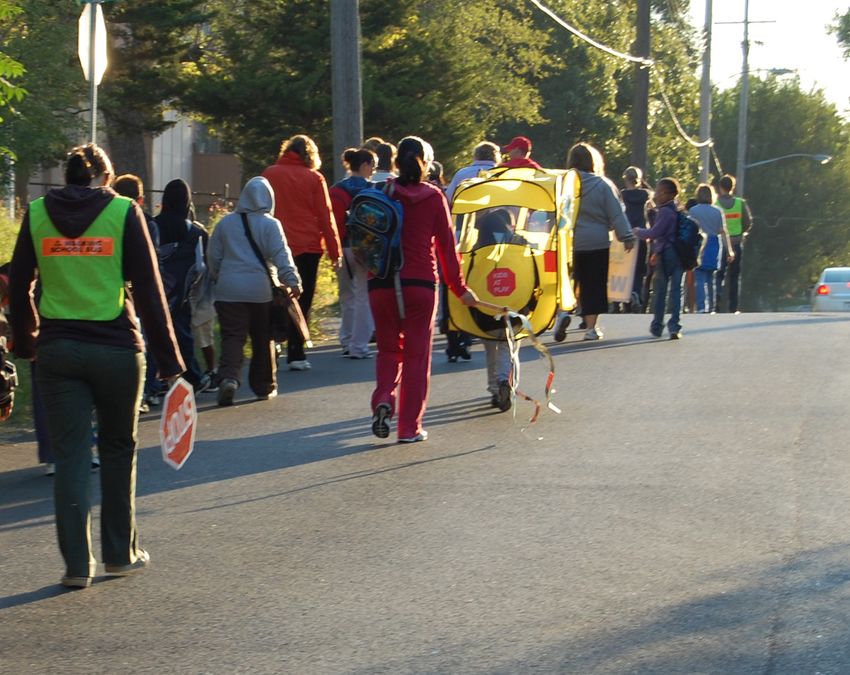
DANGEROUS BY DESIGN                                               Executive Summary

         THE TOP 20
         Most Dangerous Metropolitan Areas for Pedestrians
         (2008-2017)
         Top 20 Most Dangerous Metropolitan Areas for Pedestrians, 2008-2017
             Top 1-10             Top 11-20

                                                                                                                         18 Detroit-Warren-Dearborn

                  7 Bakersfield
                                                                                                                                   15 Greenville-Anderson-Mauldin
                                        Albuquerque 17                                                 11 Memphis
                                                         Little Rock-North Little Rock-Conway 19                                      20 Augusta-Richmond County
                                                                                                                    13 Birmingham-Hoover

                                                                                                       10 Jackson
                                                                                                                                           6 Jacksonville

                                                                                      Baton Rouge 12                                        2 Deltona-Daytona Beach-Ormond Beach   3
                                                                                                                 Orlando-Kissimmee-Sanford 1 3 Palm Bay-Melbourne-Titusville
                                                                                                         Tampa-St. Petersburg-Clearwater 9 5 Lakeland-Winter Haven
                                                                                                           North Port-Sarasota-Bradenton 4
                                                                                                                      Cape Coral-Fort Myers 8    14 Miami-Fort Lauderdale-
                                                                                                                                                     West Palm Beach

                                                                      16 McAllen-Edinburg-Mission

         Our federal government needs to take the                               We call on state DOTs and MPOs to put people first
         lead on prioritizing safer streets. Federal                            and give their organizations the tools and training they
         dollars and policies helped create these                               need to create transportation networks that serve all
         unsafe streets in the first place. And                                 users.
         federal funds, policies, and guidance have a
                                                                                We call on the over 1,400 communities that have
         significant role to play in fixing these streets
                                                                                adopted a Complete Streets policy to turn their vision
         and in designing the streets we’ll build
                                                                                into practice and implementation.
         tomorrow.
                                                                                And we call on you to demand safer streets from the
         We call on Congress to adopt a strong, federal
                                                                                elected officials in your communities.
         Complete Streets policy that requires state
         departments of transportation (DOTs) and
         metropolitan planning organizations (MPOs) to
         consistently plan for all people who use the street,
         including the most vulnerable users.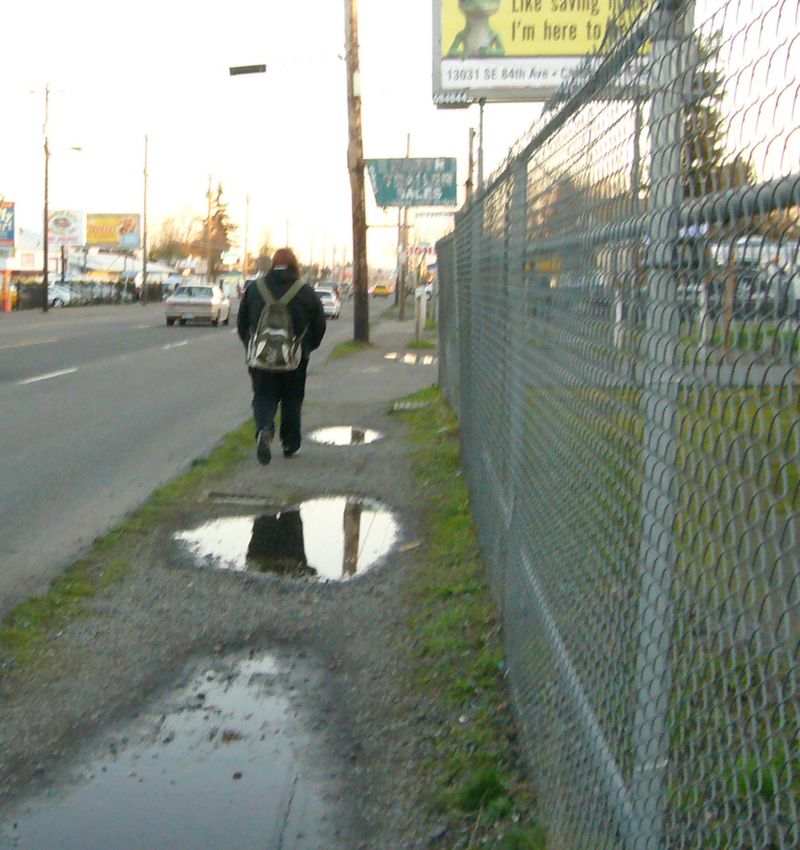
DANGEROUS BY DESIGN                                                                        Introduction

         INTRODUCTION

                                                                                                      “
         Between 2008 and 2017, drivers struck and killed
         49,340 people while they were walking throughout
         the United States.1 That’s more than 13 people                                                      How do we shift
         per day, or one person every hour and 46 minutes.
         It’s the equivalent of a jumbo jet full of people                                                   safety culture? One
         crashing—with no survivors—every single month.
                                                                                                             fatality on a U.S. air
         Unlike traffic fatalities for motor vehicle occupants,
         which decreased by 6.1 percent from 2008 to 2017,                                                   carrier in nine years,
         pedestrian deaths have been steadily rising since
         2009. In 2015, 5,494 people died while walking, an
                                                                                                             and everyone in this
         unprecedented increase of 11.9 percent compared                                                     room knew about it.
         to the previous year. In 2016, pedestrian deaths
         rose by another 10.6 percent to 6,080. Deaths                                                       So why do we under-
         declined slightly in 2017 to 5,977, but this is nothing
         to celebrate—it’s still the second highest body count
                                                                                                             react to hundreds of
4        on record since 1990.2                                                                              tragic deaths every
                                                                                                             day on our roads?"
                                                                                                             -Deborah Hersman, former President & CEO,
         Pedestrian Fatalities and                                                                            National Safety Council

         Vehicle Miles Traveled (VMT)
         (2008-2017)
                                                                                                                               6,080   5,977
                                                     6                                                                                         3.4
                                                                                                                      5,494

                                                     5                                   4,818                4,910                            3.3
                                                                                                                                                     National Vehicle Miles Traveled (trillions)

                                                                                                     4,779
           Total Pedestrian Fatalities (thousands)

                                                         4,414                   4,457
                                                                         4,302
                                                                 4,109
                                                     4                                                                                         3.2

                                                     3                                                                                         3.1

                                                     2                                                                                         3.0

                                                     1                                                                                         2.9

                                                     0                                                                                         2.8
                                                         2008    2009    2010    2011    2012        2013     2014    2015     2016    2017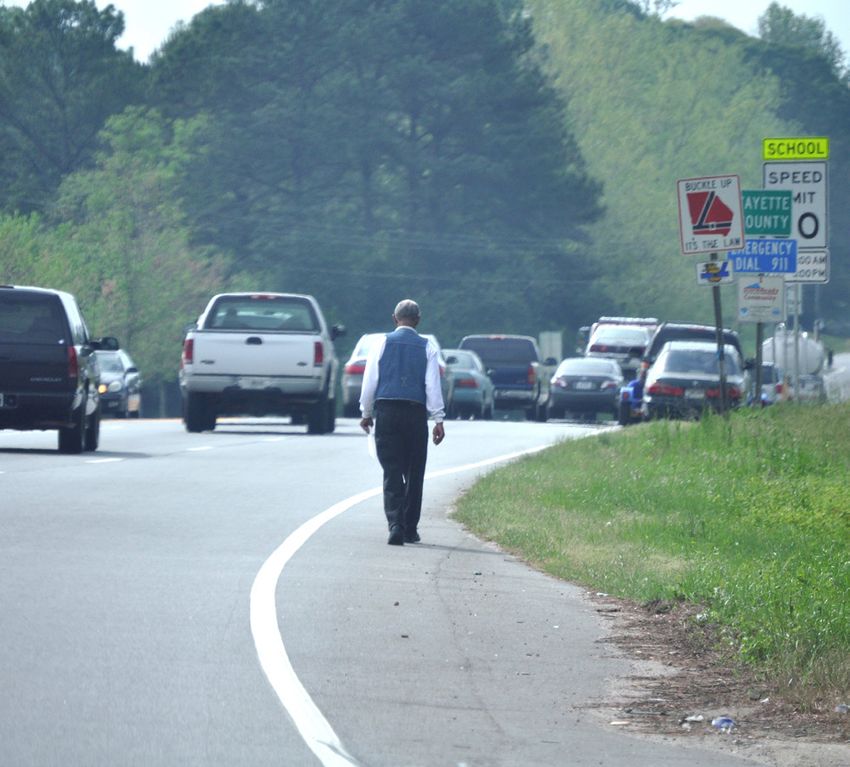
DANGEROUS BY DESIGN                 Introduction

         WHY IS THIS HAPPENING?

                                  ARE WE WALKING MORE? Not really. Although individual
                                  cities and metropolitan areas have observed increased
                                  walking rates, the share of trips made by walking nationwide
                                  barely increased from 2009 to 2017 according to the National
                                  Household Travel Survey, and the total number of all trips,
                                  including walking trips, decreased during this time.3

                                  ARE WE DRIVING MORE? Vehicle Miles Traveled (VMT), or
                                  the total amount of driving we do as a nation each year, has
                                  gradually increased since 2011. However, as shown in the chart
                                  on the previous page, VMT in 2017 was only 8.1 percent higher
                                  than it was in 2008 before the economic recession, but the
                                  number of people struck and killed by drivers while walking rose
                                  by more than a third during this time period and is higher now
                                  than it’s been in nearly three decades.4,5
                                                                                                     5

      BY THE NUMBERS
      From 2008 to 2017:

           Pedestrian    Vehicle miles               Walking as a              Traffic deaths
            deaths         traveled                share of all trips          among motor
         increased by   increased by                increased by             vehicle occupants
                                                                              decreased by

         35.4%            8.1%                       less
                                                     than       1%*
                                                     *from 2009 to 2017
                                                                                   6.1%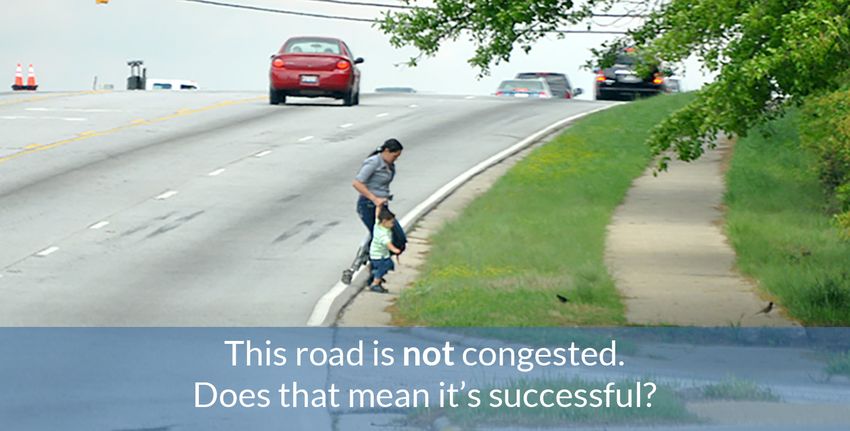
DANGEROUS BY DESIGN                                         Introduction
Source: Stephen Lee Davis / Smart Growth America

                                                            WHAT’S GOING WRONG?
                                                            We continue to design streets that are dangerous
                                                            for all people, not just because we keep repeating
                                                            the same mistakes, but because our federal policies,
                                                   6
                                                            standards, and funding mechanisms that have been
                                                            in place for decades produce dangerous roads that
                                                            prioritize high speeds for cars over safety for all
                                                            people.

                                                            Additionally, more people are driving cars that the
                                                            National Highway Traffic Safety Administration
                                                                                                                          Our federal government needs to take
                                                            (NHTSA) has determined to be notoriously dangerous
                                                                                                                          the lead on prioritizing safer streets.
                                                            for people walking. According to a 2015 NHTSA
                                                                                                                          Federal dollars and policies helped create
                                                            report, SUVs (sport utility vehicles) and pickup
                                                                                                                          these unsafe streets in the first place. And
                                                            trucks are two to three times more likely than smaller
                                                                                                                          federal funds, policies, and standards have a
                                                            personal vehicles like sedans to kill people walking in
                                                                                                                          significant role to play in fixing these streets
                                                            the event of a crash. A recent Detroit Free Press article
                                                                                                                          and in designing the streets we’ll build
                                                            observed that SUV sales have climbed steadily since
                                                                                                                          tomorrow.
                                                            2012, surpassing sedans as the best-selling type of
                                                            vehicle nationwide as of 2014.6,7

                                                            This year, Congress has a major opportunity to
                                                            reshape our mobility future as they begin the work of
                                                            reauthorizing our federal transportation bill in 2020.
                                                            To address our continuing safety problems, they must
                                                            create policies that change the way we fund, design,
                                                            and measure the success of our streets nationwide to
                                                            make sure the safety of all people who use the street
                                                            including people walking, is our highest priority.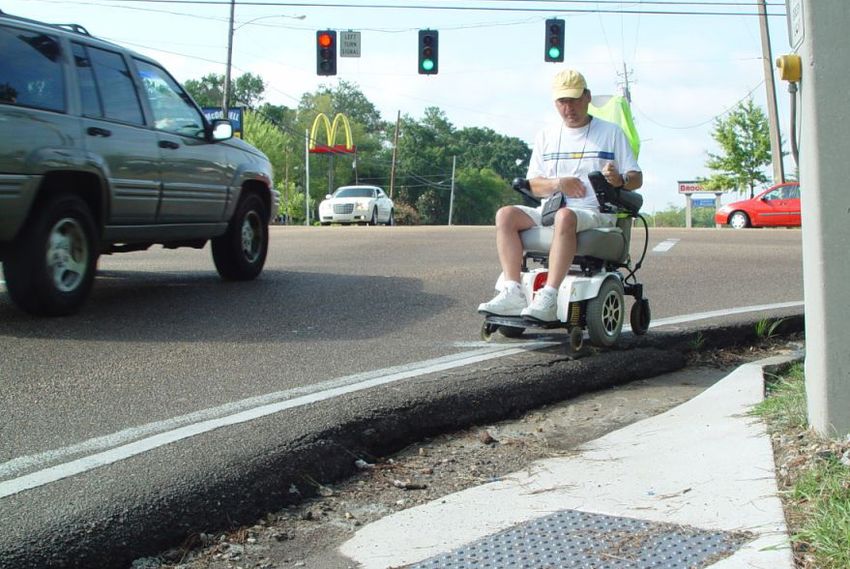
DANGEROUS BY DESIGN                                            Introduction

       We need a strong federal Complete

                                                                   “ACCEPTABLE” DEATHS?
       Streets policy that requires state
       departments of transportation to consistently
       plan for all people who use the street, including           Many states—including 10 of the
       the most vulnerable users. Federal policy must              20 most dangerous for people
       also open the door for flexible guidance to allow           walking—
       planners and engineers to make innovative                   planned
       decisions about how to design roadways to                   for more
       accommodate all users. We need performance                  pedestrian
       measures that ensure states set targets that                deaths in 2018
       require progress toward creating safer streets              than 2017.
       and hold them accountable for achieving                     Under the Federal Highway Administration’s Highway
       reductions in serious injuries and fatalities,              Safety Improvement Program (HSIP), state departments
                                                                   of transportation were required to set performance
       penalizing them for failing to meet those targets.
                                                                   targets for traffic fatalities and serious injuries and then
       And we also need more high quality data on
                                                                   monitor their progress over time. Unfortunately, a closer
       the street conditions where fatalities occur and
                                                                   look at these targets reveals just how low the bar is
       on traffic-related injuries nationwide to help us
                                                                   for safety in many states which are setting targets that
       better diagnose and solve the problem.                      would actually increase pedestrian fatalities.
       Funding is a first step. But not the last.                  In 2017, states updated their safety goals for 2018,
       As long as the federal government continues                 including setting target numbers for deaths and serious        7
       to invest the lion’s share of our transportation            injuries among people walking, biking, or using other
       funding in building, maintaining, and widening              non-motorized forms of travel. 18 states established
       streets for cars instead of creating safer streets          targets for non-motorized deaths and injuries that are
       for people, we will continue to see more people             higher than the number of people killed or injured in
       being killed while walking. National policy must            the most recent year of data reported. Ten of these
       reflect safety as a higher priority. This will result       18 states—Alabama, Arkansas, California, Delaware,
       in the reallocation of our current spending to              Florida, Kentucky, Michigan, Missouri, Nevada, and
                                                                   Oklahoma—are among the top 20 most dangerous
       invest in safety for all users and help to establish
                                                                   states for people walking.
       dedicated funding programs for projects to
       support walking, biking, transit, and other                 The only “acceptable” number of deaths on our
       modes of transportation.                                    roadways is zero, but every single state—whether
                                                                   seeking to marginally reduce pedestrian deaths and
       Emerging technologies such as                               injuries or allow them to continue climbing unabated—
       automated vehicles (AVs) aren’t the                         established a target for “success” that allows these
       answer either. These technologies are not                   preventable deaths to continue or even increase.
       going to solve our safety problems for us,
       especially not when it comes to the safety of               We can and must raise the bar by requiring states to
                                                                   set safety targets that reduce rather than increase the
       people walking. AVs may not always be able
                                                                   number of people killed or seriously injured while walking
       to reliably detect people walking and biking.
                                                                   or biking on our streets, ultimately working toward
       Additionally, under pending federal legislation,
                                                                   eventually eliminating all traffic-related deaths and
       states and cities will have little to no oversight
                                                                   serious injuries. However, to make this vision a reality,
       over how these technologies are deployed                    we need a strong federal policy with binding enforceable
       within their own communities.                               requirements that hold states to higher safety standards.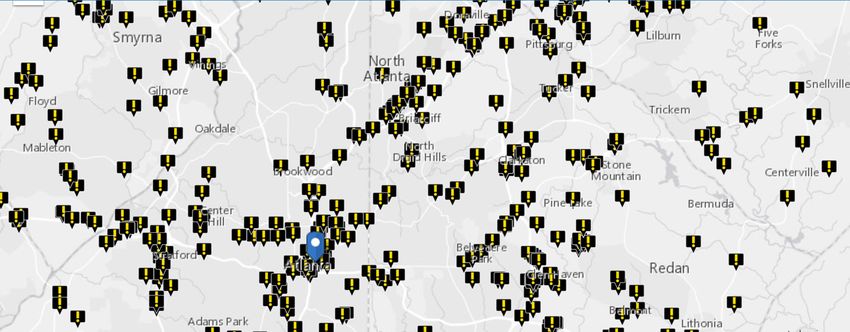
DANGEROUS BY DESIGN                                       Introduction

         Motor Vehicle Related Fatalities

         We must make preventing traffic deaths a higher            This report ranks the most dangerous states and
         priority nationwide, including for people walking.         metropolitan areas across the United States for people
         Of all the people that die in traffic crashes on our       walking. It also exposes disparities in which groups of
8
         roads, people walking now comprise 16.1 percent            people are most at risk of dying while walking.
         of all deaths, and as shown above, that share has
                                                                    Traffic deaths impact every community in the
         been consistently growing for more than a decade.8
                                                                    United States, but states and metropolitan
         Better, faster trauma care and safety improvements
                                                                    areas across the southern continental United
         for occupants of vehicles ranging from seatbelts
                                                                    States, older adults, people of color, and
         to automatic braking and lane departure warnings
                                                                    people walking in low-income communities
         have played an important role in saving lives on our
                                                                    bear a higher share of this harm.
         roadways overall. However, the safer street and
         vehicle design standards needed to protect people          It is our hope that this report will inspire communities
         walking have progressed slowly or not at all.              across the country to take action. Policymakers at the
                                                                    federal, state, and local level can and should do more
                                                                    to ensure streets are designed and operated to protect
                                                                    the safety of all people who use them regardless
                                                                    of age, ability, income, race, ethnicity, or mode of
                                                                    transportation.
DANGEROUS BY DESIGN Introduction
WHAT CAN BE DONE TO ADDRESS THIS PROBLEM?
It’s thankfully not a mystery—we have the recipe in our hands. At the federal level, we need a strong, federal
Complete Streets policy as a first major step, but here are nine other concrete actions that policymakers, local
leaders, engineers, and others can take at the state, metropolitan, or local level.
State actions
1. Set performance targets that will improve safety. State (DOTs) must be held accountable for making
reductions in serious injuries and fatalities and should be penalized for failing to meet those targets. They
certainly shouldn’t receive funding for plans to increase fatalities. Read more on page 7.
2. Prioritize safety over vehicle movement. Though states might have a long list of goals or objectives for
their transportation system, moving vehicles quickly and efficiently and maintaining pavement conditions
generally take precedence. One way to make safety a higher priority is to get rid of the “level of service”
design metric. Level of service, used by nearly all states, measures the success of a street solely based on
vehicle delay. Minimizing vehicle delay as the number one goal often produces the roads that are the most
dangerous by design.
9
3. Provide state transportation officials and engineers with the most up-to-date training and
education on implementing Complete Streets. In states that have made a policy commitment to
Complete Streets, often the professional staff tapped to implement changes lack the knowledge required,
or the policies and decision-making frameworks already in place need to be updated to support Complete
Streets. At the request of state or city DOTs, the National Complete Streets Coalition (and other programs
within Smart Growth America) have provided staff with the training needed to embed Complete Streets in
their day-to-day work and make safer projects a reality.BY DESIGN
DANGEROUS BY
DANGEROUS DESIGN Introduction
Introduction
State or local actions
1. Prioritize projects that will benefit those who suffer disproportionately. Some groups, including people
of color and people walking in lower-income communities, are disproportionately struck and killed while walking.
To address this, decision-makers should prioritize the projects that would benefit these vulnerable users. For
example, the Nashville Area Metropolitan Planning Organization, when deciding which projects to fund in their
selection process, awards extra points to projects that will improve safety for people walking or biking in certain
disadvantaged areas.1
2. Embrace the flexibility provided by FHWA to design safer streets. New design guidance from the Federal
Highway Administration (FHWA) in 2016 gave states and cities wide latitude to design streets to best suit local
needs and rolled back old regulations that treated all streets and roads like highways. This cleared the way for
states, metro areas, and local communities to use federal dollars to design safer streets, yet many states falsely
claim that federal guidelines continue to restrict innovative street design.
3. Design roads to reduce speeds wherever possible. For people on foot, the likelihood of surviving a crash
decreases rapidly as speeds increase past 30 mph. The federal government already knows that excessive
speed is a deadly problem in our nation’s transportation system—the National Transportation Safety Board
recently acknowledged this in a powerful report to FHWA.2 The current practice of measuring how fast most
traffic travels on a road and then setting speed limits so that only 15 percent of the drivers are exceeding that
10 10
limit results in artificially high speed limits—and unsafe streets for everyone. Rather than designing roads that
encourage speeding and then relying upon enforcement, states and cities should design roads to encourage
safer, slower driving speeds in the first place.
4. Pass actionable Complete Streets policies that lay the groundwork for implementation. The National
Complete Streets Coalition’s policy framework provides guidance on how to craft a strong policy that sets up
clear next steps to embed Complete Streets in routine transportation planning.3
5. Stop referring to pedestrian fatalities as unavoidable “accidents.” City and state leaders should set an
example by replacing the word “accident” with “crash” when discussing these preventable deaths. It’s a small
change that can make a big difference. Read more on page 22.
6. Test out bold, creative approaches to safer street design. Poor street design is neither an insurmountable
nor expensive problem. Some cities have found success by testing out low-cost, short-term interventions
to create safer streets and then measuring the results to gauge the impact of their projects to work toward
permanent solutions.4
1. Building Healthy & Prosperous Communities: How metro areas are implementing more and better bicycling and walking projects.
Transportation for America. December, 2017. http://t4america.org/maps-tools/healthy-mpos-guidebook/
2. Safety Study: Reducing Speeding-Related Crashes Involving Passenger Vehicles. NTSB/SS-17/01 PB2017-102341 National
Transportation Safety Board. Adopted July 25, 2017. https://www.ntsb.gov/safety/safety-studies/Documents/SS1701.pdf
3. The Elements of a Complete Streets Policy, Effective 2018. Smart Growth America and the National Complete Streets Coalition.
November, 2017. https://smartgrowthamerica.org/introducing-brand-new-grading-framework-complete-streets-policies/
4. Safety Demonstration Projects: Case studies from Orlando, FL, Lexington, KY, and South Bend, IN. Smart Growth America and the
National Complete Streets Coalition. April, 2018. https://smartgrowthamerica.org/resources/safety-demonstration-projects-case-studies-from-
orlando-fl-lexington-ky-and-south-bend-in/DANGEROUS BY DESIGN The Most Dangerous Places to Walk
THE MOST DANGEROUS
PLACES TO WALK
Our “Pedestrian Danger Index”, or PDI, calculates
how deadly it is for people to walk in a state or
metropolitan area based on the number of people
struck and killed by drivers while walking, controlling
for the number of people that live in that state or
metro area and the number of people that walk to
work. Calculating PDI in this way corrects for places
that may have higher numbers of fatalities simply as
a function of higher numbers of people traveling on
Source: Stephen Lee Davis, SGA
foot overall, allowing balanced comparisons between
very different places. The share of people who walk to
work is the best nationally available approximation of
the total number of people who walk for all trips.
The 2019 calculations include traffic deaths that 11
occurred between 2008 and 2017 from the Fatality
Analysis Reporting System (FARS), a national Pedestrian Deaths
100,000 Pedestrian
database of all fatal traffic crashes. Walk to work Population Danger
and population data are taken from the U.S. Census Index
Percentage of Walking Trips
Bureau’s 2016 American Community Survey five-year
estimates. For age, race, and ethnicity, we calculate
a variation of PDI using walking rates from the 2017
National Household Travel Survey in lieu of Census Compared to
the previous
data. Consult the Appendix for a more detailed
description of our methodology.
This report calculates PDI for all 50 states (plus
decade of data in
Washington, DC) and for the 100 largest census Dangerous by Design 2016,
defined metropolitan statistical areas (MSAs)
39 states and the District
nationwide. However, just because your community
does not fall within the top 10 or 20 most dangerous of Columbia, and 79 out of
places is not necessarily cause for celebration. Since the 100 largest metropolitan
areas, have become more
the previous edition of Dangerous by Design, which
looked at pedestrian deaths between 2004 and
2015, PDI scores in the vast majority of states and dangerous for people
metropolitan areas nationwide have worsened.
walking.DANGEROUS BY DESIGN The Most Dangerous Places to Walk
THE TOP 20
Most Dangerous States for Pedestrians
(2008-2017)
Top 20 Most Dangerous States for Pedestrians, 2008-2017
Michigan
19
3 Delaware
11
18 Maryland
Nevada
20
17
Kentucky
16 Missouri 13
California North Carolina
12 Tennessee
South
14
9 7 15 Carolina
Oklahoma Arkansas
Arizona New Mexico 6 10
Georgia
2
5 Alabama
8 Mississippi
4 Florida
Texas
Louisiana 1
12
182
145
127 125 123 117 117
112 111 108 101 101
98 86 85
68 68 66 65 58
FL AL DE LA MS GA NM TX AZ SC NV TN NC OK AR CA MO MD MI KY
2008-2017 Pedestrian Danger Index
PDI BY STATE
The map above highlights the top 20 most dangerous states for people
walking based on PDI scores. With just a few exceptions, the most Future research
dangerous states are located in the southern continental United States. should explore
how historic and
ongoing street design
Why the Sun Belt? practices contribute
Part of the reason for this may be because much of the growth in these to these geographic
places occurred in the age, and the development scale of, the automobile. trends.
Previous research by Smart Growth America found that in general, the
most sprawling metropolitan areas with wider roads and longer blocks
typically cluster in the southern states.9 Furthermore, academic research
has consistently linked these sprawling growth patterns to higher rates
of both traffic-related deaths for people walking and traffic-related deaths
overall.10 Future research should explore how historic and ongoing street
design practices contribute to these geographic trends.DANGEROUS BY DESIGN The Most Dangerous Places to Walk
The figure below shows the 10 states that experienced the biggest increase
in PDI since the previous iteration of Dangerous by Design. Compared to PDI
scores for traffic deaths for the period from 2004 to 2015, PDI scores for these
states for the decade from 2008 to 2017 rose by anywhere from 7.9 to 24.5
points, meaning these places have become even more dangerous for people
walking.
Largest Increases in State PDI Scores, 2016-2018
States with Largest Increases in 10-Year PDI Scores
Dangerous by Dangerous by
Design 2016 Design 2019
Delaware +24.5
Georgia +19.2
District of Columbia +11.4
Texas +10.8
Tennessee +10.3
Nevada +9.8
Oklahoma +9.5
Mississippi +8.6
Alabama +8.4
Louisiana +7.9 13
0 20 40 60 80 100 120 140 160
Largest Increases in MSA PDI Scores, 2016-2018
The top 10 most dangerous states for people walking Top Ten Most Dangerous States
in 2019 are the exact same states called out in
Dangerous by Design 2016, although the rankings
within the top 10 have shifted slightly. The figure at Dangerous by Dangerous by
Design 2016 Design 2019
right shows how the top ten states have changed,
Florida 1 1 Florida
or more importantly, remained exactly the same in
Alabama 2 2 Alabama
ranking between our 2016 and 2019 reports. States
highlighted in bold at the right either moved up in the Louisiana 3 3 Delaware
ranks or remained at the top of our list of the most Mississippi 4 4 Louisiana
dangerous places for people walking. Unfortunately, New Mexico 5 5 Mississippi
overhauling road design can take decades without the Arizona 6 6 Georgia
political will to prioritize safety improvements. Although South Carolina 7 7 New Mexico
some of these states, including Florida (through their
Delaware 8 8 Texas
state DOT), have committed to statewide Complete
Texas 9 9 Arizona
Streets policies, they still have a long way to go to
Georgia 10 10 South Carolina
translate those policies into practice.DANGEROUS BY DESIGN Introduction
4 out of 5 major
metropolitan areas grew
more dangerous for
people walking
Source: Creative Commons
PDI BY METROPOLITAN
Four out of every five major metropolitan areas grew
more dangerous for people walking since the previous
AREA edition of Dangerous by Design. The chart below
shows the metropolitan areas that experienced the
The next page shows the PDI scores for the top
largest increases. These regions saw PDI scores
20 most dangerous metropolitan areas for people
climb by upwards of 28.6 to 86.4 points, meaning
14 walking. Once again, the majority of these places fall
the decade from 2008 to 2017 was on average much
across the southern continental United States, with
more dangerous for people walking in these places
eight of the top 10 most dangerous metropolitan
compared to the decade between 2004 and 2015.
areas in the state of Florida.
Largest Increases in MSA PDI Scores, 2016-2018
MSAs with Largest Increases in 10-Year PDI Scores
Dangerous by Dangerous by
Design 2016 Design 2019
North Port - Sarasota -
+86.4
Bradenton, FL
Bakersfield, CA +84.9
Orlando - Kissimmee -
+78.6
Sanford, FL
Greenville - Anderson -
+51.5
Mauldin, SC
Baton Rouge, LA +37.3
Deltona - Daytona Beach
+37.2
- Ormond Beach, FL
Fresno, CA +32.3
Memphis, TN-MS-AR +30.9
Lakeland - Winter
+30.3
Haven, FL
Greensboro - High
+28.6
Point, NC
0 50 100 150 200 250 300 350DANGEROUS BY DESIGN The Most Dangerous Places to Walk
THE TOP 20
Most Dangerous Metropolitan Areas for Pedestrians
(2008-2017)
Top 20 Most Dangerous Metropolitan Areas for Pedestrians, 2008-2017
Top 1-10 Top 11-20
18 Detroit-Warren-Dearborn
7 Bakersfield
15 Greenville-Anderson-Mauldin
Albuquerque 17 11 Memphis
Little Rock-North Little Rock-Conway 19 20 Augusta-Richmond County
13 Birmingham-Hoover
10 Jackson
6 Jacksonville
Baton Rouge 12 2 Deltona-Daytona Beach-Ormond Beach
Orlando-Kissimmee-Sanford 1 3 Palm Bay-Melbourne-Titusville 15
Tampa-St. Petersburg-Clearwater 9 5 Lakeland-Winter Haven
North Port-Sarasota-Bradenton 4
Cape Coral-Fort Myers 8 14 Miami-Fort Lauderdale-
West Palm Beach
16 McAllen-Edinburg-Mission
2008-2017 Pedestrian Danger Index
313
265
245
235 231 226 218 217
205
192
184
158 157 154 153
141 138 135 135 134
e
n
ers
r
his
r
h
in
ion
rd
ch
n
ille
eld
n
e
ue
n
y
ty
ate
e
wa
ill
ug
to
ac
ve
so
or
uld
un
ov
fo
ea
erq
sv
v
mp
iss
rsfi
My
en
rb
Ha
on
Be
ck
Ro
rw
an
on
Co
Ho
itu
Ma
B
ea
-M
rad
u
ke
Ja
Me
s
lea
S
-C
ort
uq
er
alm
nd
T
-
ck
ton
-D
-
e-
nd
am
Ba
e-
urg
on
-B
int
ck
-C
-F
Alb
Ja
mo
me
en
mo
rn
Ba
tP
h
rs
ota
-W
o
ral
urg
inb
ng
ou
arr
eR
Or
im
de
es
ich
Co
d
ras
Ed
sb
mi
elb
it-W
-
iss
An
lan
W
ittl
ch
-R
r
Bir
-
pe
Sa
-
y-M
ete
-K
en
e-
hL
ke
ea
ale
sta
tro
Ca
rt-
ill
do
All
La
aB
.P
ort
erd
nv
Ba
gu
De
Po
Mc
lan
St
ee
-N
ton
Au
ud
lm
-
rth
Or
pa
Gr
ck
La
Pa
ay
No
m
Ro
-D
ort
Ta
na
tle
i-F
lto
Lit
am
De
MiDANGEROUS BY DESIGN Introduction
Right Place, Wrong Time
RIGHT PLACE, WRONG In response, the city added a leading pedestrian
interval, which gives people crossing the street a
TIME head start before cars are given the green light,
On July 15, 2015, 46-year-old Francisca Chaja Pelico making people walking more visible to turning drivers.
and her nine-year-old granddaughter Mariela stood on
Leading pedestrian intervals, a proven safety
the corner of Broadway and Cecil Avenue in Knoxville,
countermeasure recommended by the Federal
Tennessee. They waited for the light to change then
Highway Administration, cost nothing to implement
proceeded into the crosswalk.
where there are already pedestrian signals in place,
But the light changed back before they had enough and neither does extending the time people have to
time to make it all the way across the street. A driver cross the street. These no-cost measures can (and
waiting at the red light accelerated, striking both do) mean the difference between life and death,
Francisca and her granddaughter in the crosswalk. especially for older adults and people living with
Mariela’s injuries, thankfully, were not serious. But mobility challenges.
Francisca was transported to the hospital where she
We need to think proactively about these safety
died the next day.
concerns when we design our intersections and
Tragedies like Francisca’s are far too commonplace. make sure we provide people not only with safe,
Compared to younger people who are struck and convenient places to cross the street, but also with
killed by drivers while walking, older adults killed while sufficient time to make it all the way across at their
16
walking are more often at an intersection or within own pace.
a crosswalk. Part of the reason for this is because
even when transportation planners provide people
with marked places to cross the street, the amount
of time provided to rush all the way across often isn’t
adequate, especially for older adults and people living
with disabilities.
Three years later, the City of Knoxville is testing out
improvements to make the intersection of Broadway
and Cecil a safer place for people walking. The
T-shaped intersection now includes technology that
detects people in the crosswalk and extends the
length of the walk phase until they make it all the way
across the street.
Scarcely 10 miles away two older adults were struck
and injured in the same crosswalk by two different
drivers making left-hand turns at the intersection of
Downtown West and Ray Mears Boulevards.DANGEROUS BY DESIGN The Most Vulnerable Populations
THE MOST VULNERABLE
POPULATIONS
Who are the victims of these tragic crashes? Although Relative Pedestrian Danger by Age
people of all ages, races, ethnicities, and income (2008-2017)
levels suffer the consequences of dangerous street
design, some neighborhoods and groups of people
Pedestrian 20 20.7 28
bear a largerDanger
share ofIndex by Age,
the burden 2008-2017
than others.
Older adults, people of color, and people
U.S.
walking in low-income communities are Overall:
disproportionately represented in fatal 14.8
crashes involving people walking.
Even after controlling for differences in population
size and walking rates, we see that drivers strike and 50+ 65+ 75+
kill people over age 50, Black or African American
People age 50 and up, and especially people age 75
people, American Indian or Alaska Native people, and
and older, are overrepresented in deaths involving
people walking in communities with lower median
people walking.12 This age group is more likely to 17
household incomes at much higher rates.
experience challenges seeing, hearing, or moving, and
if these trends are any indication, we are not devoting
Older Adults nearly enough attention to the unique needs of older
Our nation’s population is becoming older on average. adults when we design our streets.
People are living longer and the post-war generation
These disparities become even more pronounced
known as the Baby Boomers is reaching the age
when we account for variations in walking rates by
of retirement. According to U.S. Census Bureau
age.13,14 The relative PDI for older adults age 50 and
projections, people age 65 and older currently make
above is more than a third higher than it is for the
up about 15 percent of the population, but by 2050
general population, and for people age 75 and up
this is expected to rise to 22 percent.11 This has
it is almost twice as high. Additionally, a closer look
important implications for traffic-related deaths as well
at nationwide FARS data reveals that, compared to
as for how we design our streets.
younger victims of pedestrian deaths, older adults
who are struck and killed while walking are more often
at an intersection or in a crosswalk.15DANGEROUS BY DESIGN The Most Vulnerable Populations
Source: Nelson\Nygaard
SEIZE THE MOMENT
Across the country, nonprofits and advocacy groups have staged protests
18 and performances to call attention to the amount of time older adults need to
safely cross the street. Even where marked crosswalks exist—and in many
places they are still, crucially, absent—the traffic signal timing may provide
a dangerously inadequate amount for older adults and people living with
disabilities to safely cross.
In Milwaukee, Wisconsin, the Sojourn Theatre staged a performance to highlight insufficient signal timings
at crosswalks. They carried homemade ship sails and mock drawbridges, staging 20-second performances
in dangerous intersections identified by older adults through a survey. They also invited a state senator and six
local and regional elected officials to walk across the street alongside older adults to experience firsthand how
stressful and dangerous it can be to try to race against the clock. As a result, Milwaukee adjusted countdown
clocks to give pedestrians more time to make it safely across the street.
In Pittsburgh, Pennsylvania, a group called Lively Pittsburgh organized a crosswalk flash mob. Participants
of all ages and abilities wore matching “safer together” t-shirts and danced in the crosswalk as a reminder
to drivers to look out for people crossing the street, especially people who may take longer to cross and use
motorized chairs or crutches to get around.
And in San Francisco, California, the nonprofit organization Senior and Disability Action led a campaign to
increase citywide signal timings so people of all ages and abilities, including people living with sight and mobility
challenges, have enough time to safely cross any street. They organized marches and press conferences in
public plazas to call attention to their concerns. As a result, the city changed its guidance for calculating how
much time to give people to cross the street, increasing crossing times by a third citywide.DANGEROUS BY DESIGN The Most Vulnerable Populations
PEOPLE OF COLOR
Drivers strike and kill people of color, especially discouraged homeownership for people of color,
Black or African American and American Indian or particularly for Black or African American people, by
Alaska Native people, at higher rates compared to restricting mortgages outside of exclusively White
White, Non-Hispanic, and Asian or Pacific Islander neighborhoods, and the construction of the National
people.The figure below highlights the relative danger Highway System disproportionately carved through
by census-designated racial and ethnic groups of communities of color when building these new high-
being struck and killed while walking, controlling for speed arterials.18 In addition to siting more dangerous
differences in walking rates and population size.16,17 roads near communities of color, implicit bias may also
play a role in the increased danger for people of color.
Structural racism has guided many of the decisions Research by the University of Nevada has shown that
we’ve made about housing and transportation for drivers are significantly more likely to yield to a White
decades, and the consequences of these decisions pedestrian in a crosswalk than to a Black or African
are still readily apparent in communities of color American pedestrian.19
today. Federal policies and practices actively
19 19
Relative Pedestrian Danger by Race and Ethnicity
(2008-2017)
8.1 12.4 13.9 18.3 33
U.S.
Overall:
14.8
Asian or Pacific White, Hispanic or Black or African American Indian
Islander Non-Hispanic Latino American or Alaska NativeDANGEROUS BY DESIGN The Most Vulnerable Populations
KALISPEL TRIBE OF INDIANS ADOPTS
COMPLETE STREETS
When it comes to traffic safety, the challenges faced by American Indians are similar to the challenges
faced throughout rural America. Sprawling, car-oriented street design, often without sidewalks or
marked crosswalks, can make it incredibly dangerous to walk along many rural roads, and when
crashes do occur, it can take much longer for emergency medical services to reach the victims and
begin critical, life-saving treatment.
Among American Indians specifically, these challenges are further compounded by historic—and
ongoing—injustices. The reservation system was, simply put, not designed with the interests or
wellbeing of American Indians in mind. Lack of funding to improve and maintain roads coupled with
historically poor street design has left these communities incredibly vulnerable to traffic fatalities.
For the Kalispel Tribe of Indians in Washington State, the most dangerous street is a 50 mile-per-hour
county-owned roadway without any sidewalks or crosswalks. Many people must regularly walk along
this road to reach jobs, shops, and schools, especially children and people who do not have access
to personal vehicles.
However, change is on the horizon for the Kalispel Tribe. In 2018, they became the first tribal
government to adopt a Complete Streets policy. Now, they are working closely with the county to
introduce safer street improvements and to develop a new framework for economic development.
20 Kalispel hopes to establish itself as a model for how tribal governments around the country can adopt
policies and develop partnerships that better serve their unique needs, challenges, and desires.
Where are people most often struck and killed while walking?
Find the most deadly places with an interactive map:
www.smartgrowthamerica.org/dangerous-by-designDANGEROUS BY DESIGN Introduction
Source: Tri-State Transportation Campaign
LOW-INCOME COMMUNITIES
Although nationwide data do not include information about the household
income of individuals who are struck and killed while walking, they do
reveal where people are walking when they are killed. We analyzed where
pedestrian fatalities occur relative to the median household income of the 21
surrounding area and found that people die while walking at much higher
rates in lower-income communities compared to higher-income ones, as
seen below.20 This is unsurprising, given that low-income communities
are significantly less likely than higher income communities to have
sidewalks, marked crosswalks, and street design to support safer, slower
speeds, also known as traffic calming.21
Pedestrian
Location FatalitiesFatalities
of Pedestrian per 100,000 People byIncome
by Neighborhood Median Household Income
3.0
Pedestrian Fatalities per 100,000
2.0
U.S. Overall: 1.55
1.0
0
$3-$36k $37k-$47k $48k-$59k $60k-$78k $79k-$250k
Census Tract Median Household IncomeDANGEROUS BY DESIGN Introduction
Source: Barbara McCann
CONCLUSION WORDS MATTER
They’re crashes, not “accidents.”
We can and must do more to reduce the number
Writing and talking about these preventable
of people who die while walking every day on our
deaths as mere “accidents” undermines
roadways. For too long we have disregarded this
the urgency of this crisis and undercuts our
problem by prioritizing moving cars at high speeds over responsibility to take action.
safety for everyone. It’s past time for that to change.
To combat this rhetoric, one Nashville-based
Protecting the safety of all people who use the street, initiative is changing the conversation. A
especially the people most vulnerable to being struck partnership between Vanderbilt Medical Center,
22 and killed, needs to be a higher priority for policymakers, Tennessee State University, The Sidewalk
Foundation, and Walk Bike Nashville launched
and this priority must be reflected in the decisions we
the Nashville Pedestrian Death Registry. The
make about how to fund, design, operate, maintain, and project maps where people die while walking in
measure the success of our roads. Nashville and tells a richer, more complete story
about who the victims were and where and why
We call on federal policymakers to step up and the fatal crash occurred.
establish safety as a higher priority. We call for binding,
enforceable requirements for states to work toward The project aims to add urgency to the
call for safer streets in Nashville, where the
reducing—and eventually eliminating—deaths and
sidewalk network is notoriously incomplete or
serious injuries on our roadways. We call for funding
non-existent. Instead of reiterating the victim-
dedicated to safer street projects that specifically serve blaming rhetoric prevalent in media coverage
the needs of all people walking, particularly older adults, about these tragic deaths (such as focusing
people of color, and low-income communities. We call on dark colored clothing, distracted walking,
for federally endorsed street design standards that put walking while intoxicated, and crossing where
the safety of vulnerable users first and foremost and that no crosswalk is available), the Nashville
Pedestrian Death Registry is shifting the
allow for flexible, context-sensitive design approaches.
narrative toward the human faces behind these
The time for complacency has passed. We must treat tragedies. By changing the conversation about
this crisis as if our lives, and the lives of our friends, why people die while walking, the Nashville
families, and neighbors, depend on it. Pedestrian Death Registry hopes to garner
support for policies that prioritize the safety
Because the reality is, they do. of people walking and for more investment in
projects to improve safety.
You can learn more about this initiative at
NashvillePedestrianDeathRegistry.orgDANGEROUS BY DESIGN Endnotes
ENDNOTES
1. All pedestrian fatality data for the report are from: National Highway Traffic Safety Administration. (2017). Fatality Analysis Reporting
System. Available from https://www.nhtsa.gov/research-data/fatality-analysis-reporting-system-fars.
2. Ibid.
3. Federal Highway Administration. (2009; 2017). National Household Travel Survey. Available from https://nhts.ornl.gov/.
4. Federal Highway Administration. (2008-2016). Highway Statistics Series, Table VM-2. Available from http://www.fhwa.dot.gov/
policyinformation/quickfinddata/qftravel.cfm
5. Federal Highway Administration. (2017). Travel Monitoring, Traffic Volume Trends. Available from https://www.fhwa.dot.gov/
policyinformation/travel_monitoring/tvt.cfm.
6. National Highway Traffic Safety Administration. (2015). New Car Assessment Program. Available from https://www.federalregister.gov/
documents/2015/12/16/2015-31323/new-car-assessment-program.
7. Lawrence ED, Bomey N, and Tanner K. (2018). “Death on foot: America’s love of SUVs is killing pedestrians.” Detroit Free Press.
Available from https://www.freep.com/story/money/cars/2018/06/28/suvs-killing-americas-pedestrians/646139002/.
8. Other non-motorists category includes bicyclists and other cyclists, persons on personal conveyances, and persons in/on buildings.
9. Ewing R, Pendall R, and Chen D. (2002). Measuring Sprawl and Its Impact. Available from: https://www.smartgrowthamerica.org/app/
legacy/documents/MeasuringSprawl.PDF.
10. Ewing R, Schieber RA, and Zegeer CV. (2003). Urban Sprawl as a Risk Factor in Motor Vehicle Occupant and Pedestrian
Fatalities. American Journal of Public Health 93(9): 1541-1545. Available from https://ajph.aphapublications.org/doi/full/10.2105/
AJPH.93.9.1541.
11. U.S. Census Bureau. (2017). National Population Projections Tables. Available from https://www.census.gov/data/tables/2017/demo/
popproj/2017-summary-tables.html.
12. Excludes 164 reported pedestrian fatalities (0.3 percent of all pedestrian fatalities) with missing age data.
13. Share of all trips made by walking by age taken from the 2017 National Household Travel Survey. These range from 9.5 percent of all
trips for people age 75 and older to 11.2 percent of all trips for people age zero to nineteen. 23
14. Gender-neutral icon courtesy of OliM via the Noun Project. Available from https://thenounproject.com.
15. Built environment data, including the presence of a crosswalk, were made available in the FARS dataset as of 2015. Between 2015
and 2017, pedestrian fatalities at intersections and crosswalks were more likely to be a person over 65 than a person under 65.
16. Excludes 5,420 reported pedestrian fatalities (11.0 percent of all pedestrian fatalities) with missing race and/or ethnicity data.
17. Share of all trips made by walking by race and ethnicity taken from the 2017 National Household Travel Survey. These range from 9.9
percent of all trips for the White, Non-Hispanic population to 14.5 percent of all trips for the Asian, Native Hawaiian, or Pacific Islander
population.
18. Rothstein R. (2017). The Color of Law: A forgotten history of how our government segregated America. New York: Liveright Publishing
Corporation.
19. Coughenour C, Clark S, Singh A, et al. (2017). Examining racial bias as a potential factor in pedestrian crashes. Accident Analysis &
Prevention 98: 96-100. Available from https://www.sciencedirect.com/science/article/abs/pii/S000145751630361X.
20. Consult the Methodology for a more detailed description of this analysis.
21. Gibbs K, Slater SJ, Nicholson N, et al. (2012.) “Income Disparities in Street Features that Encourage Walking.” Bridging the Gap
Program, University of Illinois at Chicago. Available from http://www.bridgingthegapresearch.org/_asset/02fpi3/btg_street_walkability_
FINAL_03-09-12.pdf.DANGEROUS BY DESIGN Appendices
APPENDICES
Methodology
Dangerous by Design uses several metrics to assess relative danger to pedestrians across different
geographies and demographic characteristics. All pedestrian fatalities are reported within the 10-year
timeframe of 2008 to 2017 to account for any large variations in fatalities in a single year. The 2016 edition of
the report accounted for data between 2005 and 2014.
One measure of pedestrian fatality rates that this report cites across different demographic characteristics is
pedestrian fatalities per 100,000 people. This metric accounts for the number of pedestrian deaths that are
occurring within a certain population, while normalizing by the population itself. For example, all pedestrian
deaths of people over the age of 65, normalized by the total population of people over 65. All population, race,
age, and ethnicity data are from the 2012-2016 American Community Survey 5-year estimates, to ensure the
most up-to-date information at the time of this report.
Pedestrian Deaths
of Population A Pedestrian Deaths
100,000 per 100,000 people
Population A in Population A
24
The Pedestrian Danger Index (PDI) takes pedestrian deaths per 100,000 people and normalizes it by walking
rates. The count of pedestrian deaths or pedestrian deaths per 100,000 people may be much higher in an
urban area than a rural area; however, that doesn’t account for how many people are walking. For geographic
area PDI scores, such as the state and metropolitan statistical area (MSA)-level, walking rates are measured
with Census “Means of Transportation to Work” data. While walk-to-work percentage is merely a proxy for the
share of walking trips in an area, it is used because the metric is available uniformly across all states and the
top 100 metropolitan statistical areas.
For demographic analysis of pedestrian fatalities across age, race, and ethnicity, we use a variation of PDI
scores that includes the percentage of total trips that were walking trips is taken from the 2017 National
Household Travel Survey (NHTS). These data were used because they report walking trips by age, race, and
ethnicity as well as include walking percentage for all trips—not just journey to work trips. This information
allows relative danger by age, race, and ethnicity to reflect whether these populations tend to walk more or less
than the population as a whole. Due to the small sample size of the NHTS, the total percentage of walking trips
is only appropriate to use for comparisons across race, age, and ethnicity at the national level.
Pedestrian Deaths
100,000 Pedestrian
Population Danger
Index
Percentage of Walking TripsDANGEROUS BY DESIGN Appendices
NHTSA FARS data do not include information about the household income of individuals who are struck and
killed while walking; however, they do reveal where people are walking when they are killed. To analyze where
pedestrian fatalities occur relative to median household income of the surrounding area, fatalities were joined
to census tracts using GIS. The median household income of census tracts was grouped into quintiles to
determine high- and low- income communities. Pedestrian deaths were then aggregated into these 5 tract
types, and normalized by the population of the tracts. This analysis serves as a method to determine whether
pedestrians die disproportionately in low-income areas.
To calculate the number of fatalities by MSA, a spatial join was performed with the longitude and latitude as
reported by FARS. Approximately 126 fatalities did not include location data, and therefore there is a chance
that the estimate of deaths per MSA is conservative.
25DANGEROUS BY DESIGN Appendices
State1.Pedestrian
Table Danger
State Pedestrian Index,
Danger Index,2008-2017
2008-2017
Average Annual
Pedestrian Fatalities Pedestrian Fatalities 2019 Pedestrian
2019 Rank State
(2008-2017) per 100,000 (2008- Danger Index
2017)
1 Florida 5,433 2.73 182.0
2 Alabama 841 1.74 145.0
3 Delaware 250 2.67 127.1
4 Louisiana 1,047 2.25 125.0
5 Mississippi 551 1.84 122.7
6 Georgia 1,782 1.76 117.33
7 New Mexico 537 2.58 117.27
8 Texas 4,831 1.79 111.9
9 Arizona 1,503 2.23 111.5
10 South Carolina 1,144 2.37 107.8
11 Nevada 601 2.12 100.95
12 Tennessee 856 1.31 100.77
13 North Carolina 1,762 1.77 98.3
14 Oklahoma 596 1.54 85.6
15 Arkansas 427 1.44 84.7
16 California 7,127 1.84 68.2
17 Missouri 779 1.29 67.9
18 Maryland 1,059 1.78 65.9
19 Michigan 1,409 1.42 64.6
20 Kentucky 610 1.38 57.5
National Average 49,340 1.55 55.3
21 New Jersey 1,543 1.73 54.1
22 Indiana 725 1.10 52.4
23 Virginia 865 1.04 43.3
24 Utah 321 1.09 42.0
25 Connecticut 425 1.18 40.7
26 Ohio 1,058 0.91 39.6
26 27 West Virginia 214 1.16 38.7
28 Oregon 557 1.40 36.8
29 Colorado 590 1.10 36.7
30 Hawaii 226 1.60 36.4
31 Kansas 242 0.83 36.1
32 Illinois 1,323 1.03 33.2
33 Pennsylvania 1,502 1.17 30.0
34 Rhode Island 127 1.20 30.0
35 Washington 712 1.01 28.1
36 District of Columbia 101 1.53 26.8
37 Wisconsin 491 0.85 25.8
38 Idaho 121 0.74 25.5
39 Montana 130 1.27 24.9
40 North Dakota 62 0.84 24.7
41 New York 2,958 1.50 24.6
42 Maine 130 0.98 23.9
43 Minnesota 361 0.66 23.6
44 New Hampshire 97 0.73 23.6
45 Nebraska 116 0.62 23.0
46 Massachusetts 725 1.08 22.5
47 South Dakota 72 0.85 22.4
48 Wyoming 48 0.82 20.5
49 Iowa 210 0.68 19.4
50 Alaska 93 1.26 16.0
51 Vermont 50 0.80 13.8DANGEROUS BY DESIGN Appendices
Table 2. in
Change Change in Statewide
Statewide Pedestrian
Pedestrian Danger Danger Index Scores,
Index Scores, 2016-2019
2016-2018
State 2016 PDI 2019 PDI Change 2016-2019
Delaware 102.6 127.1 24.5
Georgia 98.1 117.3 19.2
District of Columbia 15.4 26.8 11.4
Texas 101.1 111.9 10.8
Tennessee 90.5 100.8 10.3
Nevada 91.2 101.0 9.8
Oklahoma 76.1 85.6 9.5
Mississippi 114.1 122.7 8.6
Alabama 136.6 145.0 8.4
Louisiana 117.1 125.0 7.9
Missouri 60.2 67.9 7.7
Oregon 30.7 36.8 6.1
Indiana 46.3 52.4 6.1
Connecticut 34.9 40.7 5.8
Nebraska 17.3 23.0 5.7
Kansas 30.5 36.1 5.6
Florida 177.0 182.0 5.0
New Mexico 112.8 117.3 4.5
Arkansas 80.6 84.7 4.1
Maine 19.9 23.9 4.0
California 64.4 68.2 3.8
Michigan 61.0 64.6 3.6
Ohio 36.3 39.6 3.3
Utah 38.9 41.9 3.0
Arizona 108.5 111.5 3.0
Colorado 33.7 36.7 3.0 27
Kentucky 54.9 57.5 2.6
North Dakota 22.2 24.7 2.5
Vermont 11.4 13.8 2.5
North Carolina 96.3 98.3 2.0
Virginia 41.4 43.3 1.9
Idaho 23.8 25.5 1.7
Washington 26.5 28.1 1.6
New Hampshire 22.2 23.6 1.4
Alaska 14.6 16.0 1.4
South Carolina 106.5 107.7 1.2
Minnesota 22.6 23.6 1.0
New York 24.0 24.6 0.6
Massachusetts 22.1 22.5 0.4
Wisconsin 25.6 25.8 0.2
Iowa 19.7 19.4 -0.3
Pennsylvania 30.3 30.0 -0.3
South Dakota 22.8 22.4 -0.4
Illinois 34.0 33.2 -0.8
Wyoming 22.0 20.5 -1.5
Hawaii 38.3 36.4 -1.9
New Jersey 56.1 54.1 -2.0
Montana 27.1 24.9 -2.2
Rhode Island 32.3 30.0 -2.3
West Virginia 41.6 38.7 -2.9
Maryland 77.8 65.9 -11.9You can also read