2030 BY THE NUMBERS The 2019 summary of the AIA 2030 Commitment - AIA Professional
←
→
Page content transcription
If your browser does not render page correctly, please read the page content below
2030 BY THE NUMBERS The 2019 summary of the AIA 2030 Commitment
ABOUT THE AMERICAN INSTITUTE OF ARCHITECTS

Founded in 1857, AIA consistently works to create more valuable,          AIA provides members with tools and resources to assist them in
healthy, secure, and sustainable buildings, neighborhoods, and            their careers and business as well as engaging civic and government
communities. Through more than 200 international, state, and local        leaders and the public to find solutions to pressing issues facing our
chapters, AIA advocates for public policies that promote economic         communities, institutions, nation, and world. Members adhere to a code
vitality and public wellbeing.                                            of ethics and conduct to ensure the highest professional standards.

ABOUT THIS REPORT

2030 By the Numbers: The 2019 Summary of the AIA 2030                     AIA does not sponsor or endorse any enterprise, whether public or
Commitment measures annual performance of the architecture and            private, operated for profit. Further, no AIA officer, director, committee
design community toward its goal of carbon neutral buildings by           member, or employee, or any member of its component organizations
2030. It includes data from calendar year 2019 and suggestions for        in his or her official capacity, is permitted to approve, sponsor,
improving performance year to year.                                       endorse, or do anything that may be deemed or construed to be an
                                                                          approval, sponsorship, or endorsement of any material of construction
Copyright © 2020. The American Institute of Architects.                   or any method or manner of handling, using, distributing, or dealing in
All rights reserved.                                                      any material or product.

Reproduction or use of the whole or any part of the contents of this      Cover photo by Emily Andrews.
publication without attribution or written permission of the copyright
holder is prohibited.                                                     Recommended bibliographic listing: The American Institute of
                                                                          Architects (2020 September). 2030 by the numbers: The 2019
This publication is designed to provide accurate and authoritative        Summary of the AIA 2030 Commitment.
information regarding the subject matter covered. It is published and
distributed with the understanding that the publisher is not engaged
in rendering professional services. If professional advice or other
expert assistance is required, the services of a competent professional
should be sought.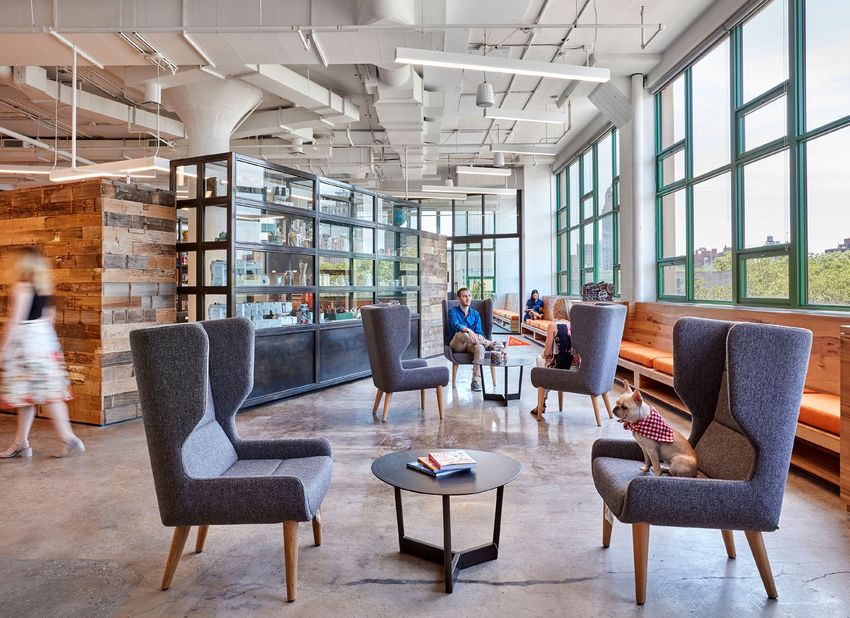
CONTENTS

Section 1. The 2030 Commitment.................................................................................................................................4            Section 4. Conclusion......................................................................................................................................................26
          Addressing climate change: A health, safety, and welfare crisis.............................................................5
          Companies reporting 2019 data ....................................................................................................................8               References ...........................................................................................................................................................................28
          What is the 2030 Commitment?................................................................................................................... 11                Acknowledgments.............................................................................................................................................................29
                                                                                                                                                                            Image credits..................................................................................................................................................................... 30
Section 2. A decade of progress................................................................................................................................... 13
          Change in energy use and CO2 emissions ................................................................................................ 15
          Energy codes drive performance...................................................................................................................17
          Energy modeling is essential......................................................................................................................... 18
          We’re in this together...................................................................................................................................... 19

Section 3. The next 10 years..........................................................................................................................................22
          Constant evolution...........................................................................................................................................23
          Advocacy in communities...............................................................................................................................24
          Off-site renewables.........................................................................................................................................24
          Embodied carbon.............................................................................................................................................24

This report has been updated since its original
publish date to clarify data and methodology.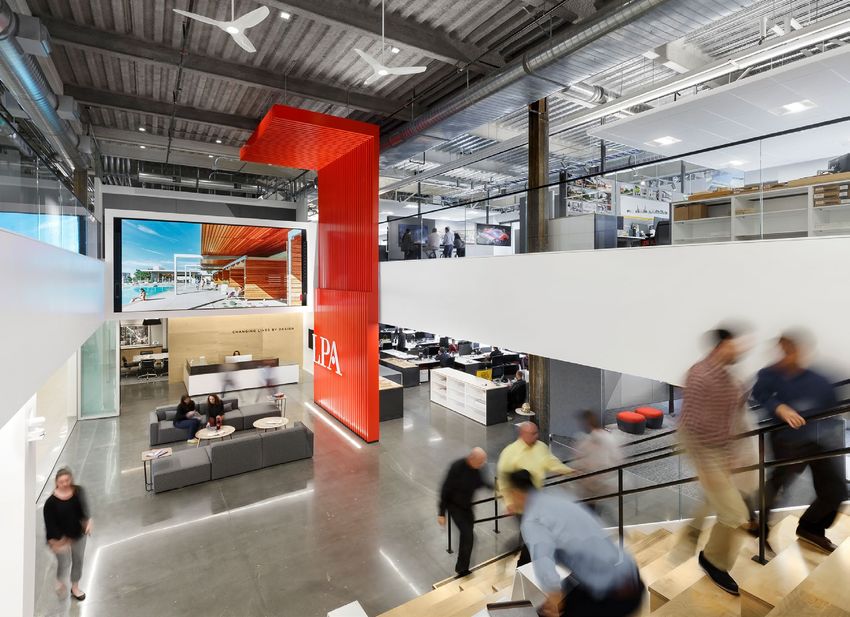
SECTION 1.

THE 2030
COMMITMENT

             Photo by Cris Costea
THE 2030 COMMITMENT

                                                                        A D D R E S S I N G C L I M AT E C H A N G E : A H E A LT H ,
                                                                        S A F E T Y, A N D W E L F A R E C R I S I S

                                                                        Each year design teams rally to report thousands of active projects
                                                                        to the AIA 2030 Commitment program. Established in 2009, the
                                                                        voluntary program asks architects, engineers, and the entire design
                                                                        profession to take robust action to address climate change and
                                                                        to report their progress toward achieving a carbon neutral built
                                                                        environment by the year 2030.

                                                                        In a normal year, the effort to report this progress is a commendable
                                                                        undertaking. This year—in the middle of a global pandemic, economic
                                                                        recession, and some of the largest civil rights demonstrations in U.S.
                                                                        history1—the sustained support for collective climate action is even
                                                                        more remarkable. Between January and August 4, 2020, more than
                                                                        300 companies reported energy savings data from calendar year
                                                                        2019 for this report. AIA urges all members of the design community
                                                                        to join these committed companies in climate action.

                                                                        Contributors to the program have shown how thousands of projects
                                                                        together can support the creation of a better, more sustainable built
                                                                        environment. The data demonstrates that climate action is achievable,
                                                                        and that the 2030 Commitment program is the pathway for progress.

                                                                        In 2019 alone, 311 companies reported 3.3 billion square feet across
                                                                        107 countries to the 2030 Commitment’s Design Data Exchange
                                                                        (DDx). These projects accounted for an overall 49% predicted energy
                                                                        use intensity (pEUI) reduction, which is equivalent to avoiding 20.2
                                                                        million metric tons of carbon dioxide emissions relative to 2030
                                                                        baseline-equivalent buildings. That figure represents the same level of
                                                                        carbon that is sequestered by 26.4 million acres of forest in one year.
                                       Photo by Alto Crew on Unsplash

A I A 2 0 3 0 BY T H E N U M B E R S                                                                                                              5
T H E 2 0 3 0 C O M M I T M E N T / Addressing climate change: A health, safety, and welfare crisis

                        2 0 1 9 AT A G L A N C E

                                              49%                        194                                107
                                              overall pEUI reduction.    whole-building projects            countries represented.
                                                                         are predicted to be zero
                                                                         net energy.

                                              311                                                           61%
                                              companies reported data.                                      of reported whole-building GSF
                                                                         15%                                has been energy modeled.
                                                                         of reported whole-building

                                              27                         GSF meets the 70% pEUI

                                              companies met the 70%
                                                                         reduction target.
                                                                                                            20.2 million
                                              predicted EUI (pEUI)                                          metric tons of CO2 emissions were
                                              reduction target.                                             avoided relative to 2030 baseline-
                                                                         33%                                equivalent buildings.
                                                                         of reported interior-only GSF

                                              20,331                     meets the 25% predicted lighting
                                                                         power (pLPD) reduction target.
                                              projects reported.

                                                                                                                                        Photo by Aziz Ayad on Unsplash

A I A 2 0 3 0 BY T H E N U M B E R S                                                                                                                                     6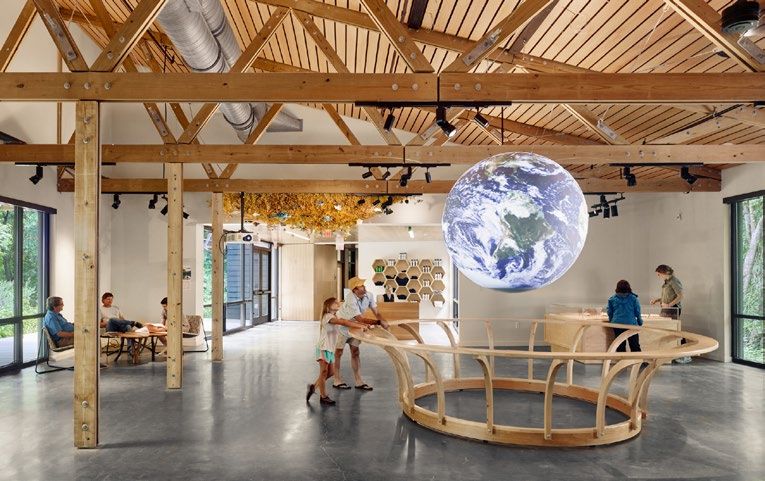
T H E 2 0 3 0 C O M M I T M E N T / Addressing climate change: A health, safety, and welfare crisis

                                                                          In addition to threatening public health, climate change—itself an
                                                                          existential threat—exacerbates systemic racial injustice and economic
        Climate change is a health,                                       crises3. Within the next four generations (by the year 2100), the earth
                                                                          could warm by 3 degrees Celsius4, and the costs of this crisis will be
        safety, and welfare crisis. Ignoring                              devastating—a loss to the global economy of $520 billion per year

        it would undermine our most                                       to start5. Climate change also will mean heightened competition for
                                                                          resources such as land, food, and water, and it will mean additional
        critical professional responsibility:                             mass population displacement6.

        to protect our clients, our                                       Rising sea levels, extreme weather events, and the degradation of
                                                                          natural resources are a direct result of increased carbon levels, which      The urban built environment is
        communities, and our earth.                                       threaten national security in addition to the global economy7. Rising
                                                                          carbon levels also disrupt the balance of ecosystems, undermine              responsible for 75% of annual
                                                                          public health, and threaten to transform our planet irreparably and
                                                                          compromise our future.                                                       global GHG emissions: Buildings
The improvement is significant, but with the climate crisis escalating,   The multiplier effects of climate change are far-reaching. Communities
                                                                                                                                                       alone account for 39%.
more needs to be done. This year’s average weighted pEUI                  of color are already disproportionately burdened by poor environmental       Source: Architecture 2030
reduction—49%—is the best in 2030 Commitment history, but it is           quality and may have limited access to information, resources, and
still less than 70% of the fossil fuel and energy reduction target set    institutions to prepare for and avoid the effects of climate change8. In
for active projects in 2019. With less than a decade left to meet our     order to prevent further loss of life, the design community must work even
industry’s 2030 deadline, it is time for every company—and every          harder to create a more resilient, equitable, and sustainable communities.
design professional—to act.
                                                                          The consequences of climate change are alarming, but they are not
While there is no current scientific consensus suggesting a               inevitable. Globally, buildings account for 39% of total greenhouse
direct connection between climate change and the emergence of             gas (GHG) emissions. The design industry is largely responsible for
COVID-19, there is widespread recognition that climate change             eliminating that output.
adversely impacts health and infectious disease occurrence.2 Failure
to address common root issues could make future pandemics more            Through their work, 2030 Commitment signatories make the
frequent and more severe.                                                 message clear that addressing climate change starts with the 2030
                                                                          Commitment, and it starts with just one project. Learn more about
The design industry must lead the way.                                    joining the 2030 Commitment on AIA’s website.

A I A 2 0 3 0 BY T H E N U M B E R S                                                                                                                                                     7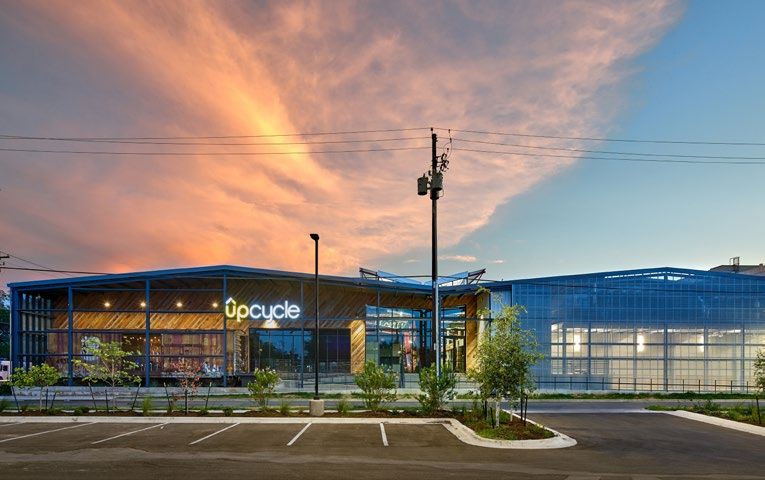
T H E 2 0 3 0 C O M M I T M E N T / Companies reporting 2019 data

            T H E S E C O M PA N I E S R E P O R T E D 2 0 1 9 D ATA

            Companies in green met the 70% pEUI reduction for 2019.

            Firm size: 1–9                                     Precipitate, PLLC                      Lehrer Architects LA, Inc.            archimania
            Access Architecture                                Robbins Architecture, Inc.             Maclay Architects                     Ashley McGraw Architects
            Arkin Tilt Architects                              Sam Rodell Architects AIA              Nano LLC                              Blackney Hayes Architects
            BLDGS                                              Speranza Architecture                  OPAL                                  BLT Architects
            Bright Common Architecture & Design                Studio Nigro                           Placetailor                           Braun and Steidl Architects
            Canopy Architecture + Design                       TBDA                                   Re:Vision Architecture                Brininstool + Lynch, Ltd.
            Chaac Simulaciones Inc                             Touloukian Touloukian Inc.             Richard + Bauer                       Bruner/Cott & Associates
            Coldham & Hartman Architects                       typ.                                   Rodwin Architecture                   BVH Architecture
            COULSON                                            Urban Design Perspectives              Ross Barney Architects                Caldwell Associates Architects
            DRAW Architecture + Urban Design                   WATERSHED LLC                          Salazar Architect Inc.                Carleton Hart Architecture
            DSGN                                               ZeroEnergy Design                      siegel & strain architects            CAW Architects, Inc.
            FIFTEEN Architecture + Design                                                             Smith-Miller + Hawkinson Architects   Curtis + Ginsberg Architects LLP
            Frederick + Frederick Architects                                                          SMNG A Ltd.                           Dake Wells Architecture
            gbA Architecture & Planning                        Firm size: 10–19                       Sol design + consulting               David Baker Architects
            High Plains Architects                             100 Fold Studio                        Studio Ma                             DIGSAU
            HPZS                                               Blair + Mui Dowd Architects, PC        The Green Engineer, Inc.              DS Architecture, LLC
            HUSarchitecture                                    Brooks + Scarpa Architects, Inc.       UrbanWorks, Ltd.                      DSK Architects + Planners
            In Balance Green Consulting                        English + Associates Architects, Inc   Vermont Integrated Architecture       DWL Architects + Planners Inc
            Jer Greene, AIA + CPHC                             Farr Associates                        Vinci-Hamp Architects, Inc.           Ehrlich Yanai Rhee Chaney Architects
            Ken Parel-Sewell Architects Inc.                   John Ronan Architects                                                        El Dorado
            Kipnis Architecture + Planning                     Johnson Roberts Associates, Inc.                                             emersion DESIGN
            Laura Garcia Design, Architecture | Consulting     Jones Studio, Inc.                     Firm size: 20–49                      Engberg Anderson Architects
            Marlene Imirzian & Associates Architects           Jones Whitsett Architects              Amenta Emma Architects                Feldman Architecture
            McLennan Design                                    Kaplan Thompson Architects             Anderson Brulé Architects             FF&P
            PATH Architecture                                  KOO LLC                                Anderson Mason Dale Architects        FFA Architecture and Interiors, Inc.
            Paul Poirier + Associates Archtiects               Kuhn Riddle Architects                 Ann Beha Architects                   Field Paoli Architects

A I A 2 0 3 0 BY T H E N U M B E R S                                                                                                                                               8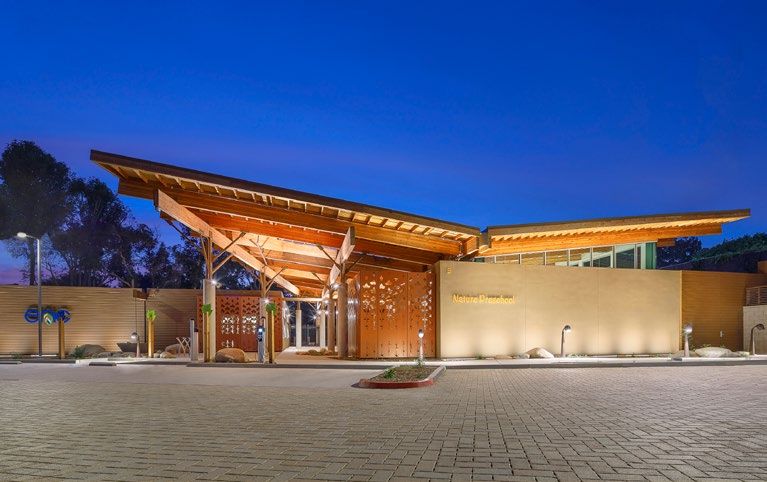
T H E 2 0 3 0 C O M M I T M E N T / Companies reporting 2019 data

            Finegold Alexander Architects              Pyatok Architecture + Urban Design           Bora Architects                         LSW Architects
            Flansburgh                                 RNT Architects                               Browning Day Mullins Dierdorf           M+A Architects
            GREC                                       SHKS Architects                              CambridgeSeven                          Mahlum Architects
            Green Hammer                               Snow Kreilich Architects                     Centerbrook Architects and Planners     McGranahan Architects
            Guidon Design                              The Sheward Partnership                      CO Architects                           Miller Dunwiddie
            Hahnfeld Hoffer Stanford                   Trahan Architects                            COOKFOX Architects                      MJMA
            HarrisonKornberg Architects                Trivers Associates                           CS&P                                    Montalba Architects, Inc.
            Hartshorne Plunkard Architecture           TruexCullins                                 Design Collective, Inc.                 Morrissey Engineering
            Helix Architecture + Design                Wheeler Kearns Architects                    DiMella Shaffer                         MSR
            Holly and Smith Architects                 William Rawn Associates                      Duda Paine Architects                   National Community Renaissance
            Holst Architecture                         Wright Heerema Architects                    ehdd                                    Opsis Architecture
            Howeler + Yoon Architecture, LLP           Yost Grube Hall                              ELS Architecture and Urban Design       Orcutt | Winslow
            ICON Architecture, inc.                                                                 Eskew+Dumez+Ripple                      Overland Partners Architects
            IKM Incorporated                                                                        Fennick McCredie Architecture, Ltd.     PCA, Inc
            Jensen Architects                          Firm size: 50–99                             GBD Architects Incorporated             Quattrocchi Kwok Architects
            JSA, Inc                                   5G Studio Collaborative                      Goody Clancy                            Ratcliff
            Kliment Halsband Architects                AC Martin                                    GSBS Architects                         RMW architecture & interiors
            Koning Eizenberg Architecture, Inc.        Adrian Smith + Gordon Gill Architecture      GWWO, Inc. Architects                   RVK Architects, Inc.
            Krueck + Sexton Architects                 Alliiance                                    Hacker                                  SHP Leading Design
            Landon Bone Baker Architects (LBBA)        ARC/Architectural Resources Cambridge, Inc   Hastings Architecture Associates, LLC   SRG Partnership, Inc.
            Leddy Maytum Stacy Architects              Architects Hawaii Limited                    Hennebery Eddy Architects, Inc          STG Design
            Leers Weinzapfel Associates                Arrowstreet                                  HMFH Architects, Inc.                   The Miller Hull Partnership
            Miller Dyer Spears, Inc.                   Atelier Ten                                  INVISION                                Utile
            Neumann Monson Architects                  BAR Architects                               KFA, LLP                                Valerio Dewalt Train Associates
            Noll & Tam Architects                      Bassetti Architects                          KSS Architects                          VMDO Architects
            Pappageorge Haymes Partners                Bergmeyer Associates                         Lake|Flato Architects                   Weber Thompson
            Pei Cobb Freed & Partners Architects LLC   bKL Architecture LLC                         Lavallee Brensinger Architects          WRT
            Pickard Chilton                            BNIM Architects                              Legat Architects

A I A 2 0 3 0 BY T H E N U M B E R S                                                                                                                                          9
T H E 2 0 3 0 C O M M I T M E N T / Companies reporting 2019 data

            Firm size: 100+                                  EUA                               Lemay                                             SERA Architects
            Albert Kahn Associates, Inc.                     EwingCole                         LHB, Inc.                                         Shepley Bulfinch
            Ankrom Moisan Architects, Inc.                   EXP                               Little Diversified Architectural Consulting       Smith Seckman Reid, Inc.
            Architectural Nexus, Inc.                        EYP                               LMN Architects                                    SmithGroup
            Ayers Saint Gross                                Flad Architects                   Looney Ricks Kiss (LRK Inc)                       SMRT
            Ballinger                                        FXCollaborative                   Lord Aeck Sargent                                 Solomon Cordwell Buenz
            Beyer Blinder Belle Architects & Planners, LLP   Gensler                           LPA, Inc.                                         SOM (Skidmore Owings & Merrill)
            Bohlin Cywinski Jackson                          GFF                               LS3P                                              Stantec Architecture
            Boulder Associates, Inc.                         GGLO                              Mazzetti                                          Steinberg Hart
            BuroHappold Engineering                          Gould Evans                       Mithun                                            Studio Gang Architects
            BWBR                                             Gresham Smith                     Moody Nolan                                       STUDIOS architecture
            CallisonRTKL                                     Grimm and Parker                  Moseley Architects                                The Beck Group
            Cannon Design                                    Handel Architects, LLP            NAC Architecture                                  The SLAM Collaborative
            CBT Architecture                                 Hargis Engineers, Inc.            NBBJ                                              Thornton Tomasetti
            Clark Nexsen                                     Harley Ellis Devereaux            Olson Kundig                                      tk1sc
            Cooper Carry                                     HDR                               OPN Architects                                    TLC Engineering Solutions
            Corgan                                           HGA Architects and Engineers      Otak, Inc                                         TreanorHL
            CTA Architects Engineers                         HKS                               Payette                                           tvsdesign
            Cuningham Group Architecture, Inc.               HLW International, LLP            Pelli Clarke Pelli Architects                     Vanderweil Engineers
            Dattner Architects                               HMC Architects                    Perkins + Will                                    WDG Architecture
            Davis Partnership Architects                     HOK Inc.                          Perkins Eastman                                   Wight & Company
            Dekker/Perich/Sabatini                           Hord Coplan Macht                 Quinn Evans Architects                            WRNS Studio
            DES Architects + Engineers                       Huntsman Architectural Group      RATIO Architects                                  ZGF Architects LLP
            Dewberry                                         Jacobs                            RDG Planning & Design
            DIALOG                                           JLG Architects                    Retail Design Collaborative & Studio One Eleven
            DLR Group                                        KieranTimberlake                  Robert A. M. Stern Architects
            Elness Swenson Graham Architects, Inc            Kirksey                           RSP Architects
            Ennead Architects                                Kohn Pedersen Fox Associates PC   Sasaki Associates

A I A 2 0 3 0 BY T H E N U M B E R S                                                                                                                                               10
T H E 2 0 3 0 C O M M I T M E N T / What is the 2030 Commitment?
W H AT I S T H E 2 0 3 0 C O M M I T M E N T ?
Fossil fuel consumption reduction
Off-site renewable energy
The 2030 Commitment aims to transform the practice of
Fossil fuel consumption
architecture to respond to the climate crisis in a way that is
holistic, firm-wide, project-based, and data-driven. In short,
to build a better world for future generations, signatories
have committed to transform their practices to deliver
Fossil fuel consumption reduction
carbon neutral buildings by 2030. They demonstrate their
Off-site renewable energy progress by reporting the design performance of their entire
Fossil fuel consumption portfolio to AIA each year.
60% 70% 80% 90% Carbon
Neutral AIA uses two easy-to-calculate metrics to gauge progress:
• Predicted energy use intensity (pEUI) for whole-
building projects; and
• Predicted lighting power density (pLPD) for interior-
only projects.
60% 70% 80% 90% Carbon AIA’s metrics, targets, and goals mirror those established by
Neutral
Ed Mazria’s nonprofit Architecture 2030. In 2006, Mazria
delivered a bold challenge to the design community: All
new buildings, developments, and major renovations should
2010 2015 Today 2025 2030
be carbon neutral by 2030. Mazria’s challenge outlined
progressively more challenging fossil fuel and energy
reduction targets, including a 70% reduction in 2019 and
80% reduction in 2020. Within six months of Mazria’s
challenge, AIA adopted the challenge, paving the way to the
2030 Commitment.
2010 2015 Today 2025 2030
A I A 2 0 3 0 BY T H E N U M B E R S 11THE 2030 COMMITMENT
L A K E | F L AT O
How to get started on a 2030 Commitment
Lake|Flato was one of the first design companies to sign onto the 2030 Commitment. Because the firm already had a
reputation for incorporating sustainability into design, the initiative was a natural fit for its architects. During that inception
period, the company’s leaders met regularly with other firms to create action plans and to discuss how to best track and report
data. “That work was foundational,” said Lake|Flato Sustainability Director Heather Gayle Holdridge, Assoc. AIA.
Today Lake|Flato routinely advises design companies that want to make sustainability part of their normal practice. Holdridge
said, “The program I always point these firms to is the 2030 Commitment. I tell them if they want to make this issue part of their
culture, AIA’s program is the tool to make that happen.”
Another piece of advice Holdridge gives industry colleagues is that addressing climate change “is about each project, and it
is about the whole portfolio.” Not every client will ask about sustainability, but if a firm makes it part of its consistent practice,
those projects can also have a positive impact on efforts to reduce emissions and energy use.
In 2019, Lake|Flato was named Architecture magazine’s top firm in the United States, in part for its significant commitment to
sustainability. In 2020, Lake|Flato received two more COTE® Top Ten Awards, for collaborations on the Austin Central Library
and the Marine Education Center at the Gulf Coast Research Laboratory in Mississippi.
Check out The Habits of High-Performance Firms to learn more about Lake|Flato’s sustainability efforts.
Photos by Casey Dunn
A I A 2 0 3 0 BY T H E N U M B E R S 12SECTION 2.
A DECADE OF
PROGRESS
Photo by Garrett RowlandA DECADE OF PROGRESS
CHANGES IN US GDP AND BUILDING SECTOR FLOOR AREA, ENERGY USE, AND CO 2 EMISSIONS (2005–2019) CHANGE IN ENERGY USE AND
CO2 EMISSIONS
30%
GDP (real)
25% +26.2% Ten years strong, the 2030 Commitment offers a
clear, measurable way to reduce a building’s share
20%
l)
Building sector of greenhouse gas emissions. According to an
rea
DP ( floor area
Architecture 2030 analysis, building sector carbon
US G
Percentage change since 2005
15% +18%
(+47 billion sf) dioxide emissions are down 21% since 2005 even
10% re a though more than 47 billion square feet of built
or a
Flo space have been added in the United States since
5% then9. The majority of this improvement happened
after AIA started collecting 2030 Commitment
0%
Building sector project data in 2010.
E ne rg y us energy use
-5% e -1.7 %
-10%
CO
2 em
-15% i ss
ion
s
-20% Building sector
CO2 emissions
-21%
2005 l l 2008 l l 2011 l l 2014 l l 2017 l 2019
Source: Architecture 2030, US Energy Information Administration, Annual Energy Outlooks, Multpl.com (US GDP)
A I A 2 0 3 0 BY T H E N U M B E R S 142.0B
pEUI % Reduct
1.9B
30%
GSF
1.5B
1.5B
1.0B 1.2B 20%
A D E C A D E O F P R O G R E S S / Change in energy use and CO2 emissions
0.5B
.58B 10%
.13B
WHOLE
2010 BUILDING
2011 GSF/pEUI
2012 % REDUCTION
2013 2014 YEAR
2015 OVER
2016YEAR 2017 2018 2019
3.0B
49% pEUI % reduction As the 2030 Commitment continues to grow,
50%
44%
46% signatories are making demonstrable progress
2.9B GSF whole building
2.5B INTERIOR ONLY GSF/pLPD % REDUCTION
42% YEAR OVER YEAR toward the program goals. Although the pLPD
2.6B
38.1% 2.4B 40% percent reduction for interiors projects slipped to
37% 36.9%
600M 35% 34.6% 2.3B
pEUI % Reduction
34%
2.0B 2.2B 35% 18% this year, the average pEUI percent reduction
31%
1.9B for whole-building projects is the highest ever—49%.
500M 30%
30%
GSF
1.5B
482M
1.5B 458M
pLPD % Reduction
23.6% 23% 433M 25%
This year, 311 2030 Commitment signatories
400M 1.2B 22%
1.0B 21% 21%
20% 390M 400M 399M
20% reported 3.3 billion gross square feet (GSF) for their
18%
2030 Commitment projects. That area is nearly the
GSF
21% 20%
300M 17%
0.5B
.58B 10% size of New Mexico.
255M 15%
200M
.13B
While this progress is remarkable, it is not enough.
2010 2011 2012 2013 2014 2015 2016 2017 2018 2019 10%
124M
We remain below the 70% reduction target, which
100M
80M pEUI % reduction
5% increased to 80% in 2020, and are still short of
34M the immediate 50% reduction target called for by
INTERIOR ONLY2013
GSF/pLPD % REDUCTION YEAR OVER YEAR2018 GSF whole building
2010 2011 2012 2014 2015 2016 2017 2019 Architecture 2030 in 2006. The good news: The design
600M LPD industry can still meet the targets—if it acts now.
35%
31% GSF interior
500M 30%
Ten years into the 2030 Commitment, it is evident
482M that zero net carbon design is possible. Progressive
458M
pLPD % Reduction
23.6% 23% 433M energy codes and policies can work. Energy modeling
400M 25%
22%
21% 21% 400M
20% 390M 399M
18%
can lead to better decision-making. And we know
GSF
21%
300M 17%
20% that 2030 Commitment signatories can meet the
challenges of our times.
255M 15%
200M
10%
100M 124M
80M 5%
34M
2010 2011 2012 2013 2014 2015 2016 2017 2018 2019
LPD
A I A 2 0 3 0 BY T H E N U M B E R S 15
GSF interiorA DECADE OF PROGRESS
L PA , I N C.
Implementing the 2030 Commitment at scale
LPA, Inc., an integrated design firm with six offices in California and Texas, is the largest firm to exceed the 70% pEUI reduction
target in 2019. In 2019 alone, LPA reported more than 6 million GSF, demonstrating that the 2030 Commitment can be met at
scale. LPA also surpassed the target in 2018, reporting more than 5 million GSF across education, civic, and commercial projects.
“The 2030 AIA Commitment has helped us clearly define our goals across the firm,” says LPA President Dan Heinfeld, FAIA.
“Every designer understands the need to collaborate and work with the other disciplines from an early stage to hit the goals.”
The nature and location of their practice offers distinct advantages. As an integrated firm, LPA is able to easily engage all
disciplines in project goal-setting and iteratively prototype and evaluate options through design. California’s rigorous Building
Energy Efficiency Standards (Title 24, Parts 6 and 11) require energy modeling; in 2004 LPA implemented a firm-wide goal of
surpassing Title 24 standards by 25% in all projects.
Since joining the 2030 Commitment in 2011, LPA has optimized these inherent advantages by investing in staff education and
infrastructure. “We understood early in the process that added rigor and structure would be needed to ensure that every project
team understood their baselines, set targets and measured progress,” observed Heinfeld. “That required additional education
and training to help project teams be successful.”
Teams are encouraged to repeatedly revisit targets through the design process to track progress, study and compare design
concepts using a variety of tools, and learn from 2030 Commitment data across the firm. “The reporting data gives us a better
understanding of our strengths and weaknesses by creating a feedback loop,” shared Heinfeld. “It can also be shared with clients
to support performance innovation.”
Check out Five tips for meeting the 2030 Commitment for more insights from the LPA team.
Photos by Cris Costea
A I A 2 0 3 0 BY T H E N U M B E R S 16A D E C A D E O F P R O G R E S S / Energy codes drive performance
ENERGY CODES DRIVE PERFORMANCE
pEUI % REDUCTIONS IN BUILDING ENERGY CODES (2000–2019)
100%
Two key factors driving performance improvement
CBECS-2003 (Status in year 2000)
are energy code adoption and energy modeling.
According to analysis by Pacific Northwest National
80%
ASHRAE 90.1 Laboratory and the New Buildings Institute, more
IECC
recent energy codes are nearly 50% more efficient
than they were in 200010.
2030 Target
60% Linear (ASHRAE 90.1) The design industry must advocate for adoption
of a modern set of rules. AIA and our allies
Linear (IECC)
successfully advocated for the International Energy
Conservation Code (IECC) to pass the ZERO Code
40%
Renewable Energy Appendix in the IECC-2021,
which will accelerate progress in jurisdictions where
it is adopted. The ZERO Code integrates cost-
effective energy efficiency measures with on-site
20%
and/or off-site renewable energy resulting in zero
net carbon buildings.
2000 2005 2010 2015 2020 2025 2030
A I A 2 0 3 0 BY T H E N U M B E R S 17A D E C A D E O F P R O G R E S S / Energy modeling is essential
ENERGY MODELING IS ESSENTIAL
In addition to codes, energy modeling is one of
AVERAGE pEUI % REDUCTION FOR OFFICE IN BOULDER, COLORADO
the best ways for the design industry to iteratively
WITH & WITHOUT ENERGY MODELING
quantify the impact its design decisions have on
energy use, compare design options, and determine
Modeled 54% potential savings. In 2019 alone, projects that
used energy modeling were 32% more energy
Not modeled 42% efficient than non-modeled projects. That means if
a company is not modeling, it is leaving real energy
pEUI % reduction
and costs savings for its clients on the table.
When conducted early and often in the design
The average medium-sized office building in Boulder, Colorado, might not hit the 2030 process, energy modeling helps designers test design
targets, but energy modeling helps bridge the gap. When modeled, 40,000–60,000 sq. ft. solutions to cost-effectively optimize performance
office projects in Boulder are, on average, 29% more energy efficient than their non-modeled beyond energy in order to improve occupant comfort
counterparts. That improvement saves 133,400 kWh of electricity and nearly $14,200 each year. and resilience. AIA’s Architect’s Guide to Building
Performance helps architects better integrate building
performance simulation into their design process.
A I A 2 0 3 0 BY T H E N U M B E R S 18A D E C A D E O F P R O G R E S S / We’re in this together
WE’RE IN THIS TOGETHER
2030 SIGNATORIES YEAR OVER YEAR
By the end of calendar year 2010, 135 architecture,
800 engineering, and planning companies had joined the
2030 Commitment. The number of signatories has
700 grown every year since, and by the end of calendar
year 2019, 682 companies, including four engineering
682
companies, were a part of the movement.
600
Additionally, the program’s first building owner—a
500 549
nonprofit affordable housing developer—joined in 2019.
462
400 Notably, there is a gap between the total number
398 of signatories and those who are submitting data
300 346 annually. New signatories, who are not expected
296
to report data for their join year, account for part—
256 but not all—of the gap. Tackling climate change
200 236 will require continued commitment and leadership
208
from current and future signatories. AIA’s 2030
100 135 Commitment offers a simple, measurable framework
for the next 10 years.
0
2010 2011 2012 2013 2014 2015 2016 2017 2018 2019
A I A 2 0 3 0 BY T H E N U M B E R S 19A D E C A D E O F P R O G R E S S / We’re in this together
N E W S I G N AT O R I E S I N 2 0 1 9
Firm size: 1–9 Guy Burnett Architects Symbiotic Living Architecture + Design schacht aslani architects
Access Architecture Harboe Architects, PC through design LLC Shelter Architecture
AJA Architecture and Planning HUSarchitecture Todd Jersey Architecture Skender
atelierRISTING Ken Parel-Sewell Architects Inc. Tonic Design Professional Corp SMNG A Ltd.
Azizi Architects, Inc. Kennard Architects typ. SMP Architects
BLDGS Lassel Architects PA unabridged Architecture Sol design + consulting
BluPath Design Lightvox Studio UrbanLab Studio Completiva
Bright Common Architecture & Design Linda Daniel, Architect, LLc Valeria Thomas Roszak Architecture
Canopy Architecture + Design Loci Architecture and Design llc Vladimir Radutny Architects Turowski2 Architecture, Inc.
Chatham Hill Design and Build, LLC Macht Architecture WATERSHED LLC Vinci/Hamp Architects Inc.
Civistruct Integrated Systems Limited mahmoud Wittman Estes Architecture + Landscape von Weise Associates
CLUAA Mark A. Cuellar Design + Build Yoshihara McKee Architect Woodhouse Tinucci Architects
DE Architects MARPILLERO POLLAK ARCHITECTS
DERN Architecture + Development MIR Collective, LLC
DesignBridge, Ltd. MJB Architects, llc Firm size: 10–19 Firm size: 20–49
Designs for Life LLC OLSHESKY DESIGN GROUP LLC Blitch Knevel Archs., LLC Anderson Brulé Architects
dSPACE Studio ORCHESTRA Design Studio CABE ARQUITETOS Anderson Mason Dale Architects
Dynerman Architects pc Peter Spellman Architecture Dyron Murphy Architects P.C. architecture +
École d’Architecture d’Abidjan Rivetna Architects Inc. Jones Whitsett Architects AXIS Architecture + Interiors
Ewers Architecture Robbins Architecture, Inc. Kennedy & Violich Architecture Bailey Edward
Francois de Menil Architect, PC Saltans Architects_International, Ltd. Kevin Daly Architects Brininstool + Lynch, Ltd.
greengrids Sam Rodell Architects AIA Lothan Van Hook DeStefano Architecture CAW Architects, Inc.
Griffy Creek Studio LLC Speranza Architecture Re:Vision Architecture DREAM Collaborative
GRN VISION LLC Stemach Design & Architecture Salazar Architect Inc. DSK Architects + Planners
A I A 2 0 3 0 BY T H E N U M B E R S 20A D E C A D E O F P R O G R E S S / We’re in this together
FF&P Architects Hawaii Limited Huntsman Architectural Group
Field Paoli Architects Cordogan Clark & Associates Architects Integrated Environmental Solutions Ltd.
Flansburgh Architects Engineers Integrus Architecture
Gary Lee Partners GastingerWalker& JCJ Architecture
Holabird & Root Hasenstab Architects, Inc. Kohn Pedersen Fox Associates PC
Hufft Projects Lavallee Brensinger Architects Lamar Johnson Collaborative
Jensen Architects LSW Architects Lemay
Kliment Halsband Architects Miller Dunwiddie LRK Inc.
Kobi Karp Montalba Architects, Inc. NELSON Worldwide LLC
Koning Eizenberg Architecture, Inc. Morrissey Engineering SMRT
Morgante Wilson Architects National Community Renaissance tk1sc
Newman Architects rlf
Noll & Tam Architects Sheehan Nagle Hartray Architects
PBDW Architects STG Design
SoL Harris/Day Architecture Studio 8 Architects
Spacesmith LLP Taylor Design
Trahan Architects
TruexCullins
Waggonner & Ball Firm size: 100+
WSA Studio DES Architects + Engineers
EUA
GBBN
Firm size: 50–99 Ghafari Associates, LLC
ALLEY POYNER MACCHIETTO Hargis Engineers, Inc.
ARCHITECTURE Hoefer Wysocki Architects LLC
A I A 2 0 3 0 BY T H E N U M B E R S 21SECTION 3.
THE NEXT
10 YEARS
Photo by BNIMTHE NEXT 10 YEARS
C O N S TA N T E V O L U T I O N
“There are some new notable initiatives coming from
Ten years ago, the earliest 2030 Commitment signatories used an
the 2030 Commitment. One will be the integration of elaborate spreadsheet to calculate and report their performance
against 2030 Commitment targets. Hours of work boiled down to a
off-site renewable energy for projects and incorporating handful of data points.
carbon calculations in addition to predicted energy use Today, 2030 Commitment signatories are able to share more
information in less time through the Design Data Exchange (DDx).
calculations. There is a strong push to have more firms Firms can quickly visualize their portfolio projects and compare their
projects to those around the world that are similar in size and scale.
have their project energy modeled, which allows you
As we look ahead to the next 10 years, the 2030 Commitment
to make real-time improvements while still early in the program, tools, and resources will evolve to support industry-wide
climate action. AIA will continue to advocate for effective polices,
design phase of a project.” support contributions from off-site renewables in 2030 reporting,
and increase literacy around embodied carbon.
– Nate Kipnis, FAIA, 2030 Commitment Working Group 2018-2019 Co-Chair
Photo by Nathan De Fortunato on Unsplash
A I A 2 0 3 0 BY T H E N U M B E R S 23THE NEXT 10 YEARS
ADVOCACY IN COMMUNITIES O F F - S I T E R E N E WA B L E S EMBODIED CARBON
Through AIA’s 2030 Commitment, signatories have committed to Historically, the 2030 Commitment allowed signatories to account for Operational carbon is only one piece of the climate action puzzle
making the moral and financial case to clients to help them better only on-site renewables when calculating a project’s pEUI. This decision for the built environment. In order to meet international targets, the
understand and support the need to integrate renewable energy was intended to encourage signatories to pursue energy-efficient design community will need to embrace embodied carbon in their
sources into all buildings, making them more sustainable, resilient, design strategies before pursuing off-site renewable energy options. designs and decision-making.
and economical.
As we move closer to the 2030 deadline for carbon neutral buildings, Embodied carbon refers to all the carbon emitted during the
But we are not calling on only architects to act. The design community including on-site and off-site renewable energy sources becomes more manufacturing and transport of materials and during building
and its partners must work with civic and elected officials to change important than ever. Indeed, for some project types in some cities, off- construction. For architects, embodied carbon is a crucial metric to
local, state, federal, and international public policy for existing site renewable energy may be essential for hitting the targets. consider. Unlike operational carbon, which can be reduced during a
commercial and residential buildings, and it must work to improve building’s lifetime, embodied carbon is locked in as soon as a building
mandates for future construction. As a result, AIA is currently exploring options to factor off-site is completed. It can never be recaptured.
renewables into DDx calculations and hopes to introduce it in
From testifying before Congress to advocating adoption of the the next year. It is for this reason that in 2018 AIA began tracking major renovations.
ZERO Code Renewable Energy Appendix locally, 2030 Commitment More than four in five (82%) U.S. commercial buildings were
signatories are powerful partners as AIA advocates for policies that constructed before 2000, prior to the establishment of modern
increase renewable energy use, decrease reliance on fossil fuels, and building energy codes11. Addressing the climate crisis will require
improve all buildings’ ability to withstand extreme weather. retrofitting existing infrastructure to maximize embodied carbon
already in place and increasing operational energy efficiency.
The importance of embodied carbon is also why AIA is working with
“Energy efficiency and energy sourcing are not a replacement for one industry leaders to build out lifecycle assessment tracking options in
another. We must address both. It is of paramount importance that buildings the DDx.
be built and renovated to consume less energy, and, wherever possible, Enabling users to track embodied carbon will not impact calculations
toward the 2030 fossil fuel and energy reduction targets, but it
buildings should produce clean energy to put back into the energy grid.” will allow architects to evaluate the environmental impacts of
their designs more accurately. Going forward, 2030 Commitment
– Julie Hiromoto, AIA, AIA Committee on the Environment 2020 Chair signatories will be better equipped to know exactly how they can
reduce or eliminate these emissions during the design process.
A I A 2 0 3 0 BY T H E N U M B E R S 24THE NEXT 10 YEARS
GENSLER
Bold design strategies offer embodied and operational carbon savings
A leader in design globally, Gensler’s UPCycle project in East Austin, Texas, demonstrates how smart design strategies can do
triple duty: save money, increase energy efficiency, and minimize embodied carbon.
UPCycle, which earned a 2020 COTE® Top Ten Award, transforms the former Balcones Recycling Center into a unique
innovative office building. Rather than building from scratch, the client prioritized adaptive reuse to help preserve and improve
neighborhood character and honor existing resources. By prioritizing low-cost, high-impact materials, including reclaimed
wood and steel panels, Gensler delivered the project for $84 per square foot, a cost significantly less than the going rate for new
commercial construction in the East Austin area.
The design team introduced new skylights and a clerestory to bring natural light into the center of the large existing floor plate.
This approach will provide occupants with improved lighting conditions and reduce electricity use. Ultimately, the Gensler team
achieved a 63% pEUI reduction.
Gensler also incorporated a decoupled ventilation system with an energy recovery wheel—a feature atypical for a building of this
size that will allow energy to be transferred from the incoming hot and humid air stream to the exhaust air, reducing the need for
annual cooling energy. Gensler also chose an air-cooled chiller system to eliminate the need for rooftop package equipment that
would have increased the structural system. This decision will cut the carbon impact of the project by reducing the structure and
improving the building’s energy performance above the code minimum rooftop package units.
Check out other 2020 COTE® Top Ten Award recipients for more inspiring case studies.
Photos by Dror Baldinger
A I A 2 0 3 0 BY T H E N U M B E R S 25SECTION 4.
CONCLUSION
Photo by Robert DeitchlerCONCLUSION
The design sector is at an inflection point. Every action we do not take From 10 years of the 2030 Commitment, we know design changes
By joining the
today compounds our challenges tomorrow. can reduce climate impact significantly. We know progress is possible,
and we have the technology, the knowledge, and the tools to make an
We must acknowledge the accomplishments of our growing immediate impact.
community of 682 companies while pushing ourselves—and our
peers—to further move the needle. While commendable, it is necessary AIA remains committed to climate action. Will you join us? 2030 Commitment,
to move beyond 49% pEUI reductions and to embrace energy
modeling on all our projects. your firm:
As a profession, the design community has the responsibility to • Helps create more sustainable, resilient communities for all
prioritize and support effective actions to exponentially decelerate the individuals and families, particularly those who will pay the
production of greenhouse gases contributing to climate change. greatest costs of environmental degradation;
• Saves clients’ money by integrating energy analysis and
metrics into your practice;
• Boosts its profile by developing new sustainability
approaches and exemplifying sustainable design;
“This is a defining moment for the Institute. We are making this • Allows architects, engineers, designers, and builders to
join a growing movement dedicated to addressing climate
our top priority in order to address the crisis our communities face. change; and
Moving the needle on this critical issue—that threatens the future of • Demonstrates a commitment to addressing climate change
our planet and humanity—requires our firm commitment to achieving in concrete, verifiable ways.
carbon neutral goals in the built environment and our immediate
action. It’s imperative that the industry acts today.”
– William J. Bates, FAIA, AIA 2019 President
A I A 2 0 3 0 BY T H E N U M B E R S 27REFERENCES
1 Buchanan, L., Bui, Q., and Patel, J. K. (2020, July 03). Black Lives Matter may be the largest 8 Ebi, K.L., J.M. Balbus, G. Luber, A. Bole, A. Crimmins, G. Glass, S. Saha, M.M. Shimamoto, J.
movement in U.S. history. New York Times. Retrieved from http://www.nytimes.com. Trtanj, and J.L. White-Newsome. (2018). Impacts, risks, and adaptation in the United States:
Fourth national climate assessment, Volume II. U.S. Global Change Research Program.
2 McMichael, A.J. (Ed.).(2003). Climate change and human health: Risks and responses.
Retrieved from http://nca2018.globalchange.gov.
Summary. World Health Organization. Retrieved from https://www.who.int/globalchange/
environment/en/ccSCREEN.pdf?ua=1. 9 Architecture 2030. (2020, February). Unprecedented: A Way Forward! Architecture 2030.
Retrieved from https://architecture2030.org/unprecedented-a-way-forward/.
3 Ebi, K.L., J.M. Balbus, G. Luber, A. Bole, A. Crimmins, G. Glass, S. Saha, M.M. Shimamoto, J.
Trtanj, and J.L. White-Newsome. (2018). Impacts, risks, and adaptation in the United States: 10 Edelson, J. (2016). Zero Energy Performance Index (zEPI). New Buildings Institute. Retrieved
Fourth national climate assessment, Volume II. U.S. Global Change Research Program. from https://newbuildings.org/wp-content/uploads/2015/06/nbi_zEPI_FAQ_2016.pdf.
Retrieved from https://nca2018.globalchange.gov
11 Logan, K. (2019). Renovate, retrofit, reuse: Uncovering the hidden value in America’s existing
4 United Nations Environment Programme. (2019). Emissions gap report 2019. Retrieved from building stock. The American Institute of Architects. Retrieved from http://content.aia.org/sites/
https://www.unenvironment.org/resources/emissions-gap-report-2019. default/files/2019-07/RES19_227853_Retrofitting_Existing_Buildings_Report_Guide_V3.pdf.
5 U.S. Global Leadership Coalition. (2020). Climate change and the developing world: A
disproportionate impact. Retrieved from https://www.usglc.org/resources/climate-change-
and-the-developing-world-a-disproportionate-impact/
6 Rigaud, K.K., de Sherbinin, A., Jones, B., Bergmann, J .,Clement, V., Ober, K., Schewe, J.,
Adamo, S., McCusker, B., Heuser, S., and Midgley, A. (2018). Groundswell: Preparing for
internal climate migration. World Bank. Retrieved from https://openknowledge.worldbank.org/
handle/10986/29461.
7 Ebi, K.L., J.M. Balbus, G. Luber, A. Bole, A. Crimmins, G. Glass, S. Saha, M.M. Shimamoto, J.
Trtanj, and J.L. White-Newsome. (2018). Impacts, risks, and adaptation in the United States:
Fourth national climate assessment, Volume II. U.S. Global Change Research Program.
Retrieved from http://nca2018.globalchange.gov.
A I A 2 0 3 0 BY T H E N U M B E R S 28ACKNOWLEDGMENTS
2030 Commitment working group AIA staff
Co-chairs Paola Capo Michele Russo
Gwen Fuertes, AIA, Leddy Maytum Stacy Architects Kathy Compton Saif Sadeq
Tate Walker, AIA, OPN Architects Jessie Cornelius Frank Scanlan
Sarah Dodge Cindy Schwartz
David Arkin, AIA, Arkin Tilt Architects Erin Egan Terri Stewart, Hon. AIA
Tyler Ashworth, AIA, ZGF Architects Jessyca Henderson, AIA, Esq. Melissa Wackerle
Rachel Bannon-Godfrey, Assoc. AIA, Stantec Kara Kempski Matthew Welker, Assoc. AIA
Barbra Batshalom, Sustainable Performance Institute Anne Law, Esq.
Heather Gayle Holdridge, Assoc. AIA, Lake | Flato Architects Clint Manning Consultants
Vanessa Hostick, AIA, HOK Inc. Jessica Mentz Theodore Fischer
Nathan Kipnis, FAIA, Kipnis Architecture+Planning Melissa Morancy, Assoc. AIA Kerrie Rushton
Andrea Love, AIA, Payette Associates Stacy Moses Kevin Settlemyre
Erin McDade, Assoc. AIA, Architecture 2030 Praveen Patel
Ashley Mulhall, AIA, orcutt | winslow
A I A 2 0 3 0 BY T H E N U M B E R S 29IMAGE CREDITS
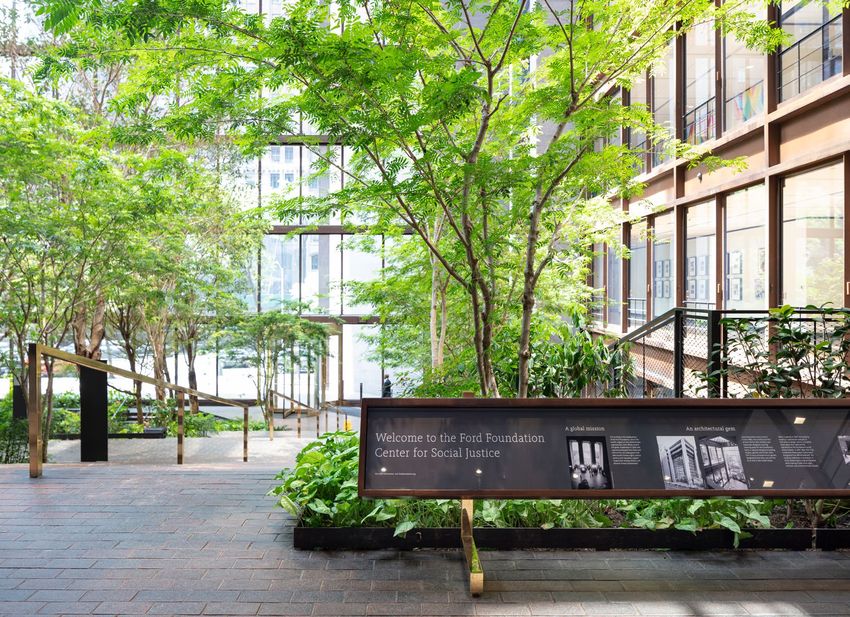
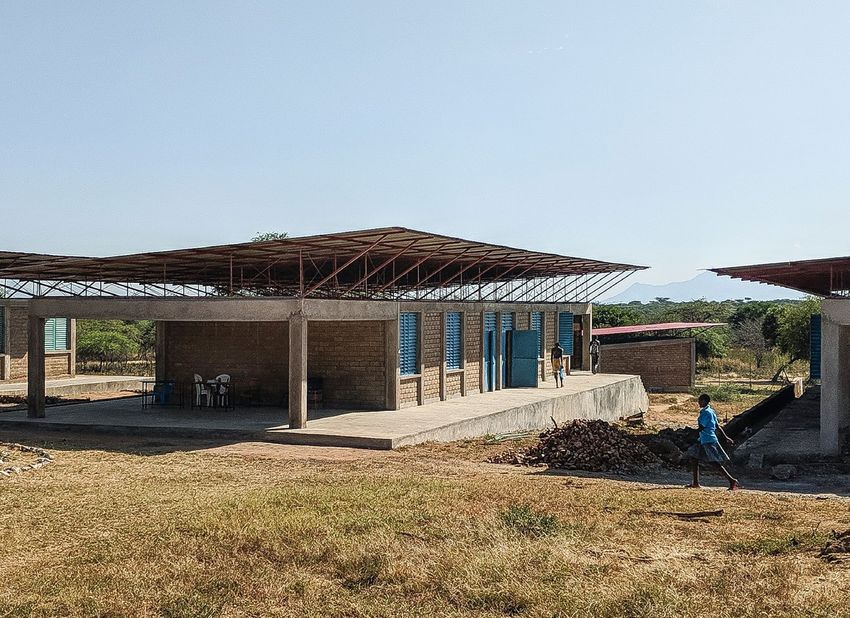
Cover Page 13 Page 22
Etsy Headquarters Etsy Headquarters Asilong Christian High School
Architect: Gensler Architect: Gensler Architect: BNIM
Photo credit: Emily Andrews Photo credit: Garrett Rowland Photo credit: BNIM
57% predicted reduction from national average EUI for building type. 57% predicted reduction from national average EUI for building type. 100% predicted reduction from national average EUI for building type.
This project received a 2020 COTE® Top Ten Award. This project received a 2020 COTE® Top Ten Award. This project received a 2019 COTE® Top Ten Award.
Page 4 Page 16 Page 25
LPA Irvine Studio (Top) Environmental Nature Center and Preschool (All photos) UPCycle
Architect: LPA, Inc. Architect: LPA, Inc. Architect: Gensler
Photo credit: Cris Costea Photo credit: Cris Costea Photo credit: Dror Baldinger
100% predicted reduction from national average EUI for building type. 63% predicted reduction from national average EUI for building type.
Page 12 This project received a 2020 COTE® Top Ten Award. This project received a 2020 COTE® Top Ten Award.
(Top and bottom left) Marine Education Center at the Gulf Coast
Research Laboratory (Bottom left) Palomar College Learning Resource Center Page 26
Architect: Lake|Flato in collaboration with Unabridged Architecture Architect: LPA, Inc. Ford Foundation Center for Social Justice
Photo credit: Casey Dunn Photo credit: Cris Costea Architect: Gensler
47% predicted reduction from national average EUI for building type. 70% predicted reduction from national average EUI for building type. Photo credit: Robert Deitchler
This project received a 2020 COTE® Top Ten Award. 37% predicted reduction from national average EUI for building type.
(Bottom right) LPA Irvine Studio This project received a 2020 COTE® Top Ten Award.
(Bottom right) Austin Central Library Architect: LPA, Inc.
Architect: Lake|Flato + Shepley Bulfinch Photo credit: Cris Costea
Photo credit: Casey Dunn
55% predicted reduction from national average EUI for building type.
This project received a 2020 COTE® Top Ten Award.
A I A 2 0 3 0 BY T H E N U M B E R S 30The American Institute of Architects 1735 New York Avenue, NW Washington, DC 20006 aia.org © 2020 TH E AMERICAN IN S T I T UT E O F AR C HI T EC T S
You can also read