Indication of anomalous heat energy production in a reactor device containing hydrogen loaded nickel powder.
←
→
Page content transcription
If your browser does not render page correctly, please read the page content below
Indication of anomalous heat energy production in a reactor device
             containing hydrogen loaded nickel powder.
                                        Giuseppe Levi
                               Bologna University, Bologna, Italy

                                          Evelyn Foschi
                                          Bologna, Italy

              Torbjörn Hartman, Bo Höistad, Roland Pettersson and Lars Tegnér
                            Uppsala University, Uppsala, Sweden

                                            Hanno Essén
                        Royal Institute of Technology, Stockholm, Sweden

                                            ABSTRACT
An experimental investigation of possible anomalous heat production in a special type of reactor
tube named E-Cat HT is carried out. The reactor tube is charged with a small amount of
hydrogen loaded nickel powder plus some additives. The reaction is primarily initiated by heat
from resistor coils inside the reactor tube. Measurement of the produced heat was performed with
high-resolution thermal imaging cameras, recording data every second from the hot reactor
tube. The measurements of electrical power input were performed with a large bandwidth three-
phase power analyzer. Data were collected in two experimental runs lasting 96 and 116 hours,
respectively. An anomalous heat production was indicated in both experiments.
The 116-hour experiment also included a calibration of the experimental set-up without the
active charge present in the E-Cat HT. In this case, no extra heat was generated beyond the
expected heat from the electric input.
Computed volumetric and gravimetric energy densities were found to be far above those of any
known chemical source. Even by the most conservative assumptions as to the errors in the
measurements, the result is still one order of magnitude greater than conventional energy sources.

                                       INTRODUCTION
Andrea Rossi claims to have invented an apparatus that can produce much more energy per
unit weight of fuel than can be obtained from known chemical processes. His invention is
referred to as an energy catalyzer named E-Cat HT, where HT stands for high temperature.
The original idea behind Rossi’s invention goes back to experiments done in the nineties by
Sergio Focardi at Bologna University and collaborators, in which they claimed to have
observed an anomalous heat production in a hydrogen-loaded nickel rod [1-2]. Later, an
experiment [3] was carried out by S. Focardi and A. Rossi using an apparatus with a sealed
container holding nickel powder plus unknown additives pressurized with hydrogen gas.
When the container was heated, substantial heat was produced in excess of the input heat.
They speculated that a “low energy nuclear reaction” had taken place in order to explain the
large amount of excess heat. The E-Cat HT – a further, high temperature development of the
original apparatus which has also undergone many construction changes in the last two years
– is the latest product manufactured by Leonardo Corporation: it is a device allegedly capable of
producing heat from some type of reaction the origin of which is unknown.
As in the original E-Cat, the reaction is fueled by a mixture of nickel, hydrogen, and a catalyst,
which is kept as an industrial trade secret. The charge sets off the production of thermal energy
after having been activated by heat produced by a set of resistor coils located inside the reactor.
Once operating temperature is reached, it is possible to control the reaction by regulating the
power to the coils.
The scope of the present work is to make an independent test of the E-Cat HT reactor under
controlled conditions and with high precision instrumentation. It should be emphasized that

                                              -1-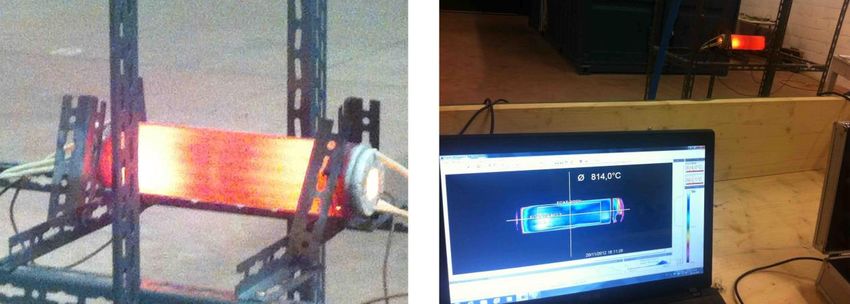
the measurement must be performed with high accuracy and reliability, so that any possible
excess heat production can be established beyond any doubt, as no known processes exist
which can explain any abundant heat production in the E-Cat reactor.

The present report describes the results obtained from evaluations of the operation of the E-Cat
HT in two test runs. The first test experiment, lasting 96 hours (from Dec. 13th 2012, to Dec.
17th 2012), was carried out by the two first authors of this paper, Levi and Foschi, while the
second experiment, lasting for 116 hours (from March 18th 2013, to March 23rd 2013), was
carried out by all authors. Both experiments were performed on the premises of EFA Srl, Via del
Commercio 34-36, Ferrara (Italy).

The tests held in December 2012 and March 2013 are in fact subsequent to a previous attempt in
November 2012 to make accurate measurements on a similar model of the E-Cat HT on the same
premises. In that experiment the device was destroyed in the course of the experimental run, when
the steel cylinder containing the active charge overheated and melted. The partial data gathered
before the failure, however, yielded interesting results which warranted further in-depth
investigation in future tests. Although the run was not successful as far as obtaining complete data
is concerned, it was fruitful in that it demonstrated a huge production of excess heat, which
however could not be quantified. The device used had similar, but not identical, features to those of
the E-Cat HT used in the December and March runs.
Besides some minor geometrical differences, in the E-Cat HT used for the November test the
charge in the inner cylinder was not evenly distributed, but concentrated in two distinct locations
along the central axis. In addition, the primer resistor coils were run at about 1 kW, which might
be the cause of the ensuing device failure. For these reasons, a more prudent reactor design was
chosen for the test held in December and March, by distributing the charge evenly along its
container cylinder, and limiting the power input to the reactor to 360 W.

Since the test in November shows some interesting features, we shall describe some of the
results from this test in some detail before discussing, in the subsequent sections, the results
from the December and March runs. Figures 1 and 2 refer to the November test, and show,
respectively, the device while in operation, and a laptop computer capturing data from a
thermographic camera focused on it. An Optris IR camera monitored surface temperature trends,
and yielded results of approximately 860°C in the hottest areas.

Figs. 1-2. Two images from the test performed on Nov. 20th 2012. Here, the activation of the
charge (distributed laterally in the reactor) is especially obvious. The darker lines in the
photograph are actually the shadows of the resistor coils, which yield only a minimal part of
the total thermal power. The performance of this device was such that the reactor was
destroyed, melting the internal steel cylinder and the surrounding ceramic layers. The long-
term trials analyzed in the present report were purposely performed at a lower temperatures for
safety reasons.

                                               -2-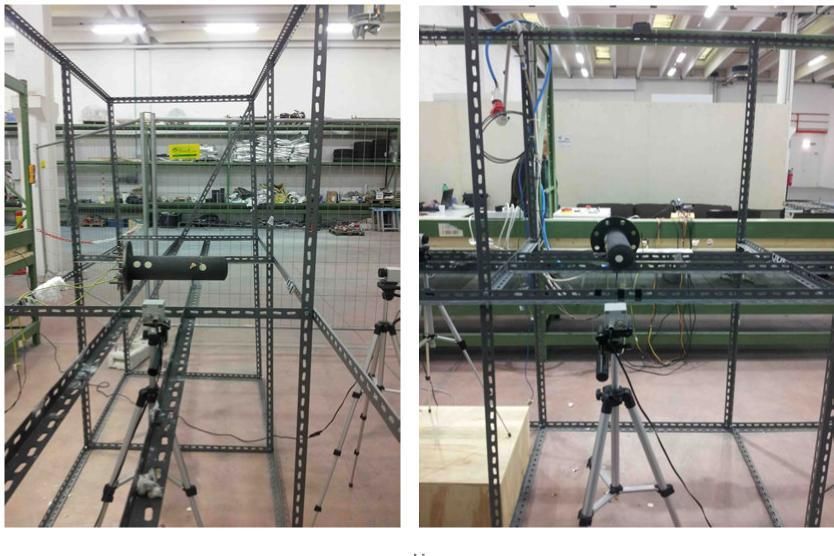
Fig. 3 shows a thermal video frame from the IR camera: the temperature of 859°C refers to Area 2
(delimited by the “cross hairs”), whereas the average temperature recorded for the body of the
device, relevant to the rectangle indicated as Area 1, is 793°C.

Fig. 3. Thermal image of the November test device. The temperature of 859°C refers to the area
within the circle of the mark (Area 2). The graphs on right show the temperature trends along
the horizontal line traversing the device (X Profile), and along the vertical line on the left of the
image (Y Profile).

Graphs on the right side of fig. 3 show the temperature distribution monitored along the two
visible lines in the image: the X Profile refers to the horizontal line traversing the whole device,
the Y Profile shows the temperature along the vertical line located on the left side of the thermal
image. This latter distribution allows one to reach some interesting conclusions.

If one relates the length of the vertical line (32 pixels) to the diameter of the device (11 cm), one
may infer that each pixel in the image corresponds to a length of approximately 0.34 cm on the
device (with some approximation, due to the fact that the thermal image is a two-dimensional
projection of a cylindrical object). The thermal image shows a series of stripe-like, darker
horizontal lines, which are confirmed by the five temperature dips in the Y Profile. This means
that, in the device image, a darker line appears every 6.4 pixels approximately, corresponding to
2.2 cm on the device itself. As mentioned previously, the E-Cat HT needs resistor coils in order to
work; these are set horizontally, parallel to and equidistant from the cylinder axis, and extend
throughout the whole length of the device. By dividing the circumference of the base of the cylinder
by the number of coils, one may infer that the 16 resistor coils in this device were laid out at a
distance of 2.17 cm. one from the other. And, by comparing the distance between darker stripes
and the distance between coils, one may reach the conclusion that the lower temperatures picked up
by the thermal camera nicely match the areas overlying the resistor coils. In other words, the
temperature dips visible in the diagram are actually shadows of the resistor coils, projected on
the camera lens by a source of energy located further inside the device, and of higher intensity
as compared to the energy emitted by the coils themselves.

                               PART 1: THE DECEMBER TEST

Device and experimental set-up
The E-Cat HT-type device in this experiment was a cylinder having a silicon nitride ceramic
outer shell, 33 cm in length, and 10 cm in diameter. A second cylinder made of a different ceramic
material (corundum) was located within the shell, and housed three delta-connected spiral-wire
resistor coils. Resistors were laid out horizontally, parallel to and equidistant from the cylinder
axis, and were as long as the cylinder itself. They were fed by a TRIAC power regulator device
which interrupted each phase periodically, in order to modulate power input with an industrial
trade secret waveform. This procedure, needed to properly activate the E-Cat HT charge, had no
                                               -3-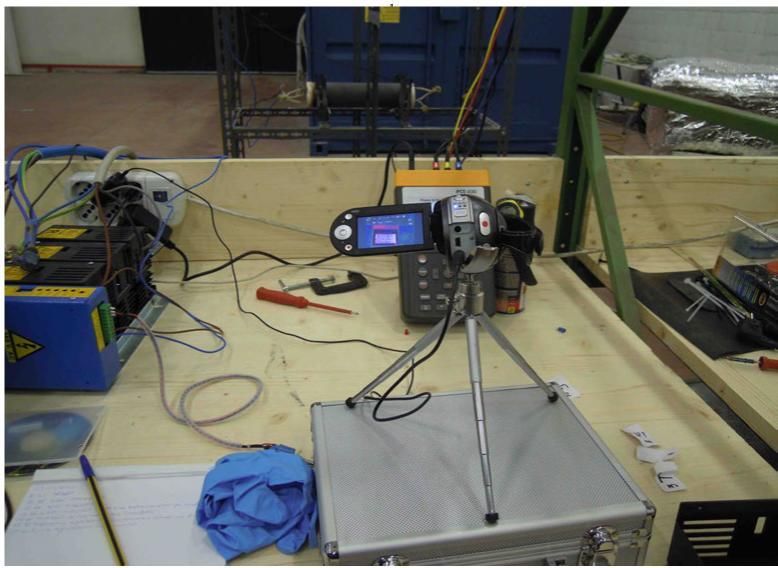
bearing whatsoever on the power consumption of the device, which remained constant throughout
the test. The most important element of the E-Cat HT was lodged inside the structure. It
consisted of an AISI 310 steel cylinder, 3 mm thick and 33 mm in diameter, housing the powder
charges. Two AISI 316 steel cone-shaped caps were hot-hammered in the cylinder, sealing it
hermetically. Cap adherence was obtained by exploiting the higher thermal expansion coefficient
of AISI 316 with respect to AISI 310 steel.
Finally, the outermost shell was coated by a special aeronautical-industry grade black paint
capable of withstanding temperatures up to 1200°C.
It was not possible to evaluate the weight of the internal steel cylinder or of the caps because the E-
Cat HT was already running when the test began. Weighing operations were therefore performed
on another perfectly similar device present on the premises, comparing a cap-sealed cylinder
containing the active charge with another identical cylinder, empty and without caps. The
difference in weight obtained is 0.236 kg: this is therefore to be assigned to the charge loaded into
the E-Cat HT and to the weight (not subtracted in the present test) of the two metal caps.
In the course of the test, the E-Cat HT was placed on a metal frame and allowed to freely radiate
to the surrounding air. The contact points between the device and the frame were reduced to the
minimum necessary for mechanical stability; room temperature was constantly measured by means
of a heat probe, and averaged 15.7°C (= 289 K).
The instruments used to acquire experimental data were at all times active for the entire 96 hours
of the test, and consisted of an IR thermography camera to measure the E-Cat HT’s surface
temperature, and a wide band-pass power quality monitor measuring the electrical quantities on
each of the three phases, to record the power absorbed by the resistor coils.
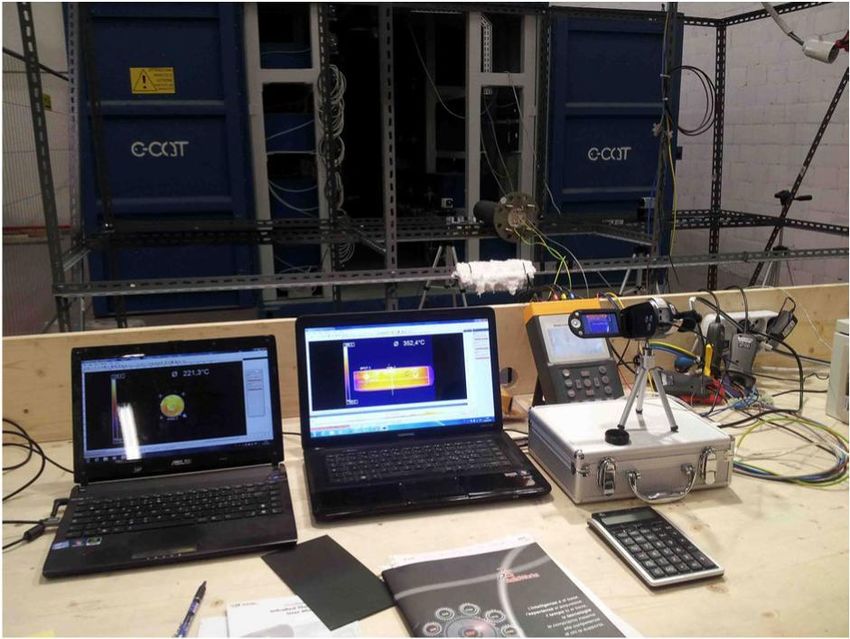
Fig. 4. Instrumentation set-up for measurements. Foreground: thermal image capture. On right:
instrument used for electrical measurements. Background: the E-Cat HT on its support frame; the
IR camera is not visible here.
The thermal camera used was an Optris PI 160 Thermal Imager with 30° × 23° lens, and UFPA 160 ×
120 pixel sensors. The camera spectral interval is from 7.5 to 13 µm, with a precision of 2% of
measured value. The camera was fastened to the frame of the E-Cat HT, and positioned about
70 cm from the device, with lens facing the lower half of the cylinder. All imaging was thus taken
from below the apparatus, in order not to damage the lens from the heat transferred by rising
convective air currents. This choice, however, had a negative impact on the measurements:
the presence of the two metal props on the stationary image shot by the camera introduced a
degree of uncertainty in the measurements, as will be explained in detail below.Camera capture rate
was set at 1 Hz, and the image, visualized on a laptop display, was open to analysis throughout the
course of the test.
-4-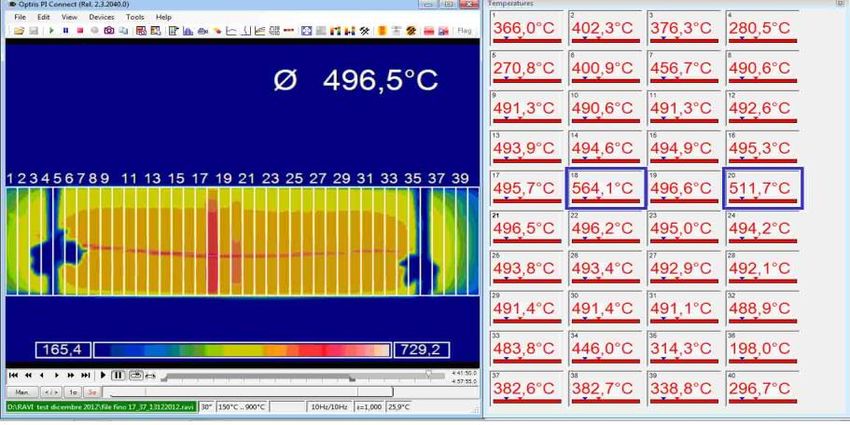
Fig. 5. E-Cat HT on support frame. The power cables to the internal resistor coils are visible,
as well as the IR camera in the lower part of the photograph.

Electrical measurements were performed by a PCE-830 Power and Harmonics Analyzer by PCE
Instruments with a nominal accuracy of 1%. This instrument continuously monitors on an LCD
display the values of instantaneous electrical power (active, reactive, and apparent) supplied to the
resistor coils, as well as energy consumption expressed in kWh.
Of these parameters, only the last one was of interest for the purposes of the test, which was
designed to evaluate the ratio of thermal energy produced by the E-Cat HT to electrical power
consumption for the number of hours subject to evaluation. The instrument was connected
directly to the E-Cat HT cables by means of three clamp ammeters, and three probes for voltage
measurement.
A wristwatch was placed next to the wattmeter, and a video camera was set up on a tripod and
focused on both objects: at one frame per second, the entire sequence of minutes and power
consumption were filmed and recorded for the 96-hour duration of the test.

Fig. 6. The video camera on its tripod framing the display used for electrical measurements (PCE-
830), and recording at 1 frame p.s. for the whole duration of the test.

                                               -5-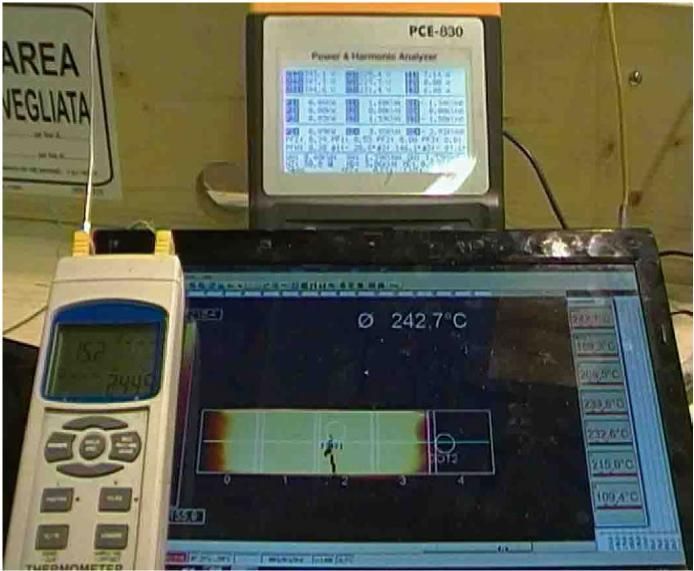
Besides the set-up required for the measurements, instruments necessary for detecting
possible radioactive emissions were also placed in the vicinity of the E-Cat HT. These
measurements are essential for safety certification of the device, and were performed by David
Bianchini. The full report of the methods and results of these measurements is available on
demand. A partial quotation follows:
“It was decided to use two different wide-spectrum and high-sensitivity photon detectors: the
first detector was chosen for the purpose of measuring in the spatial surroundings any rate
variation of ambient dose equivalent H * (10) [...], the second detector was chosen for measuring
and recording CPM (counts per minute) rate variations in a specific position [...]. With respect
to instrumental and ambient background, the measurements performed do not reveal significant
differences either in H*(10) or CPM ascribable to the E-Cat prototype”.

Data analysis
Upon conclusion of the test, the recordings from the video camera were examined. By reading
the images reproducing the PCE-830's LCD display at regular intervals, it was possible to make
a note of the number of kWh absorbed by the resistor coils. Subsequently, the E-Cat HT's average
hourly power consumption was calculated, and determined to be = 360 W.
As far as the evaluation of the energy produced by the E-Cat HT is concerned, two dominant
components must be taken into account, the first being emission by radiation, the second the
dispersion of heat to the environment by means of convection.
Heat transfer by conduction was deemed to be negligible, due to of the minimal surface of contact
(not more than a few mm2) between the device and its supports, and to the fiberglass insulation
material placed at the contact points. This material, however, partially obscured the image of the E-
Cat HT’s surface.
Energy emitted by radiation was calculated by means of Stefan-Boltzmann’s formula, which allows
to evaluate the heat emitted by a body when its surface temperature is known.
Surface temperature was measured by analyzing the images acquired by the IR camera, after dividing
the images into multiple areas, and extracting the average temperature value associated to each
area.
Conservatively, surface emissivity during measurements was set to 1, i.e. the temperature values
recorded are consequently lower than real, as will be explained below.
The calculation of energy loss by convection from objects of cylindrical shape placed in air has
been presented many times in academic papers that address issues related to heat transfer (see for
example [4,5]). It was therefore possible to estimate the amount of heat transferred by the ECat
HT to the surrounding air in the course of the test.
The thermal performance of the E-Cat HT was finally obtained as the ratio between the total energy
emitted by the device and the energy dissipated by its resistor coils.

Calculating the power emitted by radiation
Planck's Law expresses how the monochromatic emissive power of a black body varies as a function
of its absolute temperature and wavelength; integrating this over the whole spectrum of
frequencies, one obtains the total emissive power (per unit area) of a black body, through what is
known as Stefan-Boltzmann’s Law:

M=σT4 [W/m2]                                                                                    (1)

where σ indicates Stefan-Boltzmann's constant, equal to 5.67·10-8 [W/m2K4].
In the case of real surfaces, one must also take emissivity (ε) into account. ε expresses the ratio
between the energy emitted from the real surface, and that which would be emitted by a black body
having the same temperature. The formula then becomes:

M=εσT4 [W/m2]                                                                                   (2)

                                               -6-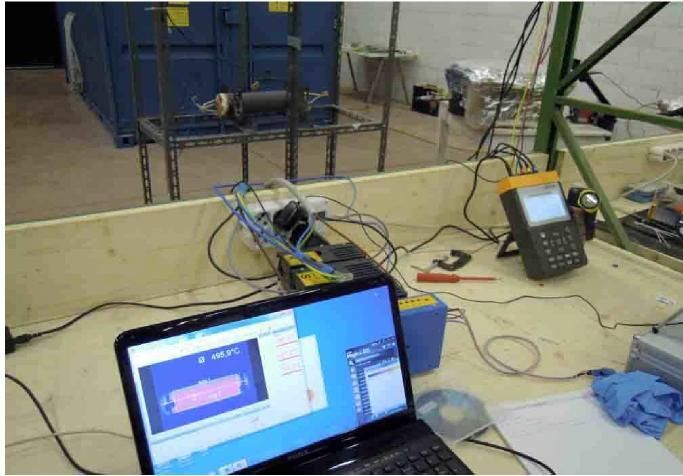
where ε may vary between 0 and 1, the latter value being the one assumed for a black body. As it
was not possible to measure the emissivity of the coating used in this analysis, it was decided to
conservatively assume a value of ε = 1, thereby considering the E-Cat HT as equivalent to a black
body. This value was then input in the thermal imagery software, which allows the user to modify
some of the parameters, such as ambient temperature and emissivity, even after having
completed the recordings. The camera software then uses the new settings to recalculate the
temperature values assigned to the recorded images. It was therefore possible to determine the E-Cat
HT's emitted thermal power on the basis of surface temperature values that were never
overestimated with respect to actual ones.
The veracity of this statement may be proven by an example where we see what happens when
one assigns a value lower than 1 to ε: in fig. 7, the thermal image of the E-Cat HT has been
divided into 40 areas. Emissivity has been set to = 1 everywhere, except in two areas (Nos. 18
and 20), where it is set to 0.8 and 0.95, respectively. The temperature which the IR camera assigns
to the two areas is 564.1°C and 511.7°C, respectively – these values being much higher than those
of the adjacent areas.
It is therefore obvious that by assigning a value of 1 to ε in to every area, we are in fact
performing a conservative measurement: this is a necessary precaution, given the lack of
information on the real emissivity value of the E-Cat HT.

Fig. 7. This image exemplifies the effect of emissivity on the determination of temperatures. The
E-Cat HT has been divided in 40 areas; in areas 18 and 20 emissivity has been set to = 0.8 and
0.95, respectively, whereas in all the remaining areas ε has been set to = 1. Measured
temperatures appear to be higher in areas 18 and 20 with respect to those recorded in the other
areas. If the lower values for ε were extended to all areas, this would lead to a higher estimate of
irradiated energy density. For our calculations, therefore – in view of the fact that the effective
value of ε was not available for our test, and that it was felt desirable to avoid any arbitrary source
of overestimation – ε was left set to = 1 in all areas.

One must keep in mind that the thermal camera does not measure an object's temperature
directly: with the help of input optics, radiation emitted from the object is focused onto an infrared
detector which generates a corresponding electrical signal. Digital signal processing then
transforms the signal into an output value proportional to the object temperature. Finally, the
temperature result is shown on the camera display. The camera software derives the temperature
of objects by means of an algorithm which takes several parameters and corrective factors into
account, e.g. user settings for emissivity and detector temperature, taken automatically by a
sensor on the lower part of the camera itself.
Moreover, every Optris camera-and-optics set has its own calibration file supplied by the
manufacturer (Ref. [6]).
The image provided by the camera shows only the lower part of the E-Cat HT: as no other IR
cameras were available, the same temperatures measured there were held good for the upper half
of the device as well, and were used for subsequent calculations. We realize that convection has a

                                                -7-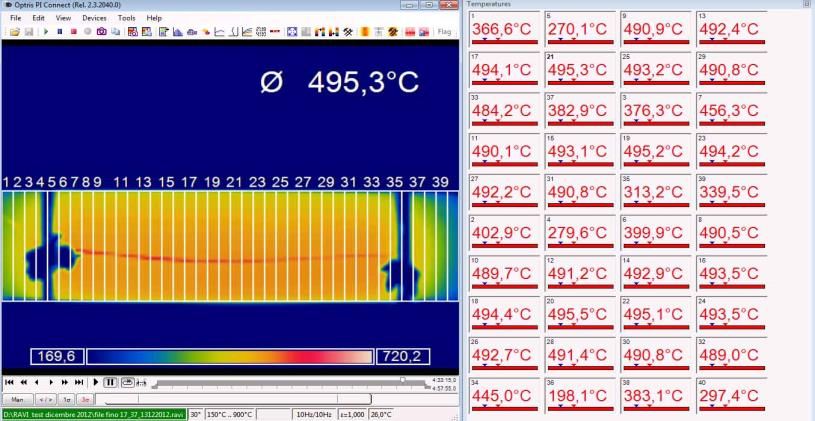
different effect on the top of the object compared to the bottom of it. Therefore, the temperature
values by means of the frame setup chosen for positioning the camera should be the ones
least affected by convective dispersion. This choice, however, leads to a heavy penalty in the
calculation of the average surface temperature of the E-Cat HT: as a matter of fact, in the frames
associated with the setup, the shadows of the two metal struts, and of the insulating materials
placed under the device to support it, are clearly visible. These two blacked-out areas negatively
distort the calculation of the surface temperature and prevent a proper view of the underlying
emitting surfaces.
To overcome this problem, it was decided to divide the entire image of the IR camera into a
progressively greater number of areas, for which average temperature values for the entire
duration (96 hrs) of the test were calculated. Subsequently, these values were raised to the 4th
power, and then averaged together to obtain a single value to be assigned to the E-Cat HT. By
this process, the blacked-out areas are actually considered as pertaining to the surface of the E-
Cat HT, thereby underestimating the energy emitted. It was decided to proceed in this manner in
order to obtain a lower limit for emitted energy based solely on collected data, without making
arbitrary assumptions that might have led to errors by overestimation.
The image obtained from the IR camera covers an area of 160 × 41 pixels and was
progressively divided into 10, 20 and 40 areas, following the following criterion: in the first case,
10 areas of 16 × 41 pixels; in the second, 20 areas of 8 × 41 pixels; finally, in the third, 40 areas
of 4 × 41 pixels.

Fig. 8: The area occupied by the E-Cat HT was first divided into 10 parts, then into 20, and finally
into 40 parts. For each of these the average temperature was measured.
Above: 20-area division of the E-Cat HT image. The thermal profiles on the right refer to the two
horizontal lines on the camera image: in the profiles, the two temperature dips
corresponding to the metal struts are clearly visible.
Below: 40-area division of the E-Cat HT image. The red horizontal line crossing the image is due
to a small crack in the ceramic outer surface caused by mechanical stress probably due to a
previous thermal shock.

For each area, as well as for the entire duration of the video footage, a time diagram of the
average temperature trend was extracted; data was then saved to Excel worksheets, from which

                                               -8-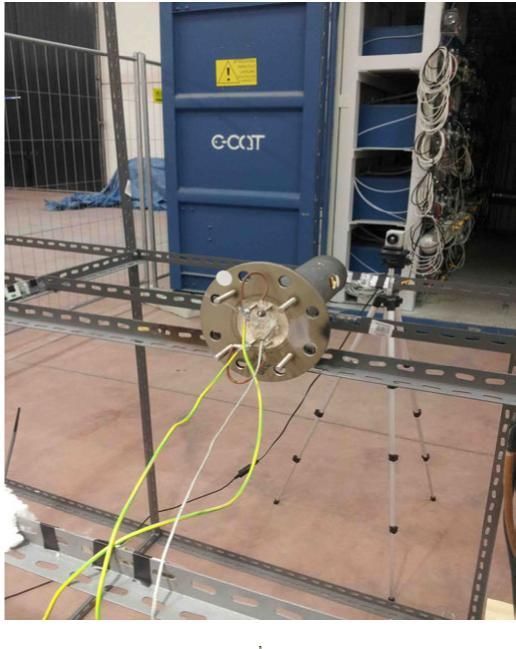
the averages were extracted.
The temperatures thus obtained, expressed in Kelvin for each area, are presented in the
following three tables.

 Area 1    Area 2   Area 3      Area 4   Area 5   Area 6     Area 7   Area 8 Area 9     Area 10
 628.8 K 623.8 K 665.1 K 754.3 K         759.3 K 761.8 K     761.2 K 759.0 K 756.4 K    624.8 K

Table 1. Division into 10 areas.

By averaging these 10 values, one obtains a temperature, associable to the E-Cat HT, of 709 K.

 Area 1    Area 2    Area 3     Area 4   Area 5     Area 6   Area 7   Area 8 Area 9      Area 10

 660.9 K 596.4 K 599.0 K 738.9 K 757.0 K          757.9 K    760.1 K 761.1 K 762.0 K     763.0 K

 Area 11 Area 12 Area 13 Area 14 Area 15 Area 16 Area 17 Area 18 Area 19 Area 20

 762.7 K 761.3 K 760.5 K 760.0 K 758.7 K          757.3 K    732.0 K 521.8 K 650.5 K     592.8 K

Table 2. Division into 20 areas.

By averaging these 20 values, one obtains an assignable temperature for the E-Cat HT of 710.7 K.

 Area 1    Area 2   Area 3      Area 4   Area 5   Area 6     Area 7   Area 8 Area 9     Area 10

 641.6 K 670.7 K 644.5 K 546.0 K 535.3 K          667.4 K    724.0 K 758.4 K 758.8 K 757.9 K

Area 11 Area 12 Area 13 Area 14 Area 15 Area 16 Area 17 Area 18 Area 19 Area 20

 758.5 K 759.7 K 761.1 K 762.0 K 762.4 K          762.9 K    763.4 K 763.6 K 764.5 K 764.9 K

Area 21 Area 22 Area 23 Area 24 Area 25 Area 26 Area 27 Area 28 Area 29 Area 30

 764.7 K 764.5 K 763.6 K 763.0 K 762.9 K          762.5 K    762.0 K 761.3 K 760.7 K 760.9 K

Area 31 Area 32 Area 33 Area 34 Area 35 Area 36 Area 37 Area 38 Area 39 Area 40

 760.7 K 758.6 K 753.3 K 713.2 K 581.4 K          463.5 K    652.2 K 652.6 K 608.1 K 564.4 K

Table 3. Division into 40 areas.

By averaging these 40 values, one may assign to the E-Cat HT a temperature of 711.5 K.
The comparison between the different subdivisions into areas shows that the average
temperature depends only slightly upon the choice of subdivision, and actually tends to
increase, because the areas near the blacked-out ones are treated more effectively.
With reference to the third case above, one may calculate thermal power emitted by the ECat
HT by first considering the average of the fourth power of the temperature of each area. One gets
the following value:

(T4)average= 2.74 · 1011 [K4]                                                                 (3)

Emitted thermal power (E) may be easily obtained by multiplying the Stefan-Boltzmann
formula by area of the E-Cat HT :

AreaE-Cat = 2πRL = 1036 · 10-4 [m2]                                                           (4)

                                              -9-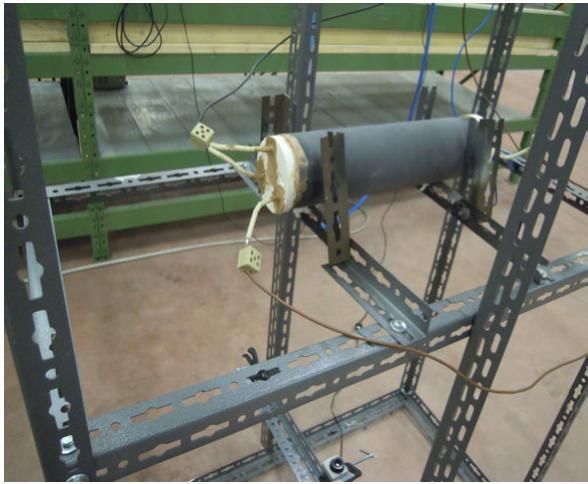
where:
R = radius of the E-Cat HT , equal to 0.05 [m]
L = length of the E-Cat HT , equal to 0.33 [m].

E = (5.67 · 10-8) (2.74 ·1011) (1036 · 10-4) = 1609 [W]                                       (5)

In calculating the total area of the E-Cat HT, the area of the two bases was omitted, their
surface being:

AreaE-Cat Bases = 2(πR²) = 157 · 10-4 [m2]                                                    (6)

This choice was motivated by the fact that for these parts of the cylinder, which are not
framed by the IR camera, any estimate of irradiated energy would have been highly
conjectural. We therefore preferred not to include this factor in calculating E, thereby
underestimating radiative thermal power emitted by the E-Cat HT.
Emitted thermal power (E), apart from minute variations, remains constant throughout the
measurement, as may be seen in the Plot 1 below, showing the measured radiative power vs time
in hours. Power production is almost constant with an average of 1609.4 W.
To this power we must subtract the thermal power due to room temperature. On the basis of an
average of 15.7°C over 96 hours, we get:

E _room= (5.67 · 10-8) (289) 4 (1036 ·10-4) = 41 [W]                                          (7)

So the final value is:

E-E_room=1609 - 41= 1568 [W]                                                                  (8)

Plot 1. Emitted thermal power vs time. Power production is almost constant with an average of
1609.4 W.

Note that the image reproduced by the IR camera is actually the projection of a cylindrical object
on a two-dimensional plane. Consequently, the lines of sight between the camera and the
cylinder radius vary between 0 and 90 degrees. In the latter case, which refers to the lateral
parts of the E-Cat HT with respect to camera position, and thereby to the edges of the thermal
image, the recorded temperatures may be significantly lower than effective ones. However, the
division into rectangles adopted by us in order to calculate the average temperatures,
comprises these edges (see fig. 8), which will therefore appear to be colder than they actually are
due to the IR camera's angle of view. Once again, we opted to take a conservative stance,
underestimating temperatures where the effective value was not easily assessable.

                                              - 10 -
Calculating power emitted by convection
Let us consider a fluid temperature Tf lapping against a surface having area A and
temperature T. Heat Q transferred in unit time by convection between the surface and the fluid
may be expressed by Newton's relation:
Q = hA (T-Tf) = hA ΔT [W] (9)
where h is defined as the heat exchange coefficient [W/m2 K].
When the value of h is known, it is possible to evaluate the heat flow; thus, determining h
constitutes the fundamental problem of thermal convection. Convection coefficient h is not a
thermo-physical property of the fluid, but a parameter the value of which depends on all the
variables that influence heat exchange by convection:
h = f (ρ, Cp, μ, βg, k, T-Tf, D), where the meaning of the symbols is as follows:
ρ = fluid density [kg/m³]
Cp: specific heat capacity at constant pressure [J/kgK]
μ: viscosity [kg/ms]
βg: product of the coefficient of thermal expansion by gravity acceleration [m/s² K]
k: coefficient of thermal conductivity [W/mK]
T-Tf = ΔT: temperature difference between surface and fluid [K]
D: linear dimension; in our case, diameter [m].
The value of h may be obtained, for those instances involving the more common geometries and
those fluids of greater practical interest, through the use of expressions resulting from experimental
tests quoted in mainstream heat engineering literature. With reference to these texts [4, 5], we
see that, in the case of a cylinder with a diameter less than 20 cm immersed in air at a
temperature close to 294 K, the value of h may be had through the following expression:
h = C'' (T-Tf)n D3n-1 (10)
C'' and n are two constants the value of which may be obtained if one knows the interval
within which the product between the Grashof number Gr and the Prandtl number Pr falls.
These dimensionless numbers are defined as follows:
Gr = βg (T-Tf) D³ ρ²/μ²; Pr = Cpμ/k (11)
Gr represents the ratio between the inertia forces of buoyancy and friction forces squared, while Pr
represents the ratio between the readiness of the fluid to carry momentum and its readiness to
transport heat.
For a wide range of temperatures one can say that:
k4 (βgρ² Cp /μk) = 36.0 (12)
For the E-Cat HT average temperature value derived above, we get an average temperature
between device and air equal to:
(T + Tf)/2 = (711.5 +289)/2 = 500.2 [K] (13)
Once this value is known, one can first of all derive the relevant coefficient of thermal
conductivity k. With the aid of Table 4, which holds good for air, the value of k obtained for this
- 11 -temperature is equal to 0.041 [W/mK].
k [W/mK] T [K]
0.0164 173
0.0242 273
0.0317 373
0.0391 473
0.0459 573
Table 4. The extreme temperature values given constitute the experimental range. For
extrapolation to other temperatures, it is suggested that the data given be plotted as log k vs log
T (see reference [4]).
From (12) we have:
(βgρ² Cp)/(μk) = 36.0/(0.041)4 = 1.27 · 107 (14)
From the definitions of Gr and Pr we get:
GrPr = ((βgρ²Cp ) / (μk)) (T-Tf) L³ = (1.27 · 107) (711.5-289) (0.1)³ = 5.36 · 106 (15)
Now we may consult Table 5 for the two constants we are searching for:
GrPr n C"
10-5 - 10-3 0.04 -
10-3 - 1.0 0.10 -
1.0 -104 0.20 -
104 - 109 0.25 1.32
>109 0.33 1.24
Table 5. Values are referred to a horizontal cylinder with a diameter less than 0.2 m (see ref.[4]).
One may then deduce:
C'' = 1.32, n = 0.25
(10) then becomes:
h = (1.32) (711.5-289) 0.25 (0.1) 3*0.25-1 = 10.64 [W/m² K] (16)
Substituting (16) in (9) we obtain the power emitted by convection:
Q = (10.64) (1036 ·10-4) (711.5-289) = 466 [W] (17)
E-Cat HT performance calculation
At this point all that remains to be done, in order to get the performance (COP) of the E-Cat HT,
is to add the radiated power to the power dispersed by convection, and relate the result to the
power supplied to the heating elements. Conservatively, we can associate to these values a
percentage error of 10%, in order to comprise various sources of uncertainty: those relevant to
- 12 -the consumption measurements of the E-Cat HT, those inherent in the limited range of
frequencies upon which the IR cameras operate, and those linked to the calculation of average
temperatures.
From (8) and from (17) we have:
1568 + 466 = (2034 ± 203) [W] (18)
COP = 2034/360 = 5.6 ± 0.8 (19)
assuming a 10% error in the powers. Plot 2 shows produced vs. consumed energy. Radiated
energy is actually measured energy; total energy also takes into account the evaluation of natural
convection. Data are fit with a linear function, and COP is obtained by the slope.
Plot 2. Thermal energy produced (kWh) versus electrical energy consumed (kWh).
Ragone Chart
As we have seen, the weight of the active charge of the E-Cat HT plus the weight of the two metal
caps sealing the inner cylinder is equal to 0.236 kg.
If we assign this value to the charge powders, we shall be overestimating the weight of the charge;
thus, our calculation of the values of power density and the density of thermal energy may be
regarded as a lower limit.
For power density we have:
(2034-360)/0.236 = (7093 ± 709) [W/kg] (20)
Thermal energy density is obtained by multiplying (20) by the number of test hours:
7093·96 = 680949 [Wh/kg] ~ (6.81 ± 0.7) · 105 [Wh/kg] (21)
Figure 9 shows the "Ragone plot of energy storage", a typical diagram in which specific energy
is represented as a function on a logarithmic scale of the specific power of the various energy
storage technologies [Ref. 7]. Power density and thermal energy density found for the E-Cat HT
place this device outside of the area occupied by any known conventional energy source in the
Ragone chart. Given the deliberately conservative choices made in performing the measurement,
we can reasonably state that the E-Cat HT is a non-conventional source of energy which lies between
conventional chemical sources of energy and nuclear ones.
- 13 -Fig. 9. “Ragone plot of energy storage”[Ref. 7]. The plot shows specific gravimetric energy and
power densities relevant to various sources. The E-Cat HT, which would be off the scale here, lies
outside the region occupied by conventional sources.
Remarks on the test
The device subject to testing was powered by 360 W for a total of 96 hours, and produced in all
2034 W thermal. This value was reached by calculating the power transferred by the ECat HT to
the environment by convection and power irradiated by the device. The resultant values of
generated power density (7093 W/kg) and thermal energy density (6.81 · 105 Wh/kg) allow us to
place the E-Cat HT above conventional power sources.
The procedures followed in order to obtain these results were extremely conservative, in all phases,
beginning from the weight attributed to the powder charge, to which the weight of the two metal
caps used to seal the container cylinder was added. The same may be said for the choice of
attributing an emissivity of 1 to the E-Cat HT; other instances of underestimation may
be found in the calculation of the radiating area of the device without the two bases, and in the
fact that some parts of the radiating surfaces were covered by metal struts. It is therefore
reasonable to assume that the thermal power released by the device during the trial was higher
than the values given by our calculations.
Lastly, it should be noted that the device was deliberately shut down after 96 hours of
operation. Therefore, from this standpoint as well, the energy obtained is to be considered a
lower limit of the total energy which might be obtained over a longer runtime.
This test enabled us to pinpoint several procedural issues, first of all the fact that the device was
already in operation when the trial began. This prevented us from correctly weighing the device
beforehand, and conducting a thermal analysis of the same without the powder charge, prior to
evaluating its yield with the charge in position. The choice of placing the thermal camera under
the E-Cat HT should also be considered unsatisfactory, as was the impossibility of evaluating the
real emissivity of the cylinder's paint coating.
All these issues were taken notice of in the light of the subsequent test held in March. This was
performed with a device of new design, as a result of technological improvements effected by
Leonardo Corporation in the intervening months.
- 14 -PART 2: THE MARCH TEST
Device and experimental set-up
The March test was performed with a subsequent prototype of the E-Cat HT, henceforth termed
E-Cat HT2, differing from the one used in the December test both in structure and control system.
Externally, the device appears as a steel cylinder, 9 cm in diameter, and 33 cm in length, with a
steel circular flange at one end 20 cm in diameter and 1 cm thick. The only purpose of the
flange was to allow the cylinder to be inserted in one of various heat exchangers, which are
currently under design. As in the case of the previous model, here too the powder charge is
contained within a smaller AISI 310 steel cylinder (3 cm in diameter and 33 cm in length),
housed within the E-Cat HT2 outer cylinder together with the resistor coils, and closed at each
end by two AISI 316 steel caps.
The outer surface of the E-Cat HT2 and one side of the flange are coated with black paint,
different from that used for the previous test. The emissivity of this coating, a Macota® enamel
paint capable of withstanding temperatures up to 800°C, is not known; moreover, it was not
sprayed uniformly on the device, as may be seen from the non-uniform distribution of colors in
adjacent areas in the thermal imaging.
Fig. 10. Flange of the E-Cat HT2 used for the March test. The flange is meant to facilitate
insertion of the device in a heat exchanger. Electrical power is fed through the two yellow wires.
The third connection was verified to be a PT100 sensor, used to give a feedback temperature signal
to the control box in order to regulate the ON/OFF cycle.
The E-Cat HT2's power supply departs from that of the device used in December in that it is
no longer three-phase, but single-phase: the TRIAC power supply has been replaced by a control
circuit having three-phase power input and single-phase output, mounted within a box, the
contents of which were not available for inspection, inasmuch as they are part of the
industrial trade secret. But the main difference between the E-Cat HT2 and the previous model
lies in the control system, which allows the device to work in self-sustaining mode, i.e. to
remain operative and active, while powered off, for much longer periods of time with respect to
- 15 -those during which power is switched on. During the test experiment we observed that, after an
initial phase lasting about two hours, in which power fed to the resistor coils was gradually
increased up to operating regime, an ON/OFF phase was reached, automatically regulated by the
temperature feedback signal from a PT100 sensor.
In the ON/OFF phase, the resistor coils were powered up and powered down by the control system at
observed regular intervals of about two minutes for the ON state and four minutes for the OFF
state. This operating mode was kept more or less unchanged for all the remaining hours of the
test. During the OFF state, it was possible to observe – by means of the video displays connected
to the IR cameras (see below) – that the temperature of the device continued to rise for a
limited amount of time. The relevant data for this phenomenon are displayed in the final part of
the present text.
The instrumentation used for the experiment was the same as that of the previous test, with the sole
addition of another IR camera, used to measure the temperature of the base (henceforth:
“breech”) of the E-Cat HT2, and of the flange opposite to it. The second camera was also an
Optris PI 160 Thermal Imager, but mounting 48° × 37° lens. Both cameras were mounted on
tripods during data capture, with the E-Cat HT2 resting on metal struts. This made it possible to
solve two of the issues experienced during the December test, namely the lack of information on
the E-Cat HT2 breech, and the presence of shadows from the struts in the IR imagery.
As in the previous test, the LCD display of the electrical power meter (PCE-830) was
continually filmed by a video camera. The clamp ammeters were connected upstream from the
control box to ensure the trustworthiness of the measurements performed, and to produce a non-
falsifiable document (the video recording) of the measurements themselves.
Fig. 11. Instrument set-up for the test. From left to right: the two laptops connected to the IR
cameras, framing the breech (i.e. the base opposite the flange) of the E-Cat HT2 and one of its
sides, respectively, plus the video camera, and the PCE-830. Background: the E-Cat HT2 resting
on metal struts and the two IR cameras on tripods.
Another critical issue of the December test that was dealt with in this trial is the evaluation of the
emissivity of the E-Cat HT2’s coat of paint. For this purpose, self-adhesive samples were used:
- 16 -white disks of approximately 2 cm in diameter (henceforth: dots) having a known emissivity of
0.95, provided by the same firm that manufactures the IR cameras (Optris part: ACLSED).
According to the manufacturer, the maximum temperature tolerated by a dot before it is destroyed is
approximately 380°C. In the course of the test, numerous dots were applied along the side and the
breech of the E-Cat HT2, but the ones applied to the more central areas showed a tendency to
fall off, and had to be periodically replaced. Actually, the distribution of temperatures along the
device is non-uniform, and the central part of the cylindrical body is where the temperature
reaches values closest to the uppermost working limit for the dots themselves.
Fig. 12. Two images of the E-Cat HT2. The first displays one of the sides, as framed by one
thermal camera, the second displays the breech, framed by the second IR camera. The
adhesive “dots” used to evaluate paint emissivity are visible in both images. Note how, in the image
on the left, one of the dots is about to fall off due to the heat from the underlying area.
The dots allow one to determine the emissivity of the surface they are applied to, by
comparing the temperatures recorded on the dots and those of the adjacent areas. This
procedure may also be applied during data analysis, directly on the completed thermal
imagery video. It is possible to divide the thermal images into separate areas – in the same
manner as the one used to determine the average temperature of the E-Cat HT in the
December test – and to assign a specific emissivity to each area. This option proved quite useful
later, when analyzing the imagery captured by the cameras, because it made it possible to correct
the values of ε that had been assigned during the initial calibration performed while the test was
in progress. The dots in the images enabled us to determine that different areas of the device had
different emissivity because the paint had not been uniformly applied. Furthermore, it was
possible to see how emissivity for each area varied in the course of time, probably on account of
a change in the properties of the paint when subjected to continuous heat. For this reason, when
analyzing the data after the test, a good number of time intervals were taken into consideration.
The thermal images of the E-Cat HT2 were then divided into areas, and adjusted to the
appropriate values of emissivity relevant to every time interval. In order to calculate emitted
energy, the temperature then assigned to each area of the device was determined from an
average of the various results that had been obtained.
Another improvement over the December test lies in the fact that we were able to perform
further measurements (falling outside the 116 hours of the trial run) on the same E-Cat HT2 used
for the test, after removing the inner charge. With this device, termed “dummy”, we were able to
verify the effectiveness of the methodology used to evaluate the active device, and to estimate
- 17 -the energy emissions of the flange, which would have been difficult to evaluate otherwise.
Lastly, as in the December test, the E-Cat HT2 was assessed all throughout the test for potential
radioactive emissions. The measurements and their analysis were performed once again by David
Bianchini, whose report and relevant results are available on demand. His conclusions are
quoted below:
“The measurements performed did not detect any significant differences in exposure and CPM
(Counts per Minute), with respect to instrument and ambient background, which may be imputed
to the operation of the E-Cat prototypes”.
Analysis of data obtained with the “dummy”
By “dummy” is meant here the same E-Cat HT2 used for the test described in Part 2, but provided
with an inner cylinder lacking both the steel caps and the powder charge. This “unloaded” device
was subject to measurements performed after the 116-hr trial run, and was kept running for about
six hours. Instrumentation and data analysis were the same as those used for the test of the active
E-Cat HT2. We prefer to present the data relevant to the dummy beforehand, since these data
made it possible to perform a sort of “calibration” of the E-Cat HT2, as shall be pointed out
below.
The electrical power to the dummy was handled by the same control box, but without the ON/OFF
cycle of the resistor coils. Thus, the power applied to the dummy was continuous.
Power to the dummy’s resistor coils was stepped up gradually, waiting for the device to reach thermal
equilibrium at each step. In the final part of the test, the combined power to the dummy +
control box was around 910-920 W. Resistor coil power consumption was measured by placing the
instrument in single-phase directly on the coil input cables, and was found to be, on average, about
810 W. From this one derives that the power consumption of the control box was approximately =
110-120 W. At this power, the heat produced from the resistor coils alone determined an average
surface temperature (flange and breech excluded) of almost 300°C, very close to the average
one found in the same areas of the E-Cat HT2 during the live test.
Various dots were applied to the dummy as well. A K-type thermocouple heat probe was placed
under one of the dots, to monitor temperature trends in a fixed point. The same probe had also
been used with the E-Cat HT2 to double check the IR camera readings during the cooling phase.
The values measured by the heat probe were always higher than those indicated by the IR camera:
this difference, minimal in the case of the E-Cat HT2, was more noticeable in the dummy, where
temperature readings proved to be always higher by about 2°C. The most likely reason for the
difference is to be sought in the fact that the probe, when covered with the dot securing it the surface,
could not dissipate any heat by convection, unlike the areas adjacent to it.
In order to evaluate the power emitted by the dummy by radiation and convection, we decided to
divide the image of the cylindrical body into 5 areas, to each of which, by means of dots, we assigned
an average emissivity of 0.80. Lastly, the analysis of images relevant to the breech determined for
this area another value for ε: 0.88.
- 18 -Fig. 13. Dummy measurement set-up. Center: laptop display showing the thermal image of the
dummy divided into 5 areas, and the dark shadow of the thermocouple, with probe point located
under a dot. Left: thermocouple LCD display, indicating a temperature of 244.5°C. This is relevant
to the same area which the IR camera reading of 242.7°C, visible on the laptop display, refers to.
The difference is most likely caused by lower thermal exchange between the probe and the
environment..
For each of the five areas, energy emitted by radiation was calculated. Once again, Stefan-
Boltzmann’s formula multiplied by the area taken into consideration was used, as in Part 1,
equation (5). Power emitted by convection was calculated by equations (9) and (10). The equations
are repeated below for clarity’s sake, followed by a table summarizing the results.
E = εσAT4 [W] (5)
Q = hA (T-Tf) = hAΔT [W] (9)
h = C" (T-Tf)n D3n-1 (10)
AreaDummy = 2πRL = 989.6 · 10-4 [m2]
AreaTop = πR² = 63.61 · 10-4 [m2]
Note that coefficients C" and n of (10) have the same value calculated for the December test, namely
C" = 1.32, and n = 0.25, whereas the diameter D is now = 9 cm.
Moreover, AreaDummy refers to the cylindrical body of the device without flange or breech.
Lastly, the contributing factor due to ambient temperature, termed “E_room” in (7) above, has
already been subtracted from the power values associated with each area. This was calculated
assuming an ambient temperature value of 14.8°C.
E_room = (5.67 ·10-8) (288)4 (0.80) (198 ·10-4) = 6.18 [W]
- 19 -Area 1 Area 2 Area 3 Area 4 Area 5 Sum
E (W) 84.9 112 109 102 49.3 457.2
Q (W) 53.7 63 62.6 59.9 38.3 277.5
W Total 138.6 175 171.6 161.9 87.6 734.7
Table 6. Power emitted by radiation (E) and convection (Q) for each of the five areas. The value
of E_room, about 6.18 W, has already been subtracted from power E in the relevant area.
Using the second thermal imagery camera, it was possible to monitor the temperature of the
breech, which was almost stable at 225°C. We were thus able to compute the contributing factor to
the total radiating energy associated with this part of the dummy: a value of E-E_room = 17 W.
As for the flange, it was not possible to evaluate its temperature with sufficient reliability, despite
the fact that it was partially framed by both IR cameras. A careful analysis of the relevant thermal
imagery revealed how part of the heat emitted from the flange was actually reflected heat coming
from the body of the dummy. In fact, the position of the flange is such that one of its sides
constantly receives radiative heat emitted by the body of the cylinder: if we were to attribute the
recorded temperature to the flange, we would risk overestimating the total radiative power.
Conservation of energy was used to evaluate the contributing factor of the flange, and of all other
not previously accounted factors, to the total energy of the dummy. Thus, we get:
810 [W] – (735 + 17) [W] = 58 [W] (22)
This last value is the sum of the contributive factors relevant to all unknown values, namely: flange
convection and radiation, breech convection (NB convection only), losses through conduction,
and the margin of error associated with our evaluation.
Since the temperatures reached by the dummy and by the E-Cat HT2 during their operation were
seen to be quite similar, this value will also be used to calculate the power relevant to the E-Cat
HT2, where it will be attributed the same meaning.
Analysis of data obtained with the E-Cat HT2
The E-Cat HT2 was started approximately at 3:00 p.m. on March 18. The initial power input was
about 120 W, gradually stepping up during the following two hours, until a value suitable for
triggering the self-sustaining mode was reached. From then onwards, and for the following 114
hours, input power was no longer manually adjusted, and the ON/OFF cycles of the resistor coils
followed one another at almost constant time intervals. During the coil ON states, the
instantaneous power absorbed by the E-Cat HT2 and the control box together was visible on the
PCE-830 LCD display. This value, with some fluctuations in time, remained in any case within
a range of 910-930 W. The PCE-830 LCD display showed the length of the ON/OFF intervals:
with reference to the entire duration of the test, the resistor coils were on for about 35% of the
time, and off for the remaining 65%.
As in the case of the dummy, in order to determine the average temperatures for the E-Cat HT2
we opted to divide its thermal images into five areas, plus another one for the breech. An analysis
of various time segments (about five hours each), taken in the course of each day of the test,
revealed that the behavior of the device remained more or less constant, and became quite stable
especially from the third day onwards. Using the same procedure as before, we obtained an average
temperature for each of the five areas, thereafter employing equations (5), (9), and (10) in order
to calculate power emitted by radiation and convection, respectively.
- 20 -Fig. 14. 5-area division of the E-Cat HT2 image. The flange does not appear in the image because
the display range chosen for the IR camera does not detect objects colder than 150°C.
Emissivity values for each area were adjusted in each IR camera video sample thanks to the
continuing presence of dots: according to position and time, the found values for ε fluctuated
between a low of 0.76 and a high of 0.80. Areas subject to the most intense heat were seen to
have slightly higher emissivity compared to peripheral ones, and all showed a slight upward
trend as the test progressed, probably because of a change in the properties of the paint.
In order to account for a certain degree of arbitrariness inherent in this method of evaluation, it
was decided to assign a reference temperature to the various areas into which the E-Cat HT2
had been divided. This was obtained by assigning to all areas the most frequently found value for ε
and associating a percentage error to it. This error is the result of the difference between two
extreme values, namely the temperature obtained by assigning to all areas the lowest level of
emissivity ever found in any one of them (= 0.76), and the temperature obtained assigning to all
areas the highest value for ε ever found (= 0.80). Tables 7 and 8 summarize the results: the first
refers to the average of temperatures in each of the five areas for different values of ε, whereas the
second gives the average values of power emitted by radiation (E) and convection (Q) for
different values of ε, while taking into account the sum performed on the five areas.
ε T 1 (°C) T 2 (°C) T 3 (°C) T 4 (°C) T 5 (°C) Average
Average ε 261.0 319.4 326.0 318.3 286.9 302.3
0.76 261.0 328.4 335.2 327.3 286.9 307.7
0.80 254.0 319.4 326.0 318.4 279.2 299.4
Table 7. Average temperatures relevant to the divisions into five areas of the E-Cat HT2’s
cylindrical body, calculated according to average values of emissivity (first row), absolute minimal
values (second row), and absolute maximum values (third row), collated by taking into
consideration all the areas and all the analyzed time intervals. The last column gives the averages of
the previous values for each of the five areas.
Ε E (W) Q(W) E(W) + Q(W)
Average ε 459.8 281.5 741.3
0.76 463.8 288.2 752.0
0.80 458.6 277.9 736.6
Table 8. Emitted power values by radiation (E) and by convection (Q) for different values of ε.
The numbers are computed from the power average of all five areas, minus the E_room
component arising from the contributing factor of ambient temperature.
- 21 -The error associable to the average value of emitted power may be got by taking into account the
difference between what is obtained by attributing to each area the highest possible and the
lowest possible value for ε. Thus:
(752.0-736.6)/741.3 = 2% (23)
As may be inferred from the last value above, the uncertainty regarding emissivity does not affect
the results much, and should therefore be considered a parameter of lesser critical import than
what was originally estimated.
The average temperature relevant to the breech, as well as its average emissivity, turned out to be
extremely constant over time, with values of 224.8°C and 0.88, respectively. We can therefore
associate them with a value of irradiated power E-E_room = 17 [W].
At this point, all the contributing factors relevant to the thermal power of the E-Cat HT2 are
available, i.e. the power emitted by the cylindrical body through radiation and convection, the
power emitted by radiation by the breech, and the set of missing factors (conduction, breech
convection, flange radiation and convection). It is now possible to obtain a complete estimate:
Emitted PowerE-Cat HT2 = (741.3 + 17 + 58) [W] = (816.3± 2%) [W] = (816±16) [W] (24)
Ragone Chart
Upon completion of the test, the E-Cat HT2 was opened, and the innermost cylinder, sealed by
caps and containing the powder charges, was extracted. It was then weighed (1537.6 g) and
subsequently cut open in the middle on a lathe. Before removal of the powder charges, the
cylinder was weighed once again (1522.9 g), to compensate for the steel machine shavings
lost. Lastly, the inner powders were extracted by the manufacturer (in separate premises we did
not have access to), and the empty cylinder was weighed once again (1522.6 g). The weight that
may be assigned to the powder charges is therefore on the order of 0.3 g; here it shall be
conservatively assumed to have value of 1 g, in order to take into account any possible source of
error linked to the measurement.
According to the data available from the PCE-830 analyzer, the overall power consumption of
the E-Cat HT2 and the control box combined was 37.58 kWh. The associated
instantaneous power varied between 910 and 930 W during the test, so it may be averaged at
920±10 W. In order to determine the power consumption of the E-Cat HT2 alone, one must
subtract from this value the contributive factor of the control box power consumption. As it was
not possible to measure the latter while the test on the E-Cat HT2 was in progress, one may refer
to the power consumption of the box measured during the dummy test. This value would in all
likelihood be higher in the case of operative E-Cat HT2, due to the electronic circuits
controlling the self-sustaining mode: so, as usual, we shall adopt the more conservative
parameter.
If one assumes that the control box absorbed about 110 W, we can associate the E-Cat HT2 with
a consumption of:
Instantaneous Power ConsumptionE-Cat HT2 = (920 – 110) [W ]= 810 [W] (25)
Keeping in mind the fact that this consumption was not constant over time, but may be
referred just to 35% of the total test hours, one may calculate the effective power
consumption of the device as:
Effective Power ConsumptionE-Cat HT2 = (810/100) · 35 = 283.5 [W] (26)
Let us further assume an error of 10%, in order to include any possible unknown source.
Errors of this extent are commonly accepted in calorimetric measurements, and in our case
they would comprise various sources of uncertainty: those relevant to the consumption
measurements of the E-Cat HT2 and the control box, those inherent in the limited range of
- 22 -You can also read