INDOOR SPORTS SECTION ONLY - INDOOR AND OUTDOOR SPORTS FACILITY STRATEGY - FIRST DRAFT FOR INTERNAL CONSULTATION ONLY - Ealing Council
←
→
Page content transcription
If your browser does not render page correctly, please read the page content below
INDOOR AND OUTDOOR SPORTS
        FACILITY STRATEGY

            INDOOR SPORTS
             SECTION ONLY

FIRST DRAFT FOR INTERNAL CONSULTATION ONLY

Internal Draft – March 2011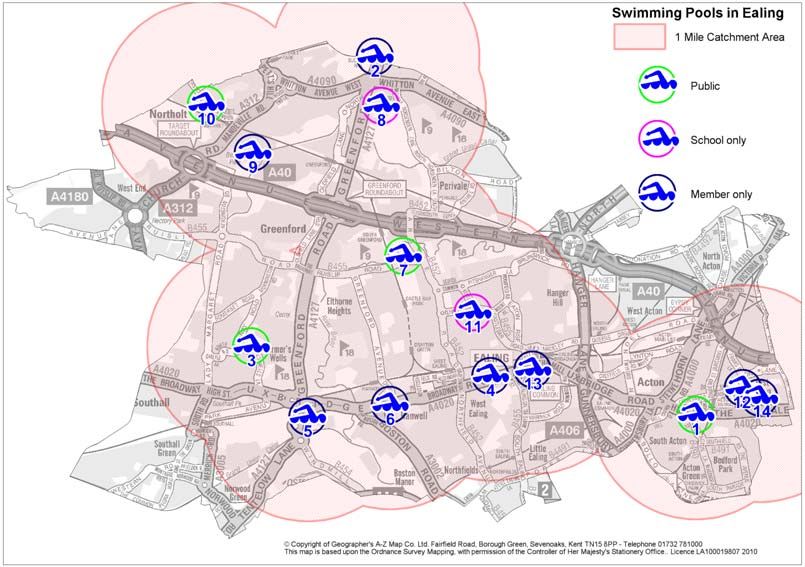
INTRODUCTION

The London Borough of Ealing has worked in partnership with Sport England’s Facilities
Improvement Service to develop a comprehensive evidence base for indoor and outdoor
sports facilities. The next stage involves applying that evidence base and the findings
into a draft sports facilities strategy, which assesses the current and future, need for the
most popular indoor and outdoor sports facilities across Ealing. This draft strategy
provides a basis for consideration by Ealing Council and subsequent consultation with
other interested parties.

The draft strategy has developed the evidence base into an assessment of future need
for a range of indoor and outdoor sports facility types. The draft strategy sets out the
need, scale and location for facilities to meet the current rate and frequency of sports
participation. The draft strategy considers how the projected changes in the Ealing
population up to 2021, based on the Borough’s own population projections, influences
the projected need for sports facilities up to 2021 and beyond. The draft strategy also
considers how the demand for the two main types of sports facility; sports halls and
swimming pools, changes by the aging of the Ealing resident core population between
2010 – 2021 and beyond.

Sports Participation
Sports facilities do not exist in isolation and therefore it is important to place the need for
facility provision in the context and understanding of the profile of sports participation
across the Borough. The most authoritative source of data is the annual Sport England
Active People survey of adult participation in sport, which commenced in 2006. In the
Active People Survey Sport England analysed the data on the English population (18+)
to produce 19 market segments with distinct sporting behaviours and attitudes. This
includes information on specific sports people take part in as well as why people do
sport, whether they want to do more sport and the barriers to doing more sport.

The headline findings from the Active People survey for Ealing have been assessed to
provide the profile of adult sports participation across Ealing – which age groups, males
and females participate most, where are they located across the borough and how does
the profile of the most dominate participant groups compare with the sports facilities they
are most likely to use. All this is essential context for understanding the current and
future need for sports facility provision.

Sports Participation and Sports Facility Provision in Ealing
The provision of sports facilities is also required to achieving some sports development
or sports participation objectives and therefore facility provision has to be considered in
the context of the contribution they make to changing/increasing sports participation and
widening access to sport.

In order to consider the facility needs and develop the facility strategy, Ealing Council
has set the following general sports participation objectives as well as sport specific
objectives for swimming and indoor sports and then assessed future swimming pool and
sports hall facility needs in helping to meet these objectives.

Internal Draft – March 2011
1.     More people more active on a regular basis, particularly specific target groups
2.     Improved awareness of the sport and active leisure opportunities available
3.     Strong sustainable network of sports clubs and other deliverers
4.     Appropriate indoor and outdoor sport and recreation facilities in the right place
5.     Greater awareness of the wider benefits of sport and being active
6.     A network of sport and active recreation provision, spread across Ealing
7.     Maximize the future benefits of the London 2012 Games

Objectives have been set and then applied for swimming pools and sports halls because
they account for around 70% of the formal participation in sports buildings and account
for the largest investment by local authorities. Hence the need for the setting of
objectives to assess the contribution these facility types make.

Indoor Sports Provision Assessment of Need and Spatial Assessment
Following on from the Ealing population and participation profile there is an extensive
assessment of the supply and demand for swimming pools and then sports halls.

This is followed by the setting of some objectives for delivering a sporting infrastacture
for both swimming pools and sports halls. This sets out the objective for each facility
type, key issues which arise in delivering the objective and then some options to
consider for delivery.

In addition to the Facility Planning Model, Sport England has developed other planning
tools to assess the need for indoor and outdoor sports facilities, known as Active Places
Power (APP). APP is not as extensive in its data and assessment capabilities as the
facilities planning model, which has been applied to swimming pools and sports halls.
However it is a robust, rigorous, locally based assessment tool, which applies Ealing
data and it is a spatial assessment.

APP has been applied to assess the need across Ealing for artificial grass pitches; all
weather athletic tracks; Multi Use Games Areas (MUGA); bowling greens; golf courses;
and netball courts facilities.

It is an extensive analysis of need for these seven facility types, which applies a
consistent methodology for each facility type to assess: supply and demand (quantity)
and an accessibility assessment. The assessment identifies a projected future need for
each facility type by scale and sets a planning standard based on the projected changes
in population and demand up to 2021.

For some facility types the methodology also includes application of Sport England’s
Sports Facilities Calculator (SFC) which assess the projected demand for some facility
types based on the projected new housing growth and the projected capital costs for the
demand identified by housing growth and the participation it creates. Use of the SFC is a
cross check on the APP methodology applied.

Internal Draft – March 2011
Outdoor Sports Facilities
This section of the draft strategy is a review of the current outdoor sports facilities in
Ealing. This is based on an assessment of the Council’s existing Playing Fields and
Outdoor Sports Assessment prepared in 2007, and takes into account comments
previously made and use of various tools and other techniques not available at the time.

This review also incorporates population projections and estimates for the borough for
2021, produced by the Council in late 2009, together with updated information (where
available) on the supply of pitches, courts and greens and on existing teams in the
borough.

Development Planning Policies and Planning Standards
The information in this section covers swimming pools and sports halls and sets out
some suggested planning polices for each facility types based on the supply and
demand assessment and spatial analysis for each facility type up to 2021. This section
also has a reasoned justification for the policies, which draws on the needs and
evidence base.

The final section on swimming pools and sports halls sets out a suggested planning
standard and level of developer contributions based on this standard.

The reason for setting out such an extensive assessment for swimming pools and sports
halls is because these two facility types account for around 70% of the formal
participation in sports buildings and are the biggest investment by local authorities.

Implementation, funding and Delivery
Ealing Council has outlined its proposals for future facility developments and associated
timescales covering both indoor and outdoor facilities for both formal and informal use by
individuals and groups of people. It is not possible at this stage to give details about
how these schemes will be funded as this is an ever changing, dynamic issue which will
vary with each facility improvement project due to the funding sources available at any
one time. Julia - Could we make reference to the Infrastructure Delivery Plan? As a live
document this could be the place to provide some of these details.

Review and Monitoring
This strategy has been produced to enable the development of sports facilities within the
borough to be provided for in a planned and coordinated way that meets the needs of
Ealing’s population and satisfies areas of greatest demand.

It is proposed that a strategy steering group review this strategy on an annual basis. The
findings of this review will be reported to the Ealing CSPAN and to the Council. Each
review will compare achievements against priorities, taking account of changes in
circumstances and potential new opportunities. An annual review will allow any slippage
to be recognised and priorities re-timetabled accordingly. The review will also provide an
updated facility audit of indoor and outdoor facilities and this information will be fed into
the Active Places database.

Internal Draft – March 2011
A comprehensive review of the strategy will need to be undertaken in 2015 to allow
sufficient time for a subsequent strategy to be produced.

Internal Draft – March 2011
METHODOLOGY

This strategy report has been undertaken using many of the strategic planning tools
provided by Sport England, and available on the website. The following tools have been
used in the creation of this draft strategy.

Active Places Power

The Active Places Power website has been developed to provide a planning tool for sports
facilities. It has been designed to assist in investment decisions across Government and to
help local authorities carry out audits of their sports provision and develop local strategies. It
will also help national governing bodies of sport in identifying and planning where they need
to improve and invest in facilities for their participants. Active Places Power has a single
database that holds information on sports facilities throughout England. It includes local
authority leisure facilities, as well as commercial and club sites.
The site gives users enhanced capabilities for analysing the data on the system. These
include standard reports, census databased thematics and a series of push-button analyses
(based on the complex modelling functionality developed by the University of Edinburgh)
designed to examine the catchments of existing and potential facilities. The site includes
tools for detailed analysis, including thematic maps, reports, advanced queries and strategic
planning tools, all of which have been utilised in this study

Sports Facilities Calculator

The SFC has been created by Sport England to help local authorities quantify how much
additional demand for the key community sports facilities (swimming pools, sports halls
and synthetic turf pitches), is generated by populations of new growth, development and
regeneration areas. It is designed to be used to estimate the facility needs of discrete
populations, such as sports hall and swimming pool created by a new community of a
residential development.
Whilst the SFC can be used to estimate the swimming and sports hall needs for whole
area populations, such as for a whole local authorities, there are dangers in how these
figures are subsequently used at this level in matching it with current supply for strategic
gap analysis. The SFC does not take account of:
    • Facility location compared to demand
    • Capacity and availability of facilities - opening hours
    • Cross boundary movement of demand
    • Travel networks and topography
    • Attractiveness of facilities
For these reasons total demand figure generated by the SFC should not simply be
compared with facilities within the same area. The SFC is therefore used in this study to
give an overall indication of demand, but is only used in conjunction with other tools to
assess the adequacy of existing provision, and highlight futureneeds

Internal Draft – March 2011
Facilities Planning Model
he FPM is a computer model (developed and used on licence from Edinburgh
University), which helps to assess the strategic provision of community sports facilities.
So far the work has concentrated on the major community sports facilities of sports halls,
swimming pools and synthetic turf/artificial grass pitches.
The Model has been developed as a means of:
• Assessing requirements for different types of community sports facilities on a
local, regional or national scale
• Helping local authorities determine an adequate level of sports facility provision
to meet their local needs
• Testing ‘what if’’ scenarios in provision and changes in demand, this includes
testing the impact of opening, relocating and closing facilities and the impact
population changes would have on the needs of the sports facilities.
In its simplest form the model seeks to assess whether the capacity of existing facilities
for a particular sport are capable of meeting local demand for that sport taking into
account how far people are prepared to travel to a facility. In order to estimate the level
of sports facility provision in an area, the model compares the number of facilities
(supply), by the demand for that facility (demand) that the local population will produce.
The level of participation is estimated using national participation rates and applying
them to the number of people who live in the local area.
The outputs considered in this study are from Sport England’s National Facilities Audit
Dataset as of May 2010.
Internal Draft – March 2011PROFILE OF SPORTS PARTICIPATION IN EALING – WHO PARTICIPATES –
HOW OFTEN – WHICH SPORTS ARE MOST POPULAR WITH THE EALING
DOMINANT MARKET SEGMENTS?
This section of the draft strategy provides an overview of sports participation across
Ealing based on the findings of the Sport England Active People survey of adult
participation in sport. (LBE may wish to add to this with findings from local surveys of
sports participation for adults/by a clubs/young person that provides a borough wide
perspective).
It contains
A profile of the Ealing Population and the Profile of Sports Participation for
Swimming and Indoor Hall Sports
Sports Participation in Ealing - Who Does What?
What is the Spatial Profile of Adult Sports Participation Across Ealing?
Which people participate most in sport in Ealing and where are they located in
Ealing?
Ealing Population and the Profile of Sports Participation for Swimming and Indoor
Hall Sports
The age structure for the Ealing population in 2011 s set out in Table 1 below in 5 year
age bands. This is followed by Table 2 and 3 which set out the rate and frequency of
participation for males and females in first swimming and secondly sports halls (Note:
Sport England assesses the participation rate for sports halls based on a balanced
programme of activities across a range of indoor hall sports and so it is a s ports hall rate
of participation and not for any one individual sport.)
The purposes of setting out these tables are to see how the Ealing population in 2011
correlates with the percentage and frequency of sports participation for swimming and
sports halls and then to assess what changes up to the period 2021.
Table 1 Ealing 2011 Projected All Resident Population
Internal Draft – March 20112011 Projected All Resident Population
35,000
30,000
25,000
Population
20,000
Series1
Series2
15,000
10,000
5,000
0
0 - 4 5 - 9 10 - 15 - 20 - 25 - 30 - 35 - 40 - 45 - 50 - 55 - 60 - 65 - 70 - 75 - 80 - 85 - 90 +
14 19 24 29 34 39 44 49 54 59 64 69 74 79 84 89
All All All All All All All All All All All All All All All All All All All
Age
Table 2: Sport England Rates and Frequencies of Sports Participation in
Swimming
0-15 16-24 25-39 40-59 60-79
Participation -% of M 13.23 10.86 13.73 8.13 3.93
age band F 12.72 14.51 18.89 10.44 4.52
Frequency - VPWPP M 0.92 0.84 0.71 0.94 1.18
F 0.95 0.76 0.79 0.81 1.07
A summary of findings are:
Swimming
• The age groups with the highest rate of swimming participation (table 2) are the 25-
39 age groups with a rate of 13.7% of the male population and 18.8% for the
female population. In terms of the Ealing, population these age bands are the first,
second and fourth highest groups for all the resident and male population and the
first, second and third highest groups for the female population. So the largest age
group of the Ealing population in 2011 corresponds with the same age groups
which have the highest participation in swimming. Demand for swimming in Ealing
is likely to be greatest now and in the next few years as this age group passes
through the 25 – 39 age bands.
• The next highest age group for swimming participation is the 0 – 15 age range at
13.2% for males and 12.7% of females participating in swimming. In terms of the
Ealing population in this age band it is around two thirds of the size of the 25 – 39
Internal Draft – March 2011age bands. So the second highest age band for swimming participation is not a big
driver for swimming pool demand
• Similarly the third highest age band for swimming participation 16 – 24 years of
age is around two thirds the size of the highest age group for swimming the 25-39
age band. So again this category is not going to be a big driver for an increase in
the demand for swimming pools in the years to come.
• Overall based on this comparison of the age structure and distribution of the Ealing
population when compared with the highest age groups for swimming participation
it is reasonable to assume that the demand for swimming is highest now in Ealing
and not going to experience a “bulge/increase” in swimming demand form the
aging of the Ealing core resident population in 2011.
Impact of the Projected Increase in Population on Swimming Participation and
Swimming Pool Need
The next question to consider is what impact does the projected increase in the Ealing
population between 2011 – 2021 have on the demand for swimming? This has been
assessed explicitly in the supply and demand analysis for swimming pools and is
reported on in detail in section xx of this report. However the headline findings are that
between 2010 and 2021 the LBE total population is projected to increase from 323,150
people to 337,600 people. This is an increase of 14,450 people, or 4.4%.
The total demand for swimming resulting from this population increase is to increase the
demand for swimming from 19,500 visits in 2010 to 20,050 visits in 2021. This is an
increase of only 550 visits per week, or a 2.8% increase in swimming demand. So whilst
the LBE population increases by 4.4% between 2010 – 2021, the impact is to increase
total swimming demand by only 2.5% between 2010 – 2021. To provide further context,
this level of increase in total demand, of some 550 visits per week in the peak period,
equates to around 65 sq metres of water. Furthermore on context, a 25 metres x 4 lanes
swimming pool is 212 sq metres of water.
In short population growth in Ealing between 2011 – 2021 is not a big driver in
increasing the demand for swimming. The biggest driver is catering for the swimming
demand generated by the core resident population and as reported the “peak for
swimming demand” is in 2011 and the aging of the resident population should decrease
the demand for swimming.
One final question to pose is what if the rate and frequency of swimming participation
increases by the resident population will this not increase the demand for swimming.
Indeed it will and this impact is reported on in section xx of this report
Internal Draft – March 2011Sports Halls
• The age groups with the highest rate of hall sports participation (table 3) are
different for males and females. For males it is the 16 - 24 age groups with a rate
of 14.9% of the male population and for females it is 25 – 34 age groups with a
rate of 11.6% of the female population. The second highest age groups are
males 25 -34 age group with a rate of 14.9% of the male population and the 35-
44 age groups for females at 9.4% of the female population.
• In short the highest rates of sports hall participation are spread over the 16 – 34
age groups and only a 1% difference in the male participation and a more
marked 2.5% difference in the female.
• Comparing these age groups for sport hall participation to the Ealing 2011 age
groups shows that the male population is is 9th and 10th highest in the 16-24 age
groups (out of 19 age bands). Whilst the female population in the highest
category for hall sports participation (25 – 34) is first and third highest.
• Putting the two sets of findings together it is less clear cut as to whether halls
sports participation “is/has” peaked in 2011 and the aging of the Ealing
population core resident population up to 2021 is going to see less of a demand
for sports halls than at present. Based on the comparisons of the Ealing
population information and the sports hall participation it is very reasonable to
assume that demand is not going to decrease from the current level with the
aging of the core resident population
Table 3: Sport England Rates and Frequencies of Sports Participation for Sports
Halls.
0-15 16-24 25-34 35-44 45-59 60-79
Participation -% of age M 9.55 15.04 14.96 11.08 5.68 5.55
band F 6.03 9.31 11.66 9.40 5.40 4.28
Frequency - VPWPP M 0.85 0.88 0.88 0.90 0.92 1.10
F 0.99 0.85 1.03 0.90 1.02 1.27
Internal Draft – March 2011Impact of the Projected Increase in Population on Sports Hall Participation and Need for Sports Halls Posing the question - what impact does the projected increase in the Ealing population between 2011 – 2021 have on the demand for sports halls? Again this has been assessed explicitly in the supply and demand analysis for sports halls and is reported on in detail in section xx of this report. Like swimming the headline findings are that between 2010 and 2021 the LBE total population is projected to increase from 323,150 people to 337,600 people. This is an increase of 14,450 people, or 4.4%. The total demand for sports halls in 2021 resulting from the population increase between 2010 – 2021 is 15,900 visits, only slightly up from 15,600 visits projected in 2010. This is an increase of 300 visits or, a 1.9% increase in total demand between the two years. So whilst the LBE population increases by 4.4% between 2010 – 2021, the impact is to increase total demand for sports halls by only 1.9% between 2010 – 2021. To provide further context, this level of increase in total demand, of some 300 visits equates to around provision of between 1- 2 badminton courts. As with swimming the projected increase in the Ealing population between 2010 and 2021 is not a driver for increasing sports hall provision. The impact of any projected increase in sports hall participation and what this means for sports hall demand is set out in the report under the supply and demand assessment. Internal Draft – March 2011
SPORTS PARTICIPATION IN EALING - WHO DOES WHAT AND WHERE DO
THEY LIVE?

Having set out the relationship between the Ealing population and sports participation
figures, it is also important as context for the sports facility assessment to set out where
the main sports participant groups are located in Ealing, which sports are most popular
with these groups and how does this SPATIAL and PARTICIPATION profile relate to
swimming and sports halls.

What is the Spatial Profile of Adult Sports Participation across Ealing?

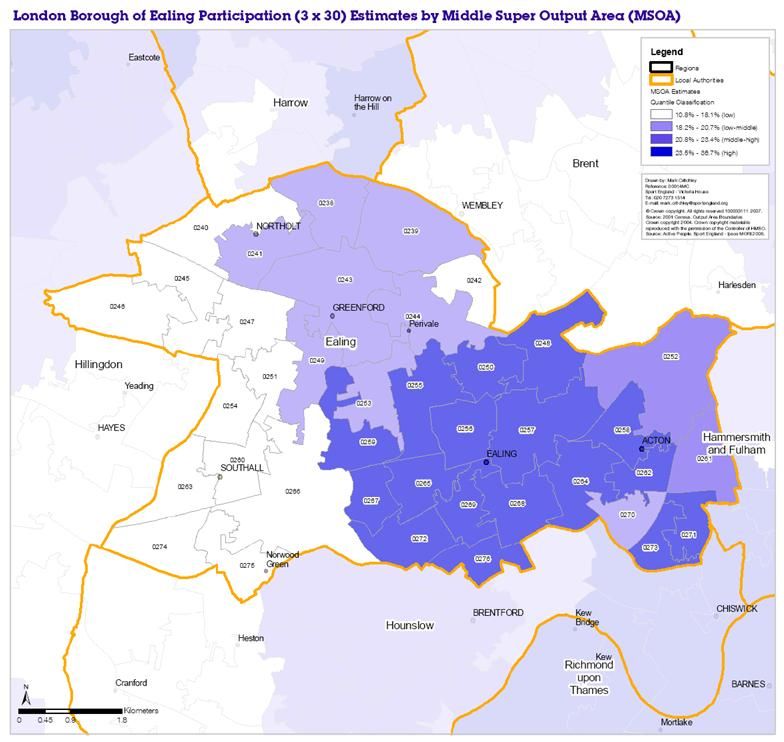
The first Active People survey in 2006 measured sports participation in by KPI 1 (at least
3 days a week x 30 minutes moderate participation these findings for Ealing are set out
in Map 1 below. As can be seen the west side of the borough has the lowest level of
sports participation measured by KP1 with participation in this area as being between
10.8% and 16.1% of the population undertaking 3 x 30 minutes participation in moderate
level activity a week. This contrasts with the areas shaded dark blue which are the
central Ealing areas of the borough where the same KP1 measure is between 23.5%
and 26.7%.

A barrier to increasing sports participation is the physical access to sports halls and
swimming pools and it will be important to establish how much of the Ealing population
travels to sports facilities by foot and where this demand is located in relation to sports
facilities. In short is there a barrier to sports participation on the West side of the
borough because there is limited supply of sports faculties and there is a high
percentage of the population without access to a car and travels to facilities on foot.

Map 1 Spatial Representation of the Levels of Sports Participation across Ealing –
Measured by Adults 3 x 30 Minutes of Moderate Activity per Week

Internal Draft – March 2011
Which people participate most in sport in Ealing?

As part of the Active People survey findings Sport England analysed the data on the
English population (18+) to produce 19 market segments with distinct sporting
behaviours and attitudes. This includes information on specific sports people take part in
as well as why people do sport, whether they want to do sport and the barriers to doing
more sport. In addition, the segments provide information on media consumption and
communication channels, social capital, health indicators including obesity and
engagement in the wider cultural sphere. Further information on the market segments,
including detailed 'pen portraits' for each of the 19 segments, is available at the Sport
England website.

The power of these sporting segments lies not only in their ability to help us better
understand the characteristics of our potential market but also to explore the market
base at differing geographic levels. It is possible to analyse the market in a particular
street, community, local authority or regions. Each segment has been assigned a name
which reflects the most popular first names for the group.

Market segmentation allows us to develop a more sophisticated, tailored approach to
delivering services. In tailoring the service we provide to the customer’s individual
needs, rather than adopting a ‘one size fits all’ approach. It is one of the best tools we
have to improve public services and outcomes.

The chart below shows the proportion of each of the nineteen segments in Ealing (the
blue bars) set against the regional (the red bars), ProActive West (the yellow bars) and
national average (the green dots).

Chart 1: Active People Market Segmentation for Ealing

In terms of which market segments are the high participants in Ealing this is set out in
Table 4 below, for the 5 highest market segments, together with a description of that
segment and the percentage of participation at various geographical levels.

Internal Draft – March 2011
Table 4 Ealing Dominant Market Segments

  Market Segments with Highest Participation in Ealing

  Market        Forename(s     % Part’ion    % Part’ion    % Part’ion     difference
  Segment       )              in Ealing     in            in             between
                                             ProActive     England        Ealing
                                                                          and
                                                                          England

  1 – Sports    Jamie          11.7          10.1          5.4            6.3% more
  team                                                                    in Ealing
  drinker
  2–            Tim            11.4          10,2          9.4            2% more
  Settling                                                                in Ealing
  down
  Male
  3 - Fitness   Chloe          8.8           7             6.9            2.1%more
  Class                                                                   in Ealing
  Friends
  4-            Ben            7.9           7             6.4            1.5%more
  Competitiv                                                              in Ealing
  e Male
  Urbanite
  5 - Pub       Kev            7.8           7.9           5.8            2% more
  League                                                                  in Ealing
  teamMale
  s

In terms of which sports these dominant market segments for Ealing participate in most,
the Active People survey describes these as:

   •   Jamie Second highest participation rate of all the types; enjoys watching and
       playing team sports, especially football. Fitness classes are not appealing to
       them, but combat sports, social activities and weight training would be

   •   Tim A very active type, enjoying high intensity activities. Enjoys technical sports
       such as skiing and water sports, uninhibited by the financial outlay. Both team
       games and individual activities feature high on his agenda, and personal fitness
       activities are also popular. Likely to have private gym membership, and compete
       in some sports.

   •   Chloe An active type that primarily enjoys exercise classes that they can go to
       with friends, over individual activities or team games. Swimming is popular, as
       is going to the gym, but combat sports do not appeal (See Fig. 2). Likely to be a
       member of a gym or fitness club, but for the classes and for socialising more than
       using gym equipment

Internal Draft – March 2011
• Ben The most active type across the population. Team sports are particularly
popular, along with other high intensity activities such as lifting weights at the
gym or competitive court games
• Kev Enjoys team sports, especially football, and also combat sports or low
intensity social activities such as darts or pool.
Key Findings from the Assessment of the Main Market Segments Participant
Groups in Ealing
The main findings from this assessment are
• They are male dominated with 4 of the 5 highest participation market segments
being male but swimming participation is highest amongst females in the 25 – 39
age groups at 18.8% of the adult population. Chloe is part of this age group.
• The market segments which are most popular for swimming are not very evident
in Ealing, with only Chloe and Ben appearing in the top five market segments.
The market segments which participate most in swimming are in order of highest
participation nationally: Chloe 3rd highest participation segment in Ealing);
Helena segment 5 and 7th highest segment in Ealing with 6.1% participation;
Leanne, 6th highest market segment in Ealing with 7.8% participation; Ben 4th
highest market segment in Ealing and 7.9% participation; and finally, Alison 13th
highest market segment in Ealing but only 3.1% participation.
• For hall sports there is a closer relationship between participation and the
dominant market segments in Ealing. The top three market segments for hall
sports participation are also amongst the top five market segments in Ealing and
in order of highest participation are: Ben, Jamie and Tim, followed by Philip 8th
highest market segment in Ealing and 3.8% participation and Terry, 16th highest
market segment in Ealing and 2.8% participation.
• For sports halls the profile of the market segments does suggest a programme
of competitive team sports to cater for males – IF the objective is to increase
sports participation. Intervention to achieve higher female participation does
require different programmes of activities and more development work to change
the profile of hall sports participation.
• Possibly the Ealing market segments profile does suggest use of ancillary
halls/dance studios for dance and aerobics as these activities reflect more
closely the market segment profile of female sports participation in Ealing with
the Chloe’s, Leanne’s and Helena’s.
Where are the Market Segments Located in Ealing?
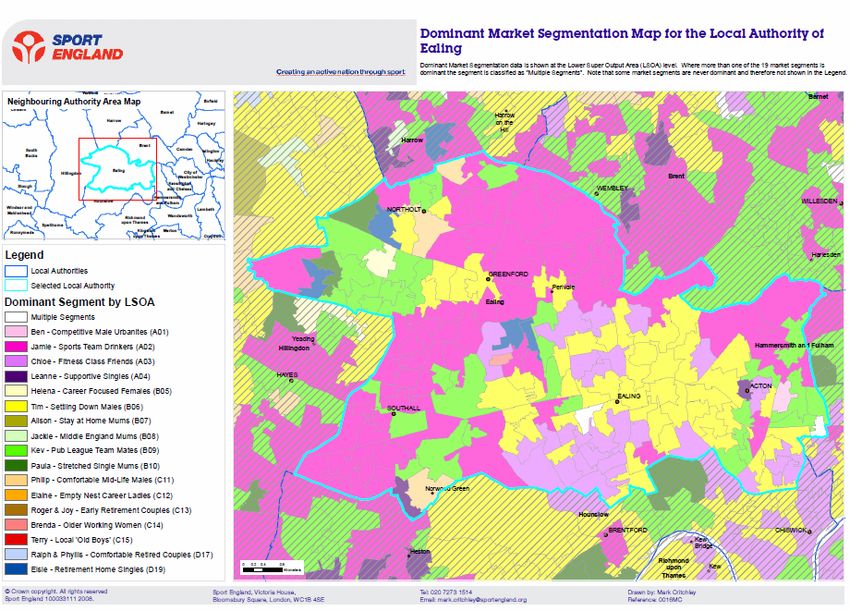
Map 2 below illustrates where the most dominant market segments in Ealing are located
and in order of priority, in terms of greatest geographical spread.
Internal Draft – March 2011Map 2: Spatial Representation of the Location of the Dominant Market Segments
Across Ealing: Active People 1 Survey October 2006
In terms of which are the dominant groups shown in the map and their sporting
participation profile these are
• Ben (light pink) The most active type across the population. Team sports are
particularly popular, along with other high intensity activities such as lifting
weights at the gym or competitive court games.
In effect across large areas of the north and west of the borough – especially
Southall and Greenford and smaller areas to the far NW and NE boundaries of
the borough. Possibly covering around 50% of the Borough area
• Tim (yellow) A very active type, enjoying high intensity activities. Enjoys technical
sports such as skiing and water sports, uninhibited by the financial outlay. Both
team games and individual activities feature high on his agenda, and personal
fitness activities are also popular. Likely to have private gym membership, and
compete in some sports.
Very evident in the central area of the borough around Ealing town centre and
smaller areas around Greenford and Northolt. Possibly covering around 20% of
the Borough area
• Chloe (light purple) An active type that primarily enjoys exercise classes that
they can go to with friends, over individual activities or team games. Swimming
Internal Draft – March 2011is popular, as is going to the gym, but combat sports do not appeal (See Fig. 2).
Likely to be a member of a gym or fitness club, but for the classes and for
socialising more than using gym equipment.
Evident in an area south of Ealing town centre and in a smaller area north of
Ealing town centre and in the far SE of the borough. Possibly covering around
10% of the borough area.
• Kev (green) Enjoys team sports, especially football, and also combat sports or
low intensity social activities such as darts or pool.
One area west of Greenford and south west of Northolt, plus a smaller area south
and east of Acton. Possibly covering around 5% of the borough area.
Key Findings From the Geographical Assessment of the Main Market Segments
Participant Groups in Ealing
• In effect there are 4 dominating segments across Ealing and in approximate
terms these 4 segments cover around 85% of the borough area.
• Three of the four groups are male and Chloe the only female group with around
10% of the borough area is the only group with a strong profile for swimming.
Chloe’s are located where there is good swimming pool provision.
• Swimming is a true cradle to grave activity and as shown by table 2 there is
around 10% of the population in the 40-59 age group and 4% of the 60+ age
group who participates in swimming. However the dominate market segments for
these age groups do not appear at all in Ealing: Roger and Joy; Brenda; Terry
and especially Ralph and Phyliss
• The profile of the dominant groups is very consistent with participation in hall
sports – albeit these are male dominated types of activities around competitive
and team sports. A simple assessment might be that if an objective is to increase
adult participation in sport across Ealing then schedule more time for competitive
team sports at both indoor and outdoor sports facilities at all venues.
• The north focused on Greenford and going further north and the west side of the
borough going north and south of Southall is focused on one dominant group,
which is Ben. However in terms of the overall population profile of this area how
representative are Ben’s. Hence this very dominant finding possibly says more
about the level of low participation by the main population groups resident in this
area.
This area is also characterised by the lowest level of sports hall and swimming
pool provision
Note some of this work is reported on in the Ealing Council report on “Change for Life”.
However the purposes of developing this Adult People work further here and expanding
it is to set the context for how sports participation matches up with facility provision for
pools and halls. Also to help in setting some possible sports objectives for the facilities
strategy which links the participation findings to facility provision
Internal Draft – March 2011SWIMMING POOLS The overall vision for swimming is to create a network of high quality pool facilities geographically spread across the borough which gives local people the opportunity to take part in a wide range of water based sports and activities, progressing from learn to swim classes through to elite competition, increasing the number of people who take part in swimming and other water based activities. In order to achieve this aim, there is a need to assess the existing pool stock available to the community and how this may change in the future due to the impact of population growth and a rise in participation. The location of swimming facilities in Ealing There are 14 individual swimming pool sites in the borough with 8 commercial swimming pools sites, operated on a membership basis and a minority of 4 sites operated by the Council or its Leisure Management partner GLL on a pay as you swim basis with a swimming development programme. Two more pools are based on school sites, the school and a local club use one pool, and the other has no community access. Internal Draft – March 2011
No.   Site               Pool space          Ownership/Use             Year built/
                         (SQM)                                         Refurbished
1     Acton Baths              297           Council - public           1904/1999
                               198
2     David Lloyd              300           Private – members only     1998/2004
      (Sudbury Hill)           110
                            160 & 16
                            (Outdoor)
3     Dormers Wells            240           Council - public             1972
      Leisure Centre
4     Eden Fitness              160          Private – members only       2007
5     8th Level                 200          Private – members only     1997/2007
6     Golds Gym                 132          Private – members only     1997/2003
      Gurnell Leisure           750          Council - public           1981/2009
      Centre                    225
8     Horsenden Hill      120 (Too small)    Council – School & Club      2003
      Primary School
9     LA Fitness          105 (Too small)    Private – members only       1995
10    Northolt Leisure          495          Council - public             2010
      Centre                    192
11    Notting Hill &     225 (Private use)   Private – School only        2004
      Ealing High
      School
12    The Park Club       160 (Too small)    Private – members only       2000
                           200 (Outdoor)
13    Virgin Active             160          Private – members only     1993/2004
      (Ealing)
14    Virgin Active            313           Private – members only     2002/2008
      (West London)            30

Internal Draft – March 2011
Assessment of the demand and supply of swimming facilities now and in 2021 Sport England has an extensive range of planning tools that can be used to assess the current and future demand and supply for swimming facilities in specific areas, including the Facility Planning Model (FPM), which is the most comprehensive of all. The FPM provides information regarding how much demand for swimming pools is being met, where the highest levels of unmet demand are and how much demand is being exported and imported from neighbouring boroughs. The FPM only recognises certain swimming pools as being of an appropriate size for evaluation. Small pools are included when on a site where another pool is large enough to be included in the assessment. Accessibility is also factored into the assessment when considering public access to private members clubs. Outdoor pools are not included. The pool space shown in red in the table above has not been included in the following assessment. Using Sport England’s Facility Planning Model, the level of demand for swimming pools in London matches supply, but there are significant sub regional variations. West London has 54 pool sites, 31 public and 23 commercial and demand is virtually in balance with supply, satisfied demand is very high at 91% and pool capacity will be close to full by 2021. Ealing carried out an analysis of 7 separate scenarios, the complete findings are set out in a separate report, but the findings from two of the scenarios form the basis of this assessment. When considering what scenarios to test, the following key drivers for change were considered; the rise in population, the projected increase of 11% per annum in swimming participation, the wish to continue to provide a 50m pool in Ealing and the mixed age range of the swimming pool stock. In assessing the future provision for swimming across Ealing it is important to understand and separate out the pools by ownership, operation and different patterns of use of membership based sites and public sites. It is also important to factor in the impact of having the largest swimming club in the country based in Ealing and the wider West London area. All these drivers for change have been isolated and assessed as to their individual and collective impact on the assessment of the future provision for swimming in Ealing. The first scenario assessed the current supply and demand for swimming pools in 2010, to establish a baseline position on supply and demand for swimming facilities. The second scenario, which was actually run 4, assessed the future demand for swimming in 2021 based on GLA population projections for the study area surrounding Ealing and the Ealing population projections and new housing allocations. This scenario also factored in a projected 1% increase in swimming participation each year between 2010 – 2021, an 11% increase in total between the two years. The supply side assumptions in this scenario included the replacement of Acton Baths with a new swimming facility on the same site which included 2 pools, one a 25m x 17m eight lane main pool and a 16m x 12m learner pool and the replacement of existing facilities at Gurnell Leisure Centre with a 50m x 17m eight lane pool and a 16m x 12m learner pool. Current Supply and Demand Analysis for Swimming Pools in Ealing (Scenario 1) The findings in scenario one establish the baseline position for Ealing with regard to current demand and supply for swimming, accessibility to existing pools by car and on foot, the capacity of existing pools and the location of facilities. Internal Draft – March 2011
The 10 swimming pool sites highlighted above were included in the FPM analysis across
the borough in 2010, of these, 6 are commercial members only sites and the remainder
are Ealing owned and operated swimming pools for public use.
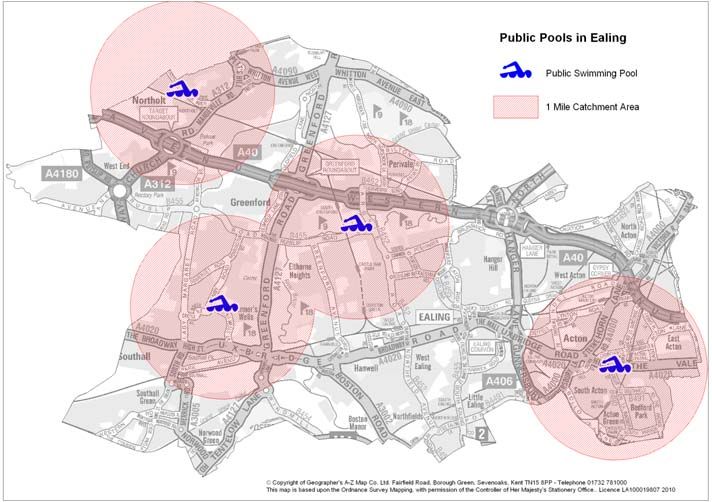
The location and distribution of the 10 sites including the 1 mile/20 minutes walk to
catchment area is set out in Map xxx . There is good geographical coverage of the
borough based on the pool locations however 6 sites are commercial sites. If the sites
are restricted to public pools only then the picture of supply changes considerably as set
out in the second map. By this assessment there are large areas of central Ealing that
are outside the walk to catchment area of any public swimming pool.
Pool Locations in 2010 with Walk to Catchments: All Pools and Public Pools Only
EALING POOLS FPM
POOL LOCATIONS & 1 MILE WALKING CATCHMENTS
RUN 1 CURRENT SUPPLY, 2010 DEMAND
A
Harrow
Harrow
Brent
DAVID
DAVID LLOYD
LLOYD
Hillingdon
NORTHOLT
NORTHOLT LC
LC
A4180
A312
GURNELL
GURNELL LC
LC A40
Ealing
Ealing
A406 )
A40(M
Ealing
M
DORMERS
DORMERS WELLS
WELLS LC
LC EDEN
EDEN FITNESS
FITNESS VIRGIN
VIRGIN ACTIVE
ACTIVE (EALING)
(EALING)
41
GOLDS
GOLDS GYM
GYM VIRGIN
VIRGIN ACTIVE(W
ACTIVE(W
EIGHTH
EIGHTH LEVEL
LEVEL H&F
H&F ACTON
ACTON BATHS
BATHS
Hammersmith
A3
& Fulham
Hammer Key
M4 A205
Hounslow
Hounslow Pool Site
M4
A4 with 1Mile
A307 walking catchment
Additional material ®Sport England 2010
Source: 2001 Census, Output Area Boundaries, ITN Roads data.
Map produced by The Planning Data Management ® Crown Copyright 2010. Licence numbers C02W0003683 & 100033111
A30 Service A with the permission of the Controller of HMSO
Crown Copyright material is reproduced
22/02/10 Job BZ using Mapinfo for Sport England A316 ®The Automobile Association 1999, all rights reserved
EALING POOLS FPM
POOL LOCATIONS & 1 MILE WALKING CATCHMENTS
RUN6 CURRENT SUPPLY OF PUBLIC POOLS, 2010 DEMAND
A
Harrow
Brent
Hillingdon
NORTHOLT
NORTHOLT LC
LC
A4180
A312
GURNELL
GURNELL LC
LC
Ealing A40
A406 )
A40(M
DORMERS
DORMERS WELLS
WELLS LC
LC Ealing
Key
M
41
ACTON
ACTON BATHS
BATHS
Hammersmith
A3 Pool Site
with 1Mile
& Fulham walking catchment
Hammer
M4 A205
Hounslow
Hounslow
M4
A4
A307
Additional material ®Sport England 2010
Source: 2001 Census, Output Area Boundaries, ITN Roads data.
Map produced by The Planning Data Management Service ® Crown Copyright 2010. Licence numbers C02W0003683 & 100033111
A30 A with the permission of the Controller of HMSO
Crown Copyright material is reproduced
08/07/10 Job BZ using Mapinf o f or Sport England A316 ®The Automobile Association 1999, all rights reserved
Internal Draft – March 2011Supply and demand for swimming in Ealing In terms of the supply and demand for swimming, the current total capacity of Ealing’s pools is 28,900 visits, whilst total demand is 19,500 visits. So the capacity is greater than demand in 2010 by 9,400 visits, or demand across the borough represents 67% of total supply. In terms of the amount of swimming demand that can be satisfied this is very high at 91% of the total swimming pool capacity, which means that 91% of total demand for swimming is located inside the catchment area of a swimming pool. This means there is 9% of unmet demand, the reason there is unmet demand when supply is greater than demand is because some demand is located outside the walk to catchment area of any pool and these areas are shown in the first map above, mainly along the Hillingdon border. When only public pools are considered, the areas outside the catchment of any pool are identified as a large part of Central Ealing and to the east of Central Ealing. Unmet demand at 9% of total demand is measured as 1,591 visits or 195 square metres of water. A 25 metre 4 lane swimming pool is 212 sq metres of water so the unmet demand is not significant in pool scale. This unmet demand is because some of the population is located outside the catchment area of a pool. Ealing retains some of its own demand for swimming and also exports demand to pools in neighbouring authorities and imports demand from surrounding areas as well. This is calculated based on where people live and the swimming pools located nearest to where they live. Ealing retains 72% of the demand it generates and exports the remaining 28% of its satisfied demand. The biggest export is to Hounslow at 13% of the Ealing satisfied demand and Hillingdon where 8% of the Ealing demand is met. Ealing imports demand into the borough where the nearest swimming pool to residents in neighbouring authorities is located in Ealing. Some 32% of the satisfied demand at Ealing’s pools is imported, with 10% coming from Brent, 8% coming from Hillingdon and 6% coming from Harrow. So Ealing is a net importer of swimming demand and its pools are of particular benefit to Brent residents. Accessibility to Ealing’s pools Accessibility to swimming pools is very important and in strategic planning terms it is possible to measure accessibility based on where people live, the location of the swimming pools and people’s travel patterns to pools, by car, public transport and on foot. It is possible to measure and overlay this assessment, which is based on sport England Research through its swimming pool user surveys and Benchmarking Service on the travel patterns to swimming pools and then applying this information to the Ealing population. In Ealing it is estimated that some 71% of all visits to swimming pools are made by car, based on a 20-minute drive time catchment, 7% of visits are made by public transport, based on a 15-minute catchment area and 22% are made by walking, based on a 20- minute/1 mile walk to catchment area. There is excellent accessibly to swimming pools based on the car borne catchment area with all the Ealing population having access to at least 5 – 9 swimming pools and in Internal Draft – March 2011
some areas between 10 – 16 swimming pools. This is shown in Map xxx below where
the central area of Ealing has the accessibility to between 5-9 swimming pools and the
outer area between10 – 16.

Map 4; Accessibility to Swimming Pools In 2010 Based on the 20 Minute Drive
Time Catchment Area

       EALING POOLS FPM
       NUMBER OF ACCESSIBLE POOLS WITHIN DRIVE TIME CATCHMENTS
       RUN 1 CURRENT SUPPLY, 2010 DEMAND
                                                                                                                                        A
                                                 Harrow

                                                                                             Brent

                    Hillingdon

                                              A4180
                                                  A312
                                                                                                                                   Key
                                                                                                                                   Number of pool sites within
                                                                                                                                   FPM drive time catchment
                                                                                            A40                                    of OA centroids
                                                                   Ealing
                                                                                 A406                                           )
                                                                                                                           A40(M               20 to 37
                                                                                                                                               15 to 16

                                                                                                                                 M
                                                                                                                                               10 to 15

                                                                                                                                   41
                                                                                                                                                5 to 9
                                                                                                                                                3 to 5
                                                                                                     Hammersmith
                                                                                                               A3

                                                                                                      & Fulham
                                                                                                        Fulham                                   Pool Location

                                  M4                                                A205                                             Note: This catchment is nominally
                                                                                                                                   20 mins but due to the N+10 effect
                                                              Hounslow                                                               population closer than 10 mins to
               M4

                                                                            A4                                                       a pool w ill exclude pools greater
                                                                                 A307                                              than time to nearest pool + 10 mins
                                                                                                                                                 Additional material ®Sport England 2010
                                                                                                                         Source: 2001 Census, Output Area Boundaries, ITN Roads data.
       Map produced by The Planning Data Management                                                               ® Crown Copyright 2010. Licence numbers C02W0003683 & 100033111
                                                A30 Service                                                                              A with the permission of the Controller of HMSO
                                                                                                     Crown Copyright material is reproduced
       22/02/10 Job BZ using Mapinfo for Sport England                                     A316                                     ®The Automobile Association 1999, all rights reserved

In terms of accessibility by the population to swimming pools based on the 20 minute/1
Mile walk to catchment area then the picture is very different. Some 14% of the Ealing
population live outside the catchment area of any swimming pool. The significance of
this finding is underlined by the estimate that some 22% of all visits to swimming pools
are made on foot.

Increasing access to swimming pools for the walk to population is a significant strategic
planning and locational issue to address in the development of any new pool provision.
The map below identifies the areas of the borough, which are outside the walk to
catchment area of any pool. Again this catchment area analysis can be shown for the 4
public pool sites and here the level of access by the walk to catchment are dramatically
different – this map is the first map below. There are virtually no overlapping catchment
areas and if any public pools were removed it would significantly reduce accessibility.

The FPM analysis estimates that across Ealing, the level of swimming pool capacity
used at peak times in 2010 is 65%, this is close to the “pools full level” of 70%. This
means that in 2010 there is limited spare capacity in Ealing’s pools. It is estimated that
in order of highest usage Northolt Leisure Centre and Gurnell Leisure Centre are the two
sites where used capacity is estimated to be highest.

Internal Draft – March 2011
Map 5: Accessibility to Swimming Pools In 2010 Based on the 20 Minute/1 Mile
Walk to Catchment Area for Public Sites Only and all 10 Sites
EALING POOLS FPM
NUMBER OF ACCESSIBLE POOLS WITHIN WALKING CATCHMENTS
RUN6 CURRENT SUPPLY OF PUBLIC POOLS, 2010 DEMAND
A
Harrow
Brent
Key
Number of pools within
Hillingdon 20 mins walking time
NORTHOLT
NORTHOLT LC
LC (Approx 1 Mile)
of OA centroids
A4180
5
A312
4
3
2
GURNELL
GURNELL LC
LC 1
0
Ealing A40
A406 )
A40(M OA boundary
Ealing Large OAs show colouring
DORMERS
DORMERS WELLS
WELLS LC
LC
M
41
outside circles
ACTON
ACTON BATHS
BATHS Pool Site
Hammersmith
A3
with 1Mile
& Fulham walking catchment
Hammer
M4 A205
Hounslow
M4
A4
A307
Additional material ®Sport England 2010
Source: 2001 Census, Output Area Boundaries, ITN Roads data.
Map produced by The Planning Data Management Service ® Crown Copyright 2010. Licence numbers C02W0003683 & 100033111
A30 Awith the permission of the Controller of HMSO
Crown Copyright material is reproduced
08/07/10 Job BZ using Mapinfo for Sport England A316 ®The Automobile Association 1999, all rights reserved
EALING POOLS FPM
NUMBER OF ACCESSIBLE POOLS WITHIN WALKING CATCHMENTS
RUN 1 CURRENT SUPPLY, 2010 DEMAND
A
Harrow
Brent
DAVID LLOYD
DAVID LLOYD
Hillingdon
NORTHOLT
NORTHOLT LC
LC
Key
A4180 Number of pools within
A312 20 mins walking time
(Approx 1 Mile)
of OA centroids
GURNELL LC
GURNELL LC A40 6
Ealing 5
4
A406 ) 3
A40(M
2
Ealing 1
M
DORMERS WELLS
DORMERS WELLS LC
LC EDEN FITNESS
EDEN FITNESS VIRGIN ACTIVE
VIRGIN ACTIVE (EALING)
(EALING)
41
0
GOLDS GYM
GOLDS GYM VIRGIN
VIRGIN ACTIVE(W
ACTIVE(W
EIGHTH
EIGHTH LEVEL
LEVEL H&F
H&F ACTON BATHS
ACTON BATHS
Hammersmith
A3 OA boundary
Large OAs show colouring
& Fulham outside circles
Hammer
M4 A205 Pool Site
Hounslow with 1Mile
M4
A4 walking catchment
A307
Additional material ®Sport England 2010
Source: 2001 Census, Output Area Boundaries, ITN Roads data.
Map produced by The Planning Data Management ® Crown Copyright 2010. Licence numbers C02W0003683 & 100033111
A30 Service A with the permission of the Controller of HMSO
Crown Copyright material is reproduced
22/02/10 Job BZ using Mapinfo for Sport England A316 ®The Automobile Association 1999, all rights reserved
Internal Draft – March 2011Future Supply and Demand Analysis for Swimming Pools in Ealing (Scenario 2) The second scenario, assessed the future demand for swimming in 2021 based on GLA population projections for the study area surrounding the borough and the Ealing population projections and new housing allocations. This scenario also factored in a projected 1% increase in swimming participation each year between 2010 – 2021, an 11% increase in total between the two years. The supply side assumptions in this scenario included the replacement of Acton Baths with a new swimming facility on the same site which included 2 pools, one a 25m x 17m eight lane main pool and a 16m x 12m learner pool and the replacement of existing facilities at Gurnell Leisure Centre with a 50m x 17m eight lane pool and a 16m x 12m learner pool. The main factors to assess in this scenario are the impact of changes in demand from population growth and swimming participation and the impact on supply from these changes and the 2 replacement pools at Acton and Gurnell. Impact of the population increase and rise in participation on demand The Ealing population is projected to increase to 337,600 people in 2021, up from 323,150 people in 2010. This is an increase of 14,450 people and represents a 4,4% increase over the 2010 figure. The population increase, plus the projected annual 1% increase in swimming participation, means the total demand for swimming will be 22,260 visits by 2021, up from 19,500 visits in 2010. This represents an increase of 2,760 visits or a 14.1% increase in total demand for swimming. David – figures slightly different between main text and summary? A visit increase of 2,760 visits or 14% equates to a demand for 340 sq metres of water and this is equivalent to one 25 metre x 6 lane pool. So the projected changes on the demand side between 2010 – 2021 is creating additional demand for around one good size swimming pool. A pool of this size would fill a “gap in the Ealing swimming supply” Three of the Ealing public pools are very big - Gurnell currently 975 sq metres of water: Acton Baths currently 495 sq metres of water but projected to increase to 617 sq metres of water with the new development and Northolt Leisure Centre 617 sq metres of water. Only Dormers Wells Leisure Centre is a “small pool” at 240 sq metres of water. A pool of 330 sq metres of water does provide a pool size, which Ealing does not currently have and increases the scope and range of swimming programmes across the borough and offers more flexibility in pool programming. A pool of this size would cater for a full range of community based swimming participation with a 25 metres x 6 lane main pool and offers flexibility to also cater for swimming development and learn to swim programmes. An additional learner pool at the same site would enhance this scale, flexibility and range of provision. Impact of the two new pool developments on demand and supply Whilst swimming demand increases by 2,760 visits, swimming pool supply also increases because the new Acton pool development is 617 sq metres of water, compared to the existing pool which is 495 sq metres and the proposed new Gurnell Leisure Centre pool increases to 1,042 sq metres of water, up from 975 square metres. The increase in size of these two pools means the swimming pool supply increases to 31,300 visits, up from the existing 28,900, resulting in an increase in supply of 8.3%. This increase in supply is helping to keep satisfied demand up and unmet demand low. Internal Draft – March 2011
Satisfied demand is unchanged at 91%, so the additional demand and the location of
the population in the new housing areas is within the catchment areas of the existing
pools. This coupled with the increase in supply suggests that there is enough
capacity at the proposed new pools to absorb this level of demand.

The reason for no change in satisfied demand is because of the predominance of the
drive to catchment area for pools and that 71% of all visits to pools are by car. As
mentioned earlier, there is wide choice of pools for the Ealing population (inside and
outside the borough based on the drive to catchment. The areas of new demand
growth are also accessing this choice of pools because travel patterns to pools are
virtually unchanged. So, in short, there will be more demand for swimming in 2021
but it can be accommodated by the proposed pool stock including the two
redeveloped sites.

Unmet demand for swimming in 2021 goes up by a small amount to 1,800 visits, from
1,500 visits in 2010. Unmet demand of 1,800 visits equates to 225 sq metres of water
and a 25 metres x 4 lane swimming pool is 212 sq metres. The reasons for the
unmet demand are that some pools are now full and some demand is located outside
the walk to catchment areas of a pool as shown in Map 5.

In terms of the swimming demand from Ealing residents, retained and satisfied at
Ealing’s pools, this shows little change, with 73% of all the satisfied demand being
retained, compared 72% in 2010. The main location for export of Ealing’s demand is
still to Hounslow at 14%.

In terms of the level of swimming demand imported into Ealing and satisfied at
Ealing’s pools, this increases by 5% to 37% up from 32% in 2010. The reason for the
increase is the new swimming pools at Acton Baths and Gurnell Leisure Centre
which will have a draw effect.

The most significant finding from this scenario is the increase in swimming pool used
capacity, which measures how full the pools are. This increases to 74.8% of total
swimming pool capacity, up from 65.5% in 2010 and above the “pools full” comfort
level of 70%. Used capacity increases because of the 13.8% increase in Ealing’s
swimming demand between 2010 – 2021 and the draw effect of the new pools.

This assessment is borne out by the projected estimate of annual throughput at the
new pool sites; for Gurnell Leisure Centre, 574,600 visits, up from 484,900 visits in
2010, whilst at Acton Baths the projection is 340,000 visits up from 228,700 visits in
2010. Overall the projected annual estimated throughout for the 10 swimming pool
sites in Ealing in 2021 is 1,880,000 visits, up from 1,469,000 visits in 2010.

The combination of high accessibility by the Ealing and wider study area population
to two new and larger pools, coupled with a 13.8% increase in total demand for
swimming in Ealing creates a high draw and pushes up used capacity for swimming
across the whole borough.

Conclusion
Ealing wished to determine the future needs of swimming pool provision in order to
deliver a service which increased participation and access to swimming through
providing a swimming development programme which gave people of all ages the
opportunity to progress from learn to swim through to elite competition. On the
demand side, the increase in population and the 1% increase per annum in

Internal Draft – March 2011
You can also read


