Hydraulic Fracturing, Cumulative Development and Earthquakes in the Peace River Region of British Columbia, Canada - Scientific Research Publishing
←
→
Page content transcription
If your browser does not render page correctly, please read the page content below
Journal of Geoscience and Environment Protection, 2021, 9, 55-82
                                                                                                https://www.scirp.org/journal/gep
                                                                                                          ISSN Online: 2327-4344
                                                                                                            ISSN Print: 2327-4336

Hydraulic Fracturing, Cumulative Development
and Earthquakes in the Peace River Region of
British Columbia, Canada

Allan R. Chapman

Chapman Geoscience Ltd., Victoria, British Columbia, Canada

How to cite this paper: Chapman, A. R.        Abstract
(2021). Hydraulic Fracturing, Cumulative
Development and Earthquakes in the Peace      Unconventional petroleum development involving large volume fluid injec-
River Region of British Columbia, Canada.     tion into horizontal well bores, referred to as hydraulic fracturing (HF, or
Journal of Geoscience and Environment Pro-
                                              fracking), began in the Montney Trend of northeast British Columbia, Cana-
tection, 9, 55-82.
https://doi.org/10.4236/gep.2021.95006        da, in 2005, quickly initiating earthquakes. Earthquake frequency increased
                                              substantially in the Montney by 2008, in relation to the number of wells
Received: April 15, 2021                      fracked and the volume of injected frack water. A spatiotemporal filter was
Accepted: May 23, 2021
                                              used to associate earthquakes with HF wells. A total of 439 earthquakes (M
Published: May 26, 2021
                                              1.0 - 4.6 (NRCAN catalogue) during 2013-2019 have close association with
Copyright © 2021 by author(s) and             HF activity, of which 77% are associated with three operators. Fifteen percent
Scientific Research Publishing Inc.           of HF wells in the Montney are associated with these earthquakes, while 1.7%
This work is licensed under the Creative
                                              of HF wells are associated with M ≥ 3.0 earthquakes. There are strong linear
Commons Attribution International
License (CC BY 4.0).                          relationships between the maximum earthquake magnitude each year and the
http://creativecommons.org/licenses/by/4.0/   annual volume of injected frack fluid. M ≥ 3.0 earthquakes are associated
               Open Access                    with large cumulative frack water volumes for antecedent time periods of 1 -
                                              3 years, often with fluid injection by multiple operators. Eighty-seven percent
                                              of the Montney M ≥ 3.0 earthquakes have associated HF triggering events,
                                              but a few are sufficiently distant to be ambiguous. Distances from the induced
                                              earthquake epicentres indicate a variety of causal mechanisms are involved. It
                                              is concluded that ~60% - 70% of M ≥ 3.0 earthquakes are induced by hydrau-
                                              lic fracturing. HF-induced earthquakes can be considered in part related to
                                              the cumulative development density from multiple proximal operators and
                                              cumulative antecedent fluid injection over periods ranging from a few
                                              months to a few years. It is probable that induced earthquakes of M > 5 will
                                              occur in the future. There are significant public safety and infrastructure risks
                                              associated with future HF-induced earthquakes in the Peace River area. To
                                              carry out HF operations effectively and safely, potentially destructive earth-
                                              quakes must be avoided or mitigated. The Traffic Light Protocol mitigation

DOI: 10.4236/gep.2021.95006        May 26, 2021                  55             Journal of Geoscience and Environment Protection
A. R. Chapman

                                system used in British Columbia appears unlikely to prevent large magnitude
                                earthquakes. Risk avoidance therefore becomes important and could include
                                the establishment of frack-free zones proximal to populations and critical in-
                                frastructure.

                                Keywords
                                Hydraulic Fracturing, Induced Earthquakes, Montney Trend

                              1. Introduction
                              Earthquakes associated with petroleum production in northeastern British Co-
                              lumbia (NEBC), referred to as induced seismicity, have been recognized for
                              many decades, beginning with large-volume fluid injections into oil reservoirs to
                              enhance conventional oil recovery (Horner et al., 1994), and fluid injection into
                              oil and gas wastewater disposal wells (Schultz et al., 2014; Weingarten et al.,
                              2015; BCOGC, 2014). More recently, earthquake activity initiated by hydraulic
                              fracturing has emerged as a significant concern in the Peace River region of
                              NEBC, triggering focused research (Atkinson et al., 2020; Schultz et al., 2018;
                              Barbaie Mahani et al., 2017; Atkinson et al., 2016; Bao & Eaton, 2016; others).
                              Hydraulic fracturing (also referred to as HF, or the colloquial “fracking” in this
                              paper) is a well stimulation technique that is a key element of unconventional
                              petroleum development (also referred to as shale gas, tight gas, shale oil, etc.),
                              where high volume water-based fluid injection along horizontal well bores is
                              used to fracture the petroleum-bearing rock, creating permeability and enhanc-
                              ing petroleum recovery.
                                This paper examines relationships between hydraulic fracturing and earth-
                              quakes in the Peace River region of NEBC. Numerous “felt” earthquakes have
                              occurred in Peace region over the past 10+ years, notably including three large
                              events in a 48-minute period on 29 November 2018, with moment magnitudes
                              (Mw) of 4.6, 4.0 and 3.4, triggering temporary work shutdown at the BC Hydro
                              Site C dam construction site located 23 km to the north (Nikiforuk, 2018), and,
                              as well, a Mw 4.6 earthquake on 17 August 2015 at a remote location 20 km east
                              of the community of Pink Mountain. The significance of the public safety and
                              infrastructure risks associated with HF-related earthquakes in the Peace River
                              region cannot be overstated. This paper examines the frequency and magnitude
                              of induced earthquakes in relation to HF injection fluid volumes over varying
                              antecedent time periods; it quantifies differences amongst petroleum operators
                              in relation to induced earthquakes; and it evaluates the mitigation approaches,
                              including regulatory requirements, intended to reduce potential public safety,
                              infrastructure and environmental risks. It suggests what the earthquake future
                              for the Peace Region might be. Investigation of induced earthquakes associated
                              with the operation of water disposal wells is not included.

DOI: 10.4236/gep.2021.95006                        56             Journal of Geoscience and Environment Protection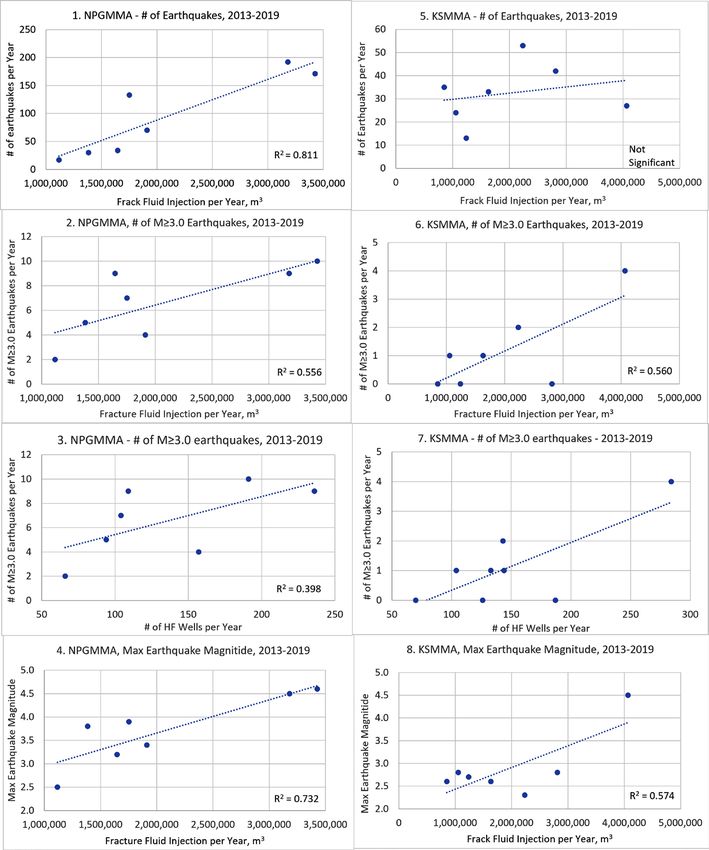
A. R. Chapman

                              2. Study Area
                              This study focuses on the Montney Play Trend (referred to in this paper as the
                              Montney). Following developments in the Barnett Shale in Texas in the late
                              1990s, the industry transformation in BC to unconventional petroleum began
                              with the 2003-2010 gold rush of petroleum tenure sales of $7.5 billion for 4.7
                              million hectares of land across NEBC (BCGOV, 2020a). The first multistage HF
                              in a NEBC horizontal well occurred near Dawson Creek in July 2005 (BCOGC
                              2012a). In the years’ since, many thousands of wells have been drilled and
                              fracked in four areas: the Horn River Basin, Liard basin, Cordova Embayment,
                              and the Montney Trend. The BC Oil and Gas Commission (BCOGC), the regu-
                              lator of oil and gas activity in BC, reports that unconventional petroleum activity
                              in the Horn River Basin, the Liard basin and Cordova Embayment was largely
                              abandoned by 2016 (BCOGC, 2021), leaving just the Montney Trend with activ-
                              ity.
                                 The Montney has an area of ~26,600 km2, extending from south of the com-
                              munity of Dawson Creek to ~200 km north-west of the community of Fort St
                              John, and consisting of Triassic aged siltstones (Euzen et al., 2018; BCOGC
                              2012a). Most of the Montney is contained within the drainage of the Peace Riv-
                              er, although the northern portions are within the Sikanni Chief River watershed,
                              which drains northward to the Fort Nelson and Liard rivers.
                                 The Montney has been divided by the BCOGC into two primary zones for the
                              understanding of HF-induced earthquakes (Figure 1). These are the Kiskatinaw
                              Seismic Monitoring and Mitigation Area (KSMMA) and the North Peace
                              Ground Motion Monitoring Area (NPGMMA). The KSMMA comprises 9% of
                              the Montney and is centred on the Peace River, encompassing the communities
                              of Dawson Creek, Fort St. John and Taylor. The BC Hydro Site C dam location
                              is within the KSMMA. The NPGMMA comprises 26% of the Montney, extend-
                              ing from the north side of the Peace River near Hudson’s Hope, skirting the west
                              edge of the community of Upper Halfway (Halfway River First Nation), to north
                              of Pink Mountain. The BC Hydro WAC Bennett and Peace Canyon dams are
                              proximal to the south end of the NPGMMA. The remaining 65% of the Montney
                              is seismically unzoned. The KSMMA is predominantly private agricultural land
                              with dispersed rural population and three sizable communities, whereas the
                              NPGMMA is predominantly sparsely populated Crown land with a significant
                              First Nation community.
                                 Structural differences between the KSMMA and NPGMMA may account for
                              seismogenic differences between the two areas. The KSMMA overlies the
                              Dawson Creek Graben Complex, where faults have been reactivated due to ice
                              compression and decompression during recent continental glaciation (Barclay
                              et al., 1990), whereas the dominant seismogenicity of the NPGMMA results
                              from movement along strike-slip faults associated with the Hay River Fault
                              Zone, in the thrust-and-fold belt of the Rocky Mountain foothills (Thompson,
                              1989).

DOI: 10.4236/gep.2021.95006                        57             Journal of Geoscience and Environment Protection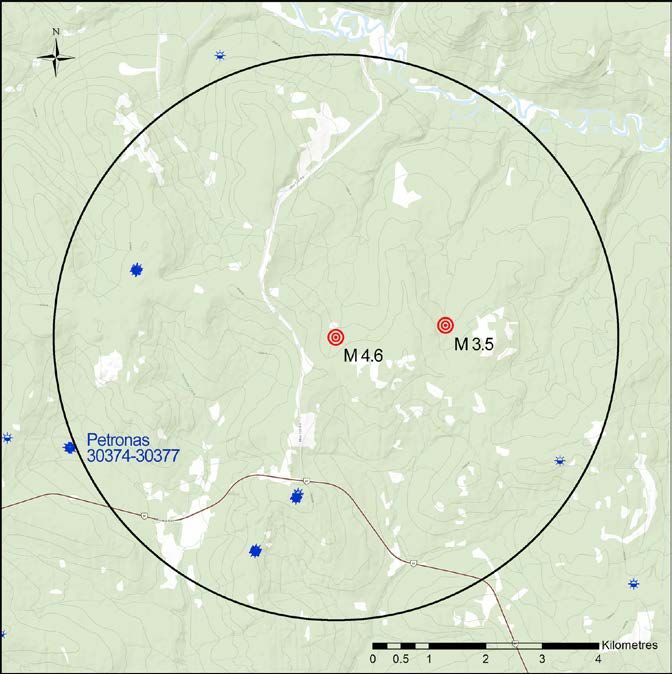
A. R. Chapman

                              Figure 1. Location Map, showing the Montney Play Trend, the Kiskatinaw Seismic Mon-
                              itoring and Mitigation Area (KSMMA), the North Peace Ground Motion Monitoring
                              Area (NPGMMA) and magnitude 3+ and 4+ earthquakes (2013-2019). The location
                              noted as Halfway River First Nation refers to the community of Upper Halfway.

                              3. Data and Analysis
                              The primary data used for this report are earthquake data compiled and pub-
                              lished in the Canadian National Earthquake Database by Natural Resources
                              Canada (NRCAN), and well completion data compiled and published by the
                              BCOGC. The National Earthquake Database is based on the Canadian National
                              Seismographic Network (CNSN) and is the de facto standard for earthquake
                              monitoring and mapping in Canada (Visser et al., 2017). The network currently
                              consists of 12 stations in NEBC, of which only two were operating before March
                              2013. Earthquake data for 2000-2019 were extracted from the National Earth-
                              quake Database (NRCAN, 2020). Because of the enhancement of the CNSN
                              network in early 2013, the pre- and post-2013 seismic events are not directly
                              comparable. Analysis of data for the 2000-2012 period was limited to only the
                              “felt” events of M ≥ 3.0. Earthquakes from the NEBC earthquake catalogues
                              compiled by Visser et al. (2017, 2020) were extracted and used for portions of
                              this report. These catalogues combine private industry and university seismo-
                              graphic data with the NRCAN data and report a significantly greater number of
                              small magnitude earthquakes than the NRCAN catalogue. As well, they have

DOI: 10.4236/gep.2021.95006                        58             Journal of Geoscience and Environment Protection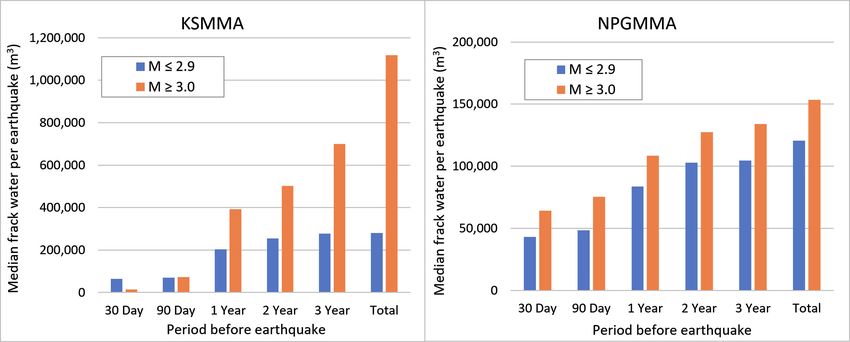
A. R. Chapman

                              enhanced earthquake epicentre locational accuracy. However, because the Visser
                              et al. (2017, 2020) catalogues are limited to just 2014-2016 for all the Montney
                              and to just the KSMMA portion of the Montney for 2017-2018, the primary
                              analysis for this report is based on the NRCAN earthquake catalogue.
                                The well and HF data were compiled from the BCOGC’s Frac Focus data set,
                              for the 2012 to 2019 period (BCOGC, 2020a), a year prior to the period of en-
                              hanced NRCAN seismic data. The Frac Focus data were summarized to create
                              one record per well, for all the petroleum wells fracked during the period. Other
                              data extracted from the BCOGC’s Open Data Portal (BCOGC, 2020b, 2020c)
                              and from Geoscience BC (2020) were used in this analysis.
                                Wells and well pads were associated with earthquakes using a spatiotemporal
                              association filter, using the QGIS geographic information system (QGIS, 2020).
                              A 5-km radius buffer was assigned to each earthquake, consistent with the ap-
                              proach used by BCOGC (2012b) and others. The buffer radius is slightly larger
                              than the ~3 km length of horizontal bore associated with the unconventional
                              petroleum wells (Lemko & Foster, 2016). In addition, the buffer accommodates
                              some of the accuracy uncertainty in earthquake location from the CNSN.
                                For each earthquake where there are wells located within the 5-km radius
                              buffer, associated HF water volumes for varying antecedent time periods were
                              calculated: 30 days, 90 days, 1 year, 2 years, 3 years, and total antecedent. For
                              this report, the antecedent period of 90 days is used to define an HF-associated
                              earthquake, similar to Ghofrani and Atkinson (2020). This does not imply direct
                              cause and effect between an individual well or well operator and the earthquake
                              but is noted as an association. In addition, the frack water volume for the most
                              probable HF event triggering an M ≥ 3.0 earthquake as determined for the well
                              fracked immediately (up to 14 days) before the earthquake. Initially, the query
                              for the triggering HF events was contained within the 5-km radius buffer. Upon
                              review it was evident that many of the triggering HF events were more distant
                              that 5-km from the earthquake. There were clusters of earthquakes associated
                              with fracking on a well pad, where some of the earthquakes in the cluster were
                              well beyond 5-km from the triggering well. As well, comparison of the earth-
                              quake epicentres from the Visser et al. (2017, 2020) and NRCAN catalogues, for
                              earthquakes contained in both catalogues, indicted spatial uncertainty in epicen-
                              tre location of up to 10-km. As a result, a second query was done using a 15-km
                              buffer radius. Additionally, precursor earthquakes were determined for all the M
                              ≥ 3.0 earthquakes, determined as any earthquake of M ≥ 2.0 occurring within a
                              10-km radius and up to 30-days before the M ≥ 3.0 event, using the NRCAN ca-
                              talogue. Statistical analysis was completed using Systat v.13 (Systat, 2020).

                              4. Analysis and Results
                              4.1. Wells, Well Pads, Water Use
                              A total of 2865 wells in the Montney are reported as being hydraulically frac-
                              tured during the 2012-2019 period (Figure 2). The five largest operators are

DOI: 10.4236/gep.2021.95006                         59            Journal of Geoscience and Environment Protection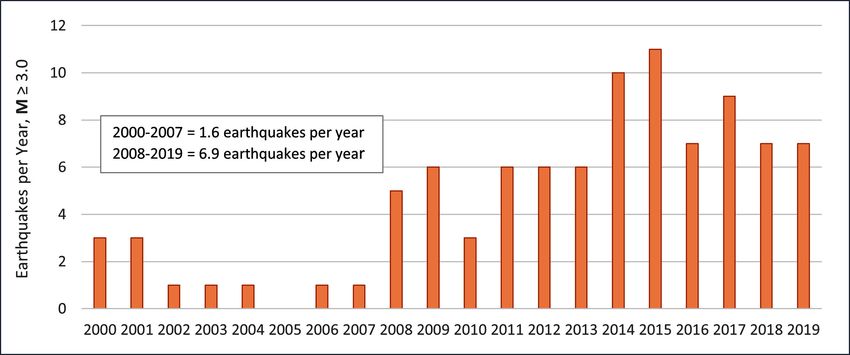
A. R. Chapman

                              Ovintiv (formerly Encana): 570 wells, Petronas (formerly Progress Energy): 552
                              wells, Tourmaline Oil: 413 wells, Shell: 255 wells and Painted Pony: 181 wells,
                              together comprising almost 70% of the HF wells over the eight years. There are
                              differences across the zones in the Montney. Despite being only 9% of the
                              Montney area, 42% of the Montney HF wells are in the KSSMA, with Ovintiv
                              having the greatest number of wells, followed by Tourmaline Oil, Shell, Crew
                              Energy, ARC Resources and Canadian Natural Resources Ltd. (CNRL). These six
                              operators are responsible for 99% of the HF wells in the KSSMA. Different
                              companies dominate in the NPGMMA, containing 36% of the Montney HF
                              wells. Petronas alone accounts for 52% of the NPGMMA HF wells and is fol-
                              lowed somewhat distantly by Painted Pony, Tourmaline Oil, Pacific Canbriam
                              and Saguaro. Outside these two seismically zoned areas a variety of companies
                              operate in the remaining 65% of the Montney, led by Ovintiv, Shell, Murphy Oil,
                              Storm Resources and ConocoPhillips. The peak in HF, to date, in the NPGMMA
                              was 2014-2015, while the peak in the KSMMA was later, in 2018.
                                Trends over time in HF activity across the Montney are related to economic
                              factors, with industry attention moving away from methane or natural gas and
                              towards natural gas liquids (condensate). The NPGGA contains largely dry gas
                              (i.e., just methane) whereas the KSMMA has abundant natural gas liquids
                              (BCOGC 2012a). During 2016-2019 natural gas liquids averaged $6.38 (USD per
                              MMBtu) (Canada Energy Regulator, 2020) a substantial premium to the dry
                              methane price of $2.40 (USD per MMBtu), enhancing the development focus on
                              the KSMMA area and away from the NPGMMA.
                                Over the 2012-2019 period, a total of 39 million m3 of water was used for
                              fracking in the Montney. The volume of water used per well has increased stea-
                              dily over the eight-year period, from an average of 7077 m3 per well in 2012 to
                              22,054 m3 per well in 2019 (Figure 3). ConocoPhillips stands out, using an av-
                              erage of 83,000 m3 per well for 13 wells in 2019. It is not known whether Con-
                              ocoPhillips is an outlier or a harbinger, however, there appears to be a trend
                              emerging amongst several Montney operators towards significantly larger water
                              use per well. Ovintiv, Petronas, CNRL, ARC Resources, Pacific Canbriam and
                              ConocoPhillips all had multiple HF wells in 2019 using 30,000+ m3 per well.

                              Figure 2. Number of hydraulically fractured wells in the Montney Play Trend, 2012-2019.

DOI: 10.4236/gep.2021.95006                         60              Journal of Geoscience and Environment Protection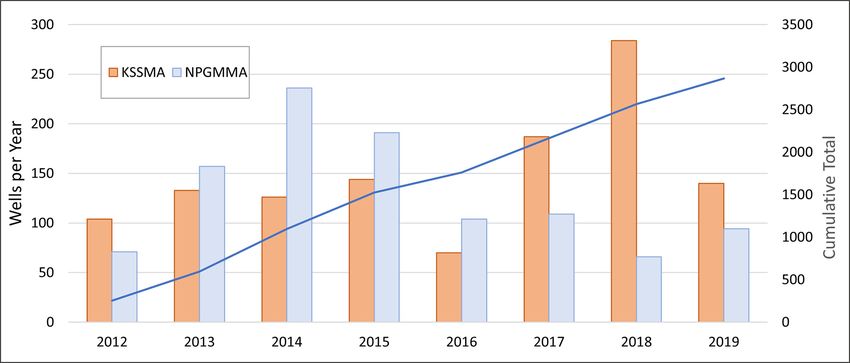
A. R. Chapman

                              Figure 3. Water use for hydraulic fracturing in the Montney Play (m3 per well).

                                The 2865 wells hydraulically fractured during 2012-2019 are situated on a to-
                              tal of 639 well pads, with a Montney average of 4.5 wells per pad, well below the
                              20+ wells on each well pad anticipated at full development, as has been done on
                              some pads in the KSMMA (Table 1). The small number of wells per pad sug-
                              gests that most of the Montney operations to date have remained in the explo-
                              ratory and appraisal phases of activity, with some exceptions. Only in the
                              KSMMA are some operators approaching full development on some well pads.
                              Ovintiv has one well pad with 29 HF wells and has six pads with 20+ wells. In
                              the NPGMMA, Petronas, the largest operator, has built-out extensive infra-
                              structure across a large geographic area to appraise production potential, but has
                              minimal activity to date at the individual well pads. Petronas has 146 well pads
                              in the NPGMMA, averaging 3.7 HF wells per pad, with no more than 10 wells on
                              any pad.
                                In cases of multiple wells on a single well pad, the water injection can be very
                              large. ConocoPhillips injected nearly 1.1 million m3 of frack fluid from a single
                              well pad, followed by Ovintiv with 550,000 m3 injected from one pad and five
                              pads each with greater than 300,000 m3 total frack fluid injection.

                              4.2. Earthquakes
                              The Canadian National Earthquake Database contains 175 earthquakes for the
                              2000-2012 period (M 1.0 - 4.2) with epicentres in the Montney, of which 37
                              earthquakes were M ≥ 3.0, with a maximum magnitude of M 4.2. For just the
                              2013-2019 period, following the enhancement of the seismic monitoring net-
                              work, 975 earthquakes were recorded (M 1.0 - 4.6) across the Montney, 647 in
                              the NPGMMA, 227 in the KSSMA and 101 across the remainder of the Mont-
                              ney. Fifty-six earthquakes (6%) were M ≥ 3.0. Five earthquakes exceeded M 4.0
                              (three in the KSMMA and two in the NPGMMA). Earthquakes with magnitudes
                              ≥ 3.0 are generally “felt” with ground shaking on the ground surface for some
                              distance from the earthquake epicentre; at magnitudes ≥ 4.0 the surface manife-
                              station can be substantial, with damage to buildings and infrastructure (Atkin-
                              son et al., 2020; Lei et al., 2019). These M ≥ 3.0 earthquakes are a threshold mag-

DOI: 10.4236/gep.2021.95006                          61              Journal of Geoscience and Environment Protection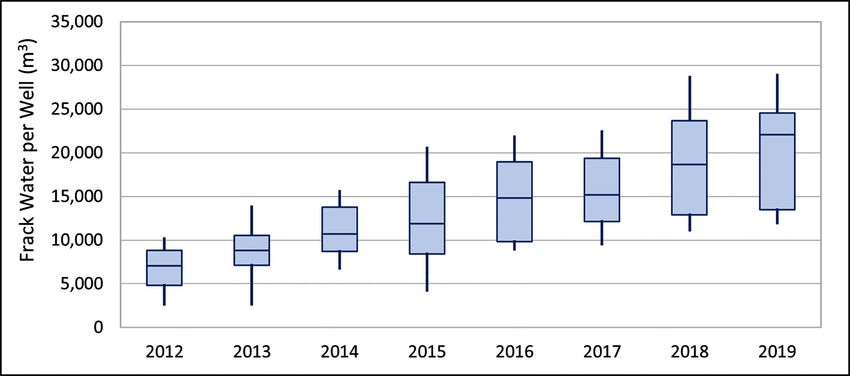
A. R. Chapman

                                      nitude for events of particular interest, as they are the drivers of public safety
                                      and infrastructure risk. As noted, the earthquake catalogues of Visser et al. (2017,
                                      2020) contain a substantially larger number of small earthquakes (generally less
                                      than M 2).

Table 1. Summary of hydraulically fractured wells, well pads, hydraulic fracturing water use, associated earthquakes and land
tenure, 2012-2019.

                                                                                                 Associated
                                               Max                    Frack Water (m 3)                            Land Tenure
                                     Wells             Pads with                                Earthquakes1
   Operator & Zone     Wells   Pads            Wells
                                    per pad            >16 wells                  Water per
                                              on Pad                  Total                   Number     Ratio   Crown   Private
                                                                                    well

       KSMMA
      OVINTIV           436     44      9.9      29        9        6,640,707       15,231       38       9%       1%      99%
  TOURMALINE OIL        272     50      5.4      18        1        2,517,732        9256        79       29%      1%      99%
        CREW            136     33      4.1      9         0        1,723,503       12,673       25       18%     94%      6%
   ARC RESOURCES        134     28      4.8      8         0        1,058,230        7897        6        4%      87%      13%
        CNRL            101     14      7.2      14        0        1,417,423       14,034       12       12%      6%      94%
        SHELL           95      15      6.3      17        1        1,089,170       11,465                        46%      54%
     LEUCROTTA           7       5      1.4      2         0          84,441        12,063                         0%     100%
    PENGROWTH            6       1      6.0      6         0          78,476        13,079                        100%     0%
        ADU              1       1      1.0      1         0          18,552        18,552                        100%     0%
   TOTAL KSMMA         1188     191     6.2      29       11        14,628,234      12,313      160       13%     29%      71%
      NPGMMA
     PETRONAS           536     146     3.7      10        0        8,262,356       15,415      209       39%     98%      2%
   PAINTED PONY         181     32      5.7      12        0        2,313,755       12,783       22       12%     91%      9%
  TOURMALINE OIL        104     14      7.4      18        2        1,088,761       10,469       14       13%     89%      11%
 PACIFIC CANBRIAM       91      20      4.6      13        0        1,882,962       20,692       15       16%     100%     0%
      SAGUARO           74       7     10.6      15        0        1,120,218       15,138       1        1%      100%     0%
    BLACK SWAN          20      10      2.0      5         0         204,953        10,248                        100%     0%
   ARC RESOURCES        12       3      4.0      7         0         279,475        23,290       2        17%     92%      8%
        CNRL             4       3      1.3      1         0          30,877         7,719       1        25%     75%      25%
     POLAR STAR          4       2      2.0      3         0          50,711        12,678                        100%     0%
  CONOCOPHILLIPS         2       2      1.0      1         0          19,886         9943        3       150%     100%     0%
  TOTAL NPGMMA         1028     239     4.3      18        2        15,253,954      14,838      267       26%     97%      3%
       OTHER
      OVINTIV           134     39      3.4      12        0        2,584,975       19,291                        16%      84%
        SHELL           121     19      6.4      16        1        1,176,626        9724        3        2%      79%      21%
      MURPHY            97      27      3.6      10        0        1,092,078       11,259                        17%      83%
 STORM RESOURCES        67      27      2.5      5         0         516,979         7716                         71%      29%
    BLACK SWAN          45       9      5.0      8         0         511,588        11,369                        100%     0%
      KELT LNG          39      23      1.7      3         0         537,672        13,786       6        15%     100%     0%
  TOURMALINE OIL        37      12      3.1      6         0         358,733         9695                         24%      76%
  CONOCOPHILLIPS        20       8      2.5      13        0        1,228,747       61,437       1        5%      95%      5%

DOI: 10.4236/gep.2021.95006                                    62                Journal of Geoscience and Environment Protection
A. R. Chapman
Continued
PETRONAS 16 6 2.7 4 0 294,239 18,390 1 6% 100% 0%
ARC RESOURCES 14 4 3.5 10 0 144,399 10,314 29% 71%
CNRL 13 9 1.4 2 0 102,236 7864 100% 0%
CHINOOK 10 4 2.5 4 0 71,389 7139 100% 0%
LEUCROTTA 8 2 4.0 2 0 28,040 3505 1 13% 67% 33%
TECL 6 4 1.5 2 0 73,470 12,245 100% 0%
CREW 5 2 2.5 4 0 74,600 14,920 80% 20%
POLAR STAR 4 2 2.0 2 0 32,857 8214 100% 0%
YOHO 4 2 2.0 3 0 74,643 18,661 100% 0%
OTHER OPERATOR 9 10 0.9 1 0 181,186 20,132 75% 25%
TOTAL OTHER 649 209 3.1 16 1 9,084,457 13,998 12 2% 63% 37%
TOTAL MONTNEY 2,865 639 4.5 29 14 38,966,645 13,601 439 15% 58% 41%
Note 1. Associated earthquakes are for the 2013-2019 period (NRCAN catalogue) and have hydraulically fractured wells within 5-km radius of the earth-
quake epicentre with fracking in the period up to 90 days before the earthquake.
5. Earthquakes and Hydraulic Fracturing
5.1. Earthquake Frequency
A significant increase in the frequency of earthquakes M ≥ 3.0 magnitude ap-
pears to have occurred in 2008, shortly after the start of HF activity in the
Montney in 2005 (Figure 4). For the Montney in its entirety, the frequency in-
creased from 1.6 earthquakes (M ≥ 3.0) per year during 2000-2007, to almost 6.9
per year during 2008-2019, a 4X increase. Most of this change, however, comes
from the NPGMMA, going from 0.3 earthquakes (M ≥ 3.0) per year during
2000-2007 to 5.5 per year during 2008-2019, an increase of almost 20X. For the
KSSMA, the shift to increased earthquake frequency occurred later, in 2018,
going from 0.3 M ≥ 3.0 earthquakes per year in 2000-2017 to an average of 3.0
per year in 2018-2019, a 10X increase. These changes are all statistically signifi-
cant (Student’s t-test, p < 0.01), although the period of change for the KSMMA is
short and should be considered with caution. For the Montney outside the
NPGMMA and KSSMA, there is no change in the frequency of earthquakes over
the 2000-2019 period.
The number of M ≥ 3.0 earthquakes in both the NPGMMA and KSMMA each
year are positively correlated with the number of HF wells and the volume of
frack water injected each year (R2adj = 0.40 - 0.58, p < 0.05) (Figure 5). Also, in
the NPGMMA there is a strong positive correlation between the total number of
earthquakes each year and the total volume of injected frack fluid (R2adj = 0.81,
p < 0.01). This relationship is not evident in the KSMMA. Increased seismicity
rates did not begin in the KSMMA until 2018, delayed from the beginning of HF
activity but coinciding with the substantial increase in HF activity in 2017 when
accelerated fracking for natural gas liquids began (refer to Figure 2). Schultz et
al. (2018) observed a similar delay in the initiation of HF-induced seismicity in
the Duvernay Play in Alberta.
DOI: 10.4236/gep.2021.95006 63 Journal of Geoscience and Environment ProtectionA. R. Chapman
Figure 4. Frequency of earthquakes of magnitude ≥ 3.0 during 2000-2019 in the Montney
Play Trend. The first large volume multistage hydraulic fracturing operation in the
Montney occurred in 2005. The 4X increase in frequency from 2000-2007 to 2008-2019 is
statistically significant (p < 0.01).
Figure 5. Linear relationships between annual frequency and maximum magnitude of
earthquakes in the KSMMA and NPGMMA, and the number of hydraulically fractured
wells and injected frack fluid volume per year. All relationships are statistically significant
at the p < 0.05 level or better, unless noted as “Not Significant”.
DOI: 10.4236/gep.2021.95006 64 Journal of Geoscience and Environment ProtectionA. R. Chapman
Of the 975 earthquakes recorded in the Montney during 2013-2019, 439 (50%)
have a close spatiotemporal association with hydraulic fracturing (within a 5-km
radius and within 90 days before the earthquake) (refer to Table 1). A total of
751 earthquakes (77%) have proximal frack fluid injection within 5-km of the
epicentre during the previous three years. For the 439 earthquakes with the clos-
est spatiotemporal association with hydraulic fracturing operations, 160 are in
the KSMMA, led by Tourmaline Oil with 79 associated earthquakes, Ovintiv
with 38, Crew Energy with 25, CNRL with 12 and ARC Resources with 6. Tour-
maline Oil and Ovintiv together are associated with 73% of all the earthquakes in
the KSMMA. There were 267 associated earthquakes in the NPGMMA, led by
Petronas with 209. Painted Pony, Pacific Canbriam and Tourmaline Oil are far
behind, with 22, 15 and 14 associated earthquakes, respectively. Petronas is not-
able – it alone is associated with 78% of the earthquakes in the NPGMMA and
almost one-half the earthquakes in the entire Montney over the 2013-2019 pe-
riod.
Of the 56 M ≥ 3.0 earthquakes that occurred in the Montney over the
2013-2019 period, 30 (54%) have a clear spatiotemporal association with prox-
imal hydraulic fracturing (Table 2), while 45 (80%) have proximal frack fluid
injection at some time in the three years before the earthquake. The 5-km and
90-day spatiotemporal filter used in this report clearly does not encompass all
earthquakes associated with hydraulic fracturing. An additional eight earth-
quakes have apparent triggering HF operations (discussed below) more distant
than 5-km from the earthquake epicentre and are not captured by the 5-km fil-
ter. As well, the strong linear relationship between earthquake frequency and
annual total frack fluid injection, along with the relationship between M ≥ 3.0
earthquakes and their associated antecedent one- to three-year cumulative frack
fluid injection (Table 3) as discussed below, supports the conclusion that HF
association with earthquakes extends beyond the boundaries of a 5-km and
90-day filter. These lead to a conclusion that ~60% - 70% of observed M ≥ 3.0
seismicity in the Montney is related to hydraulic fracturing activity, a result
comparable to Atkinson et al. (2016) and Ghofrani & Atkinson (2021).
Table 2. Earthquakes in the Montney Trend of magnitude (ML or MW) ≥ 3.0 during 2013-2019, with associated HF information.
Earthquakes in red have no evident association with HF.
Precursor
Associated Trigger Well Antecedent Frack Fluid Volume (m3) Associated Operators
ML Events (TLP)
Date: Time (UTC) or Zone HF Days
MW days Distance2 Total Total
# ML Volume before 30-Days 1-Year 2-Years 30-Days
before (m) Antecedent Antecedent
(m3) Earthquake3
Ovintiv, CNRL,
2018-11-30T01:27:06 4.5 KSMMA 3200 7971 0 14,489 418,390 501,852 550,514 CNRL
Arc, Crew
2013-05-28T04:36:08 4.2 KSMMA
2018-11-30T02:15:01 4.0 KSMMA 4400 7971 0 16,916 888,912 1,360,121 1,683,636 CNRL Ovintiv, CNRL
2015-11-29T16:20:53 3.9 KSMMA 2.6 1 2.9 1500 6158 −14 231,000 377,949 CNRL, Crew
Ovintiv, CNRL,
2018-11-30T02:06:02 3.4 KSMMA 2560 7971 0 14,489 418,390 699,084 747,746 CNRL
Arc, Crew
2019-10-05T09:07:17 3.2 KSMMA 3 1 2.4 13,600 18,411 0 225,811 487,665 1,263,742 Tourmaline
DOI: 10.4236/gep.2021.95006 65 Journal of Geoscience and Environment ProtectionA. R. Chapman
Continued
2018-04-30T05:05:57 3.0 KSMMA 365,628 748,952 1,226,684 Crew, CNRL,
2019-10-08T13:44:04 3.0 KSMMA 6 1 2.4 16,686 −2 225,811 435,148 1,117,636 Tourmaline
2015-08-17T20:15:00 4.6 NPGMMA 4900 10,303 −1 143,187 210,592 228,346 275,706 Petronas Petronas
2014-08-04T17:17:24 4.5 NPGMMA 930 11,682 −2 35,548 47,202 86,694 86,694 Petronas Petronas
2016-07-12T21:08:39 3.9 NPGMMA 2160 21,140 2 69,179 142,994 142,994 168,111 Saguaro Saguaro
Tourmaline,
2019-07-13T08:59:11 3.9 NPGMMA 4 1 2.5 3200 7215 0 144,870 389,866 611,474 1,275,452 Tourmaline
Petronas
2014-07-30T21:23:56 3.8 NPGMMA 13,600 13,724 3 52,707 52,707 Petronas
Tourmaline,
2019-11-30T07:32:47 3.8 NPGMMA 1880 7247 −8 98,066 292,999 292,999 735,792 Tourmaline
Petronas
2014-07-16T17:44:06 3.7 NPGMMA 1 1 2.4 4510 11,109 −1 84,629 84,629 124,246 Petronas
2015-11-03T12:41:05 3.6 NPGMMA 3 2 2.2 13,900 18,513 −12 39,304 39,304 39,304 Petronas
2017-11-18T08:45:41 3.6 NPGMMA 23 3 2.8 178,652 Petronas
Pacific
2014-12-17T10:01:48 3.5 NPGMMA 24 2 2.8 12,700 17,559 1 12,510 12,510
Canbriam
2015-09-02T07:42:34 3.5 NPGMMA 16 3 4.6 1570 16,087 0 108,386 153,108 153,108 Petronas
2016-10-16T03:27:53 3.5 NPGMMA 5480 29,960 0 29,960 90,847 90,847 299,617 Petronas Petronas
2018-01-21T05:48:47 3.5 NPGMMA 220,638 Petronas
2013-04-07T02:39:11 3.5 NPGMMA
2013-08-21T15:31:31 3.4 NPGMMA 0.4 1 2.0 1850 20,189 −1 32,765 32,765 32,765 32,765 Petronas Petronas
2015-11-21T17:57:30 3.4 NPGMMA 4 3 2.4 10,200 25,050 0 75,284 310,281 397,958 448,768 Petronas Petronas
Petronas,
2016-12-03T05:13:55 3.4 NPGMMA 23 1 2.3 4170 25,373 0 73,636 73,636 110,863 153,314 Petronas Pacific
Canbriam,
Painted Pony,
2019-02-20T16:22:39 3.4 NPGMMA 4 1 2.3 4310 13,989 0 89,998 177,528 270,524 484,905 Tourmaline Tourmaline,
Petronas
Pacific
2014-12-29T15:03:13 3.3 NPGMMA 12 7 3.5 12,400 17,559 −11 12,510 12,510
Canbriam
Pacific
2015-08-28T03:52:18 3.3 NPGMMA 28 1 2.1 2700
Canbriam
Tourmaline,
2019-02-27T16:41:02 3.3 NPGMMA 7 2 3.4 2220 11,308 −1 122,498 122,498 233,302 540,660 Tourmaline
Petronas
2017-06-08T20:22:18 3.3 NPGMMA
2014-03-02T22:24:23 3.2 NPGMMA 0.2 1 2.6 2220 13,493 −3 13,493 13,493 13,493 13,493 Petronas Petronas
Painted Painted Pony,
2017-10-23T01:28:27 3.2 NPGMMA 0.2 1 3.0 6350 17,452 −1 67,293 132,431 231,419 378,266
Pony Petronas
2016-12-30T00:06:24 3.2 NPGMMA
2017-04-19T19:07:57 4.2 NPGMMA
2014-12-21T00:18:36 3.1 NPGMMA 27 5 2.7 13,100 11,618 −11 6870 6870 CNRL
Petronas,
2015-03-01T11:30:44 3.1 NPGMMA 9 1 2.6 5780 11,500 −10 11,500 106,406 132,004 132,004 Petronas
Tourmaline,
Petronas,
2016-03-10T02:37:13 3.1 NPGMMA 3 2 2.3 3040 14,405 −3 106,406 132,004
Tourmaline,
Pacific
2016-11-10T05:58:34 3.1 NPGMMA 82,083 105,941 146,191
Canbriam
Pacific
2017-10-27T04:18:03 3.1 NPGMMA 2 1 3.0 5160 15,503 0 198,951 568,767 1,020,982
Canbriam
Painted Pony,
2017-11-15T19:13:19 3.1 NPGMMA 1 1 2.2 11,200 11,272 2 158,308 254,819 525,027
Petronas
2018-05-19T07:56:45 4.1 NPGMMA
DOI: 10.4236/gep.2021.95006 66 Journal of Geoscience and Environment ProtectionA. R. Chapman
Continued
2013-10-16T17:46:10 3.0 NPGMMA 2 1 2.7 1150 13,994 −2 77,268 77,268 77,268 77,268 Petronas Petronas
2014-01-23T03:30:04 3.0 NPGMMA 9 9 2.7 3070 16,511 −2 45,702 103,531 103,531 103,531 Petronas Petronas
2014-06-30T19:38:46 3.0 NPGMMA 3330 13,340 −8 64,121 199,585 308,023 308,023 Petronas Petronas
Petronas,
2015-04-06T02:34:56 3.0 NPGMMA 22 1 2.0 4390 9143 −12 22,656 96,145 121,027 Painted Pony,
Tourmaline
2015-09-16T02:59:27 3.0 NPGMMA 1 1 2.6 4660 19,942 0 64,922 79,700 122,813 122,813 Petronas Petronas
2015-09-26T08:55:16 3.0 NPGMMA 24 4 2.8 12,700 16,473 0 38,085 142,450 298,498 310,026 Petronas Petronas
2016-02-21T09:51:28 3.0 NPGMMA 15 3 2.1 12,500 24,112 1 167,831 255,508 275,900 Petronas
Painted
2017-10-22T21:26:55 3.0 NPGMMA 0.1 1 2.4 3230 17,452 0 49,298 167,524 309,204 483,320 Painted Pony
Pony
P. Pacific
2017-10-25T22:43:28 3.0 NPGMMA 3270 19,944 2 33,447 101,213 152,826 185,259
Canbriam Canbriam
2013-01-19T16:35:32 3.0 NPGMMA 0.3 1 2.9
2015-03-21T15:49:20 3.0 NPGMMA
2017-04-21T07:47:09 3.0 NPGMMA 0.5 1 3.2
2018-01-25T02:31:53 3.7 Other 22,634 ConocoPhillips
2014-03-01T04:35:29 3.4 Other
2013-09-03T02:45:26 3.3 Other
X 5800 15,111 −2 59,417 183,426 255,144 369,571
Max 13,900 29,960 −14 144,870 888,912 1,360,121 1,683,636
Note 1. Associated earthquakes have HF activity within 5-km radius of the earthquake and within 90 days before the earthquake occurrence. Note 2. Dis-
tances shown in blue italic are derived from the Visser (2017, 2020) earthquake catalogues, the remainder are derived from the NRCAN catalogue. Note 3.
“Days before Earthquake” are negative where the fracking completed before the date of the earthquake and are positive where the fracking completed after
the earthquake. Where the day is zero (0), the fracking completed on the day of the earthquake.
Table 3. Volumes of injected HF water for Montney earthquakes, 2013-2019, for HF wells located within 5-km radius of the
earthquake epicentre. For the results shown in red the M ≥ 3.0 volumes are significantly larger than the M ≤ 2.9 volumes
(Mann-Whitney U, p < 0.05).
Antecedent Earthquake KSMMA NPGMMA Montney
Period Magnitude Mean Median Mean Median Mean Median
M ≥ 3.0 15,298 14,489 69,741 66,108 63,208 64,121
30 Day
M ≤ 2.9 101,908 63,411 52,289 43,138 72,680 48,581
M ≥ 3.0 59,960 72,961 87,504 75,452 81,995 75,309
90 Day
M ≤ 2.9 126,003 69,255 64,795 46,228 89,511 55,579
M ≥ 3.0 423,824 392,009 138,017 122,498 187,012 142,994
1 Year
M ≤ 2.9 321,030 203,969 106,309 82,816 173,242 93,541
M ≥ 3.0 637,689 501,852 179,283 127,409 257,548 208,294
2 Year
M ≤ 2.9 441,888 253,061 134,792 102,461 225,877 118,237
M ≥ 3.0 763,726 699,084 207,457 133,812 291,615 166,143
3 Year
M ≤ 2.9 488,405 274,946 148,821 106,590 247,245 123,485
M ≥ 3.0 995,400 1,117,636 264,489 168,111 372,811 220,638
Total
M ≤ 2.9 560,361 278,246 166,220 121,027 279,582 136,507
DOI: 10.4236/gep.2021.95006 67 Journal of Geoscience and Environment ProtectionA. R. Chapman
Differences in seismic susceptibility across the Montney are evident. Fifteen
percent of hydraulically fractured wells in the Montney during 2012-2019 have
close spatiotemporal association with earthquakes. The NPGMMA has the high-
est rate of induced seismicity, with 26% of HF wells associated with earthquakes,
while the rate in the KSMMA is about one-half that, at 13%. The remainder of
the Montney outside these two zones appears to have a low susceptibility to
HF-induced earthquakes, with a rate of only 2%. Also, there are clear differences
in associated earthquake rates among operators, possibly indicative of geologic
and tectonic differences across the Montney and within the zones, and possibly
also related to differences in hydraulic fracturing procedures (pump rate, volume
per stage, etc.). Petronas leads with the highest earthquake rate – 39% of its HF
wells are associated with earthquakes, followed by Tourmaline Oil in the
KSMMA with an associated earthquake rate of 29%. Ovintiv, the largest operator
in the KSMMA, has an associated earthquake rate that is one-third of Tourma-
line’s, at 9% (refer to Table 1).
The rate of association of M ≥ 3.0 earthquakes with HF wells is 1.7% for the
Montney in total, ranging from 3.9% for the NPGMMA to 0.6% for the
KSMMA, and with a rate ofA. R. Chapman
However, beginning at the 1-year antecedent period the M ≥ 3.0 earthquakes are
associated with substantially larger cumulative frack water volumes compared to
the M ≤ 2.9 events (Figure 6). The differences for the 1-year, 2-year, 3-year and
total antecedent periods for the KSMMA are all statistically significant
(Mann-Whitney U test, p < 0.05), while the differences in just the 1-year and to-
tal antecedent periods are significant for the NPGMMA. As well, M ≥ 3.0 earth-
quakes are associated with a significantly greater number and density of proxim-
al HF wells (87 wells within 5-km, 1.10 wells/km2) compared to M ≤ 2.9 earth-
quakes (45 wells within 5-km, 0.57 wells/km2) (Table 4). The NPGMMA also
exhibits a greater number of HF wells proximal to M ≥ 3.0 earthquakes (17 wells
within 5-km, 0.22 wells/km2) compared to M ≤ 2.9 earthquakes (11 wells within
5-km, 0.14 wells/km2). These differences are statistically significant (Mann-
Whitey U, p < 0.05). Proximal HF well density and antecedent frack fluid injec-
tion volumes are co-related variables. Earthquakes induced by hydraulic frac-
turing cannot be considered just in relation to a single HF well but must be con-
sidered as an outcome related to the cumulative development density from mul-
tiple proximal operators and cumulative fluid injection over periods ranging
from a few months to a few years.
In most cases of HF-associated earthquakes in the Montney, a single operator
was responsible for all the HF activity within 90 days of the earthquake (97%).
However, for 1-year and longer antecedent periods multiple operators in prox-
imity are commonly linked to induced earthquakes. As many as 29% percent of
the Montney earthquakes are associated with hydraulic fracturing conducted by
multiple operators over antecedent time periods of one year and longer, in some
cases as many as four operators. The KSMMA, where there is a greater density of
HF development to date, exhibits the highest rate of multiple operator associa-
tion with earthquakes, at 59%. The NPGMMA, which has a lower density of de-
velopment, has as many as 19% of earthquakes with multiple operator associa-
tion. The smaller percentage of co-association in the NPGMMA is mostly due to
the dominance of Petronas and the lack of adjacency between them and other
operators.
Figure 6. Median frack water volume (m3) injected within 5-km of earthquake epicentres
for all earthquakes, 2013-2019.
DOI: 10.4236/gep.2021.95006 69 Journal of Geoscience and Environment ProtectionA. R. Chapman
Table 4. Number and density of HF wells located within 5-km radius of earthquakes. For
the results shown in red the M ≥ 3.0 values are significantly greater than the M ≤ 2.9 vo-
lumes (Mann-Whitney U, p < 0.05).
Earthquake KSMMA NPGMMA Montney
Variable
Magnitude Mean Median Mean Median Mean Median
# of wells M ≥ 3.0 87 100 18 10 29 12
within 5-km M ≤ 2.9 45 31 11 9 21 10
Well Density M ≥ 3.0 1.10 1.27 0.23 0.13 0.37 0.15
Wells/km2 M ≤ 2.9 0.57 0.39 0.14 0.11 0.27 0.13
The three earthquakes that occurred on 29 November 2018 (MW 4.6, 4.0 and
3.4) provide a good example of multiple operator association. They were closely
associated with nearby well completion operations conducted by CNRL, where
14,489 m3 of frack water was injected by CNRL into two horizontal wells (CNRL
HZ Septimus G05-22-081-18 and H05-22-081-18) on a nearby well pad in the
preceding 7-day period. However, before that, a total 1.72 million m3 of frack
water was injected within 5-km radius of the three earthquake epicentres in a
total of 109 HF wells associated with four operators, led by Ovintiv (76 wells,
1.26 million m3), followed by CNRL (25 wells, 425,318 m3), ARC Resources (8
wells, 41,009 m3) and Crew Energy (1 well, 7653 m3). Injected frack water can
migrate some distance through preferential pathways such as the natural geo-
logic fault and fracture structure, increasing pore pressures well beyond the
proximity of the horizontal well bore (Atkinson et al. 2016; Schultz et al., 2015;
Atkinson et al. 2020). This geologic co-mingling of HF water from multiple op-
erators or from a single operator across a large geographic space and over vary-
ing antecedent time periods makes difficult the task of ascertaining earthquake
cause and effect and makes difficult the determination of linkage to a specific HF
operation. Also, it indicates that fracking-induced earthquakes are a cumulative
development effect with responsibility commonly shared amongst several oper-
ators injecting large volumes of frack fluids, or a single operator injecting frack
fluids at multiple wells and/or well pads, within geographic bounds.
5.3. Triggering Events and Precursor Events
The Montney data indicate that most of the M ≥ 3.0 earthquakes are triggered by
fracking of a single well, or a small group of wells on a single well pad, in the
days before the earthquake. Eighty-seven percent for the Montney M ≥ 3.0
earthquakes have associated HF events that appear likely to be the triggering
events, with fracking occurring up to 14 days before the earthquake ( X = 2
days), with distances ranging from 0.9 km to 15.0 km ( X = 5.8 km). These are
associations rather than deterministic cause and effect, and uncertainty increases
for the earthquakes with the most distant triggers. If the events with trigger dis-
tances of >10 km were discounted, the association rate drops to ~70%, similar to
DOI: 10.4236/gep.2021.95006 70 Journal of Geoscience and Environment ProtectionA. R. Chapman
the rate determined from the spatiotemporal filter analysis concluded above. The
mean triggering frack fluid volume is 15,100 m3 (refer to Table 2), representing
only 4.3% percent of the total cumulative antecedent frack fluid injection in the
5-km radius proximal to the earthquake. Sixty-four percent of the triggering
wells are located within 5-km of their earthquake epicentre, an approximate
maximum length of the horizontal well bore combined the adjacent hydraulical-
ly fractured rock, indicating that direct hydraulic intersection of the horizontal
well bore with a natural fault or fracture is not a primary causative factor for
about one-third of induced earthquakes. There is uncertainty in the locations of
earthquake epicentres that needs to be considered. Comparison of the earth-
quake epicentres between the NRCAN catalogue and the Visser et al. (2017,
2020) catalogues for M ≥ 3.0 events indicate epicentral differences of 1.3 - 9.7
km ( X = 4.5 km, S.D. = 2.6 km, n = 26). The variability is random and
non-systematic. The improved epicentral locations from the Visser (2017, 2020)
catalogues cause about one-half the earthquakes to increase in distance from the
HF trigger wells and one-half to decrease in distance compared to the NRCAN
epicentres, with no net aggregate change. Ten (24%) of the M ≥ 3.0 earthquakes
have two or more operators fracking proximal to the epicentre at the time of the
earthquake. This operational overlap, combined with the epicentre location un-
certainty and ambiguity, makes difficult the task of determining triggers and op-
erator responsibility, should that be necessary.
Of the 30 Montney earthquakes M ≥ 3.0 identified as closely associated with
proximal HF activity (within 5-km of epicentre in previous 90 days), 19 (63%)
have smaller precursor earthquakes (refer to Table 2), based on the NRCAN ca-
talogue. One of the M ≥ 4.0 HF-associated earthquakes had smaller precursor
earthquakes that would have provided an early warning. For the KSMMA, only
three of seven (43%) HF-associated earthquakes had smaller precursor events. It
is evident that large magnitude induced earthquakes can and do occur without
precursor warning.
5.4. Cumulative Antecedent Frack Fluid Injection
Cumulative frack fluid injection across extended time periods is a factor in
creating the conditions amenable to initiating large magnitude earthquakes. This
is possibly due to the dispersion of frack fluid and the diffusion of pore pressures
through the existing fault and fracture network (Schultz et al., 2015; Atkinson et
al., 2016; Atkinson et al., 2020; Dusseault & McLennan, 2011), creating an ex-
pansive geographic area of increased pore pressure, enhancing the potential for
the faults and fractures to experience a slip in relation to a later smaller volume
frack fluid injection associated with a single nearby well. This may also be an ex-
planatory hypothesis for the observation of Schultz et al. (2018) of a 3-year de-
layed response in earthquake rates in the Duvernay Play in Alberta in relation to
the beginning of HF activity. This delayed response to earthquake rates is loca-
tion and geology dependent and is evident in the KSMMA but is less evident in
DOI: 10.4236/gep.2021.95006 71 Journal of Geoscience and Environment ProtectionA. R. Chapman
the NPGMMA, where accelerated earthquake activity parallels the beginning of
HF operations in 2007-2008. This analysis speculatively suggests that the large
fracture fluid injection across the KSMMA (13.9 million m3 during 2012-2019)
and NPGMMA (14.4 million m3 during 2012-2019) may now have increased the
internal pore pressures broadly to enhance potential for increased earthquake
frequency and magnitudes in response to ongoing and future HF operations. A
seismogenicity role for antecedent frack fluid injection volumes has been noted
by recent researchers (e.g., Kao et al., 2018), but the long-term implications re-
main uncertain.
6. Discussion
This study documents that earthquake frequency and magnitude increase in re-
sponse to the number of wells fracked each year and in relation to the volume of
injected frack fluid. As well, cumulative frack fluid injection over one- to
three-year antecedent time periods, often by multiple operators in proximity,
appears to be related to induced seismicity. Co-mingling of injected frack water
over antecedent periods of one year or longer is an induced seismicity risk fac-
tor, possibly through the diffusion of frack fluid through permeable pathways
from adjacent but proximal operations, creating broad geographic areas of ele-
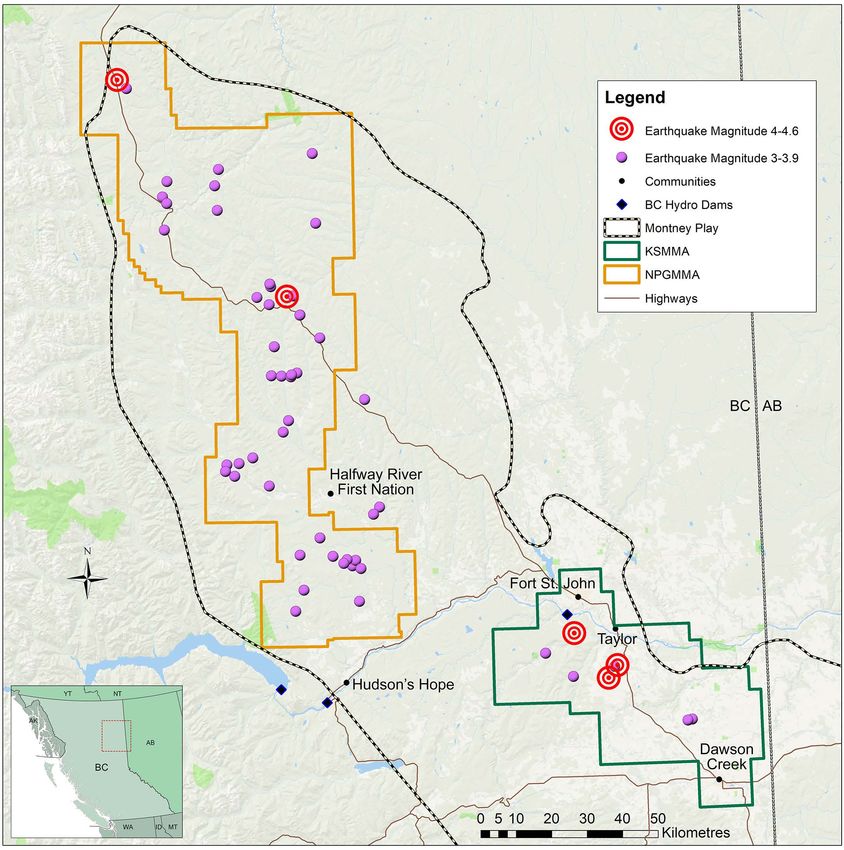
vated pore pressures. The three earthquakes (MW 4.6, 4.0 and 3.4) occurring on
29 November 2018 in the KSMMA provide a good reference case of the cumula-
tive development effect of large volume frack water injection over an antecedent
one- to three-year period by multiple operators in a small area (Figure 7(a)).
The earthquakes were closely associated with nearby well completion operations
conducted by CNRL, where 14,489 m3 of frack water was injected into two hori-
zontal wells immediately before the earthquakes. However, this seems to be the
proverbial “straw that broke the camel’s back”. Before that, a total 1.72 million
m3 of frack water was injected within 5-km radius of the three earthquake epi-
centres in a total of 109 HF wells associated with four operators, led by Ovintiv
and followed by CNRL, ARC Resources and Crew Energy. In the NPGMMA,
only 16% of the fracking-associated earthquakes are associated with multiple
operators, but this may be more to do with Petronas being the largest tenure
holder in the NPGMMA, with most of its HF activity to date being internal in its
lease, not at the peripheries close to other operators. The Mw 4.6 earthquake on
17 August 2015 provides a good reference case of cumulative antecedent HF
fluid injection by a single operator triggering an earthquake. For this event, Pe-
tronas was the sole operator, injecting 67,625 m3 of frack fluid into four wells in
the week before the earthquake (Petronas HZ Town A-E099-J/094-B-16,
A-F099-J/094-B-16 and A-G099-J/094-B-16), but injecting 275,000 m3 of frack
fluid in the three years prior to the earthquake (Figure 7(b)). There is no reason
to conclude that the co-mingling effect of cumulative antecedent frack water in-
jections from multiple well pads in initiating earthquakes is not universal across
the Montney. Although one-year and longer antecedent frack water volume is
DOI: 10.4236/gep.2021.95006 72 Journal of Geoscience and Environment ProtectionA. R. Chapman
related to earthquake magnitude, there is no statistically significant difference in
the 30-day and 90-day antecedent volume between the M ≥ 3.0 and M ≤ 2.9
events. The characteristics of the specific HF operation that triggers the earth-
quake may be less important than the cumulative effect of frack water injections
into the subsurface over a longer antecedent period, although this needs to be
investigated in light of clear differences in induced earthquake association rates
amongst operators.
(a)
(b)
Figure 7. (a) Locations of the M 4.6 earthquakes and the subsequent M 4.0 and M 3.4
earthquakes (NRCAN catalogue) in the KSMMA on 29 November 2018, showing the
5-km radius buffer around each earthquake and well pads with all hydraulically fractured
wells. The two CNRL wells (WA 37346 and 37347) that were being fracked at the time of
the earthquakes are shown. There were 109 HF wells within 5-km of the earthquake epi-
centres fracked before the earthquake, with a total fluid injection of 1.7 million m3; (b)
Locations of the M 4.6 earthquake (NRCAN catalogue) in the NPGMMA on 17 August
2015, with a 5-km radius buffer around the earthquake and well pads with all hydrauli-
cally fractured wells. The four Petronas wells (W30374, 30375, 30376 and 30377) that
were being fracked at the time of the earthquake are 5.1 km from the epicentre. There
were 16 HF wells fracked within 5.1-km of the earthquake epicentre before the earth-
quake, with a total fluid injection of 275,000 m3. The M 3.5 earthquake on 02 September
2015 is also shown.
DOI: 10.4236/gep.2021.95006 73 Journal of Geoscience and Environment ProtectionA. R. Chapman
Eighty-seven percent for the Montney M ≥ 3.0 earthquakes have associated
HF events that appear likely to be the triggering events, with fracking occurring
up to 14 days before the earthquake ( X = 2 days), with distances ranging from
0.9 km to 15.0 km ( X = 5.8 km). The distances between the HF trigger and the
earthquakes indicates that direct hydraulic connection between the fractured
zone around the well bore and the fault that ruptures due to HF-induced local
pore pressure increase is the primary causative factor but is not the only factor.
Other causative factors must be considered, such as hydraulic fluid migration for
moderate distances along the high-permeability pathways created by the natu-
rally faulted and fractured matrix (Atkinson et al., 2016; Schultz et al., 2015),
poroelastic coupling (Goebel et al, 2017) and aseismic slip (Guglielmi et al.,
2015). For these three long-distance coupling mechanisms, the role of antece-
dent cumulative large volume frack fluid injection as presented in this paper is
critical.
Given the relationships between earthquake frequency and magnitude and
cumulative frack water injection, it is important to consider the state of uncon-
ventional petroleum operations in the Montney at the present time. To date,
with an average of only 4.5 wells per pad, well below the 20+ wells per pad an-
ticipated at full development and as being employed in some cases in the
KSMMA, the Montney is largely in an early phase of development. Activity has
been constrained by the low market value of methane (natural gas). Future un-
conventional petroleum development in the Montney is likely to remain chal-
lenged until economic factors change, which could occur with the completion of
the Coastal Gaslink pipeline from Dawson Creek to Kitimat, and the LNG Can-
ada export facility at Kitimat in the mid-2020s (Shell, 2020). At that time, acce-
lerated well drilling and fracking may occur, primarily by completing work on
the existing well pad infrastructure. An additional 10,000+ HF wells would be
required for the Montney to fill-out the well pads currently built, with a total
water requirement of ~230+ million m3, almost 6X greater than the total frack
fluid injected during 2012-2019, and equivalent to the water volume of as many
as 100,000 Olympic-sized swimming pools.
This paper does not include analysis of potential induced seismicity associated
with the operation of fluid disposal wells in the Montney. Review by the BC Oil
and Gas Commission BCOGC (2014) concluded that about 16 percent of in-
duced earthquakes (M 2.4 - 4.4) were likely associated with disposal wells, while
84% were associated with fracking activity. Ghofrani and Atkinson (2021) con-
clude similarly. It is possible that some of the earthquakes reported here as asso-
ciated with fracking may have a sole or co-association with fluid injection from
disposal wells, but it is well documented that hydraulic fracturing is the domi-
nant source of induced earthquakes in the Montney (Ghofrani & Atkinson,
2021; Schultz et al., 2020a).
6.1. Public Safety and Infrastructure Risks
Fracking-induced earthquakes in the Montney and elsewhere will continue to be
DOI: 10.4236/gep.2021.95006 74 Journal of Geoscience and Environment ProtectionA. R. Chapman
a pervasive issue with ongoing public safety, infrastructure and environmental
risks (Atkinson et al., 2020; Ghofrani & Atkinson, 2020; Schultz et al. 2020a;
Schultz et al., 2018; Atkinson et al., 2016; others). Should the rate of HF well de-
velopment increase in the future, both the frequency of earthquakes and the
magnitude of earthquakes are anticipated to rise. There is ongoing debate within
the scientific community (e.g., McGarr, 2014; Atkinson et al., 2016; Eaton &
Igonin, 2018) as to what the maximum magnitudes of HF-induced earthquakes
might be, with a coalescing of thought towards maximum earthquake magnitude
being limited only by the tectonic environment in which the HF activity is oc-
curring, with a probabilistic distribution of magnitudes within that environment
(van der Elst et al., 2016). High magnitude and low probability events exceeding
ML 5.0 would be anticipated for the Montney, with the likelihood of events of
this magnitude increasing in direct relation to the volume of frack fluid injection
and the number of HF-induced earthquakes each year. It is useful to consider
the 2018 ML 5.7 and 2019 ML 5.3 earthquakes induced by hydraulic fracturing in
China’s Sichuan region, which resulted in two deaths, injuries to 17 people, col-
lapse or extensive damage to 390+ houses, large scale landslides and $10 million
(Can $) in direct economic impacts (Lei et al., 2019; Rogers, 2020). Induced
earthquakes of these magnitudes occurring in some parts of the Montney could
be similarly consequential. Recent research by Barbaie Mahani et al. (2019) and
Atkinson (2020) on the intensity of ground motion from induced earthquakes
concludes that peak ground motions exceed the damage threshold within 5 km
of the earthquake epicentre for M 4 earthquakes, and that ground motions asso-
ciated with M ≥ 4.5 earthquakes have significant damage potential within 5 km
and may be damaging to greater distances. Atkinson (2020) also concludes that
earthquakes of M > 4.8 can produce significant damage effects from intense
ground motion that extends to 10 km from the earthquake epicentre.
Public risks in the Montney includes the communities of Dawson Creek, Fort
St. John, Taylor, Hudson’s Hope, Upper Halfway (Halfway River First Nation)
and possibly others, and infrastructure such as the WAC Bennett, Peace Canyon
and Site C dams, community water supply and treatment systems, the Taylor
Gas Plant, the Taylor Bridge crossing of the Peace River, numerous earthen wa-
ter storage dams, and others. Table 5 lists the number and magnitudes of earth-
quakes within 15 km of some communities and critical infrastructure during
2013-2019, to indicate some of the hazard associated with HF-induced earth-
quakes at these locations. Included in Table 5 are summary statistics for 25 ear-
then water storage dams built by petroleum companies, where the dam height is
8 - 23 m, and/or the live storage volume (i.e., the volume that could be released
in the event of a dam failure) is 75,000 - 200,000+ m3, where a dam failure could
result in public safety and/or environmental impacts. Nineteen of the 25 dams
are in the NPGMMA, operated by Petronas, with uncertain design and con-
struction (Parfitt, 2017), while six are in the KSMMA, four operated by Ovintiv
and two by ARC Resources.
DOI: 10.4236/gep.2021.95006 75 Journal of Geoscience and Environment ProtectionA. R. Chapman
Table 5. Number and maximum magnitude of earthquakes within 15-km of communities
and critical infrastructure during 2013-2019. These locations (and others) could be con-
sidered for protection with “Earthquake Protection Zones”.
Maximum
# of
Location Zone Magnitude
Earthquakes
(M L or MW)
Dawson Creek KSMMA 10 2.5
Fort St. John KSMMA 5 4.2
Taylor (including Taylor Bridge and Gas Plant) KSMMA 35 4.6
Hudson’s Hope NPGMMA 1 2.5
Upper Halfway (Halfway River First Nation) NPGMMA 38 3.5
WAC Bennet dam NPGMMA 2 1.6
Site C dam1 KSMMA 12 4.2
Petroleum water storage dams (25 dams) 2
KSMMA & NPGMMA 45 ( X ) 4.6
Note 1. The epicentres of the M 4.6, 4.0 and 3.4 earthquakes on 29 November 2018 were 21-km from the
Site C dam site and are not included in this table. Note 2. For the 25 petroleum water storage dams ana-
lyzed in this paper, proximal earthquake counts ranged from 3 to 119 within 15-km of the dam ( X = 45).
Eighty percent of the dams have proximal earthquakes M ≥ 3.0, and 24% have proximal earthquakes M ≥
4.0.
6.2. Hazard Mitigation
To carry out hydraulic fracturing operations effectively and safely, potentially
destructive earthquakes must be mitigated or avoided (Atkinson et al., 2020).
Hazard mitigation for induced seismicity in NEBC is predominantly through the
possible varying of operator-specific practices such as the duration of injection,
the injection pressure and the volume of injected frack fluid, etc., in combination
with a Traffic Light Protocol system. Despite being suggested as a mitigation ap-
proach by the BCOGC (2014), substantially modifying operator-specific HF
practices to reduce earthquake inducement appears unlikely, given that a fun-
damental basis of the hydraulic fracturing process is to apply a high degree of
brute force to create extensive fracturing in the target formation in order to gen-
erate economic petroleum production. As well, there is no documentation indi-
cating that modified HF practices to reduce induced earthquake frequency or
magnitude have been applied or tested; there is a common tendency of industry
operators to hold information as proprietary where they consider that it pro-
vides a competitive advantage; and there is no regulatory requirement for mod-
ified HF practices to address earthquake risk. Given that, the primary hazard mi-
tigation applied in NEBC is a modified Traffic Light Protocol (TLP) system. TLP
systems have become the de facto mitigation approach created by regulatory
agencies to address HF-induced earthquakes; despite this, little work has been
done to rigorously evaluate the efficacy of their application (Schultz et al.,
2020a). The primary TLP which applies to the Montney is contained within reg-
ulation under the BC Oil and Gas Activities Act, specifying suspension of HF ac-
tivity if the HF well is identified as causing a seismic event of M 4.0 or greater
DOI: 10.4236/gep.2021.95006 76 Journal of Geoscience and Environment ProtectionYou can also read