Spatial analysis of disinformation in COVID-19 related Tweets
←
→
Page content transcription
If your browser does not render page correctly, please read the page content below
Preprints (www.preprints.org) | NOT PEER-REVIEWED | Posted: 10 September 2020 doi:10.20944/preprints202009.0213.v1

 Spatial analysis of disinformation in COVID-19 related Tweets

 Amir Masoud Forati1*, and Rina Ghose2
 1,2 Department of Geography, University of Wisconsin- Milwaukee, Milwaukee, USA
 1* aforati@uwm.edu
 2 * rghose@uwm.edu

 Abstract:

 COVID-19 has emerged as a global pandemic caused by its highly transmissible nature during the
 incubation period. In the absence of vaccination, containment is seen as the best strategy to stop
 virus diffusion. However, public awareness has been adversely affected by discourses in social
 media that have downplayed the severity of the virus and disseminated false information. This
 article investigates COVID-19 related Twitter activity in May 2020 to examine the origin and
 nature of disinformation and its relationship with the COVID-19 incidence rate at the state and
 county level. A geodatabase of all geotagged COVID-19 related tweets was compiled. Multiscale
 Geographically Weighted Regression was employed to examine the association between social
 media activity, population, and the spatial variability of disease incidence. Findings suggest that
 MGWR could explain 96.7% of the variations, and content analysis indicates a strong spatial
 relationship between social media activity and known cases of Covid-19. Discourse analysis was
 conducted on tweets to index tweets downplaying the pandemic or disseminating
 disinformation. Findings suggest that states where twitter users spread more disinformation and
 showed more resistance to pandemic management measures in May, have experienced a surge
 in the number of cases in July.

 Keywords: GIS, discourse analysis, COVID-19, Coronavirus, spatial analysis, disinformation, social
 media activity, downplay

 1. Introduction:
 Coronavirus (COVID-19) related illness has been identified as a global pandemic by the World
 Health Organization (WHO). Known in the scientific communities as Severe Acute Respiratory
 Syndrome Coronavirus 2 or SARS-CoV-2, it was first identified in Wuhan, China (Linton et al.,
 2020; Xie & Chen, 2020). It is highly transmissible during the incubation period and spreads from
 person to person through droplets in the air or surface. Susceptibility to the virus is more
 common among those who have underlying conditions such as hypertension, diabetes, and hea rt
 disease. Males are also more susceptible to the virus (Xie & Chen, 2020). In the absence of a
 vaccine, containment of the virus is seen as the best strategy to stop further transmission.

 1

 © 2020 by the author(s). Distributed under a Creative Commons CC BY license.
Preprints (www.preprints.org) | NOT PEER-REVIEWED | Posted: 10 September 2020 doi:10.20944/preprints202009.0213.v1

 Containment strategies include the use of face masks, handwashing , social distancing, self-
 isolation, and quarantine, and many countries have enforced lockdowns to reduce transmissions.

 Coronavirus (COVID-19) related illness has been identified as a global pandemic by the World
 Health Organization (WHO). Known in the scientific communities as Severe Acute Respiratory
 Syndrome Coronavirus 2 or SARS-CoV-2, it was first identified in Wuhan, China (Linton et al.,
 2020; Xie & Chen, 2020). It is highly transmissible during the incubation period and spreads from
 person to person through droplets in the air or surface. Susceptibility to the virus is more
 common among those who have underlying conditions such as hypertension, diabetes, and heart
 disease. Males are also more susceptible to the virus (Xie & Chen, 2020). In the absence of a
 vaccine, containment of the virus is seen as the best strategy to stop further transmission.
 Containment strategies include the practice of using face masks, handwashing, social distancing,
 self-isolation, and quarantine, and many countries have enforced lockdowns to reduce
 transmissions. USA ranks first in both the number of cases (3.24 million) and in the number of
 deaths (136,00) (CDC). Significantly, minorities have been worst affected by Coronavirus, as
 "current data suggest a disproportionate burden of illness and death among racial and ethnic
 minority groups" (CDC). CDC has identified the following factors for this: living conditions, work
 circumstances, underlying health conditions, and low access to care (CDC). Despite the high
 number of deaths and infection, political and social resistance to containment measures have
 been profound in the USA. Misinformation and disinformation have circulated widely through
 social media, affecting public perception and awarenes s of COVID-19. Twitter has been widely
 used for such activities. Twitter facilitates the exchange of microblogs, coined as 'tweets,' which
 contain a short textual message and metadata. Geotagged tweets provide location information
 and are a rich source of location-based data (Sui and Goodchild 2011). These spatially identified
 posts in social media (Tsou 2015) enable us to examine the dynamic interactions between human
 behavior and the environment (Shaw et al. 2016). Cao et al. (2015) highlighted the role of social
 media as a proxy to understand human behaviors and complex social dynamics in geographic
 spaces. They developed a scalable computational framework to model extensive unstructured
 geotagged social media data for systematic spatiotemporal data analysis. This line of research
 enables us to ask questions about individual and collective behavior that would be very hard to
 answer otherwise.

 This article investigates Twitter activity on COVID-19 during the month of May 2020. We use
 geotagged tweets to examine their relationship with the COVID-19 incidence rate at the state
 and county level. Through Multiscale Geographically Weighted Regression (MGWR), we
 examined the association between twitter activity, population, and the spatial variability of
 disease incidence. Results indicate that MGWR can explain 96.7% of the variations. Further, our
 content analysis of the COVID-19 related twitter dataset reveals that a strong spatial relationship
 exists between Twitter activity and known cases of COVID-19. Discourse analysis findings suggest
 that a correlation between the spread of disinformation and surges of COVID-19.

 2
Preprints (www.preprints.org) | NOT PEER-REVIEWED | Posted: 10 September 2020 doi:10.20944/preprints202009.0213.v1

 2. Background and Literature review
 The first confirmed COVID-19 case in the USA was identified in Washington State on January 19 th,
 2020 (Holshue et al., 2020). Thereafter, multiple states experienced an increased number of
 COVID19 cases; New York became one of the epicenters of the disease spread. On March 26th,
 2020, the USA became the leading country in the number of cases worldwide. As of July 15th, 3.4
 million cases and 136,000 deaths have taken place in the USA (CDC).

 The impacts of this disease have been profound in the USA. Through the deployment of
 neoliberal policies, funding for public health and social welfare has been cut as part of austerity
 measures, leaving the country ill-prepared for a global pandemic (Harvey, 2020). Consequently,
 the USA has lacked the capacity to deal with a sudden influx of the sick in medical facilities . The
 shortage of essential supplies, including ventilators, ICU beds, and personal protective equipment
 (PPE), has been acute and undersupplied to medical workers during the current pandemic
 (Timmis & Brüssow, 2020). Such scarcities have led to bidding wars among governors in regions
 where high numbers of cases have been noted (Solomon, Wynia, & Gostin, 2020). Economic
 impacts have been severe, and according to the Bureau of Labor Statistics, 17.8 million people
 were unemployed in June 2020. Unemployment benefits have been held up for many, pushing
 many service workers into working jobs deemed essential while risking their lives through
 exposure without proper protective equipment (Cohen & Hsu, 2020).

 Federal, state, and local government responses to the pandemic have been mixed. Centers for
 Disease Control and Prevention (CDC) and Dr. Fauci (the Director of the National Institute of
 Allergy and Infectious Diseases) have emphasized the importance of containment measures
 (social distancing, mask-wearing, hand washing) in dealing with the spread of the virus. However,
 the enactment of containment measures has varied widely from place to place. Partisan politics
 has created divisions in public discourse and affected the use of containment measures. These
 mixed messages from the government have created uncertainties in the mind of the public. Such
 uncertainties have been further amplified by the spread of disinformation through social media
 regarding the nature of the disease and the effectiveness of containment measures.

 The deluge of false information distributed through social media has been described as an
 “infodemic” (Kulkarni, Prabhu, and Ramraj 2020). This is particularly concerning in the USA where
 68% of public adults have reported receiving news through social media (Singh et al. 2020). A
 primary concern in the face of Covid-19 mitigation efforts is social unrest caused by the perceived
 loss of liberties arising from quarantine and shelter in place orders (Timmis & Brüssow, 2020).
 Relational theorists Kasapoglu and Akbal (2020) framed COVID-19 in terms of 'uncertainties' in
 social relations. Such uncertainties are fueled by fear caused by political, social, and economic
 anxieties, creating a 'moral panic' (ibid). Misinformation circulated through social media
 contributes significantly to such 'moral panic.' Existential fears of illness and death catastrophize
 thinking, further destabilizing existing social-relational structures. It is, therefore, crucial for us to
 examine misinformation in social media so that appropriate steps can be taken.

 3
Preprints (www.preprints.org) | NOT PEER-REVIEWED | Posted: 10 September 2020 doi:10.20944/preprints202009.0213.v1

 Our research focuses on the impact of misinformation spread through Twitter, as “59% of Twitter
 users have reported it as good or extremely good in sharing preventive health information”
 (Singh et al. 2020, 2). Findings from past scholarly studies have informed our research, and we
 highlight those that are most pertinent. While examining the spread of true and false news
 stories through Twitter, Vosoughi et al. (2018) found that falsehood diffuses significantly farther,
 faster, deeper, and more broadly than the truth. The novelty element of false news generates
 greater public interest over truthful news accounts; consequently, false news is rapidly spread as
 people are more likely to share novel information (Vosoughi et al., 2018). Yang et al. (2020)
 studied the extents of links to low credibility information on Twitter during the pandemic and
 contend that the combined volume of tweets linking to low-credibility information is comparable
 to the volume of New York Times articles and CDC links. The nature of tweets related to COVID-
 19 has been examined by Abd-Alrazaq et al. (2020). They identified 12 main topics grouped into
 four main themes: the origin of the virus, its sources, its impact on people, countries, and the
 economy; and ways of mitigating the risk of infection. Budhwani and Sun (2020) conducted
 research on Twitter activities to assess the prevalence and frequency of the phrases "Chinese
 virus" and "China virus." They found a rise in such tweets, which suggests that knowledge
 translation is likely occurring online, and COVID-19 stigma is likely being perpetuated on Twitter.
 Singh et al. (2020) note that a strong spatiotemporal relationship exists between Twitter
 information flow and new cases of COVID-19 and Twitter conversations led COVID-19 cases by 2-
 3 days. Bastani and Bahrami (2020) conducted a qualitative study on COVID-19 related
 misinformation in social media in Iran. They concluded that cultural factors, high information
 demand, the prevalence of social media, and inadequate legal supervision of online content are
 key to misinformation dissemination. Kouzy et al. (2020) examined a sample of 673 tweets to
 understand the impacts of misinformation on public health. Their findings indicate that medical
 misinformation about the COVID-19 epidemic is being propagated at an alarming rate on social
 media. Brennen et al. (2020) note that prominent public figures play a significant role in spreading
 misinformation about COVID-19 and that there are significant motivations behind such activities.
 It is imperative that trusted fact-checkers, social media activists, and media organizations
 continue to hold prominent figures to account for claims they make on social media. Pennycook
 et al. (2020) suggest that social bots are more likely to be involved in posting and amplifying low-
 credibility information. Future research is necessary to investigate the impacts of disinformation
 spread by social bots upon COVID-19 incidence rates at the state and county level.

 3. Data and Methodology
 This research utilized multiple data sets such as Twitter data, demographic data , and data on
 Coronavirus related illness and death. We used the Twitter Streaming API for data collection, as
 it enables the collection of data using tweets texts, hashtags, user information, and location. To
 gather tweets based on selected hashtags related to COVID-19, we used the Tweepy API
 (Roesslein, 2009). Based on appropriate keywords and hashtags, we collected all geotagged
 tweets written in the English language from May 1st to May 31st, 2020. We filtered the data by
 using trending hashtags such as “corona”, "coronavirus", "COVID", "pandemic", "lockdown",
 "quarantine", "hand sanitizer", "ppe", "n95", "sarscov2", "nCov", "COVID-19", "ncov2019",
 "2019ncov", "flatteningthecurve", "social distancing", "workfromhome" and the respective

 4
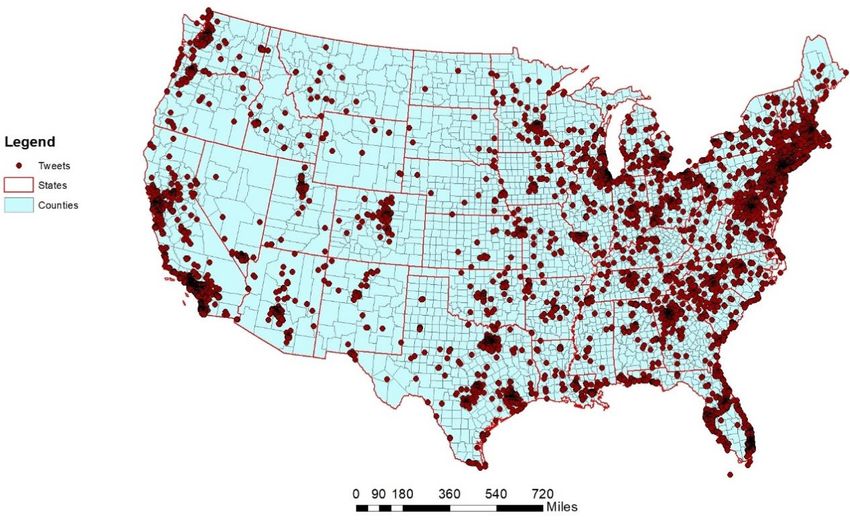
Preprints (www.preprints.org) | NOT PEER-REVIEWED | Posted: 10 September 2020 doi:10.20944/preprints202009.0213.v1

 hashtag of all these keywords using filter: language "English,". We collected 52,362 geotagged
 tweets in total, out of which we extracted all COVID-19 related tweets. These 24,505 tweets
 were next mapped and analyzed. The following figure (Figure. 1) shows the distribution of
 geotagged tweets throughout the conterminous USA.

 Figure 1: Distribution of Covid-19 related tweets in May 2020, throughout conterminous United States

 The following table (Table 1) shows the top ten counties in terms of the number of COVID-19
 related geotagged tweets in May.

 Table 1: top ten counties with the highest number of COVID-19 related geotagged tweets in May

 No. of
 No. of confirmed
 No. of geotagged confirmed
 County State cases as of May
 tweets in May deaths as of
 31st
 May 31st

 Los Angeles California 2017 54996 54

 New York New York 1940 26653 129

 District of District of
 656 8801 11
 Columbia Columbia

 5
Preprints (www.preprints.org) | NOT PEER-REVIEWED | Posted: 10 September 2020 doi:10.20944/preprints202009.0213.v1

 Fulton Georgia 496 4524 18

 Queens New York 464 61975 376

 Cook Illinois 456 77925 61

 Kings New York 443 55900 261

 Harris Texas 409 12220 4

 Travis Texas 395 3232 1

 Miami-Dade Florida 376 18000 7

 We obtained demographic data from the U.S. Census Bureau and COVID-19 data at the county
 level from USAFacts (usafacts.org). Next, we computed and joined case numbers to the
 administrative boundary shapefile of counties obtained from the TIGER/ Line databa se
 (www.census.gov) using ArcGIS Desktop 10.7. We then conducted spatial modeling and discourse
 analysis.

 Spatial models are critical tools that statistically investigate the geographic
 relationship/correlation between several explanatory variables and disease outbreak, such as
 COVID-19 (Watkins et al., 2007; Wang et al., 2010, Dom et al., 2012). Partial distance correlation
 was used to examine the correlation between social media activity (number of tweets) and the
 COVID-19 incidence rate. Next, we selected Multiscale Geographically Weighted Regression
 (MGWR) as our spatial modeling tool, as it has the ability to explain spatial variability at multiple
 scales and is capable of explaining COVID-19 variation (Mollalo et all. 2020). Through MGWR, we
 investigated the relationship between the potential explanatory variables (counties ' number of
 tweets and population) and the dependent variable (COVID-19 incidence number per county).
 Lastly, we conducted discourse analysis on the tweets where an index was assigned to each tweet
 to examine sentiments and concern about the virus if the tweet is for or against containment
 measures, and what could be the motivation of the user based on content, as well as the textual
 content itself.

 3.1. Partial Distance Correlation

 Distance correlation is a measure of dependence between random vectors. The population
 distance correlation coefficient is zero if and only if the random vectors are independent.
 Therefore, distance correlation measures both linear and nonlinear correlation between two
 random variables. This contrasts with Pearson's correlation, which can only detect the linear
 association between two random variables (Székely et al., 2007). Partial distance correlation

 6
Preprints (www.preprints.org) | NOT PEER-REVIEWED | Posted: 10 September 2020 doi:10.20944/preprints202009.0213.v1

 measures the correlation between two random variables, while the effect of a set of controlling
 random variables is eliminated (Székely and Rizzo, 2014). In this study, we calculated the partial
 distance correlation coefficient between two variables: number of tweets and the number of
 confirmed cases, while the effect of a controlling random variable population is removed to
 investigate both linear and nonlinear correlation between these variables.

 3.2. Multiscale Geographically Weighted Regression

 Brunsdon et al. (1996) introduced Geographically Weighted Regression (GWR) as an extension of
 global traditional regression models to allow for spatially varying variables so that variables can
 be derived for each location separately. By allowing effects to vary over space, GWR can model
 spatial heterogeneity; however, analyzing these relationships at different scales is not possible
 (Fotheringham et al., 2003, Oshan et al., 2019). Multiscale Geographically Weighted Regression
 (MGWR) is an extension of GWR that dramatically improves the efficiency of estimation routines
 and explicitly focuses on the multiscale analysis of spatial heterogeneity (Oshan et al., 2019).
 MGWR explores geographically varying relationships between dependent/response variables
 and independent/explanatory variables. MGWR can be calculated in the following manner
 (Fotheringham et al., 2017):

 = ∑ + , = 1,2, … ,
 =0

 Where at county i, yi is the number COVID-19 cases, Xij is the vector of explanatory variables
 (number of tweets and population), βbwj is the bandwidth used for calibration of the jth
 relationship, and εi is a random error term (Fotheringham et al., 2017).

 We used the MGWR V 2.2.1 as our modeling tool (https://sgsup.asu.edu/sparc/multiscale-gwr).
 An (adaptive) bi-square kernel, which removes the effect of observations outside the
 neighborhood specified with the bandwidth and (minimized) corrected Akaike Information
 Criterion (AICc), was used to select optimal bandwidth (Oshan et al., 2019).

 3.3. Discourse analysis

 Twitter's voluminous dataset of tweets and hashtags has popularized its use for quantitative and
 big data analysis (Zimbra et al., 2018). However, different user groups have different social norms

 7
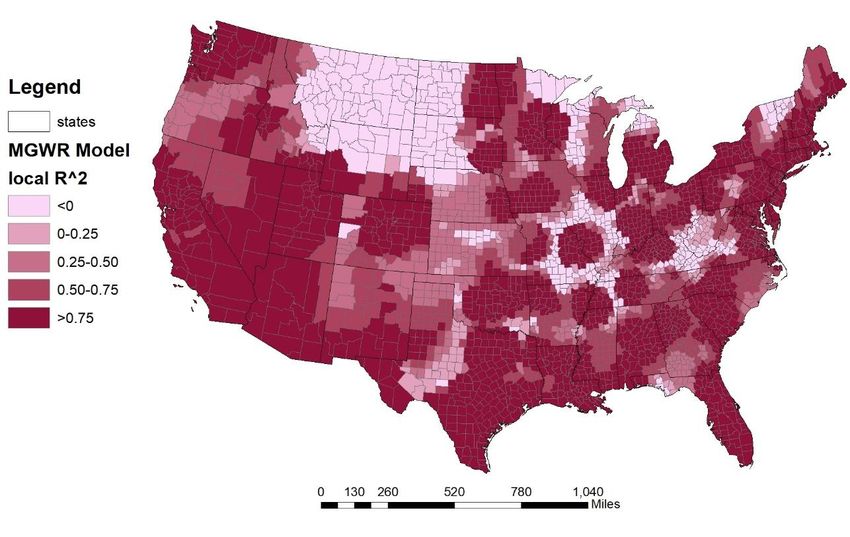
Preprints (www.preprints.org) | NOT PEER-REVIEWED | Posted: 10 September 2020 doi:10.20944/preprints202009.0213.v1

 and idioms of practice (Gershon, 2010). Generalizations made about one hashtag, tweet text, or
 network of users may not apply to another (Marwick, 2014). Qualitative research allows scholars
 to analyze the practices of a specific user group and to conduct textual analysis or discourse
 analysis of individual tweets. We used discourse analysis to examine 24,505 geotagged tweets to
 identify tweets that downplayed COVID-19, showed resistance toward safety measures,
 disseminated COVID-19 conspiracy theories, and propagated disinformation.

 4. Results and Discussion
 Partial distance correlation measures association between two random variables with respect to
 a third random variable, analogous to, but more general than (linear) partial correlation (Székely
 and Rizzo, 2016). In this study, we calculate the partial distance correlation between COVID-19
 twitter activity and the number of confirmed cases in May 2020 while controlling the effect of
 the population as a third variable. In the next table (Table 2), estimated distance correlation
 between variables and estimated Partial distance correlation between COVID-19 twitter activity
 and the number of confirmed cases in May 2020 are presented. It can be inferred that there is a
 positive association (0.27) between the number of tweets per county and the number of cases,
 which means the higher the number of confirmed COVID-19 cases in a county, the more
 geotagged COVID-19 tweets originate in that county.

 Table 2: Partial Distance Correlation Coefficients

 Partial distance correlation between the number of tweets and the number of confirmed
 cases, controlling the effect of population 0.267322

 distance correlation between the number of tweets and population 0.8156

 distance correlation between the number of tweets and the number of confirmed cases 0.7378

 distance correlation between the number of confirmed cases and population 0.7878

 Multiscale Geographically weighted regression (MGWR) was employed to investigate the
 relationship between the explanatory variables: total number of tweets per county, and county
 population and the dependent variable: COVID-19 number of confirmed cases per county.
 MGWR model obtained the high adjusted R2 (0.962), indicating that the model could explain
 96.7% of the total variations of COVID-19 incidence rates.

 Figure 2 illustrates the spatial distributions of local R 2 values in the MGWR model. Several
 counties in Florida, California, the Tristate area, Texas, Michigan, and Louisiana show very high
 local R2, indicating a strong performance of the model in those counties. In contrast, the local R2
 values were low in most of the counties in Montana, North Dakota, South Dakota, part of

 8
Preprints (www.preprints.org) | NOT PEER-REVIEWED | Posted: 10 September 2020 doi:10.20944/preprints202009.0213.v1

 Wyoming, Kansas, and West Virginia, indicating a poor performance of the model across these
 counties.

 Figure 2: Distribution of MGWR local R^2

 The findings provide explanations for the high variability of the disease incidence in the
 continental United States. Our findings indicate that there is a high correlation between COVID-
 19 cases and Twitter conversations in line with Singh et al. (2020). Continued monitoring of social
 media activity can assist in understanding the dynamics of disease spread. However, the
 predictive ability of the model is somewhat limited by the granularity of the data. The finest
 spatial granularity at which nationwide COVID-19 data is provided is at the county-level.
 Therefore, it is difficult to make inferences at the sub-county and individual levels accurately.

 To examine the possible association between spatial patterns of social media discussions and the
 COVID-19 incidence rate, we created a dataset of all geotagged Covid-19 related tweets (24,505
 tweets). Through content analysis, we examined the nature of each tweet and assigned an index.
 Out of 24,505 tweets, 476 tweets contained sentiments that we identified as negative – these
 downplayed the severity of COVID-19, propagated conspiracy theories, and disseminated false
 news/facts about COVID-19. We also examined hashtags used in these tweets. Besides the
 #covidiot, which has been used by both indexed and unindexed tweets, the most popular
 hashtags used by indexed tweets against containment measures, downplaying the virus, or
 disseminate disinformation is presented in the following table (Table 3).

 9
Preprints (www.preprints.org) | NOT PEER-REVIEWED | Posted: 10 September 2020 doi:10.20944/preprints202009.0213.v1

 Table 3: Table 34: the most popular hashtags among tweets sharing disinformation

 Plandemic CovidPropaganda NoMask

 EndTheShutdown DefundTheFDA MaskFree

 BiologicalWarfere HealthFreedom Scamdemic

 DontStayAtHome GovernmentControl CoronaBS

 Below we provide some examples of tweets using these hashtags:

 “More tyranny from Dr Fauci. #Covid #EndTheShutdown Where are the lawyers when you need
 them?”, “Welp, add another casualty to the Plandemic, sweettomatoes / soup plantation is
 officially done for. They are closing all locations permanently. They are closing all 97 locations
 permanently in wake of the Corona”

 “REVOLUTION -Careful- this dangerous - true and proven research will GET you banned and
 censored from every social media platform: After studying global data from the novel Coronavirus
 (COVID-19) pandemic, researchers have discovered a strong correlation between severe vitamin
 D deficiency and mortality rates. #healthmediastar #immunity #healthmedia #healthygut
 #healthygirl #healthyvegan #veganlifestyle #veganinspiration #naturopath
 #naturopathicrevolution #vitamnind #lockdownlife #lockdown2020 #quantum”

 “Lies they tell??? #lies #covid19 #governmentcontrol #riotworldwide #raisethefire
 #conjuredhoodoo #nlhealngtempal”.

 Tweets containing such hashtags primarily originated from Orlando, FL, Dallas, TX, Palm Beach,
 FL, Houston, TX, Los Angeles, CA, and Watchung, NJ. The cities with the highest use of these
 hashtags in May are located in Texas, Florida, and California, which experienced massive surges
 in COVID-19 cases in July and are emerging as the epicenters of pandemic after reporting record
 numbers of new confirmed cases for weeks in a row (Hawkins et al., 2020).

 10
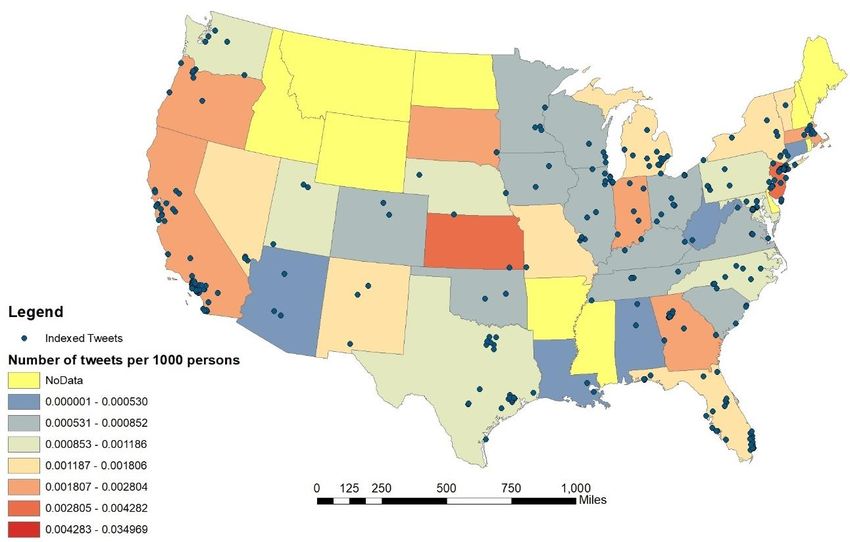
Preprints (www.preprints.org) | NOT PEER-REVIEWED | Posted: 10 September 2020 doi:10.20944/preprints202009.0213.v1

 Brennen et al. (2020) note that disinformation about COVID-19 comes in different forms, from
 various sources, and makes different claims; about 59% of the disinformation in their sample
 dataset involved various forms of reconfiguration of true information, and about 38% of it was
 completely fabricated. Based on our content analysis, we categorized all indexed tweets into two
 groups: those that provide disinformation and those that downplay the severity of the virus. The
 first category includes 45.33% of tweets – these propagate false information about the
 effectiveness of containment measures such as the use of hand sanitizer, use of face masks.
 These tweets include claims that religious adherence is enough as God will protect His followers,
 or that alcohol consumption is sufficient for COVID-19 prevention. Tweets also contend that the
 COVID-19 pandemic is a worldwide hoax created by governments to control people or limit their
 freedom. Such tweets are proponents of conspiracy theories that identify COVID-19 as a bio-
 engineered virus or biological weapon. Two examples below illustrate the nature of these tweets:

 “This came from the CDC website. The 65k deaths claimed to b from Coronavirus is wrong. The
 actual death number is 11k. So the lockdown everyone is suffering from is based on lies”

 “I had COVID without symptoms. I have IgG antibodies, I have no virus. Immunoglobulin G
 provided immunity that can help others. #sars #coronavirus #covidart #covidfitness #recovered
 #sarscov2 @ Williamsburg, Brooklyn”

 The second category includes 55.64% of tweets that downplayed the severity of Coronavirus, the
 process of transmission and lifetime of the virus. Two examples of these tweets are:

 “Not letting the Covid Communists stop me from seeing my friends and having a good time. Don't
 be afraid to have a good time. :) @ Los Angeles, California”

 “I come back the covid didn't kill me... à West Hollywood, California”

 Next, we computed the numbers of indexed tweets per county and state. Figure 3 shows the
 distribution of indexed tweets and the number of indexed tweets per 1000 persons in each state
 throughout the conterminous USA.

 11
Preprints (www.preprints.org) | NOT PEER-REVIEWED | Posted: 10 September 2020 doi:10.20944/preprints202009.0213.v1

 Figure 3: States number of indexed tweets per 1000 persons

 Table 4 shows the list of states with the highest number of indexed tweets per 1000 persons .

 Table 4: States with the highest number of tweets sharing disinformation per capita

 Indexed tweets Downplaying Disinformation
 Rank State
 per 1000 persons

 District of 37.50% 62.50%
 1 34.97
 Columbia

 2 New Jersey 4.28 48.94% 51.06%

 3 Kansas 4.13 73.33% 26.67%

 4 Oregon 2.80 50.00% 50.00%

 5 California 2.57 59.05% 40.95%

 12
Preprints (www.preprints.org) | NOT PEER-REVIEWED | Posted: 10 September 2020 doi:10.20944/preprints202009.0213.v1

 6 South Dakota 2.37 50.00% 50.00%

 7 Georgia 2.00 60.87% 39.13%

 8 Indiana 1.98 33.33% 66.67%

 9 Massachusetts 1.95 50.00% 50.00%

 10 Florida 1.8 57.14% 42.86%

 It is notable that five of these top 10 states - Kansas, Oregon, California, Georgia, and Florida-
 have experienced a massive surge in their known COVID-19 cases as of mid-July (Hawkins et al.,
 2020). Our Twitter discourse analysis findings show that resistance to containment measures and
 lack of public awareness bear a significant impact on the patterns of illness and death during the
 pandemic. The relatively strong association between the number of indexed tweets and the
 number of cases per capita supports the notion that the sites of disinformation are now
 experiencing a higher surge of COVID 19 cases. Dowd et al. (2020) emphasized the importance of
 considering population dynamics and demographic data to mitigate the approaches to combat
 the pandemic. A strong relationship between population, social media activity, and COVID-19
 incidence rates, as our results suggest, highlights the importance of social media monitoring
 during the COVID-19 pandemic.

 Next, we examined the data at the county level to identify the top ten counties with the highest
 number of indexed tweets per capita. These are Norton (Kansas), Montgomery (Kansas),
 Hamilton (New York), Box Butte (Nebraska), Martin (Kentucky), Poquoson (Virginia), Green Lake
 (Wisconsin), Okmulgee (Oklahoma), Ogemaw (Michigan), and Bremer, (Iowa). The number of
 COVID-19 cases from May to early July have almost doubled (1.88 times) in these counties as
 well.

 To examine the demographic context behind such tweets, we used census data in conjunction
 with our geolocated Twitter data set. Table 5 summarizes the key demographic characteristics
 of the residents in these counties (www.data.census.gov).

 Table 5: Counties with the highest number of tweets sharing disinformation per capita

 Obtained Below
 Median
 Population White Median Bachelor’s poverty Unemployment
 Rank County State income
 per SQMI (%) age degree or level rate
 (dollars)
 higher (%)

 13
Preprints (www.preprints.org) | NOT PEER-REVIEWED | Posted: 10 September 2020 doi:10.20944/preprints202009.0213.v1

 1 Norton Kansas 6.50 92.97% 43.30 11.04% 12.70 1.20 49891

 2 Montgomery Kansas 53.70 84.45% 39.90 11.57% 18.30 5.50 45173

 3 Hamilton New York 2.60 99.68% 51.10 14.43% 6.90 8.00 57552

 4 Box Butte Nebraska 10.60 88.75% 41.30 11.92% 11.90 5.20 56412

 5 Poquoson Virginia 788.90 94.09% 43.30 29.37% 4.50 5.30 96831

 6 Martin Kentucky 55.80 92.28% 37.20 5.54% 26.30 13.70 35125

 7 Green Lake Wisconsin 50.00 96.94% 44.40 13.47% 11.10 2.80 53260

 8 Okmulgee Oklahoma 56.80 66.14% 38.80 9.13% 20.00 9.50 42175

 9 Ogemaw Michigan 37.70 97.36% 47.50 8.74% 16.90 8.00 40150

 10 Bremer Iowa 56.90 94.41% 39.30 19.81% 8.20 3.20 68023

 The demographic data associated with the geotagged tweets indicate following characteristics:
 The Twitter users are predominantly white (91% on average) and relatively middle-aged
 (average median age is 42 years old), middle-income (average median income is 54,459) and just
 about 14% of the population 25 years old and over have obtained a Bachelor's degree or higher.
 Most of these counties are categorized as rural with extremely low population density (Office of
 Rural Health Policy, 2015). Voting patterns from 2016 indicate a conservative mindset, as, on
 average, 70.74% of the population voted for the GOP party (Presidential Election Results: Donald
 J. Trump Wins, 2016).

 Lower educational attainment may be a contributing factor in the spread of disinformation. A
 lack of understanding of epidemiology and scientific medical research can lead to a rejection of
 scientific knowledge. Low population density can lead to feelings of isolation, which can be
 mitigated through social media participation. The desire to gain followings by spreading novel
 and sensationalistic information is also likely a contributing factor behind such Twitter activities.
 This is particularly damaging as many rural counties either have no intensive care units in their
 hospitals or no hospitals at all (Ajilore, 2020). Finally, partisan politics may have shaped the
 attitude of Twitter users. The relationship between Twitter activities that provide
 disinformation/downplay the significance of the virus has , in turn, affected the spread of COVID-
 19 (Singh et al. 2020). Therefore, it is imperative to raise public awareness of scientific
 knowledge and block fake remedies, myths, and false news about COVID-19.

 The impact of the digital divide on lack of public awareness must also be considered. During a
 pandemic, health officials rely on the Internet and social media sites (and other digital platforms)

 14
Preprints (www.preprints.org) | NOT PEER-REVIEWED | Posted: 10 September 2020 doi:10.20944/preprints202009.0213.v1

 to communicate vital information to the public. However, the effectiveness of
 these digital channels depends on whether individuals have access to it. Thus, concerns have
 been raised about the digital divide, information quality, and biases (Oh et al., 2010; Goodchild
 and Li, 2012), as well as source credibility (Ostermann and Spinsanti 2011). Recent literature
 suggests certain groups (i.e., low income, low education, and elderly populations) may lack the
 resources, skills, and motivations to access social media, and therefore, they may be less likely to
 post relevant information through social media (Xiao & Huang 2015). Sui et al. (2013) report that
 two-thirds of humanity does not have access to the rapidly expanding digital world. Therefore,
 we must recognize that user-generated data will provide only selective representations of any
 issue and that there will always be people and communities that are missing from the map (Zook
 et al. 2010; Burns 2015; Meier 2012; Ziemke 2012). Therefore, this study's result should be seen
 not as reflections of on-the-ground conditions but instead as a representational negotiation
 rooted in spatial inequalities. The impacts of the digital divide upon social media usage are
 beyond the scope of this paper but should be considered in future research.

 5. Conclusion
 Social media conversations have a significant impact upon public perception of COVID-19. Spatial
 modeling through MGWR explains 96.2% of the variability in the number of known COVID-19
 cases in each county (based on twitter activity and population), suggesting a strong association
 between these variables. Therefore, in the absence of other reliable indicators, analysis of Twitter
 conversations can help predict the spread and outbreak of COVID-19. Our research findings show
 how much, where, and how people are communicating about the COVID-19 pandemic. As the
 pandemic continues to impact people on a personal level, COVID-19 related tweets will continue
 to increase, since people tend to care about the news that affects them personally (Singh et al.,
 2020). Likewise, falsehood diffuses significantly farther, faster, deeper, and more broadly than
 the truth (Vosoughi et al., 2018), and it is imperative that we examine disinformation among
 those who are most impacted. Findings from our discourse analysis suggest that the five states
 of Kansas, Oregon, California, Georgia, and Florida, where people downplayed COVID-19 and
 propagated disinformation in May, have experienced a massive surge in their known COVID-19
 cases as of early July. Our findings highlight the substantial impact of disinformation and
 resistance to containment measures on the patterns of illness and death during the pandemic.
 However, our study has several limitations. First, the decision to examine only geotagged tweets
 meant that we examined only a subsection of all tweets. Second, our findings are constrained
 by data granularity issues. Third, our findings are shaped by the impacts of the digital divide,
 which create data gaps. We aim to address these limitations in future research. Meanwhile,
 social media narratives containing misinformation and disinformation on disease spread have a
 significant impact upon public awareness. A sustained and coordinated effort by fact-checkers,
 social media platforms, independent media, news agencies, and public authorities is needed to
 control the spread of disinformation about COVID-19, so that scientific information is effectively
 communicated, and public awareness of the pandemic is raised.

 15
Preprints (www.preprints.org) | NOT PEER-REVIEWED | Posted: 10 September 2020 doi:10.20944/preprints202009.0213.v1

 6. Acknowledgment:
 We would like to thank anonymous reviewers for taking the time and effort to review the
 manuscript. Amir Masoud Forati would like to thank Rachel Hansen, Kimberly Singer, Shayan
 Haseli, Hamed Saadabadi, and Mousa Javidi Alsaadi for their contribution to discourse analysis
 and their help. This research did not receive any specific grant from funding agencies in the
 public, commercial, or not-for-profit sectors.

 16
Preprints (www.preprints.org) | NOT PEER-REVIEWED | Posted: 10 September 2020 doi:10.20944/preprints202009.0213.v1

 7. Reference:
 Abd-Alrazaq, A., Alhuwail, D., Househ, M., Hamdi, M., & Shah, Z. (2020). Top concerns of tweeters
 during the COVID-19 pandemic: infoveillance study. Journal of medical Internet research, 22(4),
 e19016. https://doi.org/10.2196/19016

 Ajilore, O. (2020, July 17th). Rural America Is Starting To Feel the Impact of the Coronavirus.
 Retrieved from center for American progress:
 https://www.americanprogress.org/issues/economy/reports/2020/04/28/484016/rural-
 america-starting-feel-impact-coronavirus/

 Bastani, P., & Bahrami, M. A. (2020). COVID-19 Related Disinformation on Social Media: A
 Qualitative Study from Iran. Journal of medical Internet research. https://doi.org/10.2196/18932

 Brennen, J. S., Simon, F. M., Howard, P. N., & Nielsen, R. K. (2020). Types, sources, and claims of
 Covid-19 disinformation. Reuters Institute.

 Brunsdon, C., Fotheringham, A. S., & Charlton, M. E. (1996). Geographically weighted regression:
 a method for exploring spatial nonstationarity. Geographical analysis, 28(4), 281-298.
 https://doi.org/10.1111/j.1538-4632.1996.tb00936.x

 Budhwani, H., & Sun, R. (2020). Creating COVID-19 Stigma by Referencing the Novel Coronavirus
 as the "Chinese virus" on Twitter: Quantitative Analysis of Social Media Data. Journal of Medical
 Internet Research, 22(5), e19301. https://doi.org/10.2196/19301

 Burns, R. (2015). Rethinking big data in digital humanitarianism: Practices, epistemologies, and
 social relations. GeoJournal, 80(4), 477-490. https://doi.org/10.1007/s10708-014-9599-x

 Cao, G., Wang, S., Hwang, M., Padmanabhan, A., Zhang, Z., & Soltani, K. (2015). A scalable
 framework for spatiotemporal analysis of location-based social media data. Computers,
 Environment and Urban Systems, 51, 70-82.
 https://doi.org/10.1016/j.compenvurbsys.2015.01.002

 Cohen, P., & Hsu, T. (2020, May 14th). 'Rolling Shock' as Job Losses Mount Even With Reopenings.
 The New York Times. Retrieved from
 https://www.nytimes.com/2020/05/14/business/economy/coronavirus -unemployment-
 claims.html

 Dom, N. C., Latif, Z. A., Ahmad, A. H., Ismail, R., & Pradhan, B. (2012). Manifestation of GIS Tools
 for Spatial Pattern Distribution Analysis of Dengue Fever Epidemic in the City of Subang Jaya,
 Malaysia. EnvironmentAsia, 5(2).

 Dowd, J. B., Andriano, L., Brazel, D. M., Rotondi, V., Block, P., Ding, X., ... & Mills, M. C. (2020).
 Demographic science aids in understanding the spread and fatality rates of COVID-19.

 17
Preprints (www.preprints.org) | NOT PEER-REVIEWED | Posted: 10 September 2020 doi:10.20944/preprints202009.0213.v1

 Proceedings of the National Academy of Sciences, 117(18), 9696-9698.
 https://doi.org/10.1073/pnas.2004911117

 Fotheringham, A. S., Brunsdon, C., & Charlton, M. (2003). Geographically weighted regression:
 the analysis of spatially varying relationships. John Wiley & Sons.

 Fotheringham, A. S., Yang, W., & Kang, W. (2017). Multiscale geographically weighted regression
 (MGWR). Annals of the American Association of Geographers, 107(6), 1247-1265.
 https://doi.org/10.1080/24694452.2017.1352480

 Gershon, I. (2010). The breakup 2.0: Disconnecting over new media. Cornell University Press.

 Goodchild, M. F., & Li, L. (2012). Assuring the quality of volunteered geographic information.
 Spatial statistics, 1, 110-120. https://doi.org/10.1016/j.spasta.2012.03.002

 Harvey, D. (2020, March 20th). Anti-Capitalist Politics in the Time of COVID-19. Retrieved from
 https://jacobinmag.com/2020/03/david-harvey-coronavirus-political-economy-disruptions

 Hawkins, Birnbaum, Kornfield, O'Grady, Copeland, Iati and Sonmez, Arizona, (2020) Florida, Texas
 are latest coronavirus epicenters, the washoington post retrieved from:
 https://www.washingtonpost.com/nation/2020/06/28/coronavirus -live-updates-us/

 Holshue, M. L., DeBolt, C., Lindquist, S., Lofy, K. H., Wiesman, J., Bruce, H., ... & Diaz, G. (2020).
 First case of 2019 novel coronavirus in the United States. New England Journal of Medicine.
 https://www.nejm.org/doi/full/10.1056/NEJMoa2001191

 Kasapoglu, A., & Akbal, A. (2020). Relational Sociological Analysis of Uncertainti es: The case of
 COVID-19 In Turkey. Advances in Social Sciences Research Journal, 7(4), 197-228.
 https://doi.org/10.14738/assrj.74.8116

 Kouzy, R., Abi Jaoude, J., Kraitem, A., El Alam, M. B., Karam, B., Adib, E., ... & Baddour, K. (2020).
 Coronavirus goes viral: quantifying the COVID-19 disinformation epidemic on Twitter. Cureus,
 12(3). https://dx.doi.org/10.7759%2Fcureus.7255

 Kulkarni, P., Prabhu, S., & Ramraj, B. (2020). COVID-19-Infodemic overtaking pandemic? Time to
 disseminate facts over fear. Indian Journal of Community Health, 32(2).

 Linton, N. M., Kobayashi, T., Yang, Y., Hayashi, K., Akhmetzhanov, A. R., Jung, S.-M., … Nishiura,
 H. (2020). Incubation Period and Other Epidemiological Characteristics of 2019 Novel Coronavirus
 Infections with Right Truncation: A Statistical Analysis of Publicly Available Case Data. Journal of
 Clinical Medicine, 9(2). doi: 10.1101/2020.01.26.20018754

 Marwick, A. E. (2014). Ethnographic and qualitative research on Twitter. Twitter and society, 89,
 109-121.

 18
Preprints (www.preprints.org) | NOT PEER-REVIEWED | Posted: 10 September 2020 doi:10.20944/preprints202009.0213.v1

 Meier, P. (2012). Crisis mapping in action: How open-source software and global volunteer
 networks are changing the world, one map at a time. Journal of Map & Geography Libraries, 8(2),
 89-100. https://doi.org/10.1080/15420353.2012.663739

 Mollalo, A., Vahedi, B., & Rivera, K. M. (2020). GIS-based spatial modeling of COVID-19 incidence
 rate in the continental United States. Science of The Total Environment, 138884.
 https://doi.org/10.1016/j.scitotenv.2020.138884

 Office of Rural Health Policy. (2015). List of Rural Counties and Designated Eligible Census Tracts
 in Metropolitan Counties: Updated Census 2010.

 Oh, O.; Kwon, K.H.; Rao, H.R. An exploration of social media in extreme events: Rumor theory
 and twitter during the Haiti Earthquake 2010. In Proceedings of the 2010 ICIS, Saint Louis, MO,
 USA, 10–20 August 2010.

 Oshan, T. M., Li, Z., Kang, W., Wolf, L. J., & Fotheringham, S. (2019). MGWR: A python
 implementation of multiscale geographically weighted regression for investigating process
 spatial heterogeneity and scale. ISPRS International Journal of Geo-Information, 8(6), [269].
 https://doi.org/10.3390/ijgi8060269

 Ostermann, F. O., & Spinsanti, L. (2011, April). A conceptual workflow for automatically assessing
 the quality of volunteered geographic information for crisis management. In Proceedings of
 AGILE (Vol. 2011, pp. 1-6).

 Pennycook, G., McPhetres, J., Zhang, Y., Lu, J. G., & Rand, D. G. (2020). Fighting COVID-19
 Disinformation on Social Media: Experimental Evidence for a Scalable Accuracy-Nudge
 Intervention. Psychological Science. https://doi.org/10.1177%2F0956797620939054.

 Presidential Election Results: Donald J. Trump Wins (2016), the new York times, Retrieved from:
 https://www.nytimes.com/elections/2016/results/president

 Roesslein, J. Tweepy Documentation. 2009. Available online: http://docs.tweepy.org/en/v3.5.0/
 (accessed on February 26th, 2020).

 Shaw, S. L., Tsou, M. H., & Ye, X. (2016). Human dynamics in the mobile and big data era.
 International Journal of Geographical Information Science, 30(9), 1687-1693.
 https://doi.org/10.1080/13658816.2016.1164317

 Singh, L., Bansal, S., Bode, L., Budak, C., Chi, G., Kawintiranon, K., ... & Wang, Y. (2020). A first look
 at COVID-19 information and disinformation sharing on Twitter. arXiv preprint arXiv:2003.13907.

 Solomon, M. Z., Wynia, M., & Gostin, L. O. (2020). Scarcity in the Covid‐19 Pandemic. Hastings
 Center Report, 50(2), 3-3. https://doi.org/10.1002/hast.1093

 19
Preprints (www.preprints.org) | NOT PEER-REVIEWED | Posted: 10 September 2020 doi:10.20944/preprints202009.0213.v1

 Sui, D., & Goodchild, M. (2011). The convergence of GIS and social media: challenges for
 GIScience. International Journal of Geographical Information Science, 25(11), 1737-1748.
 https://doi.org/10.1080/13658816.2011.604636

 Sui, D., Goodchild, M., & Elwood, S. (2013). Volunteered geographic information, the exaflood,
 and the growing digital divide. In Crowdsourcing geographic knowledge (pp. 1-12). Springer,
 Dordrecht. https://doi.org/10.1007/978-94-007-4587-2_1

 Székely G.J., Rizzo M.L. (2016) Partial Distance Correlation. In: Cao R., González Manteiga W.,
 Romo J. (eds) Nonparametric Statistics. Springer Proceedings in Mathematics & Statistics, vol
 175. Springer, Cham. https://doi.org/10.1007/978-3-319-41582-6_13

 Székely, Gábor J.; Rizzo, Maria L. Partial distance correlation with methods for dissimilarities. Ann.
 Statist. 42 (2014), no. 6, 2382--2412. doi:10.1214/14-AOS1255.
 https://projecteuclid.org/euclid.aos/1413810731

 Székely, Gábor J.; Rizzo, Maria L.; Bakirov, Nail K. Measuring and testing dependence by
 correlation of distances. Ann. Statist. 35 (2007), no. 6, 2769--2794.
 doi:10.1214/009053607000000505. https://projecteuclid.org/euclid.aos/1201012979

 Timmis, K., & Brüssow, H. (2020). The COVID‐19 pandemic: some lessons learned about crisis
 preparedness and management, and the need for international benchmarking to reduce deficits.
 Environmental Microbiology. https://dx.doi.org/10.1111%2F1462-2920.15029

 Tsou, M. H. (2015). Research challenges and opportunities in mapping social media and Big Data.
 Cartography and Geographic Information Science, 42(sup1), 70-74.
 https://doi.org/10.1080/15230406.2015.1059251

 Vosoughi, S., Roy, D., & Aral, S. (2018). The spread of true and false news online. Science,
 359(6380), 1146-1151. https://doi.org/10.1126/science.aap9559

 Wang, G., Minnis, R. B., Belant, J. L., & Wax, C. L. (2010). Dry weather induces outbreaks of human
 West Nile virus infections. BMC infectious diseases, 10(1), 38. https://doi.org/10.1186/1471 -
 2334-10-38

 Watkins, R. E., Eagleson, S., Beckett, S., Garner, G., Veenendaal, B., Wright, G., & Plant, A. J.
 (2007). Using GIS to create synthetic disease outbreaks. BMC Medical Informatics and Decision
 Making, 7(1), 1-14. https://doi.org/10.1186/1472-6947-7-4

 Xiao, Y., Huang, Q., & Wu, K. (2015). Understanding social media data for disaster management.
 Natural hazards, 79(3), 1663-1679. https://doi.org/10.1007/s11069-015-1918-0

 Xie, M., & Chen, Q. (2020). Insight into 2019 novel coronavirus — An updated interim review and
 lessons from SARS-CoV and MERS-CoV. International Journal of Infectious Diseases, 94, 119-124.
 doi:10.1016/j.ijid.2020.03.071

 20
Preprints (www.preprints.org) | NOT PEER-REVIEWED | Posted: 10 September 2020 doi:10.20944/preprints202009.0213.v1

 Yang, K. C., Torres-Lugo, C., & Menczer, F. (2020). Prevalence of low-credibility information on
 twitter during the covid-19 outbreak. arXiv preprint arXiv:2004.14484.

 Ziemke, J. (2012). Crisis mapping: The construction of a new interdisciplinary field?. Journal of
 Map & Geography Libraries, 8(2), 101-117. https://doi.org/10.1080/15420353.2012.662471

 Zimbra, D., Abbasi, A., Zeng, D., & Chen, H. (2018). The state-of-the-art in Twitter sentiment
 analysis: A review and benchmark evaluation. ACM Transactions on Management Information
 Systems (TMIS), 9(2), 1-29. https://doi.org/10.1145/3185045

 Zook, M., Graham, M., Shelton, T., & Gorman, S. (2010). Volunteered geographic information and
 crowdsourcing disaster relief: a case study of the Haitian earthquake. World Medical & Health
 Policy, 2(2), 7-33. https://doi.org/10.2202/1948-4682.1069

 21
You can also read