Assessment of Hydraulic Parameters and Protection Zones of Catchment Aquifers for Water Supply Network in Ndé Division, West-Cameroon Central ...
←
→
Page content transcription
If your browser does not render page correctly, please read the page content below
Journal of Water Resource and Protection, 2021, 13, 478-497
                                                                                               https://www.scirp.org/journal/jwarp
                                                                                                            ISSN Online: 1945-3108
                                                                                                              ISSN Print: 1945-3094

Assessment of Hydraulic Parameters and
Protection Zones of Catchment Aquifers for
Water Supply Network in Ndé Division,
West-Cameroon (Central Africa)

Roger Feumba*, Kemgang Dongmo Tchouta, Jean Ghislain Tabué Youmbi,
Valentin Yvan Emmanuel Mvondo, Depesquidoux I. Tchaptchet Tchato,
Benjamin Ngounou Ngatcha

University of Yaoundé I, Yaoundé, Cameroon

How to cite this paper: Feumba, R., Kem-        Abstract
gang Dongmo Tchouta, Tabué Youmbi, J.G.,
Mvondo, V.Y.E., Tchaptchet Tchato, D.I. and     Ndé Division in West-Cameroon is facing with water supply although many
Ngounou Nagtcha, B. (2021) Assessment of        attempts of restoring existing SCANWATER facilities by Bangangté Munici-
Hydraulic Parameters and Protection Zones       pality. In order to address the issue, we assess the exploitable pumping flow
of Catchment Aquifers for Water Supply
                                                rate of catchment aquifers and its hydraulic properties by using Jacob and
Network in Ndé Division, West-Cameroon
(Central Africa). Journal of Water Resource     Theis method, and define protection zones with Hoffman and Lillich method.
and Protection, 13, 478-497.                    It emerges that the hydraulic conductivity of aquifer is in the order of 10−4
https://doi.org/10.4236/jwarp.2021.137028       m/sec, transmissivity varies from 10−4 to 10−6 m2/sec. Aquifer pumping flow
                                                rate (Q) varies between 1.5 and 10.5 m3/h. In volcanic rocks, aquifer is more
Received: June 12, 2021
Accepted: July 13, 2021                         productive (4.5 ≤ Q ≤ 10.5 m3/h). Transfer time of pollutants to aquifer varies
Published: July 16, 2021                        from 3 to 56 days depending on rock-types and groundwater slope (0.03 -
                                                0.13 m/m). Furthermore, 113,624 m and 1123 m are radius to be imple-
Copyright © 2021 by author(s) and               mented for a better protection of groundwater against any form of pollutant.
Scientific Research Publishing Inc.
This work is licensed under the Creative
Commons Attribution International
                                                Keywords
License (CC BY 4.0).                            Pumping Tests, Aquifer Properties, Groundwater Protection, Ndé Division,
http://creativecommons.org/licenses/by/4.0/
                                                West-Cameroon (Central Africa)
                Open Access

                                              1. Introduction and Geological Background
                                              1.1. Introduction
                                              Groundwater, which is known to account for about 98% of the world’s water
                                              needs has the advantage of not being affected easily by natural conditions or
                                              otherwise and it is in most cases sufficiently secluded from contaminants perco-

DOI: 10.4236/jwarp.2021.137028         Jul. 16, 2021              478                     Journal of Water Resource and Protection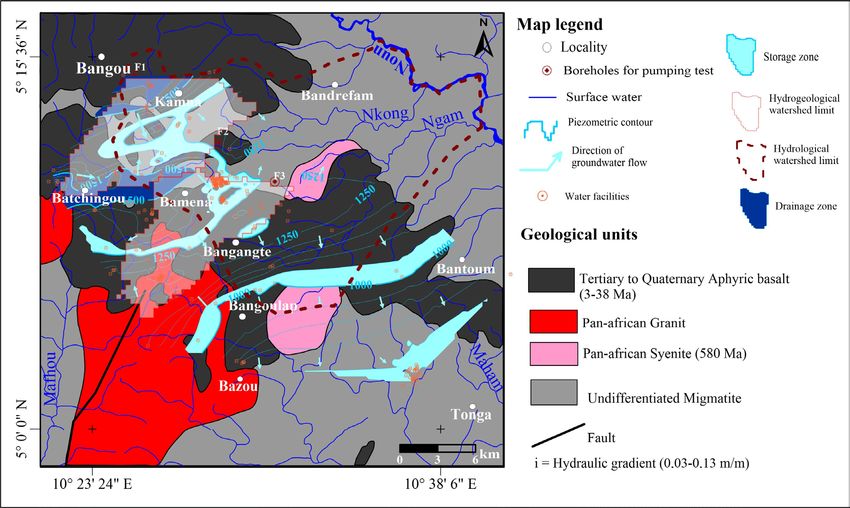
R. Feumba et al.

                                 lating from the surface since the earth’s layers act as the natural filter to stop
                                 contaminants. This is why the search for groundwater is a viable option in tak-
                                 ing on our demand for sufficient and quality water [1]. Hydraulic parameters,
                                 especially the hydraulic conductivity and transmissivity, which are usually esti-
                                 mated from pumping test carried out on drilled boreholes [2] [3], are of great
                                 interest in the hydraulic characterisation of aquifer systems as it enables to de-
                                 sign exploitation and management strategies, especially in lithological heteroge-
                                 neous aquifers [4]. Transmissivity of aquifer systems is the main hydraulic pa-
                                 rameter controlling long term drawdowns and is therefore important for devel-
                                 opment and management of groundwater exploitation [4].
                                    Increasing population rate and, water usefulness (drinking, hygiene, sanita-
                                 tion and agricultural activities [5] have resulted in high demand in water in town
                                 as well as in rural areas. During years 70 - 80, Cameroon through Danish tech-
                                 nical assistance built 365 water supply networks in 335 villages spread over 8 re-
                                 gions with 70 in West region, which functioned properly for 10 years, to meet
                                 the lack of public water supply networks in rural areas [6]. Ndé Division was
                                 among the selected area where facilities called “SCANWATER” were built in 9
                                 villages (Toukouop, Batchingou, Sanki, Bandiangseu, Bangoulap, Bahouoc, Ban-
                                 goua, Kamna and Bamena). Despite these water facilities, population is still fac-
                                 ing to drinking water access, although many attempts of rehabilitation (three rea-
                                 sons motivated the restoration of these water supply networks): 1) All equip-
                                 ments of these water supply networks are still existing but poorly maintained
                                 due to lack of trained technician during project implementation ten years ago; 2)
                                 The privilege has been focused primarily on defective water supply network and
                                 3) The geological context of the rural city of Bangangté and the former produc-
                                 tivity of the catchment borehole because only 33% of them are running and
                                 hence (in 2020, three villages amongst the nine, have their network still non-
                                 functional, Kamna, Bangoua and Bahouoc) drinking water access rate remains
                                 low (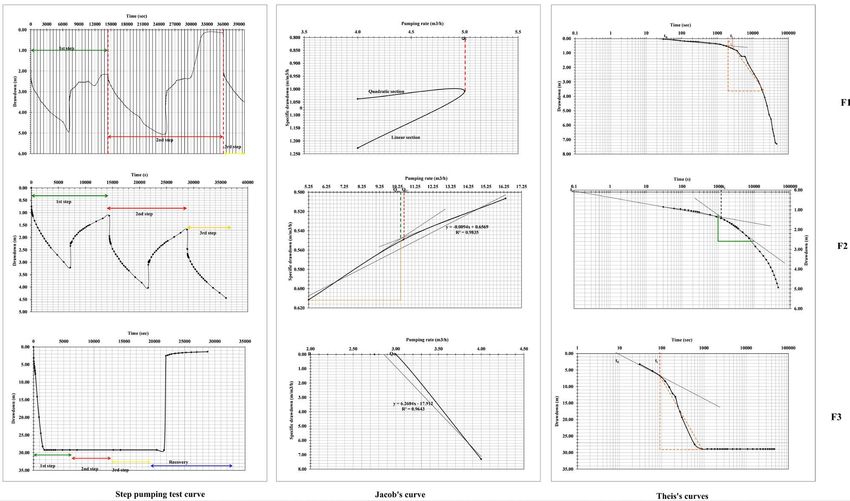
R. Feumba et al.
domain of the Central Africa Fold Belt [14], formed by 650 - 580 Ma collision
between the Congo-Sao Francisco craton, West African Congo and Saharan me-
tacraton [15]. It consists of variably deformed 580 Ma post-collisional, metalu-
minous to peraluminous, high K calc-alkaline to shoshonite affinity I type gra-
nitoids [16], originated from the partial melting of metasomatized sub conti-
nental lithospheric mantle with little crustal contamination and emplaced at the
waning stage of the Central Africa Fold Belt in the 635 - 645 Ma (U-Pb age,
[17]), metagranodiorites and metaleucogranites associated to migmatitic gneiss.
In the study area, these pan-African rocks are cross cut by cretaceous tholeiitic
basalts [18] whose emplacement into in the upper crust was controlled by Rie-
del’s fracture kinematic model [19]. These pan-African rocks are partially cov-
ered by tertiary basalts that formed the eastern edge of the western Cameroon
Highlands located in the NE trending southern continental segment of the CVL
that stretches from the Annobon Island to Lake Chad [20]. These tertiary basalts
occur as prismatic columnar lava flow at a mean altitude of 1400 m and domi-
nantly consist of 3 - 14 Ma alkaline and 36 - 47 Ma transitional basalts [21] [22]
[23] [24]. Both basalts are the product of the interaction between mantle upwel-
ling and sublithospheric continental during a lithospheric extensional tectonic
setting [22] [25].
The studied area has recorded a polyphase deformation characterized by an
early D1 deformational phase of thrust tectonics constrained at ≥602 Ma and is
defined by subhorizontal flat lying foliation exposed in the migmatitic gneiss
xenolith [17]. This early structures are transposed by NE trending transcurrent
tectonics [17] that controlled the 580 Ma post-collisional monzosyenites com-
lexe emplace at the waning stage of the pan-African event that formed the Cen-
tral Africa Fold Belt [16].
Related to this literature review, the whole data will be discussed to ensure the
availability of underground water able to supply water network to be rehabili-
tated and to prevent any pollutants in the long term.
2. Study Site and Methods
2.1. Location of the Study Area
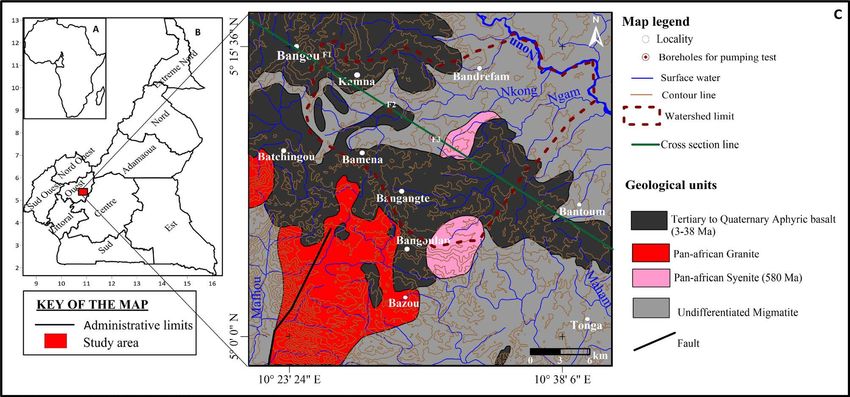
The studied area is located in Ndé division, between latitudes 5˚0'0" - 5˚15'36"N
and longitude 10˚23'24" - 10˚38'6"E, which covers an area of 800 km2 and around
92,035 inhabitants in 2005 [26] (Figure 1).
The soils are essentially ferralitic and developed on both basic and acid rocks.
Soils originated from basalt (basic rock) display very clayey texture, ensuring
good water retention capacity and a mineralogical composition made up of large
quantities of iron hydroxide, gibbsite and kaolinite. With a pH varying from 4.7
to 5.6 on the surface (thickness) and from 5.5 to 6.5 in depth (thickness), they
are rich in organic matter, poor in magnesium, potassium and phosphorus. Their
organic matter content is 5% by surface and their essential constituents are gibb-
site and goethite [29].
DOI: 10.4236/jwarp.2021.137028 480 Journal of Water Resource and Protection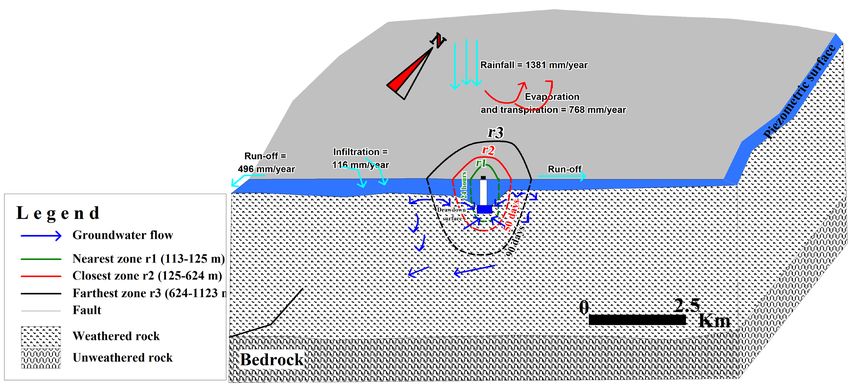
R. Feumba et al.

Figure 1. Location (Cameroon in Africa (A) the West region in Cameroon (B)) and overview map of the geological settings of
study area (C). The geological map of the study area was simplified from [27] and [28].

                                     2.2. Methods
                                     2.2.1. Data Collection
                                     Rainfalls data between 1951 and 2016, temperatures and water table measure-
                                     ments (in September 2019 in 66 boreholes and 166 wells) used in this study,
                                     were obtained from the Department of Agriculture and Rural Development of
                                     Ndé Division supplemented by water table measurements carried out in Febru-
                                     ary 2020 (in 66 boreholes, 84 wells and 33 springs) in order to describe climatic
                                     trend and understand groundwater flow.
                                        The estimation of the intrinsic pumping rates and hydrodynamic parameters
                                     was carried out by pumping tests in the boreholes which previously supplied
                                     SCANWATER. These boreholes were chosen to take into account different geo-
                                     logical formations of the study area (that are of Kamna (F1) (volcanic forma-
                                     tions), Lah-Gwi (F2) (volcanic formations) and Bandiangseu (F3) (metamorphic
                                     formations) to identify the most productive aquifers.
                                        For each pumping test, measurements of the water table were carried out the
                                     day before. On each borehole, a curve of the evolution of the water level is drawn
                                     and makes it possible to estimate the trend of the piezometric variations. Once
                                     these variations have been extrapolated, the next day the step tests are started to
                                     determine the pumping rate for the long-term pumping test. Three steps are
                                     carried out at each borehole. Each step lasts two hours and is separated from the
                                     next step by an equal duration. The pumping test lasted 12 hours and the recov-
                                     ery, an equal time.
                                        A discontinuous, three-steps pumping test were performed on the boreholes
                                     of Kamna and Lah-Gwi. The measurements of drawdown of the three steps were
                                     also monitored at an equal time for the recovery. Long-term pumping test (12
                                     hours) began immediately at the end of the third step in order to impose a steady

DOI: 10.4236/jwarp.2021.137028                             481                    Journal of Water Resource and Protection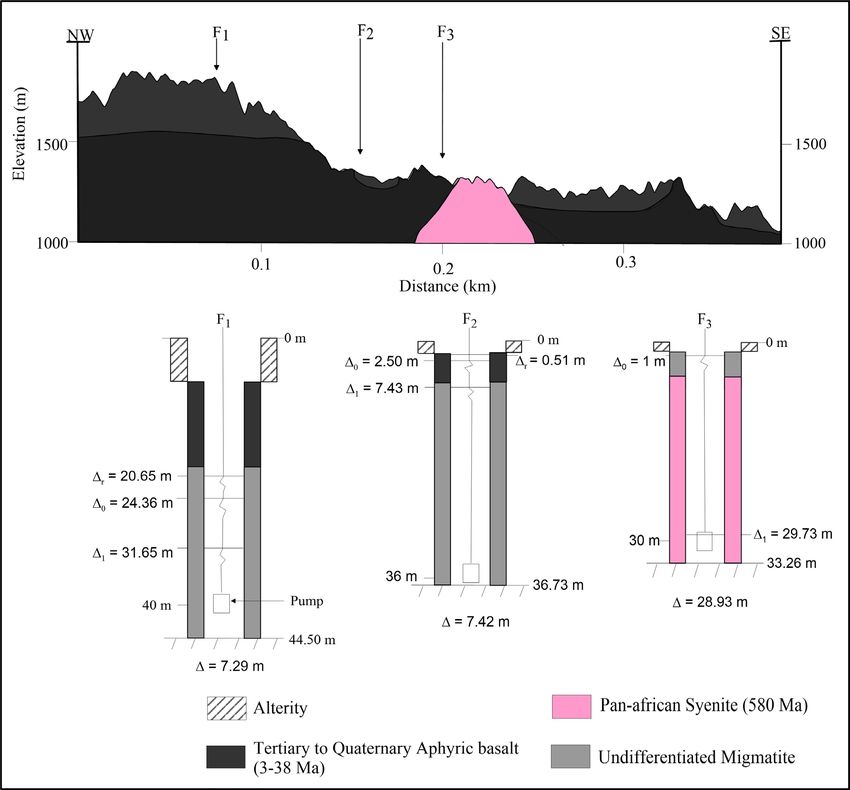
R. Feumba et al.
state drawdown. It took place at a constant pumping rate.
At Badiangseu, a three-steps pumping test has been continuously performed
on the borehole. The measurements of drawdown of the three-steps were also
monitored at an equal time for the recovery which was only followed at the end
of the third step. Pumping test of 12 hours continuously started when the initial
water level was obtained in the borehole. It operated at a very varying pumping
rate.
For the Kamna borehole, the recovery is more or less slow than the pumping
phase because, in 2 hours of pumping, when the drawdown is 4.64 m, we have a
recovery at equal time which is 3.58 m. For the Lah-Gwi borehole, the recovery
is slow than the drawdown because, in 2 hours of pumping, when drawdown is
3.21 m, we have a recovery at equal time which is 1.10 m.
At Badiangseu, the recovery is very fast because, in 6 hours of continuous
pumping, for a drawdown of 28.2 m, we have recovery in 5 minutes of 25.85 m.
After this period of time, the recovery becomes slow and returns to the initial
water table of 1 m after 4 hours and 30 minutes that is a total recovery of 27.2 m.
The drawdowns in aquifer are no longer observed around 29 meters where the
backflow occurs in spurts from 30 seconds intervals to 10 seconds at a pumping
rate of less than 1.5 m3/h. This interaction between the nearest stream and the
water table is observed after 8 hours of pumping and the water becomes very
clear from this moment.
2.2.2. Data Processing
Global Mapper and Surfer software were used for thematic and numerical car-
tography (watershed of Nkong-Ngam is the experimental study area) and Excel
for data processing (Figure 2).
The processing of all data collected enables to determine the intrinsic pump-
ing rate (critical pumping rate Qc and operating pumping rate Qex) by the me-
thod of [30] [31] [32] and the hydrodynamic parameters by the methods of [33]
[34].
Regarding the water balance, the available rainfall data cover a period of 66
consecutive years (1951-2016). The method of [35] was used to estimate the
terms of this water balance (evaporation, runoff and effective infiltration).
In Equation (1), P (mm) is the average rainfall, ETR (mm) is the actual evapo-
transpiration, I (mm) is the infiltration, R (mm) is runoff and ΔRFU is the varia-
tion of the useful water reserve under the ground or soil.
=
P ETR + I + R ± ∆RFU (1)
In Equations (2)-(4), I is the annual average temperature index, T is the aver-
age temperature in ˚C, I is the average monthly temperature index in ˚C, F(λ), a
correction factor that varies with the month and α, an index depending on I
(Equation (5)).
α
10T
ETP =
16 × × F (λ ) (2)
I
DOI: 10.4236/jwarp.2021.137028 482 Journal of Water Resource and ProtectionR. Feumba et al.
Figure 2. Graphs obtained after the different pumping test in the study area.
1.514
T
i= (3)
5
I = ∑i (4)
α = 0.492 + 1.79 × 10⁻² I − 7.71× 10⁻⁵ I 2 + 6.75 × 10⁻⁷ I 3 (5)
For the determination of the hydraulic parameters of discontinuous aquifers
(transmissivity T in m2/s and hydraulic conductivity k in m/s), the methods de-
veloped by [31] [33] [34] were used. Jacob’s method is a graphical determination
method which results from the logarithmic approximation of the equation of
[34]. In Equations (6)-(8), the infinite series or well function W(u) has been
truncated according to the second term. γ is Euler constant (0.57772156…), ∆ is
the drawdown in each time t, expressed in m, T is the transmissivity expressed in
m2/s, S is the storage coefficient expressed in percentage, t is the time elapsed
since the start of pumping test, expressed in seconds and Q is the pumping rate
in m3/s.
r2S
W ( u ) =γ − ln ( u ) =−γ − ln (6)
4Tt
The expression of the drawdown at time t is defined by the following equa-
tion:
e− y
∆ (t )
=
Q
4πT
( ln ( u )
ln e − y −= )
Q
ln
4πT u
(7)
DOI: 10.4236/jwarp.2021.137028 483 Journal of Water Resource and ProtectionR. Feumba et al.
By substituting µ and γ by their respective expression in the previous equa-
tion, we get the equality known as the Jacob’s equation:
0.183 × Q 2.25Tt
∆ (t ) = log10 2 (8)
T r S
Moreover, for the calculation of the hydraulic conductivity, we relied on the
cross section (Figure 3) and the depth of each borehole tested (3.71 m in Kam-
na, 1.99 m in Lah-Gwi and 1.00 m in Badiangseu).
The characterization of the watershed was made geometrically and morpho-
metrically. In Equations (9)-(11), Kg is the Gravelus Index, A is the area of the
watershed, Leq and leq are the equivalent length and width respectively of the
equivalent rectangle of the watershed and P is the perimeter of the watershed
[36].
P 0.281× P
=
Kg ≅ (9)
2 πA √A
Kg A
Leq = (10)
2
1.12
1.12 × 1 + 1 −
Kg
A
leq = (11)
Leq
The piezometric map is produced by Surfer software. The interpolation me-
thod used is kriging because it is very often more precise than the other methods
[37].
The calculation of the protection zones of water resource were computed us-
ing Equation (12) according to Hofmann and Lillich in [38]. In this, PZ is the
protection zone; t is the residence time in days already defined by the author (1,
5, 10, 30, 50 and 90 days); k, the effective velocity in m/day; ne, the effective po-
rosity (deduced from the abacus of [39]) and i, the hydraulic gradient (deter-
mined from the piezometric map) allowed the calculation of the protection zones
of water resource.
PZ ( m ) = t × k × i ne (12)
3. Results
3.1. Characteristic of the Watershed
The characteristic of the studied watershed, which includes the tributaries of
Nkong and Ngam rivers whose general flow direction is SW-NE and whose out-
let is the Noun River, are presented in Table 1.
Based on ORSTOM (Oversea Office of Technical and Scientifical Research,
organisation replaced nowadays by IRD (Research Institute for Development))
classification and specific elevation difference (Ds), the watershed belongs to the
class R5-R6 which is characterized by a fairly to strong relief.
DOI: 10.4236/jwarp.2021.137028 484 Journal of Water Resource and ProtectionR. Feumba et al.
Figure 3. Sketch of the geological cross section of the study area and lithological vertical layers of each borehole.
Table 1. Geometric and morphometric characteristics of the Nkong-Ngam watershed.
Perimeter Area Gravelus Rectangle Maximum Minimum Average slope Difference in height
Sites
(P km) (A km2) index (Kg) length (Leq km) elevation (m) elevation (m) (%) elevation (Ds m)
Nkong’s watershed 73.21 166.7 1.60 31.27 1898 929 0.03 271.1
Ngam’s watershed 73.98 159.6 1.64 32.00 1621 900 0.11 157.9
3.2. Hydrological Balance
The results obtained by applying the method of [35] from the temperature and
rainfalls data are presented in Table 2.
8.4% of rainfall infiltrate to contribute to the groundwater recharge while
55.7% is evaporated out of a total rainfall of 1380.5 mm. 35.9% constitute the
run-off. Moreover, the excess available for run-off is zero at the Bangangté sta-
tion. From a hydrological point of view, this result shows that during this period,
most of the small rivers dry up; for 5 months, the variation in soil reserves (ΔRi)
is zero. Water stocks in the soil are therefore not renewed or are then strongly
DOI: 10.4236/jwarp.2021.137028 485 Journal of Water Resource and ProtectionR. Feumba et al.
taken up by evapotranspiration which is very strong in this region; from April to
December; actual evapotranspiration (ETR) is equal to potential evapotranspira-
tion (ETP).
During these months the recorded rainfall is lower than the ETR.
Table 2. Hydrological balance of the area studied according to the method of [35].
March April May June July August September October November December January February Total
ETP (mm) 86.1 79.6 75.5 68.2 67.2 68.0 66.0 68.7 71.9 75.6 81.2 76.3 884.5
P (mm) 85.7 131.3 150.8 130.1 133.4 176.9 246.9 236.0 59.1 6.7 4.4 19.2 1380.5
T (˚C) 22.0 21.5 20.7 20.0 19.6 19.7 19.7 19.8 20.5 20.7 21.4 21.8
ETR (mm) 85.7 79.6 75.5 68.2 67.2 68.0 66.0 68.7 71.9 75.6 22.7 19.2 768.3
ETP-ETR (mm) 0.4 0.0 0.0 0.0 0.0 0.0 0.0 0.0 0.0 0.0 58.5 57.2 116.1
Ri (mm) 0.0 51.6 100.0 100.0 100.0 100.0 100.0 100.0 87.2 18.3 0.0 0.0
ΔRi (mm) 0.0 51.6 48.4 0.0 0.0 0.0 0.0 0.0 −12.8 −68.9 −18.3 0.0 0.0
3.3. Piezometry
The water table measurements of the wells and boreholes carried out in Septem-
ber 2019 and February 2020 which are rainy and dry seasons, respectively. The
median piezometric head of the study area for wells and boreholes is 1317 ± 217
m with a maximum of 1675 ± 217 m and a minimum of 772 ± 217 m. The me-
dian variation between the dry and rainy season in each well and borehole is 1 ±
0.62 m with a maximum of 2.5 ± 0.62 m and a minimum of 0.19 ± 0.62 m.
Figure 4 shows the evolution of the piezometric head in the study area.
From Figure 4, the following hydrogeological zones are identified:
● The recharge area located to the NW and WSW of the study site is characte-
rized by the divergence of the underground flow. It is the least suitable loca-
tion for groundwater catchment. This explains the drying up of observed in
some water facilities in the villages of Bangoulap for instance;
● The piezometric depressions or storage area with converging underground
flow are located in the Center (F2, Lah-Gwi) and SE of the study area. These
are suitable areas for the installation of catchment boreholes [40]. However,
these storage areas constitute areas with a high risk of pollution because they
are formed by water resulting from direct infiltration (transport of pollutants
from the surface to underground: migration) and those which propagate from
the drainage areas (propagation of pollutants that are not self-purified).
3.4. Hydraulic Parameters and Intrinsic Pumping Rate of
Discontinuous Fractured Aquifers
The hydraulic parameters assessed are Transmissivity (T in m2/s) and hydraulic
conductivity (K in m/s) meanwhile the intrinsic flow rates are critical (Qc) and
operating (Qex) pumping flow rate. The hydraulic parameters and intrinsic flow
rate of discontinuous and fractured aquifers are presented in Table 3.
DOI: 10.4236/jwarp.2021.137028 486 Journal of Water Resource and ProtectionR. Feumba et al.
Figure 4. Piezometric map of the study area.
Table 3. Intrinsic pumping rate and hydraulic parameters of basement aquifers in the
study area.
Kamna (F1) Lah-Gwi (F2) Bandiangseu (F3)
Critical pumping rate (Qc) in m3/h 5 10.70 2.75
Pumping rate (Q) m3/h 4 10 1.5
Operating pumping rate (Qex) in
4.5 10.50 1.80
m3/h
Hydraulic conductivity in m/s 4.72 × 10⁻⁴ 3.27 × 10⁻⁴ 3.33 × 10⁻⁴
Transmissivity T = 0.183 × (Q/C)
5.65 × 10⁻⁵ 3.63 × 10⁻⁴ 3.47 × 10⁻⁶
in m2/s
Transfer time for a pollutant to
6 56 3
reach aquifer in day
Jacob’s line equation (Δs is the
Δ = 1.01Q + 0.19Q2 Δ = 0.612Q + 0.013Q2 Δ = 12.86Q2
specific drawdown)
Recovery after 12 hours of
Δ = 7.29 m Δ = 7.42 m Δ = 28.93 m
continuous pumping
Intercepted time ti (sec) 2500 1100 90
Pumping reaction time t0 (sec) 30 0.1 10
Slope of Jacob’s line C 3.6 1.4 22
3.5. Calculation of Water Resource Protection Zone or Radius
The general hydraulic slope of the Ndé division is more or less steep and implies
direct contamination of the water table in the event of accidental pollution of a
DOI: 10.4236/jwarp.2021.137028 487 Journal of Water Resource and ProtectionR. Feumba et al.
water facility located in a drainage zone. This hydraulic gradient is between 0.03
and 0.13 m/m and will help reduce pollutant migration rate into the ground as if
ve = k × i ne where k is the permeability of the aquifer, i is the hydraulic gra-
dient and ne, the effective porosity of the same material, then ve k . The pro-
tection of groundwater therefore also requires implementation of the protection
zones (nearest, closest and farthest radius). Depending on the geographical posi-
tions, the choice of catchment borehole for supplying a water network to be re-
habilitated will have to be based on the piezometric map established and the
geological formation to be captured. The effective porosity (ne) derived from the
chart of [38] in the study area vary between 10% - 30%. The effective velocity
determined by [41] equation ( ve = k × i ne ) is calculated for each locality in
m/day. The transfer distance in the saturated zone is determined by the method
of Hoffmann and Lillich in [39] in which the residence times are set between 1
and 90 days. The results are shown in Table 4.
From Table 4, three protection zones of water resources have been defined
[42]:
● The nearest radius (r1): 113 - 125 m from the water facility. This radius is
useful for direct installations on the water point in order to limit the risks of
infiltration of rainwater and wastewater. No pollutant source must be in this
radius;
● The closest radius (r2): 125 - 624 m depending on the piezometric head of
the study area. In this area, agricultural activities with enrichment are to be
prohibited;
● The farthest radius (r3): 624 - 1123 m. This radius corresponds to the drai-
nage zones. Pollutant sources must not be there.
These protection zone assimilated to a radius will be implemented on the field
as shown in Figure 5.
Figure 5. Model for implementing protection zones on the field in the study area.
DOI: 10.4236/jwarp.2021.137028 488 Journal of Water Resource and ProtectionR. Feumba et al.
Table 4. Protection zones as a radius obtained for the study area.
Protection zones Values in m Villages Effective speed in m/day
Kamna, Toukouop, Sanki, Bangoulap,
Nearest 113 - 125 12.24
Bahouoc and Bamena
Closest 125 - 624 Lah-Gwi and Batchingou 11.33
Farthest 624 - 1123 Bandiangseu 12.48
4. Discussion
4.1. Piezometry, Groundwater Recharge and Productivity
The piezometric map of the study area permits to understand the mode of drai-
nage and recharge of aquifers. This analysis of the morphology of the piezome-
tric surface in the hydrogeological catchment area shows that the piezometric
surface intersects the hydrographic network indifferently and the underground
flow are not parallel everywhere to the Nkong and Ngam streams. In addition,
the main drainage axis of the water table oriented NW-SE, is different from the
W-E and WSW-ENE trending rivers flow, which suggests a complex hydraulic
connection. These recharge zones identified by the piezometric analysis in the
high elevation zones of the watershed are consistent with the functioning of aqui-
fers in the basement area [43] [44] [45] [46] [47].
Moreover, closed piezometric contours are suitable areas for installing water
facilities. However, this configuration can reflect the impact of water withdraw-
als by the population and therefore an interpolation biased by the water table
non-steady state [48] and errors due to the absence of precise levelling.
Infiltration data from the water balance combined with the interpretation of
piezometric map suggest that the aquifer is recharged by infiltration of effective
rainfall [49] in a general case based on the assumptions of [35] [50]. Indeed, the
water balance according to [35] method allows to estimate that the infiltration
interpreted here as potential recharge would represent 8.4% of the average an-
nual rainfall. Recharge rates of 9% - 16% have been estimated in granite forma-
tions at Galicia-Costa in Spain [51]. This dependence of effective infiltration on
rainfall has been recognized in other parts of the world (e.g. [52] [53]). This val-
ue of infiltration obtained in the study area is greater than those obtained in the
basement aquifers of the city of Yaoundé (5.7%) [9] and lower than that (12%)
obtained in Bongouanou (East of Ivory-Coast) [54]. The difference between
these values could be mainly related to differences in climate whose impact on
groundwater recharge would be exacerbated by the different geology, soil, vege-
tation cover and topographic slope in the regions.
The most important transmissivities and hydraulic conductivities are found
on volcanic rocks [55]. These results are similar to those obtained in the high-
lands of West Cameroon which confirm the high productivity of volcanic for-
mations with respect to metamorphic zones [56]. Indeed, [8] also confirm the
less productivity of metamorphic aquifer of Yaoundé (Cameroon). The factors
that would govern the productivity of boreholes in basement areas are the in-
DOI: 10.4236/jwarp.2021.137028 489 Journal of Water Resource and ProtectionR. Feumba et al.
trinsic parameters of the aquifer such as transmissivity (T), operating pumping
rate (Qex) and specific drawdown (∆/Q) or specific capacity (Q/Δ). Indeed, these
parameters are directly linked to the nature of the aquifer studied and therefore,
the aquifers with the highest values of transmissivities could be the most pro-
ductive.
Empirical power equations between Q/Δ and T in varying hydrogeologic set-
tings are proposed by [4]. Considering empirical Equations (13) of [57] cited in
[58] and Equation (14) of [59], the transmissivity of the study area was assessed
considering the geological formation (volcanic and metamorphic, see Table 5).
T = 0.45 × ( Q ∆ )
1.05
(Volcanic) (13)
T = 0.78 × ( Q ∆ )
1.02
(Weakly metamorphosed sedimentary rocks) (14)
From Table 5, transmissivities are in order of 10−4 to 10−5 m2/sec when apply-
ing the empirical Equations (13) and (14). These results are not too different
from those obtained with the method used for this study. Nevertheless, an aqui-
fer with a high value of transmissivity is the more productive [3] and the upper
part of a fractured aquifer is also more productive [54]. Furthermore, the prod-
uctivity is not related to the depth of a borehole [60].
Table 5. Hydraulic parameters of basement aquifers in the study area according to [57]
and [59].
C Q (m3/h) ∆ (m) Q/∆ (m3/h/m) T (m2/h) T (m2/s)
Kamna (F1) 0.45 4 7.29 0.55 2.40 × 10⁻¹ 6.66 × 10⁻⁵
Lah-Gwi (F2) 0.45 10 7.42 1.35 6.16 × 10⁻¹ 1.71 × 10⁻⁴
Bandiangseu (F3) 0.78 1.5 28.93 0.052 3.81 × 10⁻² 1.06 × 10⁻⁵
4.2. Groundwater Protection
The hydraulic gradient is variable (3 - 13 × 10−2) and consistent with the hetero-
geneity of the geological formations. The hydraulic parameters estimated by
pumping tests confirm the aquifer character of the geological formations [40],
and highlight their hydrodynamic heterogeneity in connection with the differen-
tial weathering, the intensity of the fracturing and their well-known probable
interconnection in the crystalline basement aquifer [61] [62]. A hydrogeological
watershed has been identified in the study area. The main drainage axis is oriented
NW-SE. The hydraulic conductivity of the saturated zone is of the order of 10−4
m/s, which gives it the term, according to [40], of aquifer and not of aquiclude or
aquitard. Based on the classification of water tables by [63], and on the piezome-
tric criterion, the aquifer of the Nkong-Ngam watershed is an unconfined aqui-
fer. With regard to the type of recharge described above, it therefore becomes
important to define the protection zones of the water resource in such a hetero-
geneous aquifer.
Few authors propose, after an inventory of the habitat in the Anga’a and
DOI: 10.4236/jwarp.2021.137028 490 Journal of Water Resource and ProtectionR. Feumba et al.
Mingoa watersheds in Yaoundé (Cameroon), an appropriate approach for the
design of protection zones adapted to urban context [64] [65] The values of the
protection radius estimated in this study are very variable and evidences the
vulnerability of the aquifer of the Nkong-Ngam watershed. The values (113, 624
and 1123 m) of the protection zones obtained are greater than those obtained by
[64] in the urbanized watershed of the Mingoa (10, 15 and 30 m) in Yaoundé
(Cameroon). This difference is likely linked to the geological context of the study
sites.
5. Conclusions
The results of this study combined with previous data from the literature allow
to draw the followings remarks:
● The water balance shows a recharge rate of 8.4% (≈116 mm/year) from a to-
tal rainfall of 1380.5 mm for the period 1951-2016 and it emerges that for
three months per year (from January to March), the excess available for
run-off is null at the Bangangté station and for 5 months, the variation in soil
storage is null. Water stocks in the soil are therefore not renewed or are then
strongly taken up by evapotranspiration which is very strong in this region.
In addition, from April to December; actual evapotranspiration is equal to
potential evapotranspiration.
● The basement aquifer of Ndé division has, on the one hand, a high produc-
tivity on volcanic formations (4.5 ≤ Q ≤ 10.5 m3/h), but on the other hand
has also a very low productivity in metamorphic formations (Q ≤ 1.5 m3/h).
Furthermore, hydraulic conductivity of aquifer is in order of 10−4 m/sec and
transmissivity varies from 10−4 to 10−6 m2/sec. Three hydraulic parameters
control the productivity of this basement aquifer: transmissivity, specific draw-
down and pumping rate; and this productivity is not related to the depth of
the borehole. Empirical equation used to check transmissivities values of
aquifer in Ndé Division corroborate with the present results and confirms the
fact that, transmissivity is the most important parameter which controls the
productivity of aquifers.
Piezometric map confirms that storage areas are suitable for realising catch-
ment water facilities with a high productivity. However, these areas are also ex-
posed to a high vulnerability if protection zones are not implemented. As for the
exposure of aquifer to pollutant whose time of transfer varies from 3 to 56 days
depending on rock types and hydraulic gradient (0.03 - 0.13 m/m), three protec-
tion zones (r1, r2 and r3) have been proposed for a better protection of this
aquifer, respectively 113, 624 and 1123 m from the centre of the water facilities.
All these preliminary data will help for future hydrogeological modelization with
“Modflow and model muse” of this aquifer.
Acknowledgements
The authors thank the Water Authority of the Municipality of Bangangté and
DOI: 10.4236/jwarp.2021.137028 491 Journal of Water Resource and ProtectionR. Feumba et al.
Environment Research Action in Cameroon (ERA-Cameroun) for their logistic
support for the fieldwork and the Delegation of Agriculture and Rural Develop-
ment of Ndé Division for the collection of hydroclimatic data and the measure-
ment of water table in water facilities. Furthermore, anonymous reviewers are
thanked for their very helpful remarks and useful comments.
Conflicts of Interest
The authors declare no conflict of interest. The funders have no role in the de-
sign of the study; in the collection, analysis, or interpretation of the data; in writing
the manuscript, or in the decision to publish the results.
References
[1] Anomohanran, O. (2014) Hydrogeophysical Investigation of Aquifer Properties and
Lithological Strata in Abraka, Nigeria. African Earth Sciences, 102, 247-253.
https://doi.org/10.1016/j.jafrearsci.2014.10.006
[2] Asfahani, J. (2016) Hydraulic Parameters Estimation by Using an Approach Based
On Vertical Electrical Soundings (VES) in the Semi-Arid Khanasser Valley Region,
Syria. Journal of African Earth Sciences, 117, 196-206.
https://doi.org/10.1016/j.jafrearsci.2016.01.018
[3] Ebong, D.E., Akpan, A.E. and Onwuegbuche, A.A. (2014) Estimation of Geohydraulic
Parameters from Fractured Shales and Sandstone Aquifers of Abi (Nigeria) Using
Electrical Resistivity and Hydrogeologic Measurements. Journal of African Earth
Sciences, 96, 99-109. https://doi.org/10.1016/j.jafrearsci.2014.03.026
[4] Al Farrah, N., Van Camp, M. and Walraevens K. (2013) Deducing Transmissivity
from Specific Capacity in the Heterogeneous Upper Aquifer System of Jifarah Plain,
NW-Libya. Journal of African Earth Sciences, 85, 12-21.
https://doi.org/10.1016/j.jafrearsci.2013.04.004
[5] PNDP (Programme National pour le Développement Participatif) (2018) Méca-
nisme de contrôle citoyen de l’action publique dans la commune de Bangangté. Rap-
port d’étude du Programme National pour le Développement Participatif (PNDP)
au Cameroun, Cameroun, 84 p.
[6] Djeuda Tchapnga, H.B., Tanawa, E. and Ngnikam, E. (2001) L’eau au Cameroun.
Tome 1: Approvisionnement en eau potable. Laboratoire Environnement et Sciences
de l’Eau (LESEAU), École Nationale Supérieure Polytechnique de Yaoundé. Presses
Universitaire de Yaoundé, Yaoundé, 359 p.
[7] Bon, A.F., Ndam Ngoupayou, J.R., Ewodo Mboudou, G. and Ekodeck, G.E. (2016)
Caractérisation hydrogéologique des aquifères de socle altéré et fissuré du bassin
versant de l’Olézoa à Yaoundé, Cameroun. Revue des sciences de l’eau, 29, 149-166.
https://doi.org/10.7202/1036545ar
[8] EwodoMboudou, G.A., Ombolo, FouepeTakounjou, A., Bon, A.F. and Ekodeck,
G.E. (2012) Étude des Paramètres hydrauliques des aquifères de sub-surface du bas-
sin versant de la Mingosso, région de Yaoundé. Révue-Conseil Africain et Malgache
pour l'Enseignement Supérieur (CAMES), 13, 123-127.
[9] Fouepe Takounjou, A., NdamNgoupayou, J.R., Riotte, J., Takem, G.E., Mafany, G.,
Marechal, J.C. and Ekodeck, G.E. (2011) Estimation of Groundwater Recharge of
Shallow Aquifer on Humid Environment in Yaounde, Cameroon Using Hybrid Wa-
ter-Fluctuation and Hydrochemistry Methods. Environmental Earth Sciences, 64,
107-118. https://doi.org/10.1007/s12665-010-0822-x
DOI: 10.4236/jwarp.2021.137028 492 Journal of Water Resource and ProtectionR. Feumba et al.
[10] Mfonka, Z., Ndam Ngoupayou, J.R., Ndjigui, P.D., Zammouri, M., Kpoumie, A. and
Rasolonana, E. (2015) Hydrochimie et potabilité des eaux du bassin versant du Nchi
dans le plateau Bamoun (Ouest Cameroun). International Journal of Biological and
Chemical Sciences, 9, 2000-2018. https://doi.org/10.4314/ijbcs.v9i4.39
[11] Ntep, F., Kengne, I.M., EwodoMboudou, G.A., Nyochembeng, N. and Ekodeck,
G.E. (2014) Influence of Seasonal Dynamics on Groundwater Resources Quality in
Semitropical Urban Zone: Case of the Biyeme Upper Stream Catchment (Yaounde,
Cameroon). International Journal of Biological and Chemical Sciences, 8, 1319-1335.
https://doi.org/10.4314/ijbcs.v8i3.44
[12] Bonsor, H., MacDonald, A., Casey, V., Carter, R. and Wilson, P. (2018) The Need
for a Standard Approach to Assessing the Functionality of Rural Community Water
Supplies. Hydrogeology Journal, 26, 367-370.
https://doi.org/10.1007/s10040-017-1711-0
[13] Hammond, P.A. (2018) Reliable Yields of Public Water-Supply Wells in the Frac-
tured-Rock Aquifers of Central Maryland, USA. Hydrogeology Journal, 26, 333-349.
https://doi.org/10.1007/s10040-017-1639-4
[14] Toteu, S.F., Van Schmus, W.R., Penaye, J. and Michard, A. (2001) New U-Pb, and
Sm-Nd Data from North-Central Cameroon and Its Bearing on the Pre-Pan-Afri-
can History of Central Africa. Precambrian Research, 108, 45-73.
https://doi.org/10.1016/S0301-9268(00)00149-2
[15] Ngako, V., Affaton, P. and Njonfang, E. (2008) Pan-African Tectonics in Northwes-
tern Cameroon: Implication for the History of Western Gondwan. Gondwana Re-
search, 14, 509-522. https://doi.org/10.1016/j.gr.2008.02.002
[16] Tchouankoue, J.P., Li, X.H., Ngo Belnoun, R.N., Mouafo, L. and Ferreira, V.P. (2016)
Timing and Tectonic Implications of the Pan-African Bangangte Syenomonzonite,
West Cameroon: Constraints from in-Situ Zircon U-Pb Age and Hf-O Isotopes. Journal
of African Earth Sciences, 124, 94-103.
https://doi.org/10.1016/j.jafrearsci.2016.09.009
[17] Njiekak, G., Dörr, W., Tchouankoué, J.P. and Zulauf, G. (2008) U-Pb Zircon and
Microfabric Data of (Meta) Granitoids of Western Cameroon: Constraints on the
Timing of Pluton Emplacement and Deformation in the Pan-African Belt of Central
Africa. Lithos, 102, 460-477. https://doi.org/10.1016/j.lithos.2007.07.020
[18] Tchouankoue, J.P., Simeni, W.N.A., Kagou, D.A. and Li, X.H. (2014) 40Ar/39Ar
Dating of Basaltic Dykes Swarm in Western Cameroon: Evidence of Late Paleozoic
and Mesozoic Magmatism in the Corridor of the Cameroon Line. Journal of African
Earth Sciences, 93, 14-22. https://doi.org/10.1016/j.jafrearsci.2014.01.006
[19] Simeni, W.N.A., Tchaptchet, T.D., Ngo Belnoun, R.N., Tchouankoue, J.P. and Ganwa,
A.A. (2017) Structural Relationship between Brittle Deformation and Paleozoic to
Mesozoic Basalt Dykes in the Precambrian Basement of the Southern Continental
Part of the Cameroon Volcanic Line. International Journal of Geosciences, 8, 318-
331. https://doi.org/10.4236/ijg.2017.83016
[20] Deruelle, B., Ngounouno, I. and Demaiffe, D. (2007) The Cameroon Hot Line (CHL):
A Unique Example of Active Alkaline Intraplate Structure in Both Oceanic and Con-
tinental Lithospheres. Comptes Rendus Geosciences, 339, 589-600.
https://doi.org/10.1016/j.crte.2007.07.007
[21] Fosso, J., Ménard, J.J., Bardintzeff, J.M., Wandji, P., Tchoua, F.M. and Bellon, H.
(2005) Les laves du mont Bangou: Une Première Manifestation Volcanique éocène,
à affinité transitionnelle, de la Ligne du Cameroun. Comptes Rendus Geosciences,
337, 315-325. https://doi.org/10.1016/j.crte.2004.10.014
DOI: 10.4236/jwarp.2021.137028 493 Journal of Water Resource and ProtectionR. Feumba et al.
[22] Lemdjou, Y.B., Zhang, D., Tchouankoue, J.P., Hu, J., Tchuimenie, N.N.B., Soh, T.L.
and Yuan, Y. (2020) Elemental and Sr-Nb-Pb Isotopic Compositions, and K-Ar Ages
of Transitional and Alkaline Plateau Basalts from the Eastern Edge of the West Ca-
meroon Highlands (Cameroon Volcanic Line). Lithos, 358-359, Article ID: 105414.
https://doi.org/10.1016/j.lithos.2020.105414
[23] Wotchoko, P., Wandji, P., Bardintzeff, J.M. and Bellon, H. (2005) Données pétrolo-
giques et géochronologiques nouvelles sur le volcanisme alcalin néogène à récent de
la rive ouest du Noun (plaine du Noun, Ligne du Cameroun). Review of the Bulga-
rian Geological Society, 66, 97-103.
[24] Wotchoko, P., Tene Djoukam, J.F., Kouankap Nono, G.D., Kouske, P.A., Nkoua-
thio, D.G. and Atenkia Fonkem, S. (2015) Petrographic and Geochemical Characte-
rization of Basalts in Bangangte Area (West Cameroon): Implications on Their Source.
Earth Sciences, 4, 266-274.
[25] Marzoli, A., Piccirillo, E.M., Renne, P.R., Bellieni, G., Lacumin, M., Nyobe, J.B. and
Tongwa, A.T. (2000) The Cameroon Volcanic Line Revisited: Petrogenesis of Con-
tinental Basaltic Magmas from Lithospheric and Asthenospheric Sources. Journal of
Petrol, 41, 87-109. https://doi.org/10.1093/petrology/41.1.87
[26] BUCREP (Bureau central des recensements et des études de populations) (2005)
Troisième Recensement Général de la Population et de l’Habitat au Cameroun. Vol.
7, Bureau central des recensements et des études de populations (BUCREP) Réper-
toire actualisé des villages du Cameroun. Rapport publié, 436 p.
[27] Weecksteen, G. (1957) Carte géologique de reconnaissance à l’échelle du 1/500000.
Territoire du Cameroun (coupure Douala-Ouest) avec notice explicative. Imprime-
rie Nationale du Cameroun, 35 p.
[28] Dumort, J.C. (1968) Notice explicative sur la feuille Douala-Ouest. Carte géologique
de reconnaissance à l’échelle du 1/500.000. ORSTOM, Yaoundé, Paris, 69 p.
[29] Njofang, C. (2007) Éléments en traces dans les sédiments, les sols et les plantes comes-
tibles dans le bassin versant du Noun (Cameroun): Bases pour une gestion géochi-
mique de l’environnement. Thèse de Doctorat 3ème cycle, Université de Yaoundé I,
Cameroon, 300 p.
[30] Jacob, C.E. (1950) Flow of Ground Water. In: Rouse, H., Ed., Engineering Hydrau-
lics, John Wiley, New York, chapitre 5, 321-386.
[31] Jacob, C.E. (1947) Drawdown Test to Determine Effective Radius of Artesian Well.
Transactions American Society of Civil Engineers, 112, 1047-1070.
[32] Jacob, C.E. (1940) On the Flow of Water in an Elastic Artesian Aquifer. Eos, Trans-
actions American Geophysical Union, 21, 574-586.
https://doi.org/10.1029/TR021i002p00574
[33] Banton, O. and Bangoy, M.L. (1996) A New Method to Determine Storage Coeffi-
cient from Pumping Test Recovery Data. Groundwater, 34, 775-777.
https://doi.org/10.1111/j.1745-6584.1996.tb02069.x
[34] Theis, C.V. (1935) The Relation between the Lowering of Piezometric Surface and
the Rate of the Duration of Discharge of Well Using Groundwater Storage. Eos, Trans-
actions American Geophysical Union, 16, 519-524.
https://doi.org/10.1029/TR016i002p00519
[35] Thornthwaite, C.W. (1948) An Approach toward a Rational Classification of Climate.
Geography Review, 38, 55-94. https://doi.org/10.2307/210739
[36] Thebe, B. (1999) Le bassin versant. Deust Genie Hydrosanitaire. Université de Mont-
pellier; Laboratoire Hydrologie, Centre IRD de Montpellier, 18 p.
DOI: 10.4236/jwarp.2021.137028 494 Journal of Water Resource and ProtectionR. Feumba et al.
[37] Gratton, Y. (2002) Le Krigeage: La méthode optimale d’interpolation spatiale. Les
articles de l’Institut d’Analyse Géographique, Québec.
[38] Lallemand-Barres, and Roux, J.C. (1989) Guide méthodologique d’établissement des
périmètres de protection des captages d’eau souterraine destinée à la consommation
humaine. No. 19, Bureau de Recherches Géologiques et Minières (BRGM), Orléans,
224 p.
[39] Banton, O. and Bangoy, M.L. (1997) Hydrogéologie: Multiscience environnemen-
tale des eaux souterraines. Presse de l’Université du Québec/Aupelf (Agence univer-
sitaire de la Francophonie), Québec, 460 p.
[40] Castany, G. (1982) Principes et méthodes de l’hydrogéologie. Dunod Éd Bordas, Paris,
236 p.
[41] Darcy, H. (1856) Les fontaines publiques de la ville de Dijon. Dalmont, Paris, 305-
310.
[42] Alcaydé, G. (2000) Protection générale des ressources en eau et périmètres de pro-
tection des captages d'alimentation en eau potable. La Houille Blanche, 86, 57-60.
https://doi.org/10.1051/lhb/2000060
[43] Nigate, F., Camp, M.V., Yenehun, A., Sewale Belay, A. and Walraevens, K. (2020)
Recharge-Discharge Relations of Groundwater in Volcanic Terrain of Semi-Humid
Tropical Highlands of Ethiopia: The Case of Infranz Springs, in the Upper Blue Nile.
Water, 12, Article No. 853. https://doi.org/10.3390/w12030853
[44] Mfonka, Z., Ndam Ngoupayou, J.R., Kpoumie, A., Ndjigui, P-D., Zammouri, M.,
Ngouh, A.N., Mouncherou, O.F., Mfochivé, O.F. and Rakotondrabe, F. (2019) Hy-
drodynamic and Groundwater Vulnerability Assessment of the Shallow Aquifer of
the Foumban Locality (Bamoun Plateau, Western-Cameroon). Arabian Journal of
Geosciences, 12, Article No. 165. https://doi.org/10.1007/s12517-019-4328-x
[45] Walraevens, K., Vandecasteele, I., Martens, K., Nyssen, J., Moeyersons, J., Gebreyo-
hannes, T., De Smedt, F., Poesen, J., Deckers, J. and Camp, M.V. (2009) Groundwa-
ter Recharge and Flow in a Small Mountain Catchment in Northern Ethiopia. Hy-
drological Sciences Journal, 54, 739-753. https://doi.org/10.1623/hysj.54.4.739
[46] Hemmings, B., Gooddy, D., Whitaker, F., Darling, W.G., Jasim, A. and Gottsmann,
J. (2015) Groundwater Recharge and Flow on Montserrat, West Indies: Insights from
Groundwater Dating. Journal of Hydrology: Regional Studies, 4, 611-622.
https://doi.org/10.1016/j.ejrh.2015.08.003
[47] Lachassagne, P. and Wyns, R. (2005) Aquifère du socle: Nouveaux concepts. Appli-
cation à la prospection et la gestion de la ressource en eau. Géosciences, 2, 32-37.
[48] Ouedraogo, M. (2016) Caractérisation des aquifères de socle pour l’amélioration de
la productivité des forages d’hydraulique villageoise dans le bassin versant du Ban-
dama blanc amont (Nord de la Côte d’Ivoire) (Characterization of Basementaqui-
fers for Improving the Productivity of Boreholes in the Bandama Blanc Watershed
(North of IvoryCoast). Géophysique (physics.geo-ph). Université Paris Saclay (Com-
UE), Paris, 2016SACLS442ff. fftel-02100659v2.
[49] Castany, G. (1963) Traité pratique des eaux souterraines. 2ème édition, 410 figures,
Dunod, Paris, 696 p.
[50] Turc, L. (1961) Évolution des besoins en eau d’irrigation. Évapotranspiration po-
tentielle. Formule climatique simplifiée et mise à jour. Annuaire Agronomie, 12, 13-
49.
[51] Molinero, J. and Raposo, J. (2007) Recharge Estimation and Groundwater Resources
Assessment in Granitic Terrains of Galicia-Costa Hydrographical District (NW Spain).
DOI: 10.4236/jwarp.2021.137028 495 Journal of Water Resource and ProtectionR. Feumba et al.
35th IAH Congress—Groundwater and Ecosystems, Lisbon, 17-21 September 2007,
221-222.
[52] Feumba, R., Ngounou Ngatcha, B., Tabué Youmbi, J.G. and Ekodeck, G.E. (2011)
Relationship between Climate and Groundwater Recharge in the Besseke Watershed
(Douala-Cameroon). Journal of Water Resource and Protection, 3, 607-619.
https://doi.org/10.4236/jwarp.2011.38070
[53] Kili, M., Bouabid, E.M. and Jamal, C. (2008) Bilan hydrique des sols et recharge de
la nappe profonde de la plaine du Gharb (Maroc). Sécheresse, 19, 145-151.
[54] Assemian, EA., Kouamé, F.K., Saley, M.B., Affian, K., Youan, Ta M., Jourda, J.R.
and Biemi, J. (2014) Étude de la productivité d’un aquifère de socle et approche sta-
tistique pour la détermination des tranches de profondeurs potentiellement produc-
tives: cas de la région de Bongouanou, est de la Côte d’Ivoire. Revue des sciences de
l’eau/Journal of Water Science, 27, 81-97. https://doi.org/10.7202/1021984ar
[55] Lachassagne, P. and Maréchal, J.C. (2004) Synthèse des concepts et méthodes de
l’hydrogéologie des milieux volcaniques appliqués à la prospection géothermique.
Études réalisées dans le cadre du projet de recherche Géothermie Haute enthalpie
dans les DOM (GHEDOM)-ENER-04 et suivant la convention n˚0205035 établie
entre le BRGM et l’ADEME; Rapport final BRGM/RP-53135-FR; octobre 2004; 79 p.
[56] Nono, A., Likeng, J.D.H., Wabo, H., Tabue Youmbi, J.G. and Biaya, S. (2009) In-
fluence de la nature lithologique et des structures géologiques sur la qualité et la
dynamique des eaux souterraines dans les hauts plateaux de l’Ouest-Cameroun. In-
ternational Journal of Biological and Chemical Sciences, 3, 218-239.
http://www.ajol.info
https://doi.org/10.4314/ijbcs.v3i2.44516
[57] Choi, B.S. (1999) Determination of Aquifer Characteristics from Specific Capacity
Data of Wells in Cheju Island. Journal of Korean Society on Groundwater Environ-
ment, 6, 180-187. (in Korean)
[58] Hamm, S.Y., Cheong, J.Y., Jang, S., Jung, C.Y. and Kim, B.S. (2005) Relationship
between Transmissivity and Specific Capacity in the Volcanic Aquifers of Jeju Isl-
and. Korea. Hydrogeology Journal, 13, 111-121.
https://doi.org/10.1016/j.jhydrol.2004.12.006
[59] Acheampong, S.Y. and Hess, J.W. (1998) Hydrogeologic and Hydrochemical Frame-
work of the Shallow Groundwater System in the Southern Voltaian Sedimentary Basin
of Ghana. Hydrogeology Journal, 6, 527-537.
https://doi.org/10.1007/s100400050173
[60] Ble, O.L., Ake Soro, T., Etienne, G., Ahoussi Kouassi, E., Oga, M.S., Jean Biémi, J.
and Akossi, D. (2015) Productivity of Water Wells in Crystalline and Crystallophyl-
lian Environment in Daoukro Region (Center-East of the Ivory Coast). Synthèse: Re-
vue des Sciences et de la Technologie, 30, 76-90.
[61] Wyns, R. (2002) Climat, eustatisme, tectonique: Quels contrôles pour l’altération con-
tinentale? Exemple des séquences d’altération cénozoïques en France. Bulletin d'In-
formation des Géologues du Bassin de Paris, 39, 5-16.
[62] Wright, E.P. and Burgess, W.G. (1992) Hydrogeology of Crystalline Basement Aqui-
fers in Africa. Geological Society, London, Special Publications, 66, 1-27.
https://doi.org/10.1144/GSL.SP.1992.066.01.01
[63] Schoeller, H. (1962) Les eaux souterraines: Hydrologie dynamique et statique. Comptes
rendus critiques. 699. Hydrogéologie en chambre Paris, Masson, in-8˚, 187 fig. NF
105, 642 p.
[64] Tabué Youmbi, J.G., Ntamack, D., Feumba, R., Ngnikam, E., Wethé, J. and Tanawa,
DOI: 10.4236/jwarp.2021.137028 496 Journal of Water Resource and ProtectionR. Feumba et al.
E. (2009) Vulnérabilité des eaux souterraines et Périmètres de protection dans un
bassin versant de la Mingoa (Yaoundé, Cameroun). Revue de l’Université de Monc-
ton, 40, 71-96. https://doi.org/10.7202/1001389ar
[65] Djeuda Tchapnga, H.B., Tanawa, E., Siakeu, J. and Ngnikam, E. (1998) Contraintes
sociales liées à la mise en place des périmètres de protection des ressources en eau
dans les zones périurbaines et les petits centres des pays développement. Commu-
nication présentée au 2ème symposium international en gestion et technologies ap-
propriées pour l’eau aux petits ensembles habités. Barcelone (Espagne), Du 13 au 15
octobre 1998, 11 p.
DOI: 10.4236/jwarp.2021.137028 497 Journal of Water Resource and ProtectionYou can also read