Evaluation of water quality and risk of water level declines in semi arid wetland: case of study in the Macta marshes, Algeria - International ...
←
→
Page content transcription
If your browser does not render page correctly, please read the page content below
Proceedings of the International Academy of Ecology and Environmental Sciences, 2021, 11(4): 188-206
Article
Evaluation of water quality and risk of water level declines in semi
arid wetland: case of study in the Macta marshes, Algeria
Fakhr Eddine Tahar Lakhdari1, Zahira Souidi2, Khatir Benhanifia2,3, Souad Mouassa2
1
Department of Ecology and Environment, Faculty of Natural and Life Sciences, Earth and Universe, University of Abou-Bekr
Belkaid Tlemcen, Algeria
2
LRSBG Laboratory, University of Mascara, Algeria
3
Space Techniques Center, Arzew, Algeria
E-mail: fakhro06@yahoo.fr
Received 5 June 2021; Accepted 15 July 2021; Published 1 December 2021
Abstract
The main objective of this research is to diagnose the environment of the Macta marshes located in North-
western Algeria by taking into account their wealth and ecological functioning as a site of importance for
Mediterranean biodiversity. This study is aimed in particular at managers of remarkable sites and those
interested in the protection of the environment in Algeria. The methodology adopted is based on a
spatiotemporal analysis of climatic and hydrologic data as well as on physicochemical analyses of surface
water The results obtained demonstrate a long-term risk of the marshes desiccation and pollution by a
concentration of high nitrates and phosphates, and high dissolved oxygen levels that induce eutrophication, as
well as higher BOD5 values that indicate a high organic load. The follow-up of the organic pollution index
"OPI" shows that the water of the Macta marshes is heavily polluted due to untreated domestic and industrial
wastewater discharges as well as the intensive use of fertilizers which threaten the different habitats and the
ecological functioning of this ecosystem.
Keywords climate change; pollution; water; eutrophication; the Macta marshes.
Proceedings of the International Academy of Ecology and Environmental Sciences
ISSN 22208860
URL: http://www.iaees.org/publications/journals/piaees/onlineversion.asp
RSS: http://www.iaees.org/publications/journals/piaees/rss.xml
Email: piaees@iaees.org
EditorinChief: WenJun Zhang
Publisher: International Academy of Ecology and Environmental Sciences
1 Introduction
Wetlands are particular rich ecosystems that are very important especially for biodiversity preservation. Many
definitions have been given to them; according to RAMSAR Convention (concerning wetlands of international
importance especially water birds habitats) of the 21st Feb. 1971, they are zones where water (fresh, briny, or
salty) stagnates permanently or temporarily (Perillo et al., 2018). This space is an important natural heritage
IAEES www.iaees.org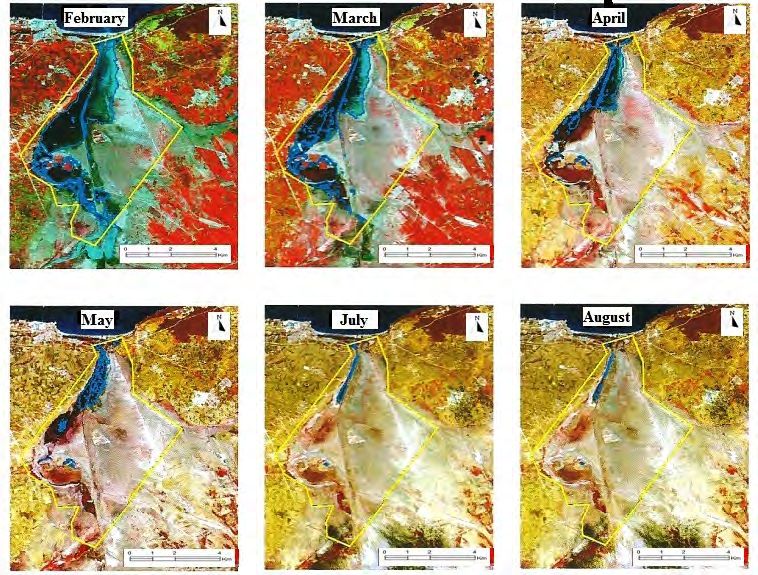
Proceedings of the International Academy of Ecology and Environmental Sciences, 2021, 11(4): 188-206      189

that has essential role for marinating the biodiversity especially that of the migrating birds (Barnaud and
Fustec, 2017).
     The wetlands geographic situation is generally near the coast, or in the favorable valleys for the socio-
economic development what may make them a target for urban, agricultural, or industrial expansion.
Internationally, their surface diminished to 64% and 71% since 1900 (Davidson, 2014).
     These fragile ecosystems are in danger due to the climate change whose consequences may be irreversible
(Zhang and Liu, 2012). Arid and semi-Arid regions are fragile due the potential repercussions of precipitation
decrease and temperature increase. (Winter, 2000; Bouldjedri et al., 2011).
     Eutrophication is the main danger of wetlands of fresh or salt waters pollution. It manifests when the water
receives an exaggerated input of nutritional substances (wastewater or agricultural fertilizers); this increases
algae and aquatic plants production (Doddsw et al., 2009; Le Moal et al., 2019).
     The lack of protection measures led the effects of the increasing human activities such as pumping,
draining, culturing, and grazing to cause the regression of the majority of these ecosystems in the mid or the
long run (OZHM, 2012).
     Algeria contains 1451 wetlands composed of 762 natural zones and 689 artificial ones (DGF, 2017).
Among these, we find Macta marshes in North-western. They have been part of RAMSAR since 2001 (list of
wetlands of international importance) (Ghodbani and Amokrane, 2013), due to the rarity of this type of habitat
in North Africa and the milieu diversity. Macta marshes are characterized with a big diversity of
amaranthaceae annual groups, something that is not found in the rest of the region. The site holds a biological
diversity with big numbers of halophytic plants species, invertebrates, and fish (Megharbi et al., 2016). This
floral diversity provides multiple opportunities for the avifauna especially birds that depend on the aquatic
habitats Podiceps cristatus (great crested grebe) and Phoenicopterus roseus (Greater flamingo) (Samraoui et
al., 2006).
     The previous studies that shed light on wetlands of Macta marshes (Simmoneau, 1952; Tafer, 1993;
Sitayeb and Benabdeli, 2008; Belgherbi and Benabdeli, 2010; Belgherbi, 2011; Ghodbani and Amokrane,
2013; Megharbi et al., 2016; Souidi et al., 2016) described the organization, the structure, and the diversity of
the vegetal community of the marshes. They described many plant groups dominated respectively by
Arthrocnemum macrostachyum, Atriplex halimus, Bolboschoenus maritimus, Juncus maritimus, Limbarda
crithmoides, Phragmites australis, Sarcocornia fruticosa, Schenodorus arundinacea, Suaeda vera, Tamarixa
fricana and Typha domingensis. However, pollution does not only impact the vegetal diversity, but the
touristic nature of Macta marshes wetland.
     This study mainly aims at adding to the existing knowledge on the spatiotemporal variations of the wetland
of Macta marshes during 2017-2019. Furthermore, it aims at contributing to the unknown evaluation of surface
water physico-chemical quality during the study period.

2 Study Area and Methodology
2.1 Study site
The Western Algerian wetlands eco-complex is composed of 7 vast water bodies (Fig. 1) that are not much
shed light on. They contain an important biological diversity. Six of them are RAMSAR statute and play a
vital role for the aquatic avifauna; many faunal species use it during the whole year. Regional climate is semi
arid to a tempered variant of the Mediterranean climate, with a cold winter and a very hot summer, with
average monthly temperatures between 5°C and 35°C. The annual precipitations are at 350 mm. Most of the
sites which rely on pulviometry for their water supply become arid starting from June. The dominating soil
substrate is rich in magnesium chlorides, itonly allows the development of halophilic flora adapted and

IAEES                                                                                                     www.iaees.org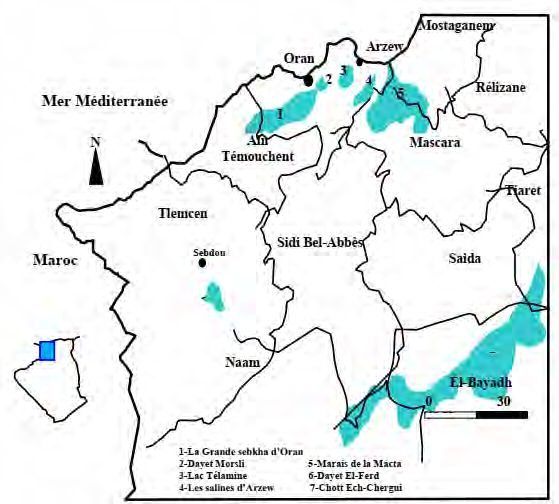
190       Proceedings of the International Academy of Ecology and Environmental Sciences, 2021, 11(4): 188-206

composed mainly of Chenopodiaceae (Atriplex halimus, Atriplex patula, Salsola fruticosa and Salicornia
fruticosa) and of Cruciferae (Moricaundia arvensis, Matthiola fruticosa and Plotaxis muralis) (Beghdadi,
2017).
     The Macta wet zone (35°41’ N, 0°10’ E, of -2 m till 50 m of altitude) is a national property managed by
“forest conservation of Mascara” for the biodiversity tracking. It has 44500 acres occupied by a coastal low,
limited from the East by the Mediterranean, and from the South by Beni-Chougrane Mountains. It is supplied
by rain water, with ground water resurgence, and intermittently by wadis of Sig, Habra, and Tinn (Megharbi et
al., 2016) (Fig. 2).

                                  Fig. 1 West Algerian wetlands map (Beghdadi, 2017).

                                       Fig. 2 Main wadis draining Macta marshes.

IAEES                                                                                                     www.iaees.org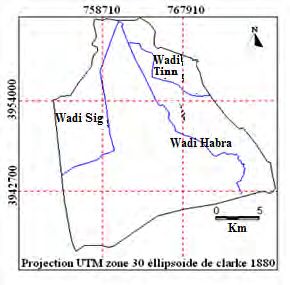
Proceedings of the International Academy of Ecology and Environmental Sciences, 2021, 11(4): 188-206            191

    It is a coastal low with a mouth in the East on the Mediterranean (Arzew Gulf) that is delimited in the
South, East, and West by agricultural lands mainly, and plants formations working as a route especially in the
East (Sahraoui, 2002). Several variants that determine the zone limits exist. The delimitation that seems the
most realistic is the one made by forest services of the region. The file that contains georeferential points of the
boundary determination of the study zone has been got from Mohamadia Forest District. The points have been
reported on the remote sensing image; they form a delimitation polygon of the study zone (Fig. 3)
2.2 Methods
The study takes two aspects: a spatiotemporal tracking of the flooding zones with the help of spatial remote
sensing during 2016, and physicochemical analysis of stagnant waters during the last three years: 2017, 2018
and 2019.

  Fig. 3 Delimitation of the reserved zone of Macta marshes following the boundary determination of the forest services (yellow
  line). Localization of 8 observations stations. Image OLI-Landsat 8, August 2016.

2.2.1 Spatiotemporal tracking
Climatic data analysis (Average temperature and total precipitations) classified into two periods (1950-1983
and 1984-2017) has been realized to estimate the climatic evolution in this region since 1950. The exploited
climatic data are those of the nearest Metrologic station of Sidi Abd El Moumen (35°41’ N, 0°10’ E, 21 m
altitude).
     As for the spatial analysis, we used Landsat 8 satellite images, with free access that cover Macta region
during 2016. To measure the variation of surface water coverage, we relied on the index of water content by
Normalized Difference Water Index (NDWI) called GAO (1996) that uses Short Wave Infra-Red (SWIR) and
a Near Wave Infra-Red (NWIR):
                                      NDWI = (NWIR - SWIR) / (NWIR + SWIR).
2.2.2 Physicochemical analysis
Eight representative stations of the flooding zone have been implemented for the marshes physicochemical
characteristics tracking on the field. These eight measuring stations have been chosen to maximize Macta

IAEES                                                                                                          www.iaees.org
192 Proceedings of the International Academy of Ecology and Environmental Sciences, 2021, 11(4): 188-206
marshes water physicochemical quality diversity according to different points for water sampling and analysis.
The priority was given to 3 main wadis that feed the marshes: wadi Sig (Station 1), wadi Harba (Station 2),
and wadi Tinn (Station 3), and at the marshes mouth (Stations 4 and 5) where the wadis pour in the
Mediterranean (Fig. 2). Furthermore, we took into consideration the zones that are close to the agricultural
fields (Stations 6 and 7) and the zones polluted by the illegal dumping (Station 8).
For every station, since 2017 till 2019, many parameters have been measured on the site (conductivity,
temperature, dissolved oxygen, and pH) using portable measuring devices. In every station, water samples
were put in 1.5 L flasks and analyzed in the laboratory (Orthophosphates, sulphates, ammonium, nitrites,
nitrates and Biochemical oxygen demand (BDO5) by approved methods (RODIER, 1996).
3 Results and Discussion
3.1 Seasonality and climatic evolution
In order to understand Macta marshes desiccation phenomenon, an analysis of the climatic data has been made.
The examination of the temperatures and precipitations registered by the meteorological stations of Sidi Abd
El Moumen during 1950-83 and 1984-2017 reveal important variations.
Moreover, the temperature witnessed an important increase between the two analyzed periods (Fig. 4). If,
between 1950-83 and 1984-2017, from January to April temperatures saw a slight decrease between -0.1°C
and -0.5°C, from May to December, a big increase had been witnessed especially in the beginning of the
summer period with +1.5°C in May and +2.1°C in October. Generally, the annual average temperature
increased +0.7 between the two analyzed periods, passing from 18.3°C during 1950-83 to 19°C during 1984-
2017.
30
Period 1950‐1983
25
Period 1984‐2017
Temperature (°C)
20
15
10
5
0
J F M A M J J A S O N D
Fig. 4 Average monthly temperature evolution between 1950-83 and 1984-2017 at the Metrologic Station of Sidi Abd El
Moumen.
We notice clearly seasonality in these temperature variations. Furthermore, the summer period (May to
October) witnessed a net temperature increase (+1.3°C) passing from 23°C to 24.3°C. On the other side, the
average temperature of the other 6 months (November to April) kept almost unchanged, passing from 13.6°C
to 13.7°C. The hot months, when the annual average temperature is superior to 20°C, were 4 (June to
IAEES www.iaees.orgProceedings of the International Academy of Ecology and Environmental Sciences, 2021, 11(4): 188-206 193
September) during 1950-83, and they are 6 months for the period 1984-2017. On the other hand, cold months
(between 10°C and 15°C) kept unchanged between the two analysis periods (December to March).
Precipitation evolution between 1950-83 and 1984-2017is presented in Fig. 5, It reveals that the period
1950-1983 was much wetter with an average annual precipitation of 356.4 mm, whereas the precipitation
recorded during the period 1984-2017 was only 243 mm, i.e. a decrease of -32% in the precipitation between
these two 34 year periods.
This precipitation deficit is almost generalized; only the month of September has become slightly wetter
(17.6 mm during the recent period against 11.7 mm during the years 1950-1983). July, August, and November
have an unchanged pulviometry (Fig. 5). Contrary to this, the other 8 months witness a precipitations decrease,
systematically superior to 10%. It is December that witnesses a big change: in the past it was the most humid
month (62.8 mm), it is the 5thwatered month during these last decades (24.3) causing a major deficit of -61%.
It is clear that this major pulviometric deficit registered in these last decades had a significant impact on Macta
marshes drying.
70
Period 1950‐1983
60
Period 1984‐2017
50
Precipitations (mm)
40
30
20
10
0
J F M A M J J A S O N D
Fig. 5 Monthly precipitations evolution between 1950-83 and 1984-2017 at Sidi Abd El Moumen Meteorological Station.
From the ombrothermic diagrams of Bagnouls and Gaussen (1953) (Fig. 6), it appears that the dry period
extended between the two periods. In fact, temperature increase combined with precipitation decrease led
the dry period, from (May to September)during the period 1950-1983, to extend with two additional
months (April to October).
IAEES www.iaees.org194 Proceedings of the International Academy of Ecology and Environmental Sciences, 2021, 11(4): 188-206
1950‐1983 1984‐2017
70 35 70 35
Precipitations Precipitations
60 30 60 30
50 25 50 25
40 20 40 20
P (mm)
P (mm)
T (°C)
T (°C)
30 15 30 15
20 10 20 10
10 5 10 5
0 0 0 0
J F M A M J J A S O N D J F M A M J J A S O N D
Fig. 6 Ombrothermic diagrams of Bagnoul and Gaussen for the periods 1950-83 and 1984-2017.
The biological diversity that characterizes Macta marshes preserved zone is a biotic and favorable abiotic
environment. In fact, the humid milieu that characterizes the region is the key of the appropriate floral and
faunal diversity existence. However, this humid milieu remains conditioned by essential climatic factors that
manifest in the quantity of precipitations that allow the accumulation of flood water in the marshes during
winter, in addition to the evaporation rate of the ground humidity related to the high temperatures in summer.
The desiccation has been accentuated by the dams that poured out Macta basin and the important large suction
pipes for wadis water on the tributaries. These operations provoked the decrease of flows that supply the
marshes, and hence, the alteration of the ecological equilibrium of this wet zone (Meddi et al., 2009).
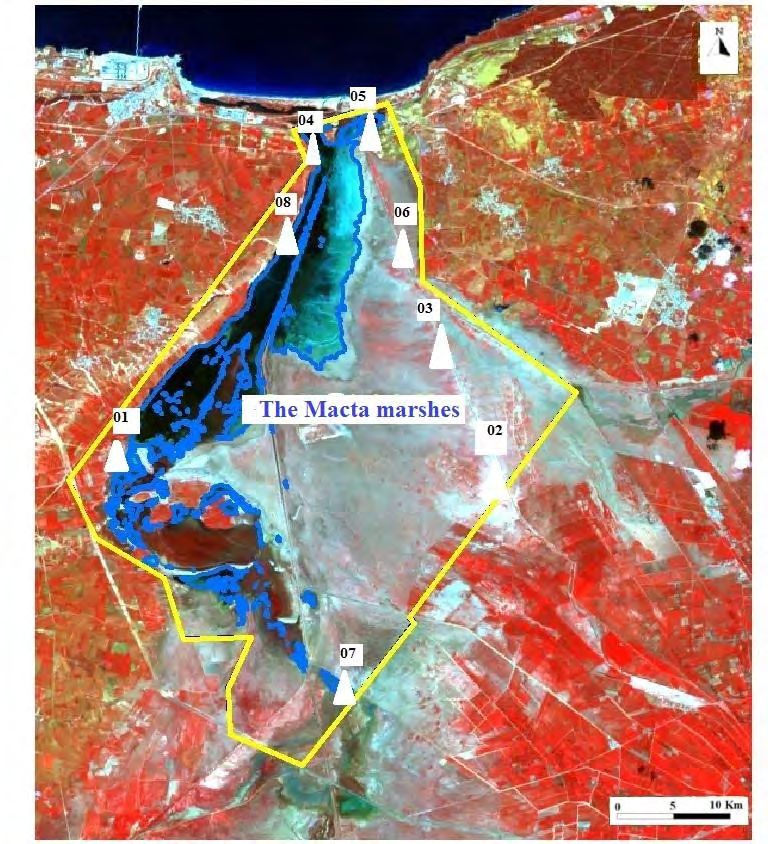
The seasonal desiccation of Macta marshes has generally 3 phases (Fig. 7):
Contraction phase and water column reduction: after the winter (April and May) cause more or less
important modifications in the physicochemical and hydrological traits of the habitat.
“Desiccation phase: in the peak of the summer period (July and August) characterized with a complete
disappearance of the water column.
Re-watering phase: in winter (February and March) corresponds to the temporary coming back of the water
column.
IAEES www.iaees.orgProceedings of the International Academy of Ecology and Environmental Sciences, 2021, 11(4): 188-206 195
Fig. 7 monthly variations at the level of water (in blue) in Macta marshes (wet zone delimitation in yellow) (Images OLI
Landsat 8; 2016).
The desiccation due to the water volume decrease increases the organic and mineral nutriments
concentration, and significantly amends the trophic state of the hydro systems, in the stagnant waters
particularly (Lofgren, 2002)
A big part of the Macta marshes desiccation since 1990s encouraged the local residents to use this
ecosystem. Agricultural fields expansion (mainly cereal) has been observed. Herbaceous layer richness
attracted the nomads and their flocks (Benabdeli and Mederbal, 2004).
Water receding in the dry months and the change that may appear in the state of the biotic and abiotic
milieu highlights the need for dynamic map of waters during the year (Fig. 8). Two periods mark this wet zone:
the flooding period (December to March) marked with a maximal water volume due to winter rains (Fig. 5),
and desiccation period (July to August) where the quality of water decreases to the lowest due to a lack of
precipitations and the high summer temperatures (Fig. 4).
IAEES www.iaees.org196 Proceedings of the Internatioonal Academy of Ecology and
d Environmentaal Sciences, 20221, 11(4): 188-2
206
Fig. 8 Macta marshes water dynamics (20116).
3.2 Wateer quality in Macta wetlaand
Due to thhe physicochhemical qualitty characterizzation of the marshes watter, we got innterested in so ome physicall
and chem mical parameeters namely temperature (°C), pH, co onductivity, dissolved
d oxyygen (O2), niitrate (NO3-),,
nitrate (NNO2-), ammoonium (NH4+), ) orthophospphate (PO4-3),, sulphates (S SO4) and biocchemical oxy ygen demandd
(BDO5) in i different stations
s of thee marshes. Thhe obtained results
r allow us to charactterize the millieu in Mactaa
marshes according to the samplingg stations.
3.2.1 Tem mperature (°C C)
It is impoortant to knoww the water temperature
t p
precisely as itt plays a role in solubility of salt and gaas especially,,
drying ouut of dissolveed salt and heence the electrical conducctivity, pH deetermination, finding wateer origins andd
eventual mixtures, etcc.
Moreeover, this measure
m is so useful in limmnology stud dies and the industrial view for therm mal exchangee
calculatioon (Rodier, 2005). In aqquatic ecosysstems, water temperaturee controls alll chemical reactions r andd
affects fiish growth, reeproduction, and
a immunityy. All biologiical and chem mical processees depend on temperature..
It affectss water O2 conntent (dissolvved oxygen leevels decreasee when the teemperature inncreases).
IAEES www.iaees.org
wProceedings of the International Academy of Ecology and Environmental Sciences, 2021, 11(4): 188-206 197
Temperature variations results in the studied stations are represented in Fig. 9. Temperature at the level of
the 8 stations of the marshes varies from 18 to 25.6 °C. Fish in the Macta marshes are mainly those which need
a temperature between 18 to 25°C to reproduce especially during summer such as cornflower, carp, and
sardine. The highest temperatures were registered in stations 6 to 8 where water innovates slowly (stagnant)
what may accelerate the eutrophication in these spaces (Fig. 9).
3.2.2 Hydrogen Potentials (pH)
pH is an important parameter for the definition of aggressive or encrusting traits of water. It intervenes in this
process with other parameters such as hardness, alkalinity, temperature, etc. It corresponds to hydrogen ions,
and measures the acidity or basicity of the water (Aminot and Kerouel, 2004).
Natural water pH is related to the nature of the land crossed (Djezzar et al., 2018). It is an important
element to determine the aggressive or encrusting traits of water. It depends on the characteristics of the
drainage basin, seasonal variations, and streams crossed. It must be between 6 and 8 to allow Macta marshes
fauna and flora to grow normally.
pH monthly values of Macta marshes water vary between 8.2 and 8.4 indicating a weak water to mildly
alkaline; hence, a big CO2 consumption leading to an increase in bicarbonates’ concentration (Bou Saab et al.,
2007). This provokes a reduced photosynthetic activity responsible for pH increase in the marshes; this
coincides with high temperatures during summer and weak oxygen values (Gouasmia et al., 2016). pH results
show that pH is systematically above 8. Highest values are registered in Station 1 (wadi Sig: 8.4) and Station 2
(wadi Habra: 8.3). Alkalinity in these stations is due to the presence of substances, micro-organisms and
elements of natural origin coming from the wadis that cross the marshes, and can be related to anthropogenic
effects through wastewater evacuation and industrial waste (Two factories are found ahead the wadis) and
drainage of agricultural lands loaded with fertilizers (Fig. 9).
3.2.3 Conductivity
Conductivity is a general measure for water quality and total quantity of dissolved salt. Conductivity
measurement allows evaluating water global mineralization (Rejsek, 2002) that may cause a salty taste
depending on the salt nature. Conductivity is water temperature function. Variations of factors climatic
conditions are also a source of variation of mineralization. Indeed, during the rainy season, concentrations
decrease due to dilution by rainwater. On the other hand, during the dry season, significant evaporation leads
to an increase in the concentrations of mineral ions (Boulaksaa et al., 2020). Conductivity measurement allows
evaluating water global mineralization and following its evolution (Han et al., 2011). Surface water must have
an ideal conductivity for dwellers of the aquatic milieu between 300 and 1200 µS/cm. If water has a
conductivity that is inferior to 100, we can conclude that it is poor in ions. Water whose conductivity is
superior to 1000 µS/cm indicates strong mineralization. Electrical conductivity fluctuates between 804 and
1420 µS/cm (Fig. 9) is indicated a strongly mineralized water. Electrical conductivity is mainly high at stations
1 and 2.
Wastewater rejected by wadis characterizes generally the very high concentrations of dissolved elements
which increase electrical conductivity in the marshes due the chloride presence, phosphate, and nitrate.
Marshes water conductivity average increases to 1126 µS/cm. The marshes zone geological nature affects
conductivity values, clay soils that characterize the Macta basin seem to increase the conductivity due to the
presence of materials that ionize during runoff. Thus, we can say that marshes water mineralization is as
important compared to the standards.
3.2.4 Dissolved Oxygen
IAEES www.iaees.org198 Proceedings of the International Academy of Ecology and Environmental Sciences, 2021, 11(4): 188-206
Dissolved oxygen is mainly composed of water. It allows fauna and flora life, and conditions the biological
reactions that take place in aquatic ecosystems. In waste water treatment, it is necessary for the degradation of
polluting materials that are made mainly in aerobiosis (Cardot and Gilles, 2013).
According to the Algerian standards, water has a good quality when dissolved oxygen content is superior
to 95%. From 50% to 95%, water is considered of mediocre to little pollute. When dissolved oxygen content is
inferior to 50%, water is considered polluted and of poor quality (ONA, 2014). Dissolved oxygen contents are
relatively homogenous in Macta marshes, of a mediocre quality at the 8 sampling stations with an average rate
of 74.7% (Fig. 9). Extreme values are 68.3 at station 7 and 83.7% at Station 1.
Macta marshes waters present a poor oxygenation. Domestic wastes contribute to the decrease of dissolved
oxygen contents, the latter being consumed by micro-organisms to degrade the risk of the organic substance of
being late and to endanger the marshes aquatic life.
3.2.5 Orthophosphates (PO4-3)
Elemental phosphorus (P) is rare. In the nature, it generally exists in the form of phosphate molecule (PO4).
Organic or inorganic phosphorus may be dissolved or in suspension in water (Spellman, 2014).
Phosphorus is considered as a main nutritional element for the development of trophic chains (Rodier,
1996). It induces an excessive development of phytoplankton. Inherited phosphorus in sediments can exert
control over wetland condition; this is a critical factor that typically hinders restoration efforts in freshwater
systems affected by anthropogenic activity (Kim et al., 2021). Enrichment in orthophosphates is considered to
be due, at the origin, to eutrophication phenomenon (Hennizurgui, 2009). There are many sources of
phosphorus, natural (rocks) and anthropogenic (fertilizers, dung, wastewater, detergent, etc). High
concentrations of phosphorus may trigger an undesirable chain of events such as plants accelerated growth,
algae proliferation, weak dissolved oxygen content, and death of some fish, invertebrate and other aquatic
animals. Based on the values of national office of sanitation (ONA, 2014) in Algeria, the ideal phosphate
content for a good quality of natural water is at 0.1 to 0.2 mg/l. Orthophosphates concentrations (PO4-3) are
very low at the sampling stations and are systematically under the threshold of 0.1 mg/l (Fig. 9). Registered
values at the station of the marshes mouth are due to water supplies of streams and wadis, rich in fertilizers
used in agricultural fields that accumulate and concentrate to the point of confluence of the 3 wadis (Station 4).
In fact, the cultivated area was 9751 acres in 2001 to 14.688 acres in 2008 i.e. an increase of 50% in 7 years.
Arboriculture developed as well, passing from 8075 acres in 2001 to 8819 acres in 2008 (Belgherbi, 2011).
Phosphorus ions presence in the marshes has domestic and industrial origins. Wastewater from different
districts in the study zone is at 35104 m³/day, equal to equivalent to 12.812.960 m3/year. Potassium used in
nutritional oil conservations thrown in wadis is another cause. In fact, more than 494 institutions have been
numerated near the two agglomerations of the study zone, namely Moahmadia and Sig. Cattle rising, namely
poultry farming, is an important activity in the study zone.
3.2.6 Sulphates (SO4)
Natural origins of sulphates are of the rain water and evaporitic sedimentary rocks solutionizing, especially
gypsum (CaSO4 2HO2), but also pyrite (FeS) and more rarely magmatic rocks (galena, blende, pyrite) (Ghazali
and Zaida, 2013).
Sulphates are necessary elements for the growth of aquatic plants; however, an excess may limit the
biological production (Rodier, 2005). Surface waters have very variable sulphates contents. In an ordinary
situation, these contents are inferior to 20mg/l; in a dubious situation (polluted water), they are between 20 to
120 mg/l; and in an abnormal situation (very polluted water), they are superior to 120 mg/l (Devillers et al.,
2005). Registered values of sulphates vary from one station to another (Fig. 9). A maximum of 34.3 mg/l is
noticed at Station 1 (wadi Sig) tough the minimum is 19.2 mg/l at Station 8 (illegal dumping). Six stations out
IAEES www.iaees.orgProceedings of the International Academy of Ecology and Environmental Sciences, 2021, 11(4): 188-206 199
of eight have “polluted” water with contents superior to 20 mg/l. Marshes waters are polluted mainly by wadi
Sig discharge. This may be due to the increase of sulphide-containing waste of urban and mainly industrial
waste (industrial zones of Sig and Fornaka) though the important contents registered at Stations 6 and 7 near
the agricultural field may be due to extensive agricultural activities, also the use of copper sulphates CuSO4 as
rodenticides. Agricultural field’s expansion of the region is mainly due to nomadic settlements and the sheep
and cattle ranching increase (DSA, 2009). But, in arid and semi-arid regions, causes of sulphates increase may
be due to soluble salts that may accumulate 15 cm of the terrestrial surface (APHA, 2005).
3.2.7 Nitrites (NO2-)
Nitrites presence in water may be due to incomplete oxidation of nitrogenous composed (organic nitrogen or
ammoniac); it corresponds to an intermediate level and their concentration is generally inferior to 1 mg/l
(Rejsek, 2002).
According to De Villiers et al. (2005), nitrites values of surface waters vary between 0.01 to 0.1 mg/l
indicating a dubious situation (polluted water).
Our findings show that nitrites contents vary between 0.16 and 0.29 mg/l with an average concentration of
0.21 mg/l. The highest values are registered at the mouth station (Fig. 9). This indicates a water pollution of
the wet zone. These concentrations of nitrites in water of Macta marshes may be explained by the organic
substance decomposition with the nitrification phenomenon that comes from the decrease of nitrates under the
influence of bacteria (Dovonou et al., 2011).
3.2.8 Nitrates (NO3-)
Nitrates are found in naturel and soluble states in the soil. They penetrate underground water and pour in water
streams. But, they are also synthetic substances brought by fertilizers (Haller et al., 2013). They are one of
water quality degradation causes.
They are used as a pollution index. They fertilize plants that assimilate nitrogen in the form NO3-
(Djermakoye, 2005).
Nitrates contents histogram (Fig. 9) shows a variation of 0.26 mg/l at Station 2 with much lower
concentrations (0.024 mg/l) at station 8. These nitrates values in Macta marshes water are acceptable according
to the standards that vary between 2.21 to 10.17 mg/l. Eutrophication risk starts at a nitrates concentration
superior to 10 mg/l (Corriveau, 2009). Nitrates can be carried by runoff into the wadis that supply the marshes.
These concentrations, though they are low, may be subject of organic substance decomposition by nitrification
phenomenon; this confirms the wastewater discharge and the illegal dumping in wetland of Macta on the most
important concentration at the wadis.
3.2.9 Ammonium (NH4+)
NH4+ presence in relatively important quantities may indicate of pollution due to human, industrial wastes and
fertilization in agriculture (Martínez-Dalmau et al., 2021). NH4+ ideal content in surface water is normally
between 0.04 and 0.08 mg/l (ANRH, 2008).
The measured values in marshes waters vary between 0.076 to 0.21 mg/l (Fig. 9). The highest values are
registered at Station 1(wadi Sig) and 4 (mouth). This indicates that the presence of NH4+ in these two stations
comes from dejections of living organisms and the decrease biodegradation of waste, without forgetting the
domestic and agricultural causes. The demography of all the municipalities in the study area a total population
of 269,860 inhabitants, i.e. an average density of 222 inhabitants/km². This agglomerated population of almost
80% concentrates in big cities around the marshes mainly the city of Sig (DE, 2014). This confirms the
important discharge of wadi Sig with a very polluting effect on the marshes. The concentrated discharge at the
mouth may have a negative impact on the Mediterranean, namely in region swimming areas which may cause
allergies and diseases to the habitants.
IAEES www.iaees.org200 Proceedings of the International Academy of Ecology and Environmental Sciences, 2021, 11(4): 188-206
Temperature (°C) pH Conductivity (μs/cm)
30 9 1600
25
8.5 1200
20
15 8 800
10
7.5 400
5
0 7 0
S1 S2 S3 S4 S5 S6 S7 S8 S1 S2 S3 S4 S5 S6 S7 S8 S1 S2 S3 S4 S5 S6 S7 S8
Dissolved oxygen (%) Orthophosphates (PO4‐3) Sulphates (SO4) (mg/l)
(mg/l)
100 40
0.1 35
80
0.08 30
60 25
0.06 20
40 0.04 15
10
20 0.02
5
0 0 0
S1 S2 S3 S4 S5 S6 S7 S8 S1 S2 S3 S4 S5 S6 S7 S8 S1 S2 S3 S4 S5 S6 S7 S8
Nitrates (NO3‐) (mg/l) Nitrites (NO2‐) (mg/l) Ammonium (NH4+) (mg/l)
0.3 0.35 0.25
0.25 0.3
0.2
0.25
0.2
0.2 0.15
0.15
0.15 0.1
0.1
0.1
0.05 0.05
0.05
0 0 0
S1 S2 S3 S4 S5 S6 S7 S8 S1 S2 S3 S4 S5 S6 S7 S8 S1 S2 S3 S4 S5 S6 S7 S8
Fig. 9 Physicochemical parameters variations at the eight stations (S1 to S8) in Macta marshes in the years (2017, 2018 and
2019).
3.2.10 Biochemical oxygen demand (BOD5)
The aerobic decomposition of organic substances in water by microorganisms is a sort of slow oxidation.
Aerobic microorganisms require a quantity of oxygen proportional to the organic load (Copin-Montégut, 1996).
As long as there is consumable oxygen, microorganisms will use it for their microorganisms will use it for
IAEES www.iaees.orgProceedings of the International Academy of Ecology and Environmental Sciences, 2021, 11(4): 188-206 201
their degradation work. The quantity of oxygen required by them is the biochemical oxygen demand
(Djouamaa, 2011).
The highest values are recorded at Stations 1 (wadi Sig) and 4 (the mouth) between (20 and 50 mg/l) where
the dissolved O2 content reaches the lowest value of 69.85% in the mouth with a more or less high temperature.
When the temperature rises, the O2 content decreases due to its increased consumption by living things (plant
respiration) and bacteria which multiply using organic carbon as an energy source which translates into a high
biochemical demand for O2 (high DBO). It is a phenomenon of natural self-purification in water (Rodier,
2005). It is admitted that a DBO5 value above 25 mg/l can be an indication of polluted water quality (Beaux,
1998). These high values correspond to a high load of organic matter coming mainly from the agro-food
industries (Daiekh, 2015), and the use of fertilizers, pesticides and insecticides in agriculture near the marshes.
3.2.11 Organic Pollution Index (OPI)
The Organic Pollution Index (OPI) was first proposed by Leclercq and Maquet (1987). This index makes it
possible to assess the chemical quality of waters impacted by actual organic pollution from the parameters
biological oxygen demand (BOD5), Orthophosphates (PO4-3), nitrite (NO2-), ammonium (NH4+) (Table 1).
The principle of the OPI is to spread the values of polluting elements in 5 classes (Table 2) and then
determine, from its own measures, the number of corresponding class for each parameter and then to make the
average. It is therefore, a revealing indicator of pollution of organic origin (domestic or agricultural) (Mezbour
et al., 2018).
Our results show that the OPI values varied between 2.25 and 3.25 with an average value is 2.87 (Table 3).
We note that the water changes from one quality to another (moderate organic pollution to strong organic
pollution), the lower values indicate a strong organic pollution (OPI = 2, 25 and 2.75) are recorded at the
stations of the mouth (Stations 4 and 5), wadi Habra (Station 2) and wadi Tinn (Station 3). These values of the
OPI in the water of the Macta Marshes can be explained by a marked degradation of the water quality of the
wetland by the discharges of sewage and industrial waste from the agglomerations of Fornaka and
Mohammedia.
Table 1 The quality grid (OPI).
BOD5 Ammonium Nitrites Phosphates
-1 -1 -1
Classes (mg O2.L ) (mg N.L ) (µg N.L ) (µg N.L-1)
5 15 >6 >150 > 900
OPI = average of the class numbers of the 04 parameters.
IAEES www.iaees.org202 Proceedings of the International Academy of Ecology and Environmental Sciences, 2021, 11(4): 188-206
Table 2 Classes of OPI and degrees of pollution.
Average of classes Level of organic pollution
5,0- 4,6 Nothing
4,5- 4,0 Low
3,9- 3,0 Moderate
2,9-2,0 Strong
1,9-1,0 Very strong
Table 3 Organic pollution index (OPI).
Station Station 1 Station 2 Station 3 Station 4 Station 5 Station 6 Station 7 Station 8
OPI 3,25 2,75 2,75 2,25 2,5 3,25 3,25 3
4 Conclusion
The Macta wetland represents a particular very diverse territory. It is appreciated for its aquatic landscape and
the faunal and floral abundance and variety; they are the most visible elements. However, this ecosystem’s
specific properties give other major functions namely regarding the water resources and the ecologic quality of
this milieu.
Current climatic changes in the region of Macta are incarnated in a decrease of precipitations and a big
increase of evapotranspiration menacing this ecosystem. In the absence of protection measures, the growing
human activities may cause the regression of the majority of the site in the mid or long term. These factors are
one of the causes of desiccation risk.
Obtained results show phosphates are very important in addition to their superior dissolved oxygen contents
wit conductivities between 804 and 1420 µs/cm. Thus, the site is polluted raising eutrophication risk.
The analyses carried out have shown that the Macta wetland is affected by strong organic pollution in the
majority of the stations. This pollution was mainly caused by an excess of ammonium and high values of the
biological oxygen demand.
One of the last aggressions against this natural milieu is domestic wastewater discharge (there is no
epuration station ahead) and industrial waters in the wadis coming from the activity zone of Sig and Fornaka
cities which accumulate and stagnate in the wetland. Unfortunately, it is the main cause of pollution.
The results of this work confirm therefore a risk of degradation the water of this wetland.
In order to preserve and improve sustainably the ecosystem of Macta marshes, the authorities must stop
these negligence that lasts and leads to an irreversible destruction of this site that has been classified since
2016 as a zone of international importance for the fauna and flora and birds by the International United for the
Conservation of Nature; the zone is a hotspot of the Mediterranean region biodiversity.
IAEES www.iaees.orgProceedings of the International Academy of Ecology and Environmental Sciences, 2021, 11(4): 188-206 203 References Aminot A, Kerouel R. 2004. Hydrologie des écosystèmes marins paramètres et analyses. Ifremer Brest, Direction de l’environnement et de l’aménagement littoral, France ANRH (National Water Resources Rgency). 2008. Bulletins mensuels de la qualité des eaux superficielles. Oran, Algérie APHA (American Public Health Association). 2005. Standards Methods for The Examination of Water and Wastewater (21st edn). American Public Health Association, Washington DC, USA Bagnouls F, Gaussen H. 1953. Saison sèche et indice xérothermique. Bulletin de la Société d’histoire naturelle de Toulouse, 88: 193-239 Barnaud G, Fustec E. 2007. Conserver les zones humides: pourquoi? comment? Editions Quae, Versailles, France Beaux JF. 1998. L’environnement » Repères pratiques. Nathan, Algérie Beghdadi F. 2017. Importance des zones humides de la Macta (Nord-ouest algérien) pour l’avifaune aquatiques: écologie, parasitologie et distribution spatio-temporelle. Thèse de doctorat en sciences, Université de Guelma, Algérie Belgherbi B, Benabdeli K. 2010. Contribution à l’étude des causes de dégradation de la forêt de Tamarix de la zone humide de la Macta (Algérie occidentale). Forêt méditerranéenne, XXXI: 59-68 Belgherbi B. 2011.Contribution à l’étude phytoécologique et préservation de la biodiversité de la zone humide de la Macta (Algérie occidentale). Thèse de doctorat en sciences, Université de Tlemcen, Algérie Benabdeli K, Mederbal K. 2004. Contribution à l’étude phytoécologique sur la zone humide de la Macta. Rapport d’expertise, Algérie Boulaksaa K, Laifa A. 2020. Évaluation de la pollution azotée minérale des eaux superficielles de la zone humide Ramsar du lac Fetzara (Nord-Est algérien). Revue des Sciences de l’Eau. Journal of Water Science, 32(4): 409-419 Bouldjedri M, De Belair G, Mayache B, Muller SD. 2011. Threats to and conservation of North African wetlands: The case of the Ramsar site of Beni-Belaid (NE Algeria). Comptes Rendu Biologies, 757-772 Bou Saab H, Nassif N, El Samrani AG, Daoud R, Medawar S, Ouaini N. 2007. Suivi de la qualité bactériologique des eaux de surface (rivière ahr Ibrahim, Liban). Journal of Water Science, 20: 341-352 Cardot C, Gilles A. 2013. Analyse des eaux: réglementation, analyses volumétriques et spectrophotométriques, statistiques: cours et exercices corrigés. Ellipses Eds, Paris, France Copin–montégut. G . 1996. Chimie de l’eau de mer. Collection « synthéses » institut océanographique, Paris, France Corriveau J. 2009. Étude des concentrations toxiques de nitrite dans les cours d'eau d'un bassin versant agricole. Thèse de doctorat en Sciences de l'eau, Université du Québec INRS-ETE, Canada Daiekh A. 2015. Etude de la richesse et de la structure des communautés végétales dans la zone humide de la Macta dans l'ouest Algérien: influence des activités humaines, Thèse de master en sciences en écologie, Université de Mascara, Algérie Davidson NC. 2014. How much wetland has the world lost? Long-term and recent trends in global wetland area. Marine and Freshwater Research, 65: 934-941 DE (Direction of Environment ). 2014. Étude d’aménagement de la zone humide la Macta, wilaya de Mascara, document technique (chapitre 2). Socio-économie, Algérie Devillers J, Squilbin M, Yourassowsky C. 2005. Qualité physico-chimique et chimique des eaux de surface: cadre général. Fiche 2, Institut Bruxellois « IBGE » pour la gestion de l’environnement/observatoire des données de l’environnement, Algérie IAEES www.iaees.org
204       Proceedings of the International Academy of Ecology and Environmental Sciences, 2021, 11(4): 188-206

DGF (Directorate General of Forests). 2017. Inventaire des zones humides en Algérie. Atlas des zones humide
   en Algérie. Algérie
Djermakoye H. 2005. Les eaux résiduaires des tanneries et de teintureries : Caractéristique----+ physico-
   chimiques, bactériologiques et impact sur les eaux de surface et les eaux souterraines. Thés Doc Pharmacie.
   Université de BAMAKO, Algérie
Djezzar S, Ghernaout D, Cherifi H, Alghamdi A, Ghernaout B, Aichouni M.2.018. Conventional, enhanced,
   and alkaline coagulation for Hard Ghrib Dam (Algeria) Water. World Journal of Applied Chemistry. 3(2):
   41-55
Djouamaa M. 2011. Caractérisation physico-chimique et bactériologique d’une zone humide « Wetland » à El
   Oued en vue de sa rehabilitation. Thèse de magister en sciences en biologie, spécialité: Biotechnologie,
   Université de Bisekra, Algérie
Doddsw K, Bouska WW, Eitzmann JL, Pilger TJ, Pitts KL, Riley AJ, Schloesser JT, Thornbrugh DJ. 2009.
   Eutrophication of US freshwaters: analysis of potential economic damages. Environmental Science and
   Technology, 43: 12-19
Dovonou F, Aina M, Boukari M, Alassane A. 2011. Pollution physico-chimique et bactériologique d’un
   écosystème aquatique et ses risques écotoxicologiques: cas du lac Nokoue au Sud Benin. International
   Journal of Biological and Chemical Sciences. 5(4): 1590-1602
DSA (Directorate of Services Agriculture). 2009. Bilan annuel sur l’activité agricole et pastorale dans la
   plaine de Sig et d’El habra. Document technique, Wilaya de Mascara, Algérie
Dussart BH. 1966. Limnologie: Etude des eaux continentales (Gauthier -Villars ed). Paris, France
Ghazali D, Zaida A. 2013. Etude de la qualité physico-chimique et bactériologique des eaux de la source AIN
   SALAMA-JERRI (région de MEKNES –MAROC). Algérie
Ghodbani T, Amokrane K. 2013. La zone humide de la Macta : un espace à protéger sur le littoral ouest de
   l’Algérie. Rev Physio-Géo, 7: 139-155
Gouasmia G, Amarouayache M, Frihi H, Kara MH. 2016 . Caractérisation physico-chimique de trois lacs
   salés permanents de la vallée d’oued righ (Sahara septentrional, Algérie nord-est). Revue d’Ecologie, 71:
   330-341
Haller L, McCarthy P, O'Brien T, Riehle J, Stuhldreher T. 2013. Nitrate pollution of groundwater. Alpha
   Water Systems Inc, CA, USA
Han D, Kohfahl C, Song X, Xiao G, Yang J. 2011. Geochemical and isotopic evidence for palaeo-seawater
   intrusion into the south coast aquifer of Laizhou Bay, China. Applied Geochemistry, 26: 863-883
Hennizurgui N. 2009. Caractéristiques physico-chimiques et inventaire des cyanobactéries et des Phycophytes
   au niveau du lac El-Goléa. 15-16, Mémoire d’ingénieur d’état en Aquaculture, Université KasdiMerbah
   Ouargla, Algérie
Kim DK, Yang C, Parsons T, Bowman J, Theysme T, Arhonditsis GB. 2021. Eutrophication management in a
   Great Lakes wetland: examination of the existence of alternative ecological states. Ecosphere, 12(2):
   e03339
Leclercq L, Maquet B. 1987. Deux nouveaux indices chimique et diatomique de qualité d'eau cou-rante.
   Application au Samson et à ses affluents (Bassin de la Meuse Belge). Comparaison avec d'autres indices
   chimiques, biocénotiques et diatomiques. Documents de travail, Royal Belgian Institute of Natural
   Sciences, 38: 1-113
Le Moal M, Gascuel-Odoux C, Ménesguen A, Souchon Y, Étrillard C, Levain A, Moatar F, Pannard A,
   Souchu P, Lefebvre A, Pinay G. 2019. Eutrophication: A new wine in an old bottle? Science of the Total
   Environment, 651: 1-11

IAEES                                                                                                     www.iaees.org
Proceedings of the International Academy of Ecology and Environmental Sciences, 2021, 11(4): 188-206      205

Lofgren B. 2002. Global warming influences on water levels, ice, and chemical and biological cycles in lakes:
    some examples. In: Fisheries In A Changing Climate (McGinn NA, ed). 15-22, American Fisheries Society,
    Bethesda, MD, USA
Martínez-Dalmau J, Berbel J, Ordóñez-Fernández R. 2021. Nitrogen fertilization. A review of the risks
    associated with the inefficiency of its use and policy responses. Sustainability, 13: 5625
Meddi M, Talia A, Martin C. 2009. Evolution récente des conditions climatiques et des écoulements sur le
    bassin versant de la Macta (Nord-Ouest de l’Algérie). Rev Physio-Géo, 3: 61-84
Megharbi A, Abdoun F, Belgherbi B. 2016. Diversité floristique en relation avec les gradients abiotiques dans
    la zone humide de la Macta (ouest d’Algérie). Revue d’Ecologie (Terre et Vie), 71(2): 143
Mezbour R, Reggam A, Maazi M, Houhamdi M. 2018. Evaluation of organic pollution index and the
    bacteriological quality of the water of the Lake of birds (ELTarf East-Algerian). Journal of Materials and
    Environmental Science, 9(3): 971-979
ONA (National Office of Sanitation). 2014. Les valeurs limites maximales des spécifications qualitatives de
    tous les rejets dans les STEP. Document technique, Algérie
OZHM (Mediterranean Wetlands Observatory). 2012. Biodiversité – État et tendances des espèces des zones
    humides méditerranéennes, Dossier thématique n°1, Tour du Valat, Arles, Algérie
Pearce F, Crivelli AJ. 1994. Caractéristiques générales des zones humides méditerranéennes. Bouklet Med
    Wet / Tour de Valat, N°1, France
Perillo G, Wolanski E, Cahoon DR, Hopkinson CS. 2018. Coastal Wetlands: An Integrated Ecosystem
    Approach. 11-24, Elsevier
Ramsar. 2007. Wise use of wetlands: A conceptual Framework for the wise use of wetlands. Ramsar
    handbooks for The Wise Use of Wetlands (3rd edition, Vol 1). Ramsar Convention Secretariat, Gland,
    Switzerland
Rejsek F. 2002. Analyse des eaux, Aspects réglementaire et techniques. Série: Sciences et techniques de
    l’environnement. Paris, France
Rodier G. 1996. L’analyse de l’eau, 8eédition. Dunod, Paris, France
Rodier G. 2005. L’analyse de l’eau, eaux naturelles, eaux résiduaires, eaux de mer 8ème Ed. Dunod, Paris,
    France
Sahraoui K. 2002. Délimitation de la zone à protéger (marais de la Macta). CFM Rapport polycopié, Paris,
    France
Samraoui B, Ouldjaoui A, Boulkhssaïm M, Houhamdi M, Saheb M, Bechet A. 2006. The first recorded
    reproduction of the Greater Flamingo Phoenicopterusroseus in Algeria: behavioural and ecological aspects.
    Ostrich, 77 : 153-159
Simmoneau P. 1952. La végétation halophile de la plaine de Perrégaux. Thèse de Doctorat, Faculté des
    Sciences, Alger, Algérie
Sitayeb T, Benabdeli K. 2008. Contribution à l’étude de la dynamique de l’occupation des sols de la plaine de
    la Macta (Algérie) à l’aide de la télédétection et des systèmes d’information géographique. C.R. Biologies,
    331: 466-474
Souidi Z, Miara M , Benhanifia K , Daikh A, Moumenine A. 2016. Guide de terrain des plantes spontanées de
    la zone humide des marais de la Macta. INAS Edition, Alger, Algérie
Spellman FR. 2014. Handbook of Water and Wastewater Treatment Plant Operations (3rd edn). Taylor and
    Francis Group, USA
Tafer B. 1993. Étude phytoécologique des complexes de végétation halophile de la plaine de Mohammedia
    (Macta, Oranie). Thèse, Université de Droit, d’Économie et des Sciences d’Aix-Marseille, France

IAEES                                                                                                     www.iaees.org
206 Proceedings of the International Academy of Ecology and Environmental Sciences, 2021, 11(4): 188-206 Winter A. 2000. The vulnerability of wetlands to climate change: a hydrologic landscape perspective. Journal of the American Water Resources Association, 36: 305-311 Zhang WJ, Liu CH. 2012. Some thoughts on global climate change: will it get warmer and warmer? Environmental Skeptics and Critics, 1(1): 1-7 IAEES www.iaees.org
You can also read