Seismic noise variability as an indicator of urban mobility during the COVID-19 pandemic in the Santiago metropolitan region, Chile - Solid Earth
←
→
Page content transcription
If your browser does not render page correctly, please read the page content below
Solid Earth, 12, 1075–1085, 2021
https://doi.org/10.5194/se-12-1075-2021
© Author(s) 2021. This work is distributed under
the Creative Commons Attribution 4.0 License.

Seismic noise variability as an indicator of urban mobility during
the COVID-19 pandemic in the Santiago metropolitan region, Chile
Javier Ojeda and Sergio Ruiz
Departamento de Geofísica, Universidad de Chile, Santiago, Chile

Correspondence: Javier Ojeda (jojeda@dgf.uchile.cl)

Received: 27 November 2020 – Discussion started: 11 December 2020
Revised: 30 March 2021 – Accepted: 7 April 2021 – Published: 17 May 2021

Abstract. On 3 March 2020, the first case of COVID-19 was         1   Introduction
confirmed in Chile. Since then, the Ministry of Health has
imposed mobility restrictions, a global policy implemented        Since the propagation of the severe acute respiratory syn-
to mitigate the propagation of the virus. The national seis-      drome coronavirus 2 (SARS-CoV-2), which causes the coro-
mic network operating throughout Chile provides an oppor-         navirus disease 2019 (COVID-19), countries have used var-
tunity to monitor the ambient seismic noise (ASN) and deter-      ious strategies to reduce the risk of the virus spreading
mine the effectiveness of public policies imposed to reduce       (Walker et al., 2020). In Chile, the first case of COVID-19
urban mobility in the major cities. Herein, we analyse tem-       was confirmed on 3 March 2020, and from there the disease
poral variations in high-frequency ASN recorded by broad-         spread rapidly until the number of cases reached a peak on 14
band and strong-motion instruments deployed throughout the        June (Canals et al., 2020). During this first period, the main
main cities of Chile. We focus on the capital, Santiago, a city   public health policy addressed isolation and social distanc-
with more than 7 million inhabitants because it is seismi-        ing, including the closure of schools, universities, and other
cally well instrumented and has high levels of urban mobil-       educational centres (16 March); a national night-time curfew
ity due to worker commutes inside the region. We observed         (23 March); and the lockdown of communes. From 19 July
strong similarities between anthropogenic seismic noise and       2020, the Chilean government implemented the step-by-step
human mobility indicators, as shown in the difference be-         programme, which considered a gradual open of each com-
tween urban and rural amplitudes, long-term variations, and       mune in five phases, based on the monitoring of epidemi-
variability due to the COVID-19 outbreak. The same results        ological and health system indicators (see Table S1; Tariq
are observed in other cities such as Iquique, La Serena, and      et al., 2021). One of the most affected zones corresponds to
Concepción. Our findings suggest that the initially imple-        the metropolitan region (hereafter MR) of Chile, which in-
mented public health policies and the early end to confine-       cludes the capital, Santiago, a big city containing 40 % of
ment in mid-April 2020 in the metropolitan region caused an       the Chilean population. According to the 2017 Census (INE,
increase in mobility and virus transmission, where the peak       2017), the population of the MR reached 7 112 808 inhabi-
in anthropogenic seismic noise coincides with the peak of         tants, with a density of 461.77 inhabitants per square kilome-
the effective reproductive number from confirmed positive         tre, and Santiago had the highest population density of Chile
cases of COVID-19. These results confirm that seismic net-        (Fig. 1; see Fig. S1a).
works are capable of recording the urban mobility of popu-           Ambient seismic noise (ASN) can be attributed to various
lation within cities, and we show that continuous monitoring      sources depending on the frequency band analysed. At higher
of ASN can quantify urban mobility. Finally, we suggest that      frequencies, above 1 Hz, ASN exhibits daily, weekly, and
real-time changes in ASN amplitudes should be considered          holiday variations linked to human activities (e.g., Bonnefoy-
part of public health policy in further protocols in Santiago     Claudet et al., 2006; Groos and Ritter, 2009; Díaz et al.,
and other high-density cities of the world, as has been useful    2017). This high-frequency band, also called anthropogenic
during the recent pandemic.                                       or cultural noise, registered on seismic data is quickly atten-
                                                                  uated with distance on the order of a few kilometres (Groos

Published by Copernicus Publications on behalf of the European Geosciences Union.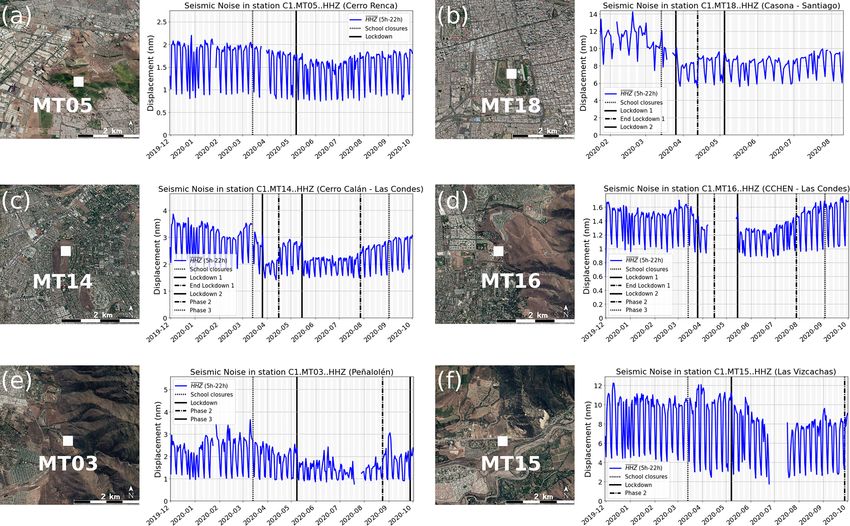
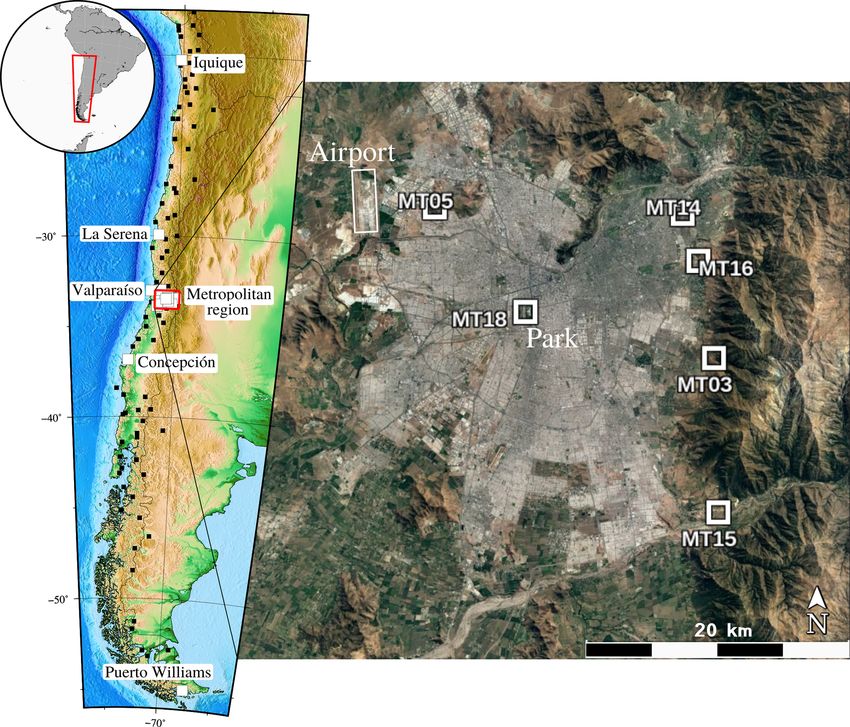
1076                                            J. Ojeda and S. Ruiz: Seismic noise variability as indicator of urban mobility

Figure 1. Location of the seismic stations of Chilean seismological network. Inset map shows the study location with reference to South
America. The small black square corresponds to the broadband stations managed by CSN. White squares correspond to the five stations
analysed in Iquique, La Serena, Valparaíso, Concepción, and Puerto Williams. The red rectangle shows the MR with six stations located in
urban areas (squares with white contours). We have also shown the location of the airport and O’Higgins Park. Photos from © Google Earth.

and Ritter, 2009; Boese et al., 2015; Green et al., 2017).             ral variations in ASN in each city and country could reveal
The effects of the COVID-19 outbreak and global mobility               ways to significantly advance the robust monitoring of urban
restrictions have created an opportunity to analyse the re-            mobility, especially during a pandemic.
duction and temporal variations in high-frequency ASN on                  Herein, we analyse the effect of temporal variations on
seismological networks (e.g., Lecocq et al., 2020a), GNSS              ASN using the continuous recording data of the Chilean seis-
Observations (Karegar and Kusche, 2020), and fibre-optic               mic network operated by the National Seismological Centre
distributed acoustic sensing (Lindsey et al., 2020). Previous          (hereafter, CSN, Centro Sismológico Nacional; Barrientos,
works in other countries compare the temporal variability be-          2018). Our results show the difference between urban and
tween ASN and other observables such as mobility data from             rural ASN amplitudes and the long-term temporal variations
cell phone displacements in northern Italy (Poli et al., 2020),        and reduction during holiday seasons, as well as those due
Río de Janeiro, Brazil (Dias et al., 2020), Sicily, Italy (Can-        to the spreading of COVID-19 and mobility restrictions. Ad-
nata et al., 2021), Auckland, New Zealand (van Wijk et al.,            ditionally, we studied the temporal variations due to the im-
2021), Barcelona, Spain (Diaz et al., 2021), and Querétaro,            plementation of different public health policies in Chile. We
México (De Plaen et al., 2021). In addition, Xiao et al. (2020)        identified an agreement between high-frequency ASN am-
reported cultural noise changes in China, and Guenaga et al.           plitudes and other mobility data within the MR, as well as an
(2021) distinguished significant ASN reductions in academic            increase in epidemiological parameters of virus transmission
institutions across the United States. These observations re-          on the dates of a peak in ASN. Our findings suggest that ASN
veal the effect of mobility restrictions imprinted on geophys-         analysis could be used to infer the dynamics of the popula-
ical measurements worldwide, where the pandemic caused                 tion influenced by large and long-scale events in big cities,
one of the quietest recorded periods on Earth with a 50 % re-          like a pandemic.
duction in seismic noise (Denolle and Nissen-Meyer, 2020;
Lecocq et al., 2020a). However, a deep analysis of tempo-

Solid Earth, 12, 1075–1085, 2021                                                           https://doi.org/10.5194/se-12-1075-2021
J. Ojeda and S. Ruiz: Seismic noise variability as indicator of urban mobility                                              1077

2     Data and methods                                            tween 4 and 14 Hz to obtain the rms of the time-domain dis-
                                                                  placement or high-frequency ASN (Lecocq et al., 2020a).
2.1    Seismic data                                                  We calculated the RMS displacement variability for broad-
                                                                  band and strong-motion records. Figure 3 shows the tempo-
                                                                  ral changes in ASN amplitudes that are comparable between
Since 2013 the CSN has deployed a large number of seis-
                                                                  both instruments at station MT18. The median daytime am-
mic stations throughout Chile, most of them in areas out-
                                                                  plitudes between 05:00 and 22:00 LT (local time) obtained
side the main cities where there is a low signal-to-noise ra-
                                                                  from the seismometer and the accelerometer exhibit similar
tio to better record the regular seismicity (Barrientos, 2018).
                                                                  trends and behaviour. To analyse the seismic effects of the
The CSN network is formed by ∼ 120 broadband and ac-
                                                                  lockdowns in Santiago City, we calculated 24 h clock plots
celerometer multi-parametric stations deployed at the same
                                                                  for station MT18 through which we observed the average
location, ∼ 300 accelerographs with trigger systems, and a
                                                                  displacement variation for weekdays and weekends for the
few continuous-recording strong-motion instruments. Fur-
                                                                  period before Lockdown 1 (Fig. 4a) and after Lockdown 1
ther information about the geophysical characterization and
                                                                  (Fig. 4b). In addition, the displacement noise evolution is
soil conditions where stations were deployed can be found
                                                                  shown in an hourly grid representation from January 2020
in Leyton et al. (2018a) and Leyton et al. (2018b). Herein,
                                                                  to August 2020 (Fig. 4c).
we focus on stations located inside or close to the principal
cities. We analysed the data of 15 stations placed in the MR
                                                                  2.3   Other observables: epidemiological and mobility
(see Fig. S1) and five stations deployed in other cities within
                                                                        data
Chile, i.e. Iquique, La Serena, Valparaíso, Concepción, and
Puerto Williams (Fig. 1; see Table S2). These stations were
                                                                  Our study integrates epidemiological data available on the
selected because of their distance from the main cities, high-
                                                                  website of the Chilean Ministry of Science. One of the pri-
quality data, and short-time data gaps. We only analysed the
                                                                  mary indicators of the spreading of viruses and contagion dy-
vertical component of the data due to the similarities in the
                                                                  namics is the estimation of the effective reproductive number
results observed using horizontal components (Lecocq et al.,
                                                                  (hereafter Re) from confirmed positive cases of COVID-19
2020a). Most of the records correspond to broadband sta-
                                                                  since the date of the beginning of symptoms. The Re indi-
tions, except for the strong motion C.CCSP station placed in
                                                                  cator is defined as the actual average number of secondary
San Pedro (Concepción) and the strong motion C1.MT18 sta-
                                                                  cases generated by a primary case during the epidemic out-
tion located in downtown Santiago (for the MT18 station, we
                                                                  break (Caicedo-Ochoa et al., 2020; Tariq et al., 2021). Its
analysed both broadband and strong-motion records). For all
                                                                  estimation is helpful for the assessment of public policies,
stations, we processed 11 months of data from 1 December
                                                                  to estimate population immunity, and to monitor near real-
2019 to 1 October 2020 and extended this to 3 years of data
                                                                  time changes in transmission of the viruses over time, among
from 1 October 2017 to 1 October 2020 for stations MT09
                                                                  other benefits (Gostic et al., 2020). To control an epidemic
and MT14 located in the MR.
                                                                  outbreak, the Re indicator needs to be reduced below 1 (Ri-
                                                                  ley et al., 2003). Herein, we used the estimation provided by
2.2    Seismic noise analyses                                     ICOVID Chile (2020), who described the function Re de-
                                                                  pending on the proportion of susceptible individuals to be
To investigate the temporal changes in the seismic signal, we     infected, a transmission coefficient and the infectious life ex-
followed the methodology used by Lecocq et al. (2020a) con-       pectancy. In other words, the Re accounts for the coefficient
sidering continuous data. We computed a daily power spec-         between the new infections and the recovery rates plus mor-
tral density in 30 min windows, where each windowed time          tality rates (Contreras et al., 2020). ICOVID Chile (2020)
series was calculated using Welch’s method (Welch, 1967);         used the method proposed by Cori et al. (2013) to monitor
therefore, the windowed segments were converted to peri-          Re in real time, modelling the transmission like a Poisson
odograms. We estimated the displacement spectral power,           process calculated on the basis of the last 7 d. We considered
from which we calculate the root mean square (rms) of the         only the Re median and 95 % credible interval estimated for
time-domain displacement using a bandpass filter. To better       the urban area in the MR, according to the data given by the
understand the effects of the chosen corner frequency ap-         Health Service of Santiago City.
plied in the bandpass filter, we tested the temporal changes         The mobility data we analysed is provided by Apple mo-
in the normalized seismic rms amplitude at the MT18 station       bile phone locations in Santiago City, which corresponds to
(Fig. 2). In the first order, the temporal changes are similar    the percentage of change in the public’s walking and driv-
between the different corner frequencies applied, excluding       ing in relation to a baseline value from 13 January (Apple,
the lower frequency bands such as 0.1–1, 1–3, and 3–5 Hz.         2020). Moreover, we used the public transport transactions
At frequencies > 1 Hz we can avoid records of microseism          provided by the Chilean Ministry of Transport and the Insti-
and observe important temporal changes in the normalized          tuto de Sistemas Complejos de Ingeniería (Ministry of Sci-
displacement. Consequently, we decided to filter the data be-     ence, 2020). They account for the total number of validations

https://doi.org/10.5194/se-12-1075-2021                                                      Solid Earth, 12, 1075–1085, 2021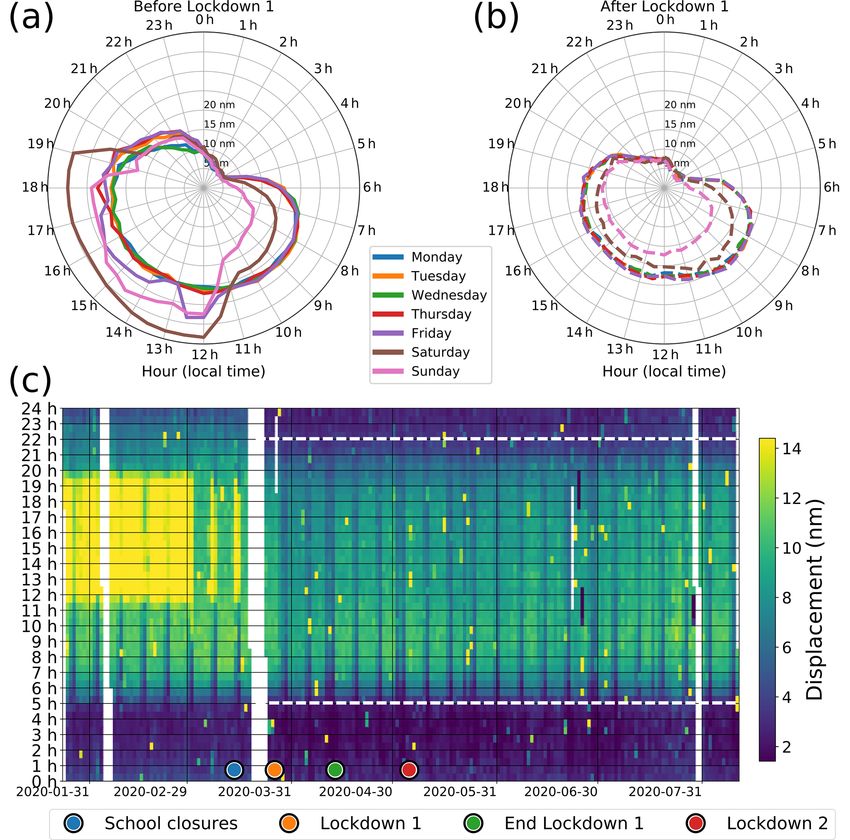
1078                                           J. Ojeda and S. Ruiz: Seismic noise variability as indicator of urban mobility

Figure 2. Normalized RMS amplitude at the vertical component of station MT18 in downtown Santiago. We tested nine bandpass filters
between 0.1 to 30 Hz (see y axis). White space corresponds to data gaps.

using the public transportation card in the MR. This mobility       ment with the decrease in the ASN amplitudes observed after
card is the only system to make transactions in public trans-       Lockdown 1 (Fig. 4b).
port in the area. Finally, we utilized local flight data provided      We also distinguish the lockdown effect in the hourly grid
by the Civil Aeronautical Board of Chile, which correspond          representation (Fig. 4c). The large ASN amplitudes observed
to the total number of passengers that departed from Santi-         during holidays are associated with nearby activities in both
ago City or arrived there on national flights (Ministry of Sci-     the hippodrome and O’Higgins Park, which only persist on
ence, 2020) at the Airport “Arturo Merino Benítez” located          weekends during March. After the implementation of Lock-
approximately 5 km west of station MT05 (see Fig. S1c).             down 1, the ASN amplitudes drop, especially on weekends.
                                                                    Moreover, we observed a systematic behaviour of lower ASN
                                                                    amplitudes between 22:00 and 05:00 LT due to the overnight
3     Results                                                       curfew implemented at the same hours that were imposed
                                                                    during Lockdown 1 and remained during the full studied time
3.1    Lockdown, curfew, and ASN amplitudes                         window.

We analysed the seismic effect caused by the first lockdown         3.2   ASN variability between urban and rural areas in
in Santiago City using the 24 h clock plots in station MT18               the metropolitan region
(Fig. 4a, b). Although we observed a gradual reduction in
ASN amplitudes on weekdays due to the day cares, schools,           Figure 5 shows the ASN variability over 3 years for two
and universities near the station closed (16 March), we also        representative stations in the MR, MT14 in Las Condes and
notice a strong reduction on weekends, especially between           MT09 located in an almost unpopulated area near the town of
11:00 and 19:00 LT. Figure S1b shows the area close to              Talagante. High-frequency ASN exhibits higher amplitude in
MT18 in which we can distinguish the hippodrome “Club               urban stations than rural environments. MT14 presents larger
Hípico de Santiago” and the O’Higgins Park. The highest             temporal changes, for example during the summer holiday
ASN amplitudes observed on Saturday before Lockdown 1               season (January–February). The same trends are observed in
(Fig. 4a) are explained by the activities of the hippodrome on      the three analysed years 2018, 2019, and 2020, and the lock-
Saturdays (and some Thursdays during January–February).             down restrictions are visible with clear changes in the mean
The hippodrome closed on 21 March 2021, which is in agree-          of ASN. In contrast, the MT09 station located in a rural en-

Solid Earth, 12, 1075–1085, 2021                                                      https://doi.org/10.5194/se-12-1075-2021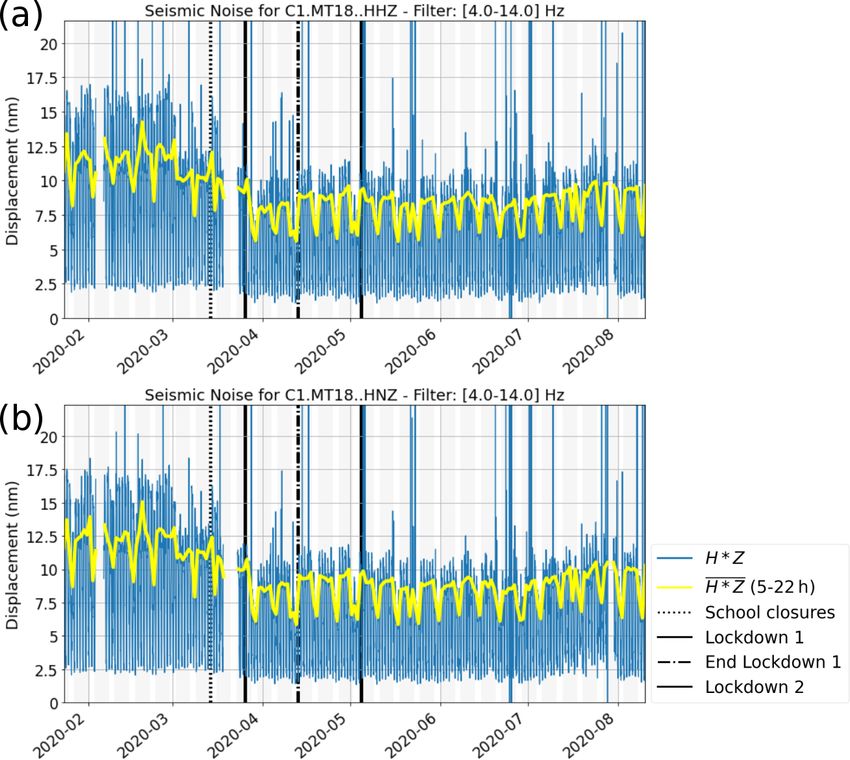
J. Ojeda and S. Ruiz: Seismic noise variability as indicator of urban mobility                                                   1079

                                                                        the urban area of MR correspond to MT05, MT14, MT16,
                                                                        and MT03, stations that are located over hills, unlike the
                                                                        MT18 and MT15 stations, which are deployed in the valley.
                                                                        Despite the ASN present an average amplitude difference be-
                                                                        tween each station, the temporal variations can be observed
                                                                        within Santiago City. In contrast, the high-frequency ASN
                                                                        estimated for rural stations show lower amplitudes without
                                                                        conspicuous evidence of temporal variations due to mobility
                                                                        restrictions (see Fig. S2); as we mentioned previously, lo-
                                                                        cated peaks are related to local activity in those areas and do
                                                                        not seem to follow a behaviour related to the anthropogenic
                                                                        ASN. Notice that the rural stations analysed are deployed
                                                                        within the MR at a distance of about 15 to 60 km from the
                                                                        stations installed in urban areas (see Fig. S1).

                                                                        3.3   Mobility restrictions and epidemiological
                                                                              parameters linked with seismic noise amplitudes

                                                                        We analysed the temporal variability of high-frequency ASN
Figure 3. Comparison between (a) broadband and (b) strong-              for station MT14, located in Las Condes municipality within
motion seismic noise amplitudes for station MT18 in downtown            Santiago, because this station lacked data gaps during 2020
Santiago. The blue line corresponds to the rms amplitude time series    and the area implemented a diversity of public policies for
of the vertical component, filtered between 4–14 Hz, and the yel-       mitigating the effects of the pandemic. Figure 7 shows a
low line corresponds to median daytime amplitude between 05:00–         matching pattern between the temporal changes in ASN am-
22:00 LT. Gaps correspond to periods for which seismic data are         plitudes and the effective reproductive number (Re), espe-
unavailable. The vertical black lines indicate the time of public re-   cially from March to July, where we observed a peak in the
strictions implemented in Santiago. The grey and white background       number of positive COVID-19 cases (Canals et al., 2020).
corresponds to weekdays and weekends, respectively. The key leg-        The peak for the Re indicator occurred after the end of Lock-
end H ∗Z can be applied for broadband (HHZ) and strong-motion
                                                                        down 1 and before Lockdown 2, a period in which the ASN
(HNZ) seismic data.
                                                                        amplitudes also increased due to the early end to confinement
                                                                        promoted by a “safe return” to normal activities (Tariq et al.,
vironment presents lower ASN amplitudes with few and low                2021). This observation is supported by mobility data such
peaks due to local activity in the area.                                as Apple’s driving and walking data (see Fig. S4), the grad-
   Figure 6 shows the ASN variability in the six stations in-           ual increase in public transport transactions, and a gradual
side the urban ratio in the MR. In 10 months of data, we can            increase in the flight arrivals and departures from Santiago
see the temporal changes in high-frequency ASN. MR had                  city (see Fig. S5).
different lockdown protocols depending on each municipal-                  After Lockdown 2 in mid-July, the Chilean government
ity (see Table S2); however, most of the changes started on 16          proposed the step-by-step programme to mitigate the prop-
March 2020, where schools, universities, and institutes de-             agation of SARS-CoV-2 virus towards a gradual re-opening
cided to shut down and stopped their activities to mitigate the         and increased mobility in different counties as a public health
spread of COVID-19. The first lockdown was in downtown                  policy (see Table S1). The programme considers five phases,
Santiago (MT18, Fig. 6b) and Las Condes (MT14, MT16,                    where the citizens progressively increase their mobility, and
Fig. 6c, d) on 26 March 2020, 23 d after the first case of posi-        the advance or retreat of these phases is related to the epi-
tive COVID-19, and was lifted on 13 April (downtown Santi-              demiological situation of each municipality. Las Condes
ago, MT18) and 16 April (Las Condes, MT14, MT16). After                 (MT14) was the first territory in the MR in which the pro-
that, ASN amplitudes increased until the second lockdown                gramme changed from Phase 1 to Phases 2 and 3. These mo-
on 5 May (downtown Santiago, MT18) and 15 May (Las                      bility conditions explain the sharp increase in high-frequency
Condes, MT14, MT16), where ASN amplitude immediately                    ASN amplitudes after 28 July (Phase 2) and 2 September
decreased. These temporal restrictions were well recorded               (Phase 3) (Fig. 7). These periods also correlate with the
by seismic stations installed in urban areas and are useful             strong increase in the Apple mobility data. The Re indica-
for analysing urban mobility. Other sectors from MR such                tor presents a gradual increase in this period and seems to
as Renca (MT05, Fig. 6a), Peñalolén (MT03, Fig. 6e), and                oscillate around 1, similar to the time window between May
Puente Alto (MT15, Fig. 6f) also show strong variations in              and June.
ASN because of lockdown restrictions. Concerning the ASN
amplitude variability, we observed that the quieter stations in

https://doi.org/10.5194/se-12-1075-2021                                                           Solid Earth, 12, 1075–1085, 2021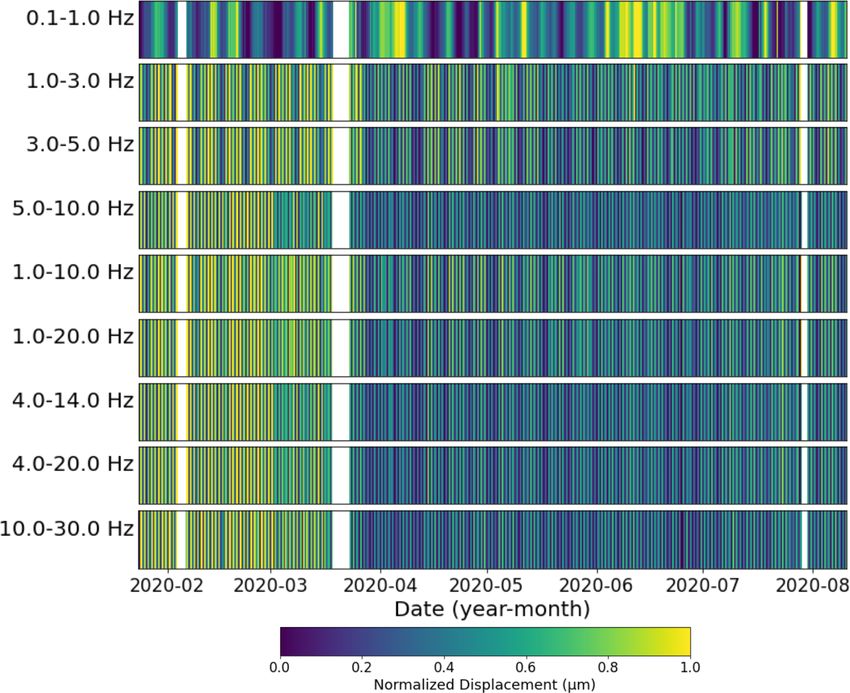
1080                                            J. Ojeda and S. Ruiz: Seismic noise variability as indicator of urban mobility

Figure 4. Analysis of station MT18 in downtown Santiago. (a, b) Clock plots showing an average of the displacement variability for
each day of the week for the period (a) before Lockdown 1 (period 23 January–25 March 2020) and (b) after Lockdown 1 (period 26
March–10 August 2020) at station MT18 in downtown Santiago. (c) Displacement noise evolution is shown in an hourly grid representation.
Gaps correspond to periods for which seismic data are unavailable. Blue, orange, green, and red circles below represent the time of public
restrictions implemented in downtown Santiago. Horizontal dashed white lines show the curfew period imposed between 22:00–05:00 LT.

3.4    Situation in other places in Chile                              tion, along the coast of Central Chile (VA01; see Fig. S3c),
                                                                       showed high variation due to the influence of the ocean (Ces-
High-frequency ASN changes were also recorded in other                 saro, 1994; Ardhuin et al., 2011), and it is difficult to high-
cities in Chile (Fig. 1). The variability in ASN amplitudes            light the change in ASN associated with anthropogenic noise.
was observed in other populated cities of northern Chile,              In central southern Chile in San Pedro, Concepción (CCSP;
such as Iquique (TA02; see Fig. S3a) and La Serena (CO05;              see Fig. S3d), we observed a strong reduction in ASN after
see Fig. S3b). In Iquique, the high-frequency ASN decreased            school closures and the implementation of the first lockdown.
after school closures until the end of April 2020, after which         The ASN amplitudes in Concepción are at least 30 nm nois-
ASN increased to average levels. With the increase in the              ier than Santiago (MT18), which could be explained by their
number of positive COVID-19 cases, the government imple-               location on residential areas but also the different soil con-
mented the first lockdown in this city on 15 May, dates in             ditions where the stations were installed. Finally, in Puerto
which we observed an instantaneous drop in ASN amplitude,              Williams (MG01; see Fig. S3e), a small town at the south-
which gradually recovered up to normal seismic noise lev-              ern tip of South America, temporal changes in ASN were
els at the end of September. In La Serena, the trends were             also recorded, and this reduction coincided with the lock-
similar, with a local ASN decrease on 16 March that ceased             down period and restriction of mobility and human activi-
at the end of April. However, data gaps at station CO05 in             ties. Nevertheless, this station shows a strange pattern before
La Serena do not allow further analysis. The Valparaíso sta-           the lockdown. The first one corresponds to a high drop in

Solid Earth, 12, 1075–1085, 2021                                                            https://doi.org/10.5194/se-12-1075-2021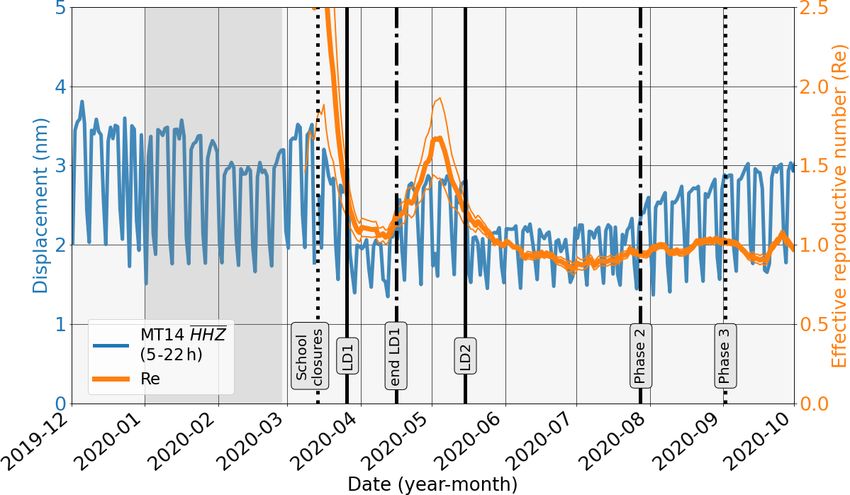
J. Ojeda and S. Ruiz: Seismic noise variability as indicator of urban mobility 1081
ASN reduction indicates an intrinsic anthropogenic origin
due to the variations in population mobility within cities.
We described the temporal patterns and variations between
weekdays and weekends, especially in station MT18 in the
downtown Santiago, located near an amusement park with
high levels of activity during the weekends observed in
the seismic data before Lockdown 1 (Figs. 3 and 4). After
Lockdown 1, the activity on weekends abruptly decreased,
whereas the activity during weekdays had a gradual reduc-
tion. As a public health policy, from 23 March the govern-
ment imposed an overnight curfew from 22:00 to 05:00 LT.
The impact of this measure was recorded by most of the sta-
tions in urban areas, in which the ASN amplitudes decreased
abruptly during the study period.
Temporal variations in ASN amplitudes coincide with the
dates of changes in public health policies; variations due to
lockdown and different phases of the end to confinement
are observed in the high-frequency ASN amplitudes. One
of the most interesting examples in the MR corresponds to
station MT14 in Las Condes (Fig. 6c). Here, we observed
a remarkable increase in ASN amplitudes between 16 April
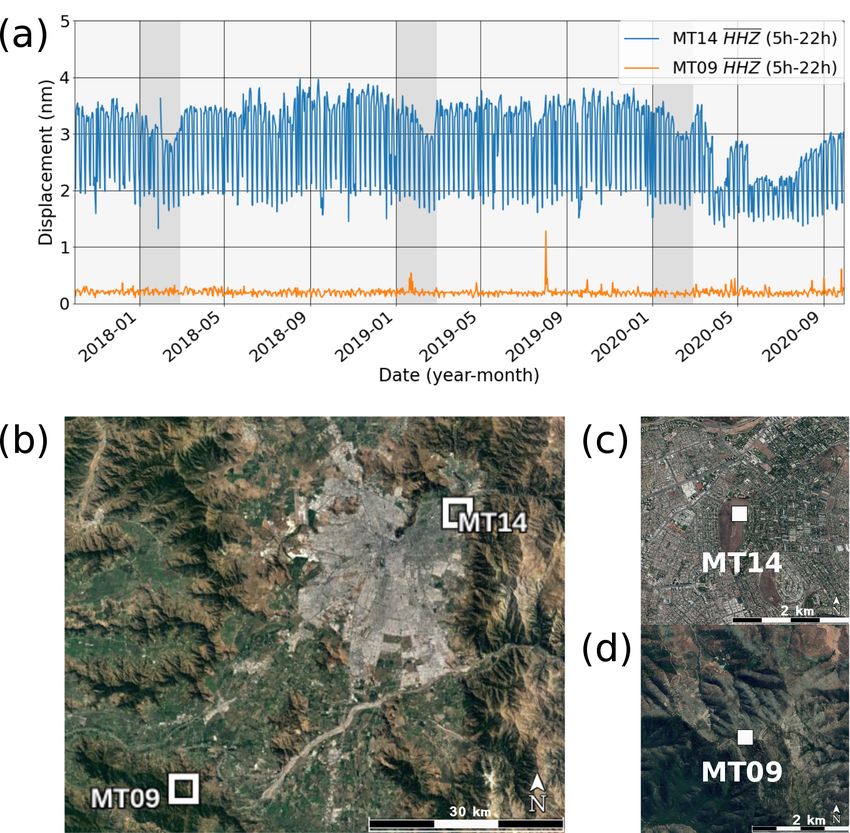
Figure 5. Displacement noise evolution at urban and rural stations and 15 May, a period in which the government ended the
in the metropolitan region for the period 1 October 2017–1 October first lockdown and started deconfinement in the eastern MR,
2020. (a) Long-term noise evolution in station MT14 (blue line) and
raising the individual displacement of the population and ur-
MT09 (orange line). The grey background correspond to summer
vacations. (b) Map with the relative position of each station in the
ban mobility. Furthermore, during this period we observed a
metropolitan region and the near 2 km distance from stations (c) higher Re value, an epidemiological indicator that represents
MT14 and (d) MT09. Photos from © Google Earth. the velocity of propagation of viruses and increases with the
transmission and overload of health systems (Caicedo-Ochoa
et al., 2020). The mobility data gathered from Apple devices,
mid-December until the first days of January associated with public transport transactions, and flights (see Figs. S4, S5)
holiday festivities (Christmas and New Year Day). The sec- confirm the increase of urban mobility in the period anal-
ond pattern observed is the temporal variability that could be ysed. In addition, Cuadrado et al. (2020) suggest that small-
associated with the activity of the airfield near the site where area lockdowns and reductions in mobility can reduce the
the station is operating. Unfortunately, we do not have ac- transmission of the virus but that their impact was smaller
cess to the aeroplane activity in those weeks to support our than the early closures of schools, universities, and other ed-
assumption. ucational centres. These observations indicate that ASN can
act as an indicator of urban mobility and can be applied to
monitor the dynamics of the populations within cities. The
4 Discussion Re parameter increased during the periods of higher human
activity (“safe return” from LD1), and therefore ASN ampli-
During 2020, the MR exhibited temporal changes in the am- tudes increased in a period without strict management of the
plitude of high-frequency ASN at all the stations near ur- pandemic. The early removal of lockdown protocols to re-
ban areas. However, we also identified temporal changes in open the economy resulted in a new wave of infections and
the long-term variability of ASN, especially for stations de- an exponential increase in the number of positive COVID-19
ployed in urban areas rather than rural areas. Urban areas cases (Tariq et al., 2021), with a peak on 14 June and 95 %
show larger RMS displacement amplitudes than rural areas intensive care unit bed occupation (Canals et al., 2020).
located far from cities. We suggest that the variability in ASN The implementation of new health public policies like the
amplitudes is a consequence of anthropogenic activities that step-by-step programme and their five phases since mid-July
affect higher frequencies (Díaz et al., 2017). was accompanied by a gradual decrease in the Re parameter,
Since the implementation of lockdown measures in the which oscillated around 1 since those dates. Although the
MR, we observed a strong reduction in the amplitude of ASN amplitudes increased after Phase 2 and Phase 3 in east-
ASN similar to that observed by other authors in China, Italy, ern MR, the Re parameter was not linked, likely indicating
Brazil, and worldwide (e.g., Dias et al., 2020; Lecocq et al., better management of the epidemic outbreak with the broad-
2020a; Poli et al., 2020; Xiao et al., 2020). Due to the fre- scale social distancing interventions applied in MR (Tariq
quency band applied to obtain the RMS displacement, this et al., 2021). However, according to Canals et al. (2020), a
https://doi.org/10.5194/se-12-1075-2021 Solid Earth, 12, 1075–1085, 20211082 J. Ojeda and S. Ruiz: Seismic noise variability as indicator of urban mobility
Figure 6. Changes in high-frequency seismic ambient noise amplitudes at stations (a) MT05, (b) MT18, (c) MT14, (d) MT16, (e) MT03,
and (f) MT15. The vertical black lines indicate the time of public restrictions implemented in the metropolitan region. Each municipality
inside the region had different lockdown periods or phases, despite the proximity between them. Photos from © Google Earth.
relaxing of these interventions could raise the infections and
saturate the health systems.
The matching pattern between the mobility data, the Re
indicator, and the high-frequency ASN amplitudes is well
established for the station MT14 located in Las Condes.
Nonetheless, this did not occur with other stations in urban
areas such as MT18 placed in downtown Santiago. This ob-
servation can be further explained due to the heterogeneity
in policy effectiveness against the COVID-19 spread in MR.
Bennett (2021) showed that social distancing, quarantines,
and testing availability are affected by geographical and so-
cioeconomic factors, in which the lockdowns have been more
effective in high-income zones (such as Las Condes) over
lower-income zones (such as the others station analysed in
the MR urban area). Furthermore, the people living in high-
Figure 7. Comparison between noise evolution of station MT14 income zones can reduce their mobility by around 60 %,
(blue line) and the epidemiological factor of the effective repro- while people in low-income zones can only reduce their
ductive number (Re) over time is shown (orange line) with 95 % mobility by around 20 % during lockdown (Carranza et al.,
confidence intervals (thin orange lines). The vertical black lines in-
2020).
dicate the time of public restrictions implemented in Las Condes.
Finally, we show five examples within Chile of differ-
The grey background between January and March corresponds to
the summer holiday season in Chile. ent temporal changes in high-frequency ASN amplitudes,
in which the majority show similar patterns of gradual de-
creases in RMS displacements due to lockdowns or mobil-
Solid Earth, 12, 1075–1085, 2021 https://doi.org/10.5194/se-12-1075-2021J. Ojeda and S. Ruiz: Seismic noise variability as indicator of urban mobility 1083
ity restrictions. The cities like Iquique, La Serena, and Con- increase the interest of society toward Earth sciences (e.g.
cepción are highly populated regions in Chile, whereas the Diaz et al., 2020). The analysis of this study could be imple-
temporal variations on ASN are comparable with other ob- mented in other high-density cities of the world with impor-
servations in the MR urban area. Valparaíso, the second most tant implications for our society as it is directly or indirectly
populated region, only presents ASN dominated by the ocean affected by the COVID-19 pandemic.
in the frequency band analysed. At Puerto Williams, a small
town in the extreme south of South America, the decrease in
ASN can be explained by the flight operation and restrictions, Code availability. The seismic data analysis and reproducibility
due to the closeness of the seismic stations and the local air- of high-frequency ASN have been done using the open-source
field. Nonetheless, further analyses including other sources SeismoRMS code kindly distributed by Lecocq et al. (2020b,
of mobility data and epidemiological indicators are needed. https://doi.org/10.5281/zenodo.3820046). Figures 1 and S1 were
made using the Generic Mapping Tools (GMT) software version
5.3.1 (Wessel et al., 2013).
5 Conclusions
Data availability. The data shown in this study are available upon
Although seismic data have been used to study wave prop- request from the authors. Seismic data from CSN, networks C and
agation from seismic sources or to monitor different geo- C1 (https://doi.org/10.7914/SN/C1, Universidad de Chile, 2013),
logical phenomena, temporal changes in the amplitudes of are publicly available through the Incorporated Research Institu-
ASN have also been used to monitor population mobility tions for Seismology Data Management Center (IRIS-DMC). Apple
within cities. We demonstrate that we can analyse the dy- mobility data are available at https://covid19.apple.com/mobility
namics of the population and urban mobility through high- (last access: 2 October 2020, Apple, 2020). Public transport trans-
frequency ASN variations. The public health policies imple- actions from the Chilean Ministry of Transport and flight data
mented to mitigate the spread of COVID-19 had an impor- from Civil Aeronautical Board of Chile are freely available at
tant influence on citizens mobility: lockdown, curfew, dy- https://github.com/MinCiencia/Datos-COVID19 (Ministry of Sci-
ence, 2020). Effective reproductive number estimation and other
namic quarantines, and other restrictions affected the ASN
epidemiological parameters from ICOVID are available at https:
amplitudes recorded by seismological stations. These tempo-
//www.icovidchile.cl/ (ICOVID Chile, 2020).
ral variations were also observed during the periods of lock-
down and gradual ending of confinement in the MR of Chile,
in which a sharp decrease in ASN amplitudes was observed Supplement. The supplement related to this article is available on-
in the station within urban areas, in contrast to those in rural line at: https://doi.org/10.5194/se-12-1075-2021-supplement.
areas. Other mobility data were also compared with temporal
variations in ASN amplitudes, showing good agreement with
data from Apple devices, public transport transactions, and Author contributions. JO and SR wrote the manuscript, and JO did
national flights. In mid-April, during the rise of the number the seismic noise analysis.
of positive COVID-19 cases worldwide, the government de-
clared the end of the first lockdown in eastern Santiago. The
public policy measure was followed by an increase in the Competing interests. The authors declare that they have no conflict
citizen’s mobility, a behaviour that was recorded by seismic of interest.
stations. Most interestingly, during that period the effective
reproductive number increased until it reached a maximum
at the beginning of May. Thereafter, the Chilean government Special issue statement. This article is part of the special issue “So-
declared a second lockdown due to the increase in the num- cial seismology – the effect of COVID-19 lockdown measures on
ber of positive COVID-19 cases in the MR. This observation seismology”. It is not associated with a conference.
suggests that the early end of the first lockdown in Santiago,
while the pandemic situation was not controlled, increased
Acknowledgements. This work was partially funded by the Agen-
the mobility within cities and promoted virus transmission in
cia Nacional de Investigación y Desarrollo/Fondo Nacional de
those weeks, reaching a maximum number of positive cases Desarrollo Científico y Tecnológico (ANID/FONDECYT; project
in mid-June in the MR. Finally, we showed the possibility no. 1200779) and Programa de Riesgo Sísmico (Actividades
of real-time monitoring of the population mobility dynam- de Interés Nacional [AIN], Universidad de Chile). Javier Ojeda
ics through time variations of high-frequency ASN ampli- acknowledges support from the ANID (Scholarship ANID-
tudes in both broadband and accelerometer stations. These PFCHA/Doctorado Nacional/2020-21200903). We especially thank
seismometers are typically used for the management of seis- the operators of the CSN of the Universidad de Chile, who de-
mological networks in urban areas; however, recent studies spite the pandemic have continued monitoring and maintaining the
show the potential opportunity to use them as a tool to teach Chilean Seismological Network. We would like to acknowledge
seismology to school students (e.g. Subedi et al., 2020) and the fruitful comments and suggestions of two anonymous review-
https://doi.org/10.5194/se-12-1075-2021 Solid Earth, 12, 1075–1085, 20211084 J. Ojeda and S. Ruiz: Seismic noise variability as indicator of urban mobility
ers and Raphael De Plaen (Topical Editor) that helped to improve Cori, A., Ferguson, N. M., Fraser, C., and Cauchemez, S.: A new
our manuscript. framework and software to estimate time-varying reproduction
numbers during epidemics, Am. J. Epidemiol., 178, 1505–1512,
2013.
Financial support. This research has been supported by the Agen- Cuadrado, C., Monsalves, M. J., Gajardo, J., Bertoglia, M. P.,
cia Nacional de Investigación y Desarrollo (project no. 1200779). Najera, M., Alfaro, T., Canals, M., Kaufmann, J., and
Peña, S.: Impact of small-area lockdowns for the con-
trol of the COVID-19 pandemic, MedRxiv [Preprint],
Review statement. This paper was edited by Raphael De Plaen and https://doi.org/10.1101/2020.05.05.20092106, 2020.
reviewed by two anonymous referees. De Plaen, R. S. M., Márquez-Ramírez, V. H., Pérez-Campos,
X., Zuñiga, F. R., Rodríguez-Pérez, Q., Gómez González, J.
M., and Capra, L.: Seismic signature of the COVID-19 lock-
down at the city scale: a case study with low-cost seismome-
References ters in the city of Querétaro, Mexico, Solid Earth, 12, 713–724,
https://doi.org/10.5194/se-12-713-2021, 2021.
Apple: Mobility Trends Reports, available at: https://www.apple. Denolle, M. A. and Nissen-Meyer, T.: Quiet Anthropocene, Quiet
com/covid19/mobility, (last access: 2 October 2020), 2020. Earth, Science, 369, 1299–1300, 2020.
Ardhuin, F., Stutzmann, E., Schimmel, M., and Mangeney, A.: Dias, F. L., Assumpção, M., Peixoto, P. S., Bianchi, M. B.,
Ocean wave sources of seismic noise, J. Geophys. Res.-Oceans, Collaço, B., and Calhau, J.: Using Seismic Noise Lev-
116, C09004, https://doi.org/10.1029/2011JC006952, 2011. els to Monitor Social Isolation: An Example From Rio de
Barrientos, S.: The seismic network of Chile, Seismol. Res. Lett., Janeiro, Brazil, Geophys. Res. Lett., 47, e2020GL088748,
89, 467–474, 2018. https://doi.org/10.1029/2020GL088748, 2020.
Bennett, M.: All things equal? Heterogeneity in policy effectiveness Díaz, J., Ruiz, M., Sánchez-Pastor, P. S., and Romero, P.: Urban
against COVID-19 spread in chile, World Development, 137, seismology: On the origin of earth vibrations within a city, Sci.
105208, https://doi.org/10.1016/j.worlddev.2020.105208, 2021. Rep., 7, 1–11, 2017.
Boese, C., Wotherspoon, L., Alvarez, M., and Malin, P.: Analy- Diaz, J., Schimmel, M., Ruiz, M., and Carbonell, R.: Seismometers
sis of anthropogenic and natural noise from multilevel borehole within cities: a tool to connect Earth Sciences and society, Front.
seismometers in an urban environment, Auckland, New Zealand, Earth Sci., 8, 9, https://doi.org/10.3389/feart.2020.00009, 2020.
Bull. Seismol. Soc. Am., 105, 285–299, 2015. Diaz, J., Ruiz, M., and Jara, J.-A.: Seismic monitoring of urban ac-
Bonnefoy-Claudet, S., Cotton, F., and Bard, P.-Y.: The nature of tivity in Barcelona during the COVID-19 lockdown, Solid Earth,
noise wavefield and its applications for site effects studies: A lit- 12, 725–739, https://doi.org/10.5194/se-12-725-2021, 2021.
erature review, Earth-Sci. Rev., 79, 205–227, 2006. Gostic, K. M., McGough, L., Baskerville, E. B., Abbott, S., Joshi,
Caicedo-Ochoa, Y., Rebellón-Sánchez, D. E., Peñaloza-Rallón, M., K., Tedijanto, C., Kahn, R., Niehus, R., Hay, J. A., De Salazar,
Cortés-Motta, H. F., and Méndez-Fandiño, Y. R.: Effective Re- P. M., Hellewell, J., Meakin, S., Munday, J. D., Bosse, N. I.,
productive Number estimation for initial stage of COVID-19 Sherrat, K., Thompson, R. N., White, L. F., Huisman, J. S.,
pandemic in Latin American Countries, Int. J. Infect. Dis., 95, Scire, J., Bonhoeffer, S., Stadler, T., Wallinga, J., Funk, S., Lip-
316–318, 2020. sitch, M., and Cobey, S.: Practical considerations for measuring
Canals, M., Cuadrado, C., Canals, A., Yohannessen, K., Lefio, the effective reproductive number, R t, PLoS Comput. Biol., 16,
L. A., Bertoglia, M. P., Eguiguren, P., Siches, I., Iglesias, V., and e1008409, https://doi.org/10.1371/journal.pcbi.1008409, 2020.
Arteaga, O.: Epidemic trends, public health response and health Green, D. N., Bastow, I. D., Dashwood, B., and Nippress, S. E.:
system capacity: the Chilean experience in four months of the Characterizing broadband seismic noise in Central London, Seis-
COVID-19 pandemic, Revista Panamericana de Salud Pública, mol. Res. Lett., 88, 113–124, 2017.
44, e99, https://doi.org/10.26633/RPSP.2020.99, 2020. Groos, J. and Ritter, J.: Time domain classification and quantifica-
Cannata, A., Cannavò, F., Di Grazia, G., Aliotta, M., Cassisi, C., De tion of seismic noise in an urban environment, Geophys. J. Int.,
Plaen, R. S. M., Gresta, S., Lecocq, T., Montalto, P., and Sciotto, 179, 1213–1231, 2009.
M.: Seismic evidence of the COVID-19 lockdown measures: a Guenaga, D. L., Marcillo, O. E., Velasco, A. A., Chai, C., and Ma-
case study from eastern Sicily (Italy), Solid Earth, 12, 299–317, ceira, M.: The Silencing of US Campuses Following the COVID-
https://doi.org/10.5194/se-12-299-2021, 2021. 19 Response: Evaluating Root Mean Square Seismic Amplitudes
Carranza, A., Goic, M., Lara, E., Olivares, M., Weintraub, G. Y., Using Power Spectral Density Data, Seismol. Soc. Am., 92, 941–
Covarrubia, J., Escobedo, C., Jara, N., and Basso, L. J.: 950, 2021.
The social divide of social distancing: Lockdowns in santi- ICOVID Chile: Dinámica de Contagios, available at: https://www.
ago during the covid-19 pandemic, SSRN 3691373 [Preprint], icovidchile.cl (last access: 2 October 2020), 2020.
https://doi.org/10.2139/ssrn.3691373, 2020. INE: Instituto Nacional de Estadísticas, Censo 2017, available at:
Cessaro, R. K.: Sources of primary and secondary microseisms, http://resultados.censo2017.cl (last access: 13 November 2020),
Bull. Seismol. Soc. Am., 84, 142–148, 1994. 2017.
Contreras, S., Villavicencio, H. A., Medina-Ortiz, D., Karegar, M. A. and Kusche, J.: Imprints of COVID-19 lock-
Saavedra, C. P., and Olivera-Nappa, Á.: Real-time es- down on GNSS observations: An initial demonstration using
timation of Rt for supporting public-health policies GNSS interferometric reflectometry, Geophys. Res. Lett., 47,
against COVID-19, Frontiers in Public Health, 8, 970, e2020GL089647, https://doi.org/10.1029/2020GL089647, 2020.
https://doi.org/10.3389/fpubh.2020.556689, 2020.
Solid Earth, 12, 1075–1085, 2021 https://doi.org/10.5194/se-12-1075-2021J. Ojeda and S. Ruiz: Seismic noise variability as indicator of urban mobility 1085 Lecocq, T., Hicks, S. P., Van Noten, K., Van Wijk, K., Koele- Subedi, S., Hetényi, G., Denton, P., and Sauron, A.: Seismology at meijer, P., De Plaen, R. S., Massin, F., Hillers, G., Anthony, School in Nepal: a program for educational and citizen seismol- R. E., Apoloner, M.-T., Arroyo-Solórzano, M., Assink, J. D., ogy through a low-cost seismic network, Front. Earth Sci., 8, 73, Büyükakpınar, P., Cannata, A., Cannavo, F., Carrasco, S., Cau- https://doi.org/10.3389/feart.2020.00073, 2020. dron, C., Chaves, E. J., Cornwell, D. G., Craig, D., den Ouden, Tariq, A., Undurraga, E. A., Laborde, C. C., Vogt-Geisse, K., O. F., Diaz, J., Donner, S., Evangelidis, C. P., Evers, L., Fauville, Luo, R., Rothenberg, R., and Chowell, G.: Transmission dy- B., Fernandez, G. A., Giannopoulos, D., Gibbons, S. J., Girona, namics and control of COVID-19 in Chile, March–October, T., Grecu, B., Grunberg, M., Hetényi, G., Horleston, A., Inza, A., 2020, PLOS Neglected Tropical Diseases, 15, e0009070, Irving, J. C., Jamalreyhani, M., Kafka, A., Koymans, M., Labedz, https://doi.org/10.1371/journal.pntd.0009070, 2021. C. R., Larose, E., Lindsey, N. J., McKinnon, M., Megies, T., Universidad de Chile: Red Sismologica Nacional. Inter- Miller, M. S., Minarik, W., Moresi, L., Márquez-Ramírez, V. H., national Federation of Digital Seismograph Networks, Möllhoff, M., Nesbitt, I. M., Niyogi, S., Ojeda, J., Oth, A., Proud, https://doi.org/10.7914/SN/C1, 2013. S., Pulli, J., Retailleau, L., Rintamäki, A. E., Satriano, C., Savage, van Wijk, K., Chamberlain, C. J., Lecocq, T., and Van Noten, M. K., Shani-Kadmiel, S., Sleeman, R., Sokos, E., K., S., Stott, K.: Seismic monitoring of the Auckland Volcanic Field during A. E., Subedi, S., Sørensen, M. B., Taira, T., Tapia, M., Turhan, New Zealand’s COVID-19 lockdown, Solid Earth, 12, 363–373, F., van der Pluijm, B., Vanstone, M., Vergne, J., Vuorinen, T. A., https://doi.org/10.5194/se-12-363-2021, 2021. Warren, T., Wassermann, J., and Xiao, H.: Global quieting of Walker, P. G., Whittaker, C., Watson, O. J., Baguelin, M., Win- high-frequency seismic noise due to COVID-19 pandemic lock- skill, P., Hamlet, A., Djafaara, B. A., Cucunubá, Z., Mesa, D. O., down measures, Science, 369, 1338–1343, 2020a. Green, W., Thompson, H., Nayagam, S., Ainslie, K. E. C., Bha- Lecocq, T., Massin, F., Satriano, C., Vanstone, M., and Megies, T.: tia, S., Bhatt, S., Boonyasiri, A., Boyd, O., Brazeau, N. F., Cat- SeismoRMS – A simple python/jupyter notebook package for tarino, L., Cuomo-Dannenburg, G., Dighe, A., Donnelly, C. A., studying seismic noise changes (Version 1.0), Zenodo [code], Dorigatti, I., Van Elsland, S. L., FitzJohn, R., Fu, H., Gaythorpe, https://doi.org/10.5281/zenodo.3820046, 2020b. K. A. M., Geidelberg, L., Grassly, N., Haw, D., Hayes, S., Hins- Leyton, F., Leopold, A., Hurtado, G., Pastén, C., Ruiz, S., Montalva, ley, W., Imai, N., Jorgensen, D., Knock, E., Laydon, D., Mishra, G., and Saéz, E.: Geophysical characterization of the Chilean S., Nedjati-Gilani, G., Okell, L. C., Unwin, H. J., Verity, R., seismological stations: First results, Seismol. Res. Lett., 89, 519– Vollmer, M., Walters, C. E., Wang, H., Wang, Y., Xi, X., Lal- 525, 2018a. loo, D. G., Ferguson, N. M., and Ghani, A. C.: The impact of Leyton, F., Pastén, C., Ruiz, S., Idini, B., and Rojas, F.: Empirical COVID-19 and strategies for mitigation and suppression in low- site classification of CSN network using strong-motion records, and middle-income countries, Science, 369, 413–422, 2020. Seismol. Res. Lett., 89, 512–518, 2018b. Welch, P.: The use of fast Fourier transform for the estimation of Lindsey, N. J., Yuan, S., Lellouch, A., Gualtieri, L., Lecocq, power spectra: a method based on time averaging over short, T., and Biondi, B.: City-scale dark fiber DAS mea- modified periodograms, IEEE Trans. Audio, 15, 70–73, 1967. surements of infrastructure use during the COVID-19 Wessel, P., Smith, W. H., Scharroo, R., Luis, J., and Wobbe, F.: pandemic, Geophys. Res. Lett., 47, e2020GL089931, Generic mapping tools: improved version released, Eos, Trans- https://doi.org/10.1029/2020GL089931, 2020. actions American Geophysical Union, 94, 409–410, 2013. Ministry of Science: Public transport, epidemiological and Xiao, H., Eilon, Z. C., Ji, C., and Tanimoto, T.: COVID-19 Societal flight data, available at: https://github.com/MinCiencia/ Response Captured by Seismic Noise in China and Italy, Seis- Datos-COVID19 (last access: 11 November 2020), 2020. mol. Soc. Am., 91, 2757–2768, 2020. Poli, P., Boaga, J., Molinari, I., Cascone, V., and Boschi, L.: The 2020 coronavirus lockdown and seismic monitoring of anthropic activities in Northern Italy, Sci. Rep., 10, 1–8, 2020. Riley, S., Fraser, C., Donnelly, C. A., Ghani, A. C., Abu-Raddad, L. J., Hedley, A. J., Leung, G. M., Ho, L.-M., Lam, T.-H., Thach, T. Q., Chau, P., Chan, K. P., Lo, S. V., Leung, P. Y., Tsang, T., Ho, W., Lee, K. H., Lau, E. M., Ferguson, N. M., and Anderson, R. M.: Transmission dynamics of the etiological agent of SARS in Hong Kong: impact of public health interventions, Science, 300, 1961–1966, 2003. https://doi.org/10.5194/se-12-1075-2021 Solid Earth, 12, 1075–1085, 2021
You can also read


