Online Recommendation Systems: Factors Influencing Use in E-Commerce - MDPI
←
→
Page content transcription
If your browser does not render page correctly, please read the page content below
sustainability

Article
Online Recommendation Systems: Factors
Influencing Use in E-Commerce
Juan-Pedro Cabrera-Sánchez 1 , Iviane Ramos-de-Luna 2 , Elena Carvajal-Trujillo 3
and Ángel F. Villarejo-Ramos 1, *
 1    Business Administration and Marketing Department, Universidad de Sevilla, 41018 Sevilla, Spain;
      jcabrera10@us.es
 2    Economics and Business Studies Department, Universitat Oberta de Catalunya, 08035 Barcelona, Spain;
      iramosde@uoc.edu
 3    Business Administration and Marketing Department, Universidad de Huelva, 21071 Huelva, Spain;
      carvajal.trujillo@dem.uhu.es
 *    Correspondence: curro@us.es; Tel.: +34-954-56-00-24

 Received: 25 September 2020; Accepted: 23 October 2020; Published: 26 October 2020

 Abstract: The increasing use of artificial intelligence (AI) to understand purchasing behavior has led to
 the development of recommendation systems in e-commerce platforms used as an influential element
 in the purchase decision process. This paper intends to ascertain what factors affect consumers’
 adoption and use of online purchases recommendation systems. In order to achieve this objective,
 the Unified Theory of Adoption and Use of Technology (UTAUT 2) is extended with two variables that
 act as an inhibiting or positive influence on intention to use: technology fear and trust. The structural
 model was assessed using partial least squares (PLS) with an adequate global adjustment on a sample
 of 448 users of online recommendation systems. Among the results, it’s highlighted the importance
 of the inhibiting role of technology fear and the importance that users attach to the level of perceived
 trust in the recommendation system are highlighted. The performance expectancy and hedonic
 motivations have the greatest influence on intention to use these systems. Based on the results,
 this work provides a relevant recommendation to companies for the design of their e-commerce
 platforms and the implementation of online purchase recommendation systems.

 Keywords: recommendation system; artificial intelligence; e-commerce; technology fear; trust

1. Introduction
     Being able to make decisions based on data is an unquestionable advantage for companies.
New technologies such as big data and artificial intelligence (AI) have radically changed data
analytics [1]. These technologies represent a revolution in how companies can obtain a great
quantity of valuable data and how they analyze them. They enable them to perform a predictive [2],
descriptive, and even prescriptive analysis of their market and the environment [3]. Furthermore,
these quasi-real-time analyses represent a great competitive advantage for companies [4] and challenge
them to develop sustainable competitive advantages [5].
     The technology adoption by companies and consumers is decisive for its success. Therefore, if the
factors that affect its adoption and behavioral intention are known, implementation in companies and
acceptance by consumers/users could be better and more easily managed. From the classical theories
of acceptance of technology—the Technology Acceptance Model (TAM) [6] and the Theory of Planned
Behavior (TPB) [7]—the model proposed by the Unified Theory of Adoption and Use of Technology
(UTAUT) [8] brings together the most outstanding contributions of the previous models. This model
adequately explains the adoption of technology by companies but had to be revised and expanded in

Sustainability 2020, 12, 8888; doi:10.3390/su12218888                      www.mdpi.com/journal/sustainability
Sustainability 2020, 12, 8888 2 of 15
order to explain consumer adoption of technology, giving rise to UTAUT 2 [9]. This model provides
excellent results when studying consumer acceptance and use of technology, but the question remains
whether there are other variables that extend and improve the UTAUT 2 model.
Recently, big data has made great advances due to AI algorithms, which at the same time
have benefited from the development of big data technology [10]. Although there are more benefits
than disadvantages, there are still certain barriers to its acceptance and use: ignorance, technological fear,
distrust, resistance to change, or the limitations of the technology in itself [11].
Most of the literature on big data and AI focuses, fundamentally, on technical aspects related to the
big data ecosystem and new AI algorithms [10,12–14], application development, statistical modeling
and experimentation [4], and study cases on data mining and data analytics [15]. However, few works
integrate the use of big data or AI tools in a business management system. On the one hand, the big
data was investigated in different contexts: the behavioral intention of big data analytics [16]; the use
of big data to obtain online consumer reviews (OCR), which will benefit companies and consumers in
an e-commerce context [17]; big data technology adoption [18,19]; and the effect of resistance to the
use of big data techniques in companies [20]. On the other hand, research into AI applications and
implementation only exists in specific sectors, such as education [21], health [22], consumer privacy [23],
and social networks [24].
Purchase recommendation systems use the information from online buyers’ digital activity to
make suggestions and recommendations to consumers when they start the conversion process in
an e-commerce platform. According to Hong et al. [25] and Fu et al. [26], the perception of review
helpfulness is an important step in the online shopping decision-making process. This study intended
to ascertain what factors affect the adoption and use of online purchase recommendation systems.
Consumers are extremely vulnerable to biased personalized online recommendations [27].
Section 2 of this paper addresses the theoretical justification of the relations of the proposed
causal model. Section 3 outlines the methodology used in the research, and in Section 4 we describe
and analyze the results obtained after applying the model in the sample observed. The paper finishes
with the main theoretical and practical conclusions, as well as the study’s limitations.
2. Theoretical Background and Hypotheses
The integration characteristics of the UTAUT model [8] make it a suitable model to measure the
level of acceptance and use of tools developed from artificial intelligence (AI). The extended version,
UTAUT 2 [9], oriented towards explaining the use of technologies in consumer markets, will make it
possible to understand the acceptance and the use of certain applications developed from AI in online
purchase situations. This paper focuses on the information that recommendation systems provide to
online buyers in e-commerce.
The reference terms of the UTAUT 2 model consider precedents of behavioral intention of use
of technology: (1) performance expectancy (PE), defined as the degree to which using a technology
offers benefits (usefulness) in performing certain activities; (2) effort expectancy (EE), which measures
the degree of facility (ease of use) associated with the use of the technology; (3) social influence (SI) or
how consumers perceive that friends and family think that they should use a technology; (4) facilitating
conditions (FC), consumers’ perceptions of which resources and support are available to engage in
a behavior; (5) hedonic motivations (HM), measured through perceived enjoyment as a determinant of
technology use; (6) price value (PV), the value perceived by the consumer in relation to the price paid for
using the technology; and (7) habit (HT), measured by the habitual and natural use of the technology.
Habit and facilitating conditions also directly influence the use (Use) of the technology.
Furthermore, behavioral intention of use of technology (BI) positively influences the use.
Arenas-Gaitán et al. [28] indicate that the value of UTAUT 2 lies in its ability to identify the
principal determinants of adoption. The effect of different moderating variables can be included and
considered in the model. In our case, latent variables, technology fear (TF) and trust (TR), are included
in an attempt to extend the model and to improve its explanatory capacity.Sustainability 2020, 12, 8888 3 of 15
Different hypotheses based on the extension of the UTAUT 2 model for the case of acceptance and
use of purchase recommendation systems in e-commerce users are proposed.
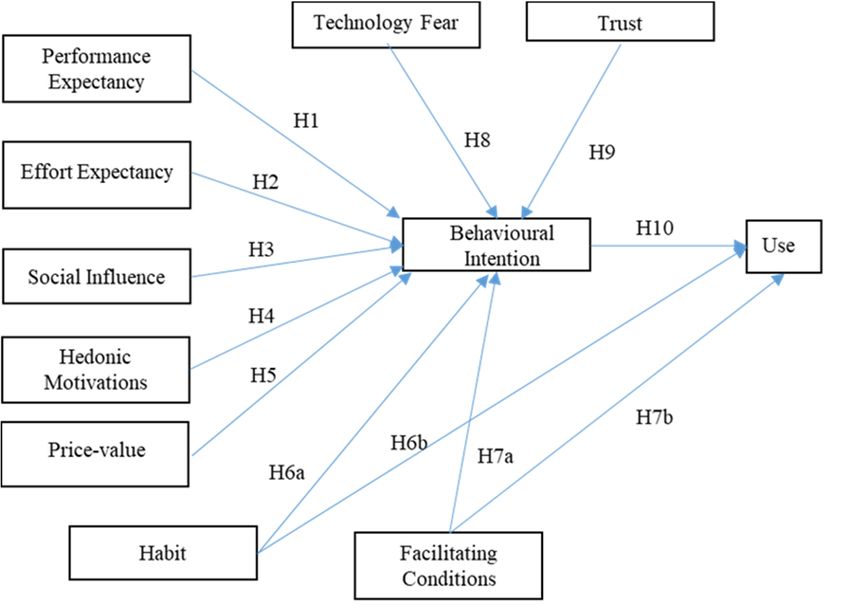
Performance expectancy is one of the most influential variables on behavioral intention.
Several papers [18,29,30], besides the original paper itself [8], support this positive relation. Therefore,
we formed a hypothesis:
Hypothesis 1 (H1). Performance expectancy positively influences the behavioral intention of recommendation
systems in e-commerce.
Other researchers [29–33] reinforce the sense and the weight of the effect that effort expectancy
has on behavioral intention. Thus, we formed the second hypothesis of the model:
Hypothesis 2 (H2). Effort expectancy positively influences the behavioral intention of recommendation systems
in e-commerce.
In the original model of Venkatesh et al. [8] and the extended model UTAUT 2 [9], social influence
measures the extent to which users are influenced by what others (friends, family) think about the use
of technology. Some previous papers in the same online purchase context show that social influence is
a very strong antecedent of behavioral intention [20,34–36] and adoption of an IT platform [37]. Thus,
we formed a new hypothesis:
Hypothesis 3 (H3). Social influence positively influences the behavioral intention of recommendation systems
in e-commerce.
Hedonic motivations are the pleasure and/or the enjoyment obtained through using technology [9].
This enjoyment is a relevant predictor of the behavioral intention of the technology [38–40].
Other researchers with similar technologies, such as m-commerce [41] or tourist geolocation [42],
show hedonic motivation as one of the main influences on the behavioral intention of these applications
by users. Hence, we formed the fourth hypothesis of our research:
Hypothesis 4 (H4). Hedonic motivation positively influences the behavioral intention of recommendation
systems in e-commerce.
To extend the consumer context of the acceptance model, UTAUT 2 adds a new variable that
measures perceived value beyond the benefit for consumers who use the technology. This variable,
price value, compares the cost for consumers with the benefit of using it [9]. Although some papers
about free access mobile technologies [42] cannot show the positive influence on behavioral intention,
we formed an original hypothesis:
Hypothesis 5 (H5). Price value positively influences the behavioral intention of recommendation systems in
e-commerce.
Facilitating conditions represent easy access to the resources needed to use a new technology
and the subsequent support [8]. More recent studies have verified this positive effect on behavioral
intention [43–45].
According to the Theory of Planned Behavior [7], we can test how facilitating conditions positively
affect the use of a new technology. Various subsequent papers [18,29,31,43,46,47] show this relationship.
Accordingly, we formed the following hypotheses:
Hypothesis 6a (H6a). Facilitating conditions positively influence the behavioral intention of recommendation
systems in e-commerce.Sustainability 2020, 12, 8888 4 of 15
Hypothesis 6b (H6b). Facilitating conditions positively influence the use of recommendation systems in
e-commerce.
Habit is the usual conduct of a person because of a learnt behavior [48]. In the UTAUT 2 model [9],
the authors denote habit as past expertise and outline how this expertise represents the reason to
use new technologies [49]. Previous studies demonstrated the influence of habit on the behavioral
intention of use of a technology [50,51], and habit cannot only affect intention to use but also use of this
technology [42,48,52]. Therefore, two hypotheses were formed:
Hypothesis 7a (H7a). Habit positively influences the behavioral intention of recommendations system in
e-commerce.
Hypothesis 7b (H7b). Habit positively influences the use of recommendation systems in e-commerce.
One of the variables in the extended model of UTAUT 2 is technology fear. Initially, this concept
was developed as technology anxiety in works such as Guo et al. [53], Niemelä-Nyrhinen [54],
and Venkatesh [55]. These researchers demonstrate that the greater the level of novelty of the
technology, the bigger the anxiety effect. As Martínez-Córcoles et al. [56] indicate, adoption of new
technologies is largely influenced by technology fear and discomfort. Fear has an important effect on
the behavioral intention to use when the user has not used the technology before [57]. The proliferation
of new technologies leads consumers to adopt them quickly, which leads to paired emotional and
cognitive reactions, with fear appearing among consumers [58]. Technology fear, different from
IT anxiety, is considered close to technophobia including aversive behavioral, affective, and attitudinal
responses to new technologies [56].
The fear of the consequences of using a new technology can hinder behavioral intention, and this
situation causes insecurity and a feeling of intimidation. Furthermore, fear is an important barrier for
intention to use, as Heinssen Jr. et al. [59] show with the Computer Anxiety Rating Scale (CARS) in the
dimension that is called fear. Thus, the following hypothesis was formed:
Hypothesis 8 (H8). Technology fear negatively influences the behavioral intention of recommendation systems
in e-commerce.
Trust reflects a user’s security about meeting expectations vis-à-vis the behavior of the other party
in the relationship [60,61]. The user trusts the e-services provider to perform its tasks, comply with the
service promise, and maximize user profit [62,63]. Trust has been one of the strongest predictors of the
behavioral intention of e-commerce [46]. As Zhou [64] indicates, the user hopes to obtain a benefit by
using technology. Therefore, it can positively and directly affect users’ behavioral intention based on
trust in this technology system. Therefore, the following hypothesis was formed:
Hypothesis 9 (H9). Trust positively influences the behavioral intention of recommendation systems
in e-commerce.
The main technology acceptance models (TAM [6], UTAUT [8], and UTAUT 2 [9]) show a
direct relationship between behavioral intention and technology usage. This influence has been
demonstrated in similar contexts to an AI application, such as internet banking adoption [36],
online flight purchases [65], acceptance of an electronic document management system [66], and ERP
(Enterprise Resource Planning) adoption [29]. Therefore, we formed as a hypothesis:
Hypothesis 10 (H10). The behavioral intention of recommendation systems in e-commerce positively affects
the use.Sustainability 2020, 12, 8888 5 of 15
Figure 1 shows the proposed model of acceptance and use of recommendation systems in
e-commerce as an AI application for users.
Sustainability 2020, 12, x FOR PEER REVIEW 5 of 15
Figure1.1.Proposed
Figure Proposedmodel.
model.
3.3.Research
ResearchMethodology
Methodology
3.1.
3.1.Sample
SampleDescription
Description
The
Thesample
sample drawn for this
drawn forresearch came from
this research individuals
came who answered
from individuals whoan answered
online questionnaire
an online
spread across social networks and mailing lists. Both circulation methods mainly
questionnaire spread across social networks and mailing lists. Both circulation methods mainly reached under and
postgraduate students since the messages originated from the university environment.
reached under and postgraduate students since the messages originated from the university The data were
collected in March
environment. The2019,
dataand mostcollected
were respondents were university
in March 2019, andgraduates and postgraduates
most respondents (42.6%).
were university
Finally, the selected sample consisted of 448 questionnaires from individuals who
graduates and postgraduates (42.6%). Finally, the selected sample consisted of 448 questionnaires stated that they use
online recommendation systems when faced with purchasing decisions. Analysis
from individuals who stated that they use online recommendation systems when faced with of sociodemographic
variables
purchasingin the sample indicated
decisions. Analysisthat 53.1% of participants
of sociodemographic are female,
variables the
in the average
sample age is 27.1
indicated years
that old,of
53.1%
and 71.6% are single. Only 23.2% are hired workers, and 64.9% are students. Furthermore,
participants are female, the average age is 27.1 years old, and 71.6% are single. Only 23.2% are hired 68.75% of
participants
workers, and live64.9%
at home
are and have aFurthermore,
students. monthly income 68.75% of more than €1500.
of participants liveMore than half
at home and of the a
have
sampled (50.7%) participants live in cities with more than 100,000 people.
monthly income of more than €1500. More than half of the sampled (50.7%) participants live in cities
withThis
more questionnaire
than 100,000was pre-tested with several users and with expert researchers who completed
people.
the questionnaire and provided
This questionnaire feedbackwith
was pre-tested about the questions,
several users and testing content
with expert validity. who completed
researchers
the questionnaire and provided feedback about the questions, testing content validity.
3.2. Measurement Scales
3.2.The
Measurement
scales were Scales
adapted from the original UTAUT model of Venkatesh et al. [8], the extended
UTAUT 2 model
The scales[9],wereandadapted
from Davis’
from[67]
theTAM. The UTAUT
original scale items were of
model adapted to online
Venkatesh et al.recommendations
[8], the extended
systems (ORSs) in e-commerce as an application of AI, tested
UTAUT 2 model [9], and from Davis’ [67] TAM. The scale items were adapted in our research. The proposed tomodel
online
adds scale of technology fear adapted from Heinssen et al. [59] and the scales
recommendations systems (ORSs) in e-commerce as an application of AI, tested in our research. of trust adapted from
The
Pavlou and Gefen [68]. All scales were measured using a 7-point Likert scale.
proposed model adds scale of technology fear adapted from Heinssen et al. [59] and the scales of trust
In thefrom
adapted questionnaire,
Pavlou andwe used[68].
Gefen the All
concept
scalesofwere
online recommendation
measured systems
using a 7-point (ORSs)
Likert scale.as an AI
tool/application. In the heading
In the questionnaire, of the
we used thequestionnaire used recommendation
concept of online we include the following explanation
systems (ORSs) as anofAI
what an ORS is: Every time that we buy something, for example, on Amazon,
tool/application. In the heading of the questionnaire used we include the following explanation ofit makes additional
products
what anrecommendations
ORS is: Every time according
that we to oursomething,
buy profile andforprevious purchases,
example, or if you
on Amazon, are looking
it makes for
additional
something or a place, your phone
products recommendations recommends
according whereand
to our profile to go or whatpurchases,
previous to do. or if you are looking for
something or a place, your phone recommends where to go or what to do.
The sample used was taken from a higher-ranking study that researched the acceptance and use
of other IA apps, such as anti-spam filters, geolocation tools, and facial and voice recognition, among
others.Sustainability 2020, 12, 8888 6 of 15
The sample used was taken from a higher-ranking study that researched the acceptance and
use of other IA apps, such as anti-spam filters, geolocation tools, and facial and voice recognition,
among others.
3.3. Statistical Tools
To test the proposed structural model, we used partial least squares–structural equation modeling
(PLS-SEM) before analyzing the reliability and the validity of the measurement scales [69–71],
specifically the statistical software Smart PLS 3.2.3 [72].
The recommendations of Kock [73] and Kock and Lynn [74] suggest that we first check the absence
of measure bias error or common method bias (CMB). To do so, we added various items not known to
have been researched and that were not in the proposed structural model. This new latent variable is
called the CMB variable, which acts as the dependent variable of the others in the model. All variance
inflation factors (VIFs) extracted by this method must be lower than 3.3 to confirm that the sample has
no CMB. Table 1 shows compliance with these requirements.
Table 1. Variance inflation factors (VIFs) extracted from the variables to test the common method bias
(CMB).
CMB Variable
Behavioral intention 1687
Effort expectancy 1731
Facilitating conditions 1858
Habit 1348
Hedonic motivations 1652
Performance expectancy 1852
Price value 1321
Social influence 1515
Technology fear 1259
Trust 1360
Use 1046
4. Results
Structural equation modeling (SEM), as in the case of PLS analysis, firstly tries to ensure the
reliability and validity of the measurement scales.
To analyze each item’s individual reliability, its loadings must be observed. They must be above the
recommended minimum level (0.7) when using variables measured in the B mode [75,76]. All the items,
except FC4, TF1, TF2, TF4, and TF8, met this requirement. Therefore, we decided to eliminate these
indicators from the scale of technology. Table 2 shows items and loadings over 0.7 in all cases.
We analyzed the reliability of the constructs with two indicators: composite reliability and
Cronbach’s alpha. The values obtained were over the 0.7 suggested [77]. To analyze the convergent validity,
we used the average variance extracted (AVE). The results were over the 0.5 recommended [62].
These results can be seen in Table 3.
The discriminant validity of the measurement model was successfully carried out with a double test:
(1) Fornell–Larcker’s test, which compares the square roots of the AVE (shown in the diagonal in bold)
with the correlations of each variable (shown in rows and columns). The first value must be greater
than those in their respective rows and columns [78]; and (2) the heterotrait–monotrait ratio (HTMT),
where all the values of the correlations between variables must be less than 0.9 and preferably less than
0.8 [75]. Table 4 shows both results.Sustainability 2020, 12, 8888 7 of 15
Table 2. Measurement scales and loadings.
Construct Items Loadings
EE1: I find it easy to learn to use ORSs. 0.877
EE2: My interaction with ORSs is clear
Effort expectancy—EE 0.901
and comprehensible.
EE3: I find it easy to use ORS. 0.909
EE4: I believe that learning applications
0.873
that use ORSs is easy for me.
PE1: I believe ORSs are useful for me in
0.812
my day-to day life.
Performance expectancy—PE PE2: I believe that with ORSs my
possibilities of achieving things that are 0.830
important for me increase.
PE3: I believe ORSs help me to carry out
0.793
my tasks more quickly.
PE4: I believe ORSs improve my
0.830
performance.
SI1: People who I care about think I
0.914
should use ORSs.
Social influence—SI
SI2: People who influence my behavior
0.955
think I should use ORS applications.
SI3: People whose opinion I value and
0.939
consider believe I should use ORSs.
HM1: Using ORSs is fun. 0.924
Hedonic motivations—HM HM2: I enjoy using ORSs. 0.957
HM3: Using ORSs is very entertaining. 0.937
PV1: ORSs are reasonably priced. 0.815
Price value—PV PV2: ORSs are worth what they cost. 0.905
PV3: At the current price ORSs give
0.931
good value.
HT1: The use of ORSs has become a
0.858
habit for me.
Habit—HT HT2: I am an ORS addict. 0.836
HT3: I must use ORSs. 0.829
HT4: Using ORSs has become
0.869
something natural for me.
FC1: I have the necessary resources to
use ORSs.
FC2: I have the necessary knowledge to
use AI applications.
0.851
FC3: AI is compatible with other
Facilitating conditions—FC
applications I use.
FC4: When I have trouble using AI
applications, I can get help.
FC2: I have the necessary knowledge to
0.858
use ORSs.
FC3: ORSs are compatible with other
0.864
applications I use.
TF3: I feel afraid when working with
0.753
ORSs.
Technology Fear—TF TF5: I feel anxiety when working with
0.875
ORSs.
TF6: I feel insecure about my capacity to
0.813
understand ORSs.
TF7: I have avoided ORSs because I am
not familiar with them and, to a certain 0.884
extent, they intimidate me.Sustainability 2020, 12, 8888 8 of 15
Table 2. Cont.
Construct Items Loadings
TR1: One can trust ORSs. 0.757
Trust—TR TR2: ORSs fulfil what they promise. 0.812
TR3: ORSs deal with satisfying the user. 0.836
BI1: I intend to use ORSs in the near
0.871
future.
Behavioral intention—BI
BI2: I will always try to use ORSs in my
0.907
daily life.
BI3: I plan to use ORSs frequently. 0.932
Table 3. Composite reliability and convergent validity.
Average
Cronbach’s Composite
Construct rho_A Variance
Alpha Reliability
Extracted (AVE)
Behavioral
0.887 0.888 0.930 0.817
Intention
Effort Expectancy 0.913 0.928 0.939 0.793
Facilitating
0.821 0.826 0.893 0.736
Conditions
Habit 0.870 0.871 0.911 0.720
Hedonic
0.933 0.934 0.957 0.882
Motivation
Performance
0.834 0.836 0.889 0.667
Expectancy
Price Value 0.862 0.903 0.915 0.783
Social Influence 0.929 0.931 0.955 0.876
Technology Fear 0.857 0.932 0.900 0.694
Trust 0.730 0.758 0.844 0.644
Use 1.000 1.000 1.000 1.000
We evaluated the structural model to test the hypotheses proposed and analyze the path coefficients.
We carried out bootstrapping with 10,000 sub-samples to check the statistical significance of each
of the coefficients or paths (see Table 5). We used the SRMR criterion (Standardized Root Mean
Square Residual) to assess the model’s goodness of fit [79]. The value obtained was 0.055, less than the
0.08 proposed by [75], suggesting a good fit of the complete model.
The model has a higher explanatory power than the minimum level of 10% recommended by [80],
measured by the explained variance of the endogenous variables (R2 ).
The model results in Table 5 show both the verified hypotheses and the size of their effect. We must
emphasize that although the R2 of the Intention to use is well above the minimum recommended
value (0.1) [80], the same does not apply to Use, the R2 of which is lower. It is curious to see how
the model explains the intention to use but not the use that is made. Seven of the 12 relationships
formulated are significant, of which only the results for expectations–intention to use ratio exceed the
minimum 0.2 recommended by Chin [81]. In all cases where the ratios were significant, the effect size
(f2) was between 0.015 and 0.35 [81], except in scenarios 7b, 9, and 10, which were below it. However,
the model has a very good fit as the SRMR obtained is only 0.055, well below 0.08 [82].Sustainability 2020, 12, 8888 9 of 15
Table 4. Discriminant validity. Fornell–Larcker criterion (below the main diagonal) and heterotrait–monotrait ratio (HTMT) (above the main diagonal).
BI EE FC HT HM PE PV SI TF TR USE
BI 0.904 0.384 0.386 0.394 0.526 0.597 0.379 0.408 0.251 0.456 0.156
EE 0.351 0.89 0.702 0.351 0.456 0.362 0.247 0.267 0.342 0.301 0.106
FC 0.331 0.604 0.858 0.43 0.413 0.3 0.411 0.159 0.452 0.383 0.108
HT 0.347 0.317 0.365 0.848 0.386 0.363 0.299 0.343 0.099 0.298 0.149
HM 0.479 0.423 0.366 0.348 0.939 0.556 0.401 0.396 0.192 0.373 0.07
PE 0.516 0.327 0.255 0.312 0.494 0.816 0.377 0.598 0.101 0.484 0.088
PV 0.338 0.214 0.339 0.26 0.363 0.325 0.885 0.285 0.14 0.408 0.051
SI 0.371 0.249 0.138 0.308 0.367 0.523 0.255 0.936 0.043 0.333 0.051
TF −0.236 −0.306 −0.381 −0.034 −0.178 −0.088 −0.127 0.014 0.833 0.272 0.067
TR 0.381 0.255 0.31 0.244 0.315 0.39 0.334 0.277 −0.226 0.803 0.027
USE 0.148 0.101 0.099 0.14 0.068 0.082 0.05 0.05 −0.032 −0.02 1
Note: The values on the diagonal must be greater than the quantities in each column. If this is the case is in bold.Sustainability 2020, 12, 8888 10 of 15
Table 5. Structural model estimates (path coefficients).
Estimates P Values R2 f2 Validation
Hypothesis 1:
0.048 n.s. 0.002 Not Supported
EE -> BI
Hypothesis 2:
0.258 *** 0.000 0.064 Supported
PE -> BI
Hypothesis 3:
0.076 n.s. 0.006 Not Supported
SI -> BI
Hypothesis 4:
0.176 ** 0.001 0.032 Supported
HM -> BI
Hypothesis 5:
0.076 n.s. 0.007 Not Supported
PV -> BI
Hypothesis 6a:
0.014 n.s. 0.000 Not supported
FC -> BI
Hypothesis 6b:
0.030 n.s. 0.001 Not Supported
FC -> USE
Hypothesis 7a:
0.111 * 0.011 0.016 Supported
HT -> BI
Hypothesis 7b:
0.092 * 0.046 0.007 Supported
HT -> USE
Hypothesis 8:
−0.126 ** 0.002 0.021 Supported
TF -> BI
Hypothesis 9:
0.107 * 0.017 0.014 Supported
TR -> BI
Hypothesis 10:
0.106* 0.027 0.010 Supported
BI -> USE
Behavioral
0.401
Intention
Use 0.032
SRMR 0.055
Note: *** p < 0.001, ** p < 0.01, * p < 0.05. (bootstrap with 10,000 sub-samples). n.s. (not significative).
We also calculated Stone–Geisser’s Q2 to evaluate the predictive capacity of the model, and by
obtaining all Q2 values greater than 0 we can conclude that it has a relevant predictive capacity [76]
(see Table 6).
Table 6. Predictive summary of the latent variables.
RMSE MAE Q2 _Predict
Behavioral Intention 0.803 0.616 0.363
Use 0.999 0.877 0.009
5. Conclusions and Limitations
5.1. Theoretical Implications
This study extended the UTAUT model, adding two new explanatory variables: (1) technology
fear—in this case, of an AI-based ORS application—and (2) trust in technology. We intended
to increase the predictive value of the original model’s explanation and to find out how factors
(positively and negatively) influence the behavioral intention and use of a recommendation system in
online purchasing.
The results of the research show that the behavioral intention of the recommendation systems
receive positive and relevant influences of variables such as: (1) performance expectancy, the perception
of obtaining good results when using the recommended information in shopping decisions,
coinciding with the results of the work of Lee and Song [33] about e-government and the paperSustainability 2020, 12, 8888 11 of 15
of Yu [30] about the behavioral intention of internet banking; (2) the positive influence that hedonic
motivations have on using recommendation systems, as stated by Zhang et al. [41] on online purchasing
in the same context, and tourist recommendation [42] or adopting augmented reality smart glasses
(ARSGs) [83]; (3) positive influence of habit, measured by the habitual use of these systems [52]; and (4)
trust in the usefulness of the information provided by the recommenders [61].
Regarding the rest of the variables of the original UTAUT 2 model [9], we highlight an insignificant
influence on the behavioral intention of recommendation systems of effort expectancy (the AI
application’s level of ease of use), social influence (what others consider appropriate to use), perceived
price value (the perceived value in relation to the cost), and the facilitating conditions, considered as
the ease of access to the application. The variable habit shows a significant favorable effect on use of
the recommendation systems. However, the positive relationship between facilitating conditions and
use was not supported.
With respect to the model’s extended variables, we verified the significant influence of trust on
recommendation systems concerning behavioral intention, already shown in papers in the digital
environment [46,64], and it is a facilitator of use of this AI application. Technology fear displays a
negative and significant effect on the intention of use of these recommendation systems, in line with
the work of Gelbrich and Sattler [57].
In light of the results, and seeing the level of acceptance of the hypotheses proposed, we consider
that extending UTAUT 2 with the fear inhibiting factor and the trust facilitator factor is an explanatory
model of the intention and use by consumers in online purchasing recommendation systems.
5.2. Practical Implications
With regard to the professional implications, it should be noted that, as in previous works [20,29],
this research indicates for some of the variables, such as the facilitating conditions and the
effort expectancy, that as the level of digitalization of users and of the linked tools advances,
online buyers/users cease to perceive the difficulty of use of these applications. They get used
to these technologies and expect more perceived benefit than difficulty in their use [18]. This is in
consonance with the strong effect exerted by performance expectancy. Furthermore, users consider
that they have the resources and capacities to use them, particularly when it is a question of, as in
our case, young buyers on average.
The fact that the two variables that have a greater influence on the behavioral intention of
recommendation systems are performance expectancy and hedonic motivations leads us to recommend
that the developers of these systems try to adapt them to the benefit expected by the online buyer,
both at the efficiency level in the recommendations using big data analytics [84] given in the purchasing
process and at the level of design and usability, to attain a greater enjoyment when these systems
appear in the online purchasing process. In addition, like Xu et al. [85] suggest, product managers
can draw real-time information regarding customers’ recommendations and use this information to
redesign new products.
With respect to trust and technology fear, factors that influence intention to use
recommendation systems, campaigns should be carried out to convey the sensation of safety and
trust in the acquisition and use of consumers’ data to provide useful information in the online
purchasing processes.
5.3. Limitations
Just including two variables to extend the UTAUT 2 model can result in a biased view, as the
effect of other possible constructs, such as perceived risk or privacy conditions, was not considered.
These constructs are closely linked to the acceptance of systems that use digital fingerprint-based data
to provide information of interest, such as the AI-based recommendation systems that process data
collected via big data tools.Sustainability 2020, 12, 8888 12 of 15
Secondly, new moderator variables other than those of the original UTAUT ought to be explored
to evaluate possible new effects not considered before. These could allow us to establish consumer
behavior differences and define possible market segments.
Thirdly, the sample size will allow us in the future to establish behavioral differences
between groups, which we can analyze via a posteriori segmentation technique, such as POS-PLS
(Prediction-oriented Segmentation-Partial Least Squares).
Lastly, despite having intended to use the online collection method to broaden the sample’s
spectrum of representativeness, the sample had a certain bias in the low average age, high proportion
of students, and high average income among the participants.
Author Contributions: Individual contributions by authors: Conceptualization, J.-P.C.-S. and Á.F.V.-R.;
methodology, J.-P.C.-S., E.C.-T. and Á.F.V.-R.; software, J.-P.C.-S.; validation, J.-P.C.-S., Á.F.V.-R. and I.R.-d.-L.;
formal analysis, J.-P.C.-S. and I.R.-d.-L.; investigation, J.-P.C.-S. and Á.F.V.-R.; resources, J.-P.C.-S., E.C.-T.
and Á.F.V.-R.; data curation, J.-P.C.-S.; writing—original draft preparation, J.-P.C.-S., E.C.-T. and Á.F.V.-R.;
writing—review and editing Á.F.V.-R. and I.R.-d.-L.; supervision, Á.F.V.-R.; project administration, Á.F.V.-R..
All authors have read and agreed to the published version of the manuscript.
Funding: This research received no external funding.
Acknowledgments: We are grateful for the technical support given by the Research Group MAD- Analytic and
Digital Marketing of University of Seville and the recommendations received from Liébana-Cabanillas, Ph. D of
the University of Granada.
Conflicts of Interest: The authors declare no conflict of interest.
References
1. Nilsson, N.J. The Quest for Artificial Intelligence. In A history of Ideas and Achievement;
Cambridge University Press: Cambridge, UK, 2009; ISBN 9780511819346.
2. Waller, M.A.; Fawcett, S.E. Data Science, Predictive Analytics, and Big Data: A Revolution That Will
Transform Supply Chain Design and Management. J. Bus. Logist. 2013, 34, 77–84. [CrossRef]
3. Joseph, R.C.; State, P.; Johnson, N.A. Big data and transformational government. IEEE Comput. Soc. 2013,
15, 43–48. [CrossRef]
4. Sivarajah, U.; Kamal, M.M.; Irani, Z.; Weerakkody, V. Critical analysis of Big Data challenges and
analytical methods. J. Bus. Res. 2016, 70, 263–286. [CrossRef]
5. Erevelles, S.; Fukawa, N.; Swayne, L. Big Data consumer analytics and the transformation of marketing.
J. Bus. Res. 2016, 69, 897–904. [CrossRef]
6. Davis, F. A Technology Acceptance Model for Empirically Testing New End-User Information Systems:
Theory and results. Ph.D. Thesis, Massachusetts Institute of Technology, Sloan School of Management,
Cambridge, MA, USA, December 1985.
7. Ajzen, I. The theory of planned behavior. Organ. Behav. Hum. Decis. Process. 1991, 50, 179–211. [CrossRef]
8. Venkatesh, V.; Morris, M.G.; Davis, G.B.; Davis, F.D. User Acceptance of Information Technology: Toward a
Unified View. MIS Q. 2003, 27, 425–478. [CrossRef]
9. Venkatesh, V.; Thong, J.Y.L.; Xu, X. Consumer Acceptance and Use of Information Technology: Extending the
Unified Theory of Acceptance and Use of Technology. MIS Q. 2012, 36, 157–178. [CrossRef]
10. Herrera Triguero, F. Inteligencia Artificial, Inteligencia Computacional y Big Data; Universidad de Jaén—Servicio
de publicaciones e intercambio: Jaén, Spain, 2014; ISBN 9788484398912.
11. Yaqoob, I.; Hashem, I.A.T.; Gani, A.; Mokhtar, S.; Ahmed, E.; Anuar, N.B.; Vasilakos, A.V. Big data:
From beginning to future. Int. J. Inf. Manag. 2016, 36, 1231–1247. [CrossRef]
12. Hinton, G.E.; Osindero, S.; Teh, Y.W. A fast learning algorithm for deep belief nets. Neural Comput. 2006,
18, 1527–1554. [CrossRef]
13. Hinton, G.E.; Srivastava, N.; Krizhevsky, A.; Sutskever, I.; Salakhutdinov, R.R. Improving neural networks
by preventing co-adaptation of feature detectors. arXiv 2012, arXiv:1207.0580.
14. Triguero, I.; Peralta, D.; Bacardit, J.; García, S.; Herrera, F. MRPR: A MapReduce solution for prototype
reduction in big data classification. Neurocomputing 2015, 150, 331–345. [CrossRef]Sustainability 2020, 12, 8888 13 of 15
15. Pérez-Martín, A.; Pérez-Torregrosa, A.; Vaca, M. Big Data techniques to measure credit banking risk in home
equity loans. J. Bus. Res. 2018, 89, 448–454. [CrossRef]
16. Kwon, O.; Lee, N.; Shin, B. Data quality management, data usage experience and acquisition intention of big
data analytics. Int. J. Inf. Manag. 2014, 34, 387–394. [CrossRef]
17. Salehan, M.; Kim, D.J. Predicting the performance of online consumer reviews: A sentiment mining approach
to big data analytics. Decis. Support Syst. 2016, 81, 30–40. [CrossRef]
18. Brünink, L. Cross-Functional Big Data Integration: Applying the Utaut Model. Master’s Thesis,
University of Twente, Enschede, The Netherlands, 2016.
19. Rahman, N. Factors Affecting Big Data Technology Adoption. In Proceedings of the Student Research
Symposium 2016, Portland, OR, USA, 4 May 2016.
20. Cabrera-Sánchez, J.P.; Villarejo-Ramos, Á.F. Factores que afectan a la adopción del Big Data como instrumento
de marketing en las empresas españolas. In Proceedings of the XXVIII Jornadas Luso-Espanholas de
Gestâo Científica, Guarda, Portugal, 7–10 February 2018.
21. Churamani, N.; Anton, P.; Brügger, M.; Fließwasser, E.; Hummel, T.; Mayer, J.; Mustafa, W.; Ng, H.G.;
Nguyen, T.L.C.; Nguyen, Q.; et al. The Impact of Personalisation on Human-Robot Interaction in
Learning Scenarios. In Proceedings of the 5th International Conference on Human Agent Interaction,
Bielefeld, Germany, 17–20 October 2017. [CrossRef]
22. Fan, W.; Liu, J.; Zhu, S.; Pardalos, P.M. Investigating the impacting factors for the healthcare professionals to
adopt artificial intelligence-based medical diagnosis support system (AIMDSS). Ann. Oper. Res. 2018. [CrossRef]
23. Jin, Z. AI and Consumer Privacy; NBER wp24253 Jan 2018; University of Chicago Press: Cambridge,
MA, USA, 2018.
24. Liu, X. A big data approach to examining social bots on Twitter. J. Serv. Mark. 2019. [CrossRef]
25. Hong, H.; Xu, D.; Wang, G.A.; Fan, W. Understanding the determinants of online review helpfulness:
A meta-analytic investigation. Decis. Support Syst. 2017, 102, 1–11. [CrossRef]
26. Fu, H.; Manogaran, G.; Wu, K.; Cao, M.; Jiang, S.; Yang, A. Intelligent decision-making of online shopping
behavior based on internet of things. Int. J. Inf. Manag. 2019. [CrossRef]
27. Xiao, B.; Benbasat, I. An empirical examination of the influence of biased personalized product
recommendations on consumers’ decision making outcomes. Decis. Support Syst. 2018, 110, 46–57. [CrossRef]
28. Arenas-Gaitán, J.; Peral-Peral, B.; Villarejo-Ramos, A.F. Grupos de mayores en la banca electrónica.
Segmentación de clases latentes con PLS-POS. In Proceedings of the Congreso Marketing AEMARK,
Madrid, Spain, 7–9 September 2016.
29. Chauhan, S.; Jaiswal, M. Determinants of acceptance of ERP software training in business schools:
Empirical investigation using UTAUT model. Int. J. Manag. Educ. 2016, 14, 248–262. [CrossRef]
30. Yu, C.S. Factors Affecting Individuals to Adopt Mobile Banking: Empirical Evidence from the UTAUT Model.
J. Electron. Commer. Res. 2012, 13, 104–121.
31. Al-Gahtani, S.S.; Hubona, G.S.; Wang, J. Information technology (IT) in Saudi Arabia: Culture and the
acceptance and use of IT. Inf. Manag. 2007, 44, 681–691. [CrossRef]
32. Kim, H.W.; Chan, H.C.; Gupta, S. Value-based Adoption of Mobile Internet: An empirical investigation.
Decis. Support Syst. 2007, 43, 111–126. [CrossRef]
33. Lee, J.H.; Song, C. Effects of trust and perceived risk on user acceptance of a new technology service.
Soc. Behav. Personal. Int. J. 2013, 41, 587–598. [CrossRef]
34. Agarwal, R.; Rastogi, S.; Mehrotra, A. Customers’ perspectives regarding e-banking in an emerging economy.
J. Retail. Consum. Serv. 2009, 16, 340–351. [CrossRef]
35. Lian, J.W.; Yen, D.C. Online shopping drivers and barriers for older adults: Age and gender differences.
Comput. Hum. Behav. 2014, 37, 133–143. [CrossRef]
36. Martins, C.; Oliveira, T.; Popovič, A. Understanding the internet banking adoption: A unified theory of
acceptance and use of technology and perceived risk application. Int. J. Inf. Manag. 2014, 34, 1–13. [CrossRef]
37. Song, J.; Baker, J.; Wang, Y.; Yong, H.; Bhattacherjee, A. Platform adoption by mobile application developers:
A multimethodological approach. Decis. Support Syst. 2018, 107, 26–39. [CrossRef]
38. Brown, S.A.; Venkatesh, V. Model of Adoption of Technology in Households: A Baseline Model Test and
Extension Incorporating Household Life Cycle. MIS Q. 2005. [CrossRef]
39. Nysveen, H. Intentions to Use Mobile Services: Antecedents and Cross-Service Comparisons. J. Acad.
Mark. Sci. 2005, 33, 330–346. [CrossRef]Sustainability 2020, 12, 8888 14 of 15
40. Van der Heijden User Acceptance of Hedonic Information Systems. MIS Q. 2004, 28, 695. [CrossRef]
41. Zhang, L.; Zhu, J.; Liu, Q. A meta-analysis of mobile commerce adoption and the moderating effect of culture.
Comput. Hum. Behav. 2012, 28, 1902–1911. [CrossRef]
42. Gupta, A.; Dogra, N. Tourist Adoption of Mapping Apps: A Utaut2 Perspective of Smart Travellers.
Tour. Hosp. Manag. 2017, 23, 145–161. [CrossRef]
43. Duyck, P.; Pynoo, B.; Devolder, P.; Voet, T.; Adang, L.; Ovaere, D.; Vercruysse, J. Monitoring the PACS
implementation process in a large university hospital-discrepancies between radiologists and physicians.
J. Digit. Imaging 2010, 23, 73–80. [CrossRef] [PubMed]
44. Hung, Y.; Wang, Y.; Cho, S.; Chou, T. User Acceptance of E-Government Services. In Proceedings of the
PACIS 2007, Auckland, New Zealand, 4–6 July 2007; Association for Information Systems AIS Electronic
Library (AISeL): Langkawi Island, Malaysia, 2007; p. 97.
45. Wu, Y.L.; Tao, Y.H.; Yang, P.C. Using UTAUT to explore the behavior of 3G mobile communication users.
In Proceedings of the 2007 IEEE International Conference on Industrial Engineering and
Engineering Management, Singapore, 2–4 December 2007; pp. 199–203. [CrossRef]
46. Kim, D.J.; Steinfield, C.; Lai, Y.J. Revisiting the role of web assurance seals in business-to-consumer
electronic commerce. Decis. Support Syst. 2008, 44, 1000–1015. [CrossRef]
47. Bock, G.W.; Zmud, R.W.; Kim, Y.G.; Lee, J.N. Behavioral Intention Formation in Knowledge Sharing:
Examining the Roles of Extrinsic Motivators, Social-Psychological Forces, and Organizational Climate.
MIS Q. 2005, 29, 87–111. [CrossRef]
48. Limayem, M.; Hirt, S.G.; Cheung, C.M.K. How habit limits the predictive power of intention: The case of
information systems continuance. MIS Q. 2007, 31, 705–737. [CrossRef]
49. Ajzen, I. Residual Effects of Past on Later Behavior. Personal. Soc. Psychol. Rev. 2002, 6, 107–122. [CrossRef]
50. Kim, D.; Park, J.; Morrison, A.M.; Management, R.; Sciences, C.; Sciences, F. A Model of Traveller Acceptance
of Mobile Technology. Int. J. Tour. Res. 2008, 407, 393–407. [CrossRef]
51. Wu, M.C.; Kuo, F.Y. An empirical investigation of habitual usage and past usage on technology acceptance
evaluations and continuance intention. Database Adv. Inf. Syst. 2008, 39, 48–73. [CrossRef]
52. Seo, D.B.; Ray, S. Habit and addiction in the use of social networking sites: Their nature, antecedents,
and consequences. Comput. Hum. Behav. 2019, 99, 109–125. [CrossRef]
53. Guo, X.; Sun, Y.; Wang, N.; Peng, Z.; Yan, Z. The dark side of elderly acceptance of preventive mobile health
services in China. Electron. Mark. 2013, 23, 49–61. [CrossRef]
54. Niemelä-Nyrhinen, J. Baby boom consumers and technology: Shooting down stereotypes. J. Consum. Mark.
2007, 24, 305–312. [CrossRef]
55. Venkatesh, V. Determinants of perceived ease of use: Integrating control, intrinsic. Inf. Syst. Res. 2000,
11, 342–365. [CrossRef]
56. Martínez-Córcoles, M.; Teichmann, M.; Murdvee, M. Assessing technophobia and technophilia:
Development and validation of a questionnaire. Technol. Soc. 2017, 51, 183–188. [CrossRef]
57. Gelbrich, K.; Sattler, B. Anxiety, crowding, and time pressure in public self-service technology acceptance.
J. Serv. Mark. 2014, 28, 82–94. [CrossRef]
58. Khasawneh, O.Y. Technophobia without boarders: The influence of technophobia and emotional intelligence
on technology acceptance and the moderating influence of organizational climate. Comput. Hum. Behav.
2018, 88, 210–218. [CrossRef]
59. Heinssen, R.K., Jr.; Glass, C.R.; Knight, L.A. Assessing computer anxiety: Development and validation of the
Computer Anxiety Rating Scale. Comput. Hum. Behav. 1987, 3, 49–59. [CrossRef]
60. Schoorman, F.D.; Mayer, R.C.; Davis, J.H. An Integrative Model of Organizational Trust: Past, Present,
and Future. Acad. Manag. Rev. 2007, 32, 344–354. [CrossRef]
61. Garry, T.; Harwood, T. Trust and its predictors withina cyber-physical system context. J. Serv. Mark. 2019. [CrossRef]
62. Straub, D.; Boudreau, M.; Gefen, D. Validation Guidelines for IS Positivist. Commun. Assoc. Inf. Syst. 2004,
13, 380–427.
63. Wu, I.L.; Chen, J.L. An extension of Trust and TAM model with TPB in the initial adoption of on-line tax:
An empirical study. Int. J. Hum. Comput. Stud. 2005, 62, 784–808. [CrossRef]
64. Zhou, T. Examining Location-Based Services Usage from the Perspectives of Unified Theory of Acceptance
and Use of Technology and Privacy Risk. J. Electron. Commer. Res. 2012, 13, 135–144. [CrossRef]Sustainability 2020, 12, 8888 15 of 15
65. Escobar-Rodríguez, T.; Carvajal-Trujillo, E. Online purchasing tickets for low cost carriers: An application
of the unified theory of acceptance and use of technology (UTAUT) model. Tour. Manag. 2014,
43, 70–88. [CrossRef]
66. Afonso, C.; Gonzalez, M.; Roldán, J.; Sánchez-Franco, M. Determinants of user acceptance of a local
eGovernment Electronic Document Management System (EDMS). In Proceedings of the Proceedings of the
European Conference on e-Government, ECEG, Limerick, Ireland, 17–18 June 2010; pp. 19–28.
67. Davis, F. Perceived usefulness, perceived ease of use, and user acceptance of information technology. MIS Q.
1989, 13, 319–340. [CrossRef]
68. Pavlou, P.A.; Gefen, D. Building Effective Online Marketplaces with Institution-Based Trust. Inf. Syst. Res.
2004, 15, 37–59. [CrossRef]
69. Chin, W.W.; Dibbern, J. An Introduction to a Permutation Based Procedure for Multi-Group PLS Analysis:
Results of Tests of Differences on Simulated Data and a Cross Cultural Analysis of the Sourcing of
Information System Services Between Germany and the USA. In Handbook of Partial Least Squares; Springer:
Berlin, Germany, 2010; pp. 171–193. [CrossRef]
70. Hair, J.F.; Ringle, C.M.; Sarstedt, M. Partial Least Squares Structural Equation Modeling:
Rigorous Applications, Better Results and Higher Acceptance. Long Range Plan. 2013, 46. [CrossRef]
71. Sarstedt, M.; Ringle, C.M.; Smith, D.; Reams, R.; Hair, J.F. Partial least squares structural equation
modeling (PLS-SEM): A useful tool for family business researchers. J. Fam. Bus. Strateg. 2014,
5, 105–115. [CrossRef]
72. Ringle, C.M.; Wende, S.; Becker, J.M. SmartPLS. SmartPLS GmbH, Boenningstedt. JSSM 2015, 10, 3.
Available online: http://www.smartpls.com (accessed on 25 October 2020).
73. Kock, N. Common Method Bias in PLS-SEM: A Full Collinearity Assesment Approach. Int. J. e-Collab.
2015, 11. [CrossRef]
74. Kock, N.; Lynn, G.S. Lateral Collinearity and Misleading Results in Variance-Based SEM: An Illustration
and Recommendations. J. Assoc. Inf. Syst. 2012, 13, 546–580. [CrossRef]
75. Dijkstra, T.K.; Henseler, J. Consistent and asymptotically normal PLS estimators for linear structural equations.
Comput. Stat. Data Anal. 2015, 81, 10–23. [CrossRef]
76. Roldán, J.L.; Sánchez-Franco, M.J. Variance-Based Structural Equation Modeling: Guidelines for Using
Partial Least Squares in Information Systems Research. In Research Methodologies, Innovations and
Philosophies in Software Systems Engineering and Information Systems; IGI Global: Hershey, PA, USA, 2012;
pp. 193–221. [CrossRef]
77. Nunnally, J.C. Psychometric Theory, 2nd ed.; MCGraw-Hill College: New York, NY, USA, 1978.
78. Barclay, D.; Thompson, R.; Higgins, C. The Partial Least Squares (PLS) Approach to Causal Modeling:
Personal Computer Adoption and Uses as an Ilustration. Technol. Stud. 1995, 2, 285–309.
79. Hair, J.F., Jr.; Hult, G.T.M.; Ringle, C.; Sarstedt, M. A Primer on Partial Least Squares Structural Equation
Modeling (PLS-SEM); SAGE Publications: Thousand Oaks, LA, USA, 2016.
80. Falk, R.F.; Miller, N.B. A Primer for Soft Modeling; University of Akron Press: Akron, OH, USA, 1992.
81. Chin, W.W. Commentary: Issues and Opinion on Structural Equation Modeling. MIS Q. 1998, 22, vii–xvi.
82. Henseler, J.; Hubona, G.; Ray, P.A.; Hubona, R.; Ash, P. Using PLS path modeling in new technology research:
Updated guidelines. Ind. Manag. Data Syst. 2016, 116, 2–20. [CrossRef]
83. Rauschnabel, P.A.; He, J.; Ro, Y.K. Antecedents to the adoption of augmented reality smart glasses: A closer
look at privacy risks. J. Bus. Res. 2018, 92, 374–384. [CrossRef]
84. Zhou, Z.; Chen, X.; Li, E.; Zeng, L.; Luo, K.; Zhang, J. Edge Intelligence: Paving the Last Mile of Artificial
Intelligence with Edge Computing. Proc. IEEE 2019, 107, 1738–1762. [CrossRef]
85. Xu, Z.; Frankwick, G.L.; Ramirez, E. Effects of big data analytics and traditional marketing analytics on new
product success: A knowledge fusion perspective. J. Bus. Res. 2016, 69, 1562–1566. [CrossRef]
Publisher’s Note: MDPI stays neutral with regard to jurisdictional claims in published maps and institutional
affiliations.
© 2020 by the authors. Licensee MDPI, Basel, Switzerland. This article is an open access
article distributed under the terms and conditions of the Creative Commons Attribution
(CC BY) license (http://creativecommons.org/licenses/by/4.0/).You can also read