Tactile Object Recognition for Humanoid Robots Using New Designed Piezoresistive Tactile Sensor and DCNN - MDPI
←
→
Page content transcription
If your browser does not render page correctly, please read the page content below
sensors
Article
Tactile Object Recognition for Humanoid Robots Using New
Designed Piezoresistive Tactile Sensor and DCNN
Somchai Pohtongkam and Jakkree Srinonchat *

                                          Department of Electronics and Telecommunication Engineering, Rajamangala University of Technology Thanyaburi,
                                          Khlong Luang 12110, Thailand; somchai_po@mail.rmutt.ac.th
                                          * Correspondence: jakkree.s@en.rmutt.ac.th; Tel.: +66-897-775-038

                                          Abstract: A tactile sensor array is a crucial component for applying physical sensors to a humanoid
                                          robot. This work focused on developing a palm-size tactile sensor array (56.0 mm × 56.0 mm) to
                                          apply object recognition for the humanoid robot hand. This sensor was based on a PCB technology
                                          operating with the piezoresistive principle. A conductive polymer composites sheet was used as
                                          a sensing element and the matrix array of this sensor was 16 × 16 pixels. The sensitivity of this
                                          sensor was evaluated and the sensor was installed on the robot hand. The tactile images, with
                                          resolution enhancement using bicubic interpolation obtained from 20 classes, were used to train and
                                          test 19 different DCNNs. InceptionResNetV2 provided superior performance with 91.82% accuracy.
                                          However, using the multimodal learning method that included InceptionResNetV2 and XceptionNet,
                                          the highest recognition rate of 92.73% was achieved. Moreover, this recognition rate improved when
                                          the object exploration was applied to demonstrate.

                                Keywords: tactile sensor; tactile object recognition; DCNN; humanoid robot; transfer learning


Citation: Pohtongkam, S.;
Srinonchat, J. Tactile Object
Recognition for Humanoid Robots           1. Introduction
Using New Designed Piezoresistive               Unlike humans who can identify objects by touching, humanoid robots do not have
Tactile Sensor and DCNN. Sensors
                                          this capability due to the lack of suitable tactile sensors and efficient recognition processing
2021, 21, 6024. https://doi.org/
                                          systems. The critical development of humanoid robot technology can be divided into
10.3390/s21186024
                                          two parts: (1) robot anatomy [1]; (2) the robot nervous system [2]. Developing a physical
                                          structure and human-like learning ability is necessary to enable robots to operate in a home
Academic Editor: Nunzio Cennamo
                                          or office environment. In addition, the development of robots having a human-like hand
                                          structure is desirable [3–5]. This study examines a humanoid robot’s physical sensory
Received: 4 August 2021
Accepted: 6 September 2021
                                          system that can recognize objects by touch. Its essential function is developed based on the
Published: 8 September 2021
                                          human physical sensory system [6]. In object learning and recognition systems of humanoid
                                          robots employed artificial haptic perception [7–11], pressure sensors or tactile sensors are
Publisher’s Note: MDPI stays neutral
                                          utilized [7–11], and the obtained information is sent to a computer for analysis [10]. Object
with regard to jurisdictional claims in
                                          learning and recognition systems are similar to the human sensory system where nerve-
published maps and institutional affil-   ending receptors (e.g., Ruffini endings and Pacinian receptors) obtain information sent to
iations.                                  the brain for interpretation. There have been numerous studies describing the development
                                          of robotic hands. These studies focus on tactile sensor arrays for robot hand artificial skin
                                          application [7–11]. Human sensory recognition is a complicated action resulting from the
                                          biosensor system in the body, which includes three modes of data perception [6]. The first
Copyright: © 2021 by the authors.
                                          mode is tactile perception where contact with the skin of the fingers or palm provides
Licensee MDPI, Basel, Switzerland.
                                          information on the contact geometry or pressure profile.
This article is an open access article
                                                A tactile sensor array produces this mode of data perception for robots and presents
distributed under the terms and           data in a 2D format or tactile image [10]. The second perception mode is kinesthetic
conditions of the Creative Commons        perception, a perception from motion such as rubbing or scrubbing objects. For robots,
Attribution (CC BY) license (https://     this mode of data perception is produced by tactile sensors on the fingertips or palm
creativecommons.org/licenses/by/          from dragging the sensor onto the object and presents data in a 1D format [12]. The third
4.0/).                                    perception mode is global object shape, where perception data is gathered through the

Sensors 2021, 21, 6024. https://doi.org/10.3390/s21186024                                                    https://www.mdpi.com/journal/sensors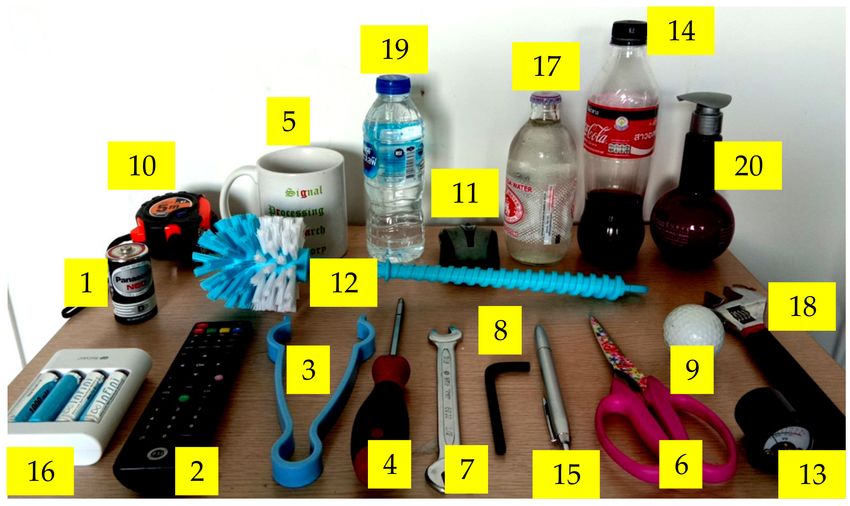
Sensors 2021, 21, 6024                                                                                              2 of 26

                         joints, and the obtained data are used to indicate the global object shape or geometry.
                         This mode of data perception is produced by a bend sensor or angle sensor on the finger
                         joints [13]. The development of artificial haptic perception for integration with a robot
                         hand is challenging because it must mimic the touching of human hands resulting from
                         dexterous movement. The touching of an object provides information on object properties
                         that other methods cannot estimate; for example, we cannot evaluate an object’s softness,
                         roughness, and smoothness without touching it. Another advantage of touch is that it
                         provides data if the visual sensory system fails. Therefore, the haptic sensory system is
                         important in the context of multisensory perception. Humans can distinguish objects using
                         only haptic perception. Still, current robots lack this skill, mainly due to the lack of suitable
                         tactile sensors and appropriate methods for interpreting the resulting data. In this study,
                         a sensor array of a proper size for fixing to the humanoid robot hand and the algorithm
                         for effective tactile object recognition were developed to efficiently operate the humanoid
                         robot object recognition system.

                         2. Related Work
                             This research involved two main parts: (1) the design of the tactile sensor array and (2) the
                         development of the algorithm for object recognition based on tactile image recognition for
                         humanoid robots.

                         2.1. Tactile Sensor Array
                              A tactile sensor array can be developed with several operating principles, and it
                         has various shapes and sizes depending on applications [7–11,14–20]. There are many
                         types of tactile sensors, which can be categorized by the working principles such as
                         piezoresistive [21,22], capacitive [23,24], piezoelectric [25,26], and optical [27,28], etc. This
                         research focused on designing the tactile sensor array based on the piezoresistive principle
                         due to the simple structure, high sensitivity, low cost, and robustness [9,10,16,20,21]. This
                         type of tactile sensor array is commonly used in various applications such as medical [5,7,20],
                         industrial manufacturing [29], civil engineering [30], and human-like activities [31], etc.
                         Recently, the application of piezoresistive tactile sensors for humanoid robots has been
                         gaining much interest [1,2,5,8] [20–31]. The working principle of the piezoresistive tactile
                         sensor can be explained by the piezoresistive effect [16,21,22]. The electrical resistance is
                         affected when an object’s boundary surface changes, as described in Equation (1) [16].

                                                             ∆R
                                                                = (1 + 2σ + πE)χ                                       (1)
                                                              R
                                                                           L
                                                                     R=p                                                (2)
                                                                           A
                         where R is the resistance of conducting material along the length L, ∆R is the change of
                         resistance induced by strain on the conductor, σ is the Poisson’s ratio of the material, π is the
                         piezoresistive coefficient, E is Young’s modulus, and χ is the strain caused by an acting force.
                         The conductor resistance can be calculated by Equation (2). Table 1 shows a variety of tactile
                         sensor arrays that have been developed for a humanoid robot. A distinctive tactile sensor
                         array design with a simple PCB structure was applied for the humanoid robot finger [32].
                         However, its asymmetrical pixel design and geometry were not suitable for the humanoid
                         robot palm. A high-resolution tactile sensor was designed for Flex e-Skin, but the required
                         size was a trade-off [33]. Many tactile array sensors were developed for touch sensing and
                         Flex e-Skin [32–44], while the resolution was compromised. Hence, they were not suitable
                         for developing tactile sensor arrays for high accuracy image recognition capability.
Sensors 2021, 21, 6024                                                                                                           3 of 26

                                Table 1. Piezoresistive tactile sensor array for the anthropomorphic robot.

    Year        Sensor Resolution (Pixel)       Physical Size (mm)      Sensor Size (mm)              Transducer      Application
  2007 [32]                 9×8                        20 × 30              1.8 × 3.4          Conductive rubber         Finger
  2009 [33]                25 × 25                    150 × 150             5.0 × 5.0          Organic resistance     Flex e-Skin
  2009 [34]                 5×5                        32 × 32               50 mm2                    FSR           Touch sensing
  2010 [35]                16 × 16                     50 × 50              3.44 mm2          Conductive polymer      Flex e-Skin
  2011 [36]                 8×8                        20 × 20              2.5 × 2.5          Conductive rubber     Gripper Finger
  2011 [37]                8 × 16                     70 × 120              3.0 × 3.0         Nickel power + PDMS     Flex e-Skin
                                                                                                  P(VDF-TrFE),
  2104 [38]                 8×8                           -                  3.0 × 3.0                                Flex e-Skin
                                                                                                MWCNT/PDMS
                                                                                                Nanoparticles of
  2014 [39]                10 × 10                     20 × 20               1.3 × 1.3                                  Finger
                                                                                                carbon and silica
  2015 [40]                 3×3                        50 × 50                10 × 10          Conductive pillars     Flex e-Skin
  2017 [41]                 8×8                       300 × 220             37.5 × 2.5        Conductive polymer        e-Skin
  2017 [42]                 8×8                       100 × 100              480 mm2           Polymer composite        e-Skin
  2018 [43]                 1×1                        20 × 25                20 × 25         Conductive polymer      Finger tip
  2019 [44]                 4×4                        10 × 10              1900 mm2           Polymer composite        e-Skin

                                           A simple design structure of a conductive rubber transducer was developed using
                                     the first-order feature and k-nearest neighbor (kNN) to improve the object recognition
                                     capability via the sense of touch [36]. In this case, a gripper was used as fingers; hence,
                                     the sensor was too small for the humanoid robot palm [32,36,39,43,44]. On the other
                                     hand, many piezoresistive tactile sensors have also been developed with a relatively large
                                     physical size unsuitable for applying to the humanoid robot palm [33,37,41,42]. Although
                                     a tactile sensor with a proper size was proposed [35], there is an issue with developing
                                     the algorithm for object recognition. Therefore, our research focuses on the new design of
                                     tactile sensors in terms of resolution and the physical size that can be efficiently applied
                                     to the humanoid robot palm. The algorithm for the tactile image recognition method was
                                     also developed.

                                     2.2. Tactile Image Recognition for the Humanoid Robot
                                          The humanoid robot hand has been developed with different types of sensors for vari-
                                     ous applications such as medical [5,45,46], industrial [8,30], and home use applications [5].
                                     One of the significant developments in data processing is the tactile sensor for the object
                                     recognition capability of robots [36,39,47–59]. Object recognition for humanoid robots
                                     has been reported in various research studies [10,16,18], relying on the humanoid robot
                                     hand. The essential element for processing is the installation data of the tactile sensor array,
                                     so-called tactile image recognition, as summarized in Table 2.

                                          Table 2. Tactile image recognition for robot application.

                   Sensor Resolution       Number                                  Classification         Number     Recognition
      Year                                                    Descriptor
                        (Pixel)            of Class                                  Method              of Grasps    Rate (%)
   2009 [47]            6 × 14 (2ea)           21          All Data Vector             BoW                 10           84.6
   2011 [36]             8 × 8 (2ea)           10             Mean, SD                 kNN                  1           92.0
   2011 [48]                 6×6                5           Polar Furrier            PCA, BoW              >50           90.0
   2012 [49]               24 × 16              4         Maximum Vector             PCA, kNN               1            81.4
   2012 [50]           5 × 9, 12 × 10           4        3 × 3 Segmentation            ANN                  1           91.0
   2013 [51]               32 × 32             10           Haar Wavelet               kNN                  1            86.0
   2014 [39]               10 × 10             12          K-PCA, FD, GE             MKL-SVM                1           85.54
   2015 [52]                6 × 14             18        Segmentation SIFT             BoW                 15           89.9
   2015 [53]               16 × 16             25          Reduced Vector              ANN                  1            96.0
   2015 [54]              108+133              20          All Data Vector             DNN                  1           91.1
   2016 [55]         8 × 3 (3ea), 7 × 4         7          All Data Vector             KSC                  1            94.0
   2016 [56]               6 × 14              20         Zernike moment              iCLAP                20           85.36
   2017 [57]                  768               2          AlexNet-DCNN               DCNN                  1           98.3
   2017 [58]               28 × 50              8          AlexNet-DCNN               DCNN                  1            91.6
   2019 [59]               28 × 50             22          ResNet-DCNN                DCNN                  1           95.36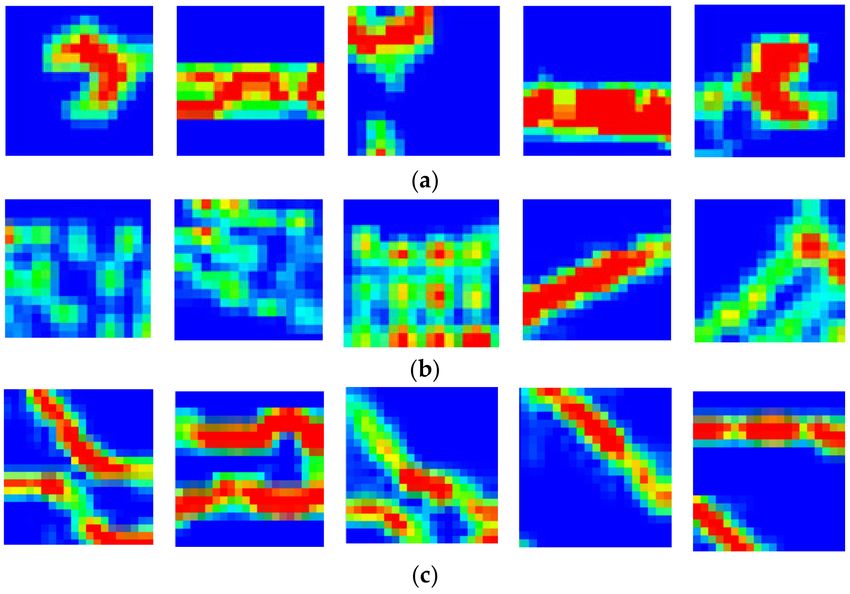
Sensors 2021, 21, 6024                                                                                            4 of 26

                              Earlier developments of tactile image recognition were based on the first-order
                         feature [36,47,49,53], and the object orientation was not considered [36,47]. The bag-of-
                         words (BoW) technique with high order descriptor was applied to obtain high accuracy in
                         object recognition [48,52]. However, each object has to be touched by the sensor several
                         times for the recognition system to learn about that object gradually. Alternatively, a
                         combination of the Haar Wavelet method and the kNN method was employed to develop
                         a recognition system to learn about each object by a single touch [51]. However, this was
                         not applied in the form of a humanoid robot palm. A kernel principal component analysis
                         (K-PCA) method and multiple kernel learning (MKL) algorithm with a support-vector
                         machine (SVM) method were applied for the low-resolution tactile sensor. These methods
                         can improve the object recognition rate for the low-resolution tactile sensor for a single
                         touch [39]. However, the objects used in the experiment were small-sized, and the object
                         orientation was not considered. Cretu et al. [55] used sensors to improve the object recog-
                         nition rate; however, this method is not compatible with the image processing technique.
                         A technique called kernel sparse coding (KSC) was proposed to shorten the calculation
                         time. At the same time, the orientation independence in the learning procedure was
                         achieved by using three sets of tactile sensors [55]. A method called iterative closest labeled
                         point (iCLAP) was employed to develop a recognition system to learn about objects [56].
                         However, each object has to be touched by the sensor several times for the recognition
                         system to learn about that object gradually. Albini et al. [57] applied a high-resolution
                         sensor (768 pixels) with an AlexNet-deep convolution neural network (AlexNet-DCNN)
                         to achieve a high recognition rate compared to that of BoW. The recognition rate was
                         further improved upon increasing the resolution of the tactile sensor (1400 pixels) using
                         AlexNet-DCNN [58]. The same hardware was tested with ResNet-DCNN, and an improved
                         recognition rate was obtained [59].
                              According to previous research, BoW can be used with low-resolution sensors
                         (36 pixels [48], 84 pixels [47,52]), and the physical size was suitable for installation at the
                         fingertip. Although DCNN can work well with high-resolution sensors (768 pixels [57],
                         1400 pixels [58,59]), the large physical size was impractical for installation on the humanoid
                         robot palm. In the present research, the tactile sensor array (256 pixels) has been developed
                         with a physical size suitable for the application of the humanoid robot palm (56.0 × 56.0 mm).
                         Various DCNNs (19 models) with transfer learning methods were applied for tactile image
                         object recognition. The appropriate DCNN was chosen for further improvement via
                         resolution enhancement. Multimodal learning methods and object exploration were also
                         implemented to increase the recognition rate effectiveness.

                         3. Methodology and Experimental Setup
                               Figure 1 represents an overview of the contribution of this work. The block diagram
                         proposed a tactile object recognition process using DCNN. This work presents the develop-
                         ment of a tactile sensor array with high sensitivity and a suitable size for the humanoid
                         robot hand, which it then mounts on the humanoid robot hand and randomly positioned
                         object capture is carried out. Then, tactile image data is obtained by capturing objects of
                         each class as a data set for testing with a recognition system. Tactile images are tested with
                         recognition system and resolution enhanced by bicubic interpolation method to increase
                         efficiency. The recognition algorithm is tested using transfer learning DCNN comparing
                         19 models, optimized using multimodal approach and multiple times of handling by object
                         exploration method. The details of each part of the work are as follows.

                         3.1. Sensor Design and Result
                              Most electrode designs with small sensors are circle electrodes, as shown in Figure 2 [35],
                         with many dead areas (black area). It leads to a loss of information. This research designed
                         a square electrode instead of the circle electrodes to reduce the dead area. The contact
                         area of the circle electrode can be calculated using Equation (4) where R is the radius.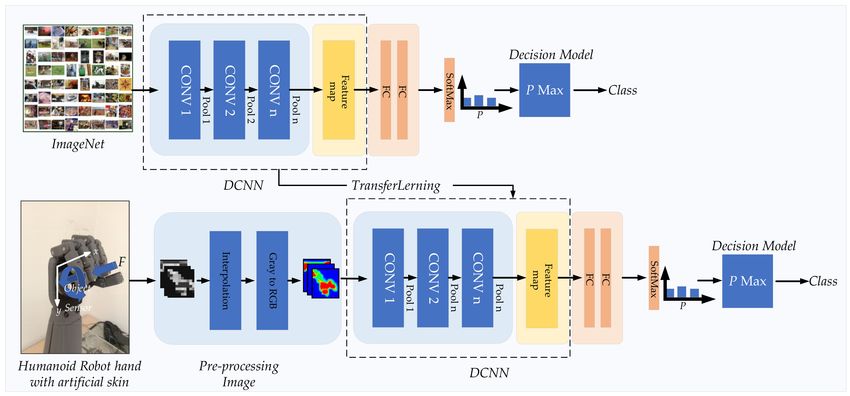
Sensors 2021, 21, 6024                                                                                                     5 of 26

                         The contact area of the square electrode can be calculated with Equation (5) where d is
                         the width.
                                                        A = A1 − A2 + A3 − A4                                (3)
                              Therefore, the active area of the circle electrode is

                                                           A = πR21 − πR22 + πR23 − πR24                                      (4)

                              The active area of the square electrode is

                                                               A = d21 − d22 + d23 − πR24                                     (5)

                              The contact area of the square electrode sensor is 8.3692 mm2 , which is 21.45% larger
                         than that of the circle electrode sensor (6.5665 mm2 ). Moreover, it provides higher sensitivity
                         to the sensor.

                         Figure 1. Proposed block diagram of tactile object recognition for the humanoid robot using DCNN.

                         Figure 2. Comparison of the new circle electrode of tactile sensor and the square electrode: (a) A circle
                         electrode; (b) A square electrode.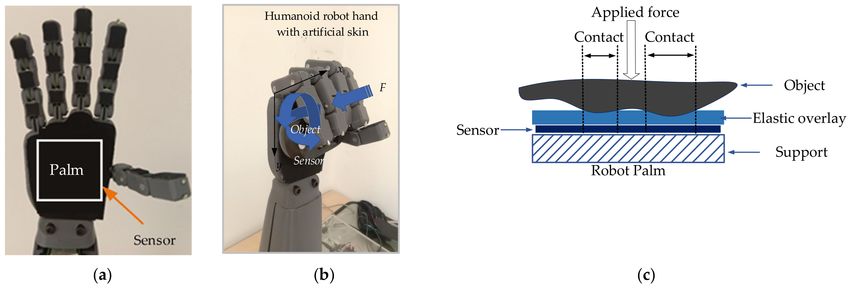
Sensors 2021, 21, 6024                                                                                                6 of 26

                              The active area of the circle electrode sensor when the sensor is partially touched
                         is shown in Figure 3 where R1 and R3 are the radius of the outer and inner electrodes,
                         respectively. R2 and R4 are the radius of the gap and the through-hole, respectively.
                         Moreover, h1 and h3 are the contact distance of the outer and inner electrodes, respectively.
                         h2 and h4 are the contact distance of the gap and the through-hole, respectively. These areas
                         can be calculated by using Equations (6) and (7), and the total area can be calculated by
                         using Equation (3).
                                                                 R2  απ        απ
                                                           A=            − sin                                     (6)
                                                                  2 180         180
                                                                         ( R − h)
                                                                  α = 2cos−1                                             (7)
                                                                             R
                         where R is the radius and h is the contact distance.

                         Figure 3. The partial contact area of the circle electrode sensor.

                              Figure 4 shows the active area of both circle and square electrode sensors when the
                         contact comes from different directions. Each sensor’s active area per %contact in the circle
                         and the square electrode can be calculated with Equations (3), (5), and (6), respectively. The
                         square electrode sensor offers a higher active area per %contact when the contact exceeds
                         10%. This difference also increases with increasing %contact, as shown in Figure 5.

                         Figure 4. The active area of the circle and square electrode tactile sensors: (a) when touching the
                         object at 25%, 50%, 75%, and 100% from the side; (b) when touching the object at 25%, 50%, 75%, and
                         100% from the corner.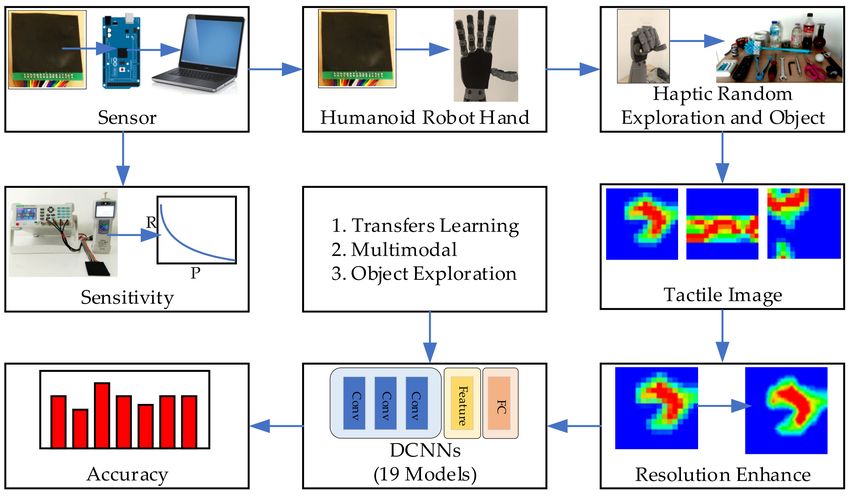
Sensors 2021, 21, 6024                                                                                            7 of 26

                         Figure 5. Comparison of the active area per % contact of the sensor.

                               The piezoresistive sensor used in this research was conductive polymer (capLINQ,
                         MVCF-40012BT50KS/2A). The piezoresistive element was 0.1 mm thick with a surface
                         resistance of 50,000 ohm/cm2 . The PCB technology was applied to fabricate sensor struc-
                         ture using epoxy PCB as substrate with a thickness of 0.5 mm. The electrode made of Cu
                         with a thickness of 0.2 mm was gold-plated with a thickness of 18 µm. The electrodes were
                         designed in the form of 16 rows × 16 columns matrix. The square shape can help reduce
                         the dead area as represented in Figure 6a with the 3.5 × 3.5 mm pixels. The external and
                         internal size of the electrode was 3.0 × 3.0 mm and 1.4 × 1.4 mm, respectively. The gap
                         between the internal and external electrodes was 0.1 mm, and the distance between each
                         pixel was 0.5 mm. The size of the sensor array was 56.0 × 56.0 mm as shown in Figure 6a.
                         Figure 6e illustrates the sensor layers where the lowest layer is the substrate functioning
                         as the base and insulator. The next layer is the electrode layer, functioning as a conductor.
                         The third layer is the conductive polymer that functions as Piezoresistive with variable
                         resistance depending on the acting forces. The top layer is the elastic overlay that functions
                         as a receptor and a force transmitter (the conductive polymer).
                               The sensor developed was tested for two crucial properties: the resistance induced
                         by an acting force and tactile image acquisition upon contacting an object. These were
                         implemented in different sets of experiments, as detailed in the following sections.

                         3.1.1. Sensor Resistance and Sensitivity
                              Figure 7 shows the equivalent resistance of a tactile sensor as given by Equation (8).

                                                             Req = Rinn + Rvol + Routt                               (8)

                         where Rinn and Routt are the resistances at the interfaces with the inner and outer electrodes,
                         respectively, and Rvol is the path’s resistance between both electrodes. The resistance
                         depends on the effective contact area and pressure. It is proportional to the electrode area.
                         Therefore, we can write
                                                                 a( P)             a( P)
                                                         Rinn =         ; Routt =                                    (9)
                                                                  Ainn            Aoutt
                         where Ainn and Aoutt are the areas of the inner and outer electrodes, respectively, and a(P)
                         is a function of the pressure exerted on the sensor.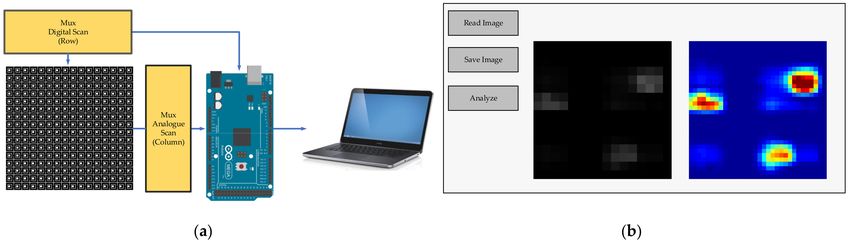
pixel was 0.5 mm. The size of the sensor array was 56.0 × 56.0 mm as shown in Figure 6a.
                         Figure 6e illustrates the sensor layers where the lowest layer is the substrate functioning
                         as the base and insulator. The next layer is the electrode layer, functioning as a conductor.
                         The third layer is the conductive polymer that functions as Piezoresistive with variable
Sensors 2021, 21, 6024                                                                                               8 of 26
                         resistance depending on the acting forces. The top layer is the elastic overlay that functions
                         as a receptor and a force transmitter (the conductive polymer).

                                                         3.0 mm     0.5 mm

                                         1.6 mm 0.7 mm
                                                         1.4 mm

                                                                                                                   56.0 mm

                                3.0 mm
                                                           0.1 mm

                                                                    0.1 mm

                                                                                   3.5 mm

                                                                                                         56.0 mm
                                                                  3.5 mm

                                                                  (a)                                              (b)

                                                                  (c)                                              (d)

                                                                                     Elastic Overlay
                                                                                     Conductive Polymer
                                                                                            Outer Electrode
                                                                                       Inner Electrode
                                                                                       Substrate

                                                          Side View                                                Top View

                                                                             (e)
                         Figure
                            Figure6. The sensor
                                     6. The     used
                                            sensor    in this
                                                    used      research:
                                                          in this        (a) (a)
                                                                  research:  thethe
                                                                                 sizesize
                                                                                       of sensor  electrode;
                                                                                          of sensor          (b)(b)
                                                                                                     electrode;  thethe
                                                                                                                     designed electrode
                                                                                                                        designed  electrode
                         andand
                              sizesize
                                    of sensor array; (c) the conductive   polymer    sheet;  (d) the actual sensor  assembly;
                                       of sensor array; (c) the conductive polymer sheet; (d) the actual sensor assembly; (e) (e) layers
                                                                                                                                     layers
                         of the sensor.
                            of the sensor.

                             The sensor developed was tested for two crucial properties: the resistance induced
                         by an acting force and tactile image acquisition upon contacting an object. These were
                         implemented in different sets of experiments, as detailed in the following sections.

                            Figure 7. The equivalent resistance of a tactile sensor.

                                 The sensitivity of our sensor was evaluated by the resistance measured at different
                            strengths of an acting force using the apparatus, as shown in Figure 8b. The equipment
                            included a force gauge, a transmission rod with a known cross-sectional area, and an
                            ohmmeter for measuring the resistance. Since the sensor consisted of 256 individual
                            elements, as shown in Figure 8a, the testing positions in the study were categorized into
                            three groups as (1) elements in the corners (C1, C2, C3, and C4. 2), (2) elements on the side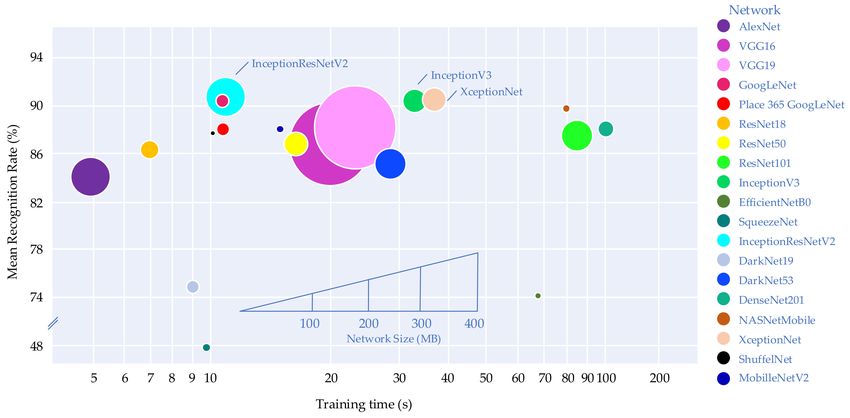
Sensors 2021, 21, 6024                                                                                             9 of 26

                         (S1, S2, S3, and S4), and (3) elements in the middle of the array (M1, M2, M3, and M4). The
                         test results are presented in Figure 9a–c for different groups of elements. It was observed
                         that the resistance decreased upon increasing pressure, and the difference in resistance
                         among all groups was slight. Figure 9d shows the average resistance of the sensors from
                         all three groups.

                         Figure 8. The sensor sensitivity measurement; (a) the sensor array with positions designated for
                         testing; (b) the apparatus used for testing.
                               Normal distribution was assumed for the resistance measurements for each sensor.
                         The measurements were statistically analyzed and modeled. The mean (x) and standard
                         deviation (SD) were calculated. These were used for quality control in developing sensors.
                         The figure presents the sensors’ measurements in 12 points: C1, C2, C3, C4, S1, S2, S3, S4,
                         M1, M2, M3, and M4 using pressure from 0 kPa to 300 kPa.
                               Figure 9a–c illustrates distributions of statistical data of sensors measured from the
                         corners, the side, and the middle of sensors with 12 points: C1, C2, C3, C4, S1, S2, S3, S4,
                         M1, M2, M3, and M4. Figure 9d: the blue lines are the mean value of the measurements,
                         and the red lines are the bands that cover 99% of the measurement or ±3SD. Moreover, the
                         power formular of nonlinear regression is exploited to calculate the pressure and sensor
                         resistance relationship. The equation is R = aPb , where P and R are the pressure and sensor
                         resistance, respectively. All resistance values were calculated from Equation (10).

                                                               R = 228 × P−0.97                                     (10)

                         where R is resistance in Ω, and P is the acting pressure in kPa.

                         3.1.2. Sensor Hysteresis and Reproducibility
                               Sensor hysteresis was tested with pressure from 0 kPa to 300 kPa by increasing 10 kPa
                         each step, and then reversed back to 0 kPa by decreasing 10 kPa each step. C1 was the
                         position that measured the hysteresis. This found that the sensor had obtained, slightly,
                         potential energy from the previous pressure, as shown in Figure 10a. Sensor reproducibility
                         was tested with pressure 100 kPa. The resistance sensor was measured by loading and un-
                         loading the pressure every minute. This found that the resistance sensor slightly decreased,
                         as shown in Figure 10b. Therefore, the amount of hysteresis and reproducibility in the
                         sensor does not directly affect the pattern of object profile, which is the aim of applying the
                         tactile sensor.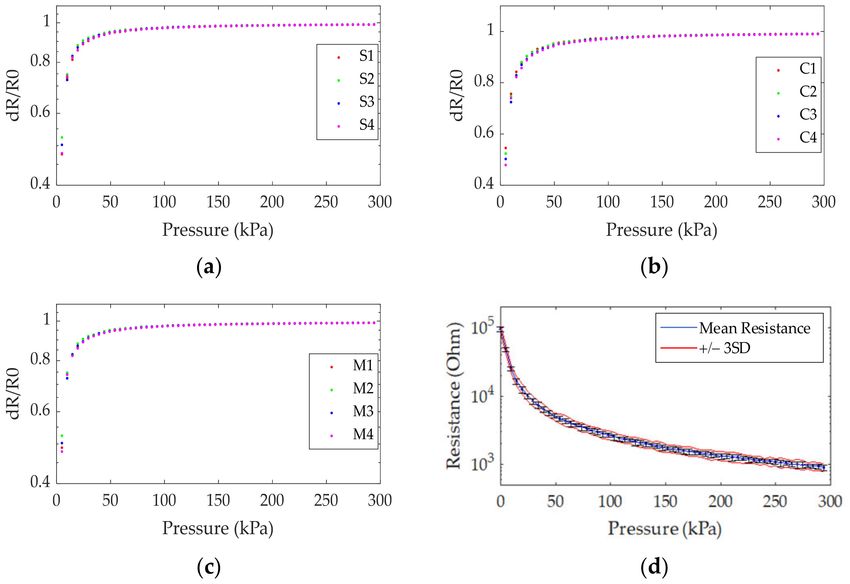
Sensors 2021, 21, 6024                                                                                                  10 of 26

                         Figure 9. The resistance at different positions due to the pressure exerted: (a) sensor elements in the
                         corners (C1, C2, C3, and C4); (b) sensor elements on the side (S1, S2, S3, and S4); (c) sensor elements
                         in the middle (M1, M2, M3, and M4); (d) the average resistance of all groups.

                         Figure 10. The sensor properties: (a) Sensor hysteresis; (b) Sensor reproducibility.

                         3.2. Humanoid Robot Hand with Sensor
                              In this study, a mechatronic robot hand with a human hand-like structure was de-
                         veloped. It consisted of five fingers and a palm, the basic design of a modern humanoid
                         robot. A tactile sensor array was employed as a physical sensory system (see Figure 11a).
                         The sensory system consisted of 3 layers: support, sensor, and elastic layer (3-mm-thick
                         foam sheet). An essential part of the tactile sensor array is the upper surface area used to
                         distribute the pressure force, referred to as the skin layer (see Figure 11c). When an object
                         touches the skin layer, the pressure force is transmitted and distributed onto the tactile
                         sensor array by the elastic material. This slightly transforms depending on the object’s
                         surface. This performance provides a pressure profile result and the object geometry.
Sensors 2021, 21, 6024 11 of 26
Figure 11. Experimental setup: (a) A humanoid robot hand equipped with a tactile sensor array on the palm; (b) A humanoid
robot hand during object handling; (c) Force-sensing transducer of the tactile sensor array.
3.3. Haptic Random Exploration and Objects
The collection of sample images was performed by randomized sampling at different
positions of the object. The images obtained from touching were collected from different
object positions. There were two main items involving the image acquisition; randomized
object position and free motion of the object being handled. Figure 11b demonstrates the
procedure for collecting data from the sample object. The orientation in the XY plane
(rotation) and the Z-direction were randomized. Each image data contained 256 vectors
generated from 16 × 16 pixels of the sensor. The data were used as the input for training
and testing the performance of the tactile recognition rate using DCNN. As part of the
classification process for the model training, datasets were generated from images obtained
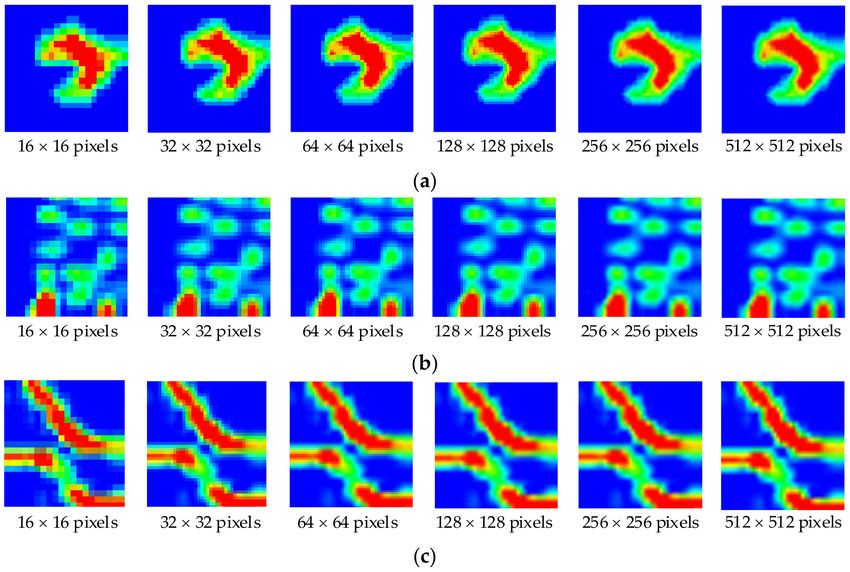
previously from handling 20 objects (or 20 classes) by the humanoid robot hand. Those
objects consisted of a battery, a remote controller, plastic tongs, a screwdriver, a coffee cup,
scissors, a fixed wrench, an Allen key, a golf ball, a measuring tape, a computer mouse,
a brush, an amp meter, a cola bottle, a pen, a charger, a soda bottle, a variable wrench, a
water bottle, and a cream bottle. The dimensions of these objects were listed in Table 3, and
the objects are shown in Figure 12. The object set was chosen similarly to [59].
3.4. Tactile Image Acquisition
The output voltage of each element of the tactile sensor array was read by the mi-
crocontroller board (Arduino version mega 2560). The reading was performed for each
row per time by assigning the logic “1” for the row being read. On the other hand, the
logic “0” was set for other rows. (Oi = 1), (O1 , . . . , Oi−1 , Oi+1 , . . . , On = 0). Then, the
analog port received voltage signals (for the entire row) from the tactile sensor. The logic
output was reassigned by shifting “1” to the next row, while other rows were set as “1”
to obtain the next scan. This process was repeated until the entire array was scanned.
Moreover, logic “0” in the multiplex circuit is grounded and sets the threshold values to
cut off the noise for avoiding the crosstalk effect [35,60]. The data were sent to a computer
for data processing, such as obtaining tactile images, training, and testing for image recog-
nition. The operating system is illustrated in Figure 13a, and the image acquisition GUI is
illustrated in Figure 13b.
3.4.1. Tactile Image
The model testing was performed 200 times for each class, resulting in 4000 images in
the database. As the DCNN employed for the experiments was the translation-invariant
type, the location and orientation of each object were randomized to obtain different images
of the object. Figure 14 shows the tactile images of three classes at different positions
(five images per class).Sensors 2021, 21, 6024 12 of 26
Table 3. Dimensions of objects used in the model training.
Class Object Size
1. Battery ∅ = 33 mm, H = 60 mm
2. Remote controller L = 172 mm, W = 45 mm, H = 15 mm
3. Plastic tongs L = 165 mm, W = 85 mm, H = 15 mm
4. Screwdriver ∅ = 38 mm, L = 220 mm
5. Coffee Cup ∅ = 85 mm, W = 120 mm, H = 95 mm
6. Scissors L = 18 mm, W = 80 mm, H = 12 mm
7. Fixed wrench L = 168 mm, W = 30 mm, H = 6 mm
8. Allen key L = 90 mm, W = 35 mm, H = 6 mm
9. Golf ball ∅ = 40 mm
10. Measuring tape ∅ = 70 mm, W = 92 mm, H = 47 mm
11. Computer mouse L = 100 mm, W = 50 mm, H = 35 mm
12. Brush ∅ = 80 mm, L = 390 mm
13. Amp meter ∅ = 35 mm, L = 35 mm
14. Cola bottle ∅ = 60 mm, H = 22 mm
15. Pen ∅ = 12 mm, L = 147 mm
16. Charger L = 90 mm, W = 70 mm, H = 22 mm
17. Soda Bottle ∅ = 65 mm, H = 155 mm
18. Variable wrench L = 200 mm, W = 60 mm, H = 14 mm
19. Water bottle ∅ = 60 mm, H = 175 mm
20. Cream bottle ∅ = 75 mm, H = 160 mm
Figure 12. Objects used for model training. (1) battery, (2) remote controller, (3) plastic tongs,
(4) screwdriver, (5) coffee cup, (6) scissors, (7) fixed wrench, (8) Alan key, (9) golf ball, (10) measuring
tape, (11) computer mouse, (12) brush, (13) amp meter, (14) cola bottle, (15) pen, (16) charger, (17) soda
bottle, (18) variable wrench, (19) water bottle, (20) cream bottle.
3.4.2. Resolution Enhancement
This study applied the resolution enhancement to resize the tactile images to achieve
a suitable input resolution for DCNNs. The tactile image resolution enhancement (resize
tactile image) was performed using bicubic interpolation, as shown in Equations (11)–(14),
introduced by [61,62], a function to approximate the continuity of the pressure distribution
over the surface by using second derivatives. As shown in Figure 15, the bicubic interpola-Sensors 2021, 21, 6024 13 of 26
tion was calculated at 16 points surrounding the location being considered. The primary
function W(x) of bicubic interpolation was
( a + 2)| x |3 − ( a + 3)| x |2 + 1
f or | x | ≤ 1
W (x) = a| x |3 − 5a| x |2 + 8a| x | − 4a f or1 < | x | < 2 (11)
0 otherwise
where the distances along the y-axis and x-axis for the interpolation B(x,y) (16 pixels) are
designated as Kim and Kjn , respectively, as shown in Equation (12).
Ki0 = 1 + µ; Ki1 = µ; Ki2 = 1 − µ; Ki3 = 2 − µ; (12)
K j0 = 1 + ν; K j1 = ν; K j2 = 1 − ν; K j3 = 2 − ν; (13)
Figure 13. Tactile image acquisition system: (a) The schematic diagram of the tactile sensor array for image acquisition;
(b) Image acquisition GUI.
Figure 14. Sample tactile images: (a) a fixed wrench; (b) a remote controller; (c) plastic tongs.Sensors 2021, 21, 6024 14 of 26
Figure 15. Bicubic interpolation grids.
The weight coefficient is
amn = W (Kim )W K jn (14)
Therefore, the interpolated image can be described by Equation (15).
3 3
B( x, y) = ∑ ∑ aij A(xi , yi ) (15)
i =0 j =0
where A is a value of the tactile image of the individual pixel of the tactile sensor, B is the
interpolated image point, aij represents the weight parameter, and I,j represents the x-axis
and y-axis coordinates, respectively.
In Figure 14, the readings were obtained from the tactile sensor array with a 16 × 16 pixels
image. The position where the object contacted the sensor appeared as a tactile image
corresponding to the pressure profile. Figure 16 shows that the image quality improved
significantly after applying the bicubic interpolation to enhance the image resolution. With
the low-resolution image, it was challenging to indicate the object’s geometric profile. As
the resolution improved, the geometric details of tactile images became more visible. These
enhanced images were then used as input data for developing the recognition system.
3.5. DCNN
The recognition procedure applied in this study was based on the pressure pro-
files generated by the tactile sensor upon contacting the object. Due to image resolu-
tion, previous research proposed tactile image recognition (using the high-resolution
tactile sensor) and DCNN [57–59]. However, using a low-resolution image for a DCNN
conceivably leads to poor results [63]. Our approach used a low-resolution tactile sen-
sor with a DCNN by using data image resolution enhancement. The following four
steps were used for improving the system: (1) resolution enhancement; (2) multiple
handlings for accurate prediction; (3) testing with a variety of networks to determine
the appropriate network; (4) applying multimodal learning to increase the effectiveness.
All steps were performed for the application of a humanoid robot hand. The DCNNs
used in this study included AlexNet [64], VGG16 [65], VGG19 [65], GoogLeNet [66],
ResNet18 [67], ResNet50 [67], ResNet101 [67], Place365GoogLeNet [68], InceptionV3 [69],
EfficienNetB0 [70], SqueezeNet [71], InceptionResNetV2 [72], DenseNet201 [73], DarkNet19 [74],
DarkNet53 [75], XceptionNet [76], NASNetMobile [77], ShuffleNet [78], and MobileNetV2 [79].
These are neural networks widely used in computer vision for object classification that
has been applied for tactile object recognition by using the transfer learning method [80].
The dataset used in the DCNN training was obtained from the tactile image collectionSensors 2021, 21, 6024 15 of 26
as described in Section 4.1. Tactile image signals can be represented by Equation (16) as
2D convolutions.
(K ∗ I )(i, j) = ∑ K (m, n) I (i + n, j + m) (16)
m,n
where I is a tactile image, and K is the kernel convolution function.
Figure 16. Enhanced tactile images for different objects: (a) fixed wrench; (b) remote controller;
(c) plastic tongs.
3.5.1. Transfer Learning Method
The elements involving DCNNs are presented in Figure 17. This was applied with
tactile object recognition by using transfer learning from ImageNet DCNN. A 20-way
softmax function followed the last layer (fully connected layer) to calculate the probability
distribution for 20 classes. The probability value was used for the prediction of the object,
as shown in Figure 17.
Figure 17. DCNN Transfer Learning method was used in this study.Sensors 2021, 21, 6024 16 of 26
3.5.2. DCNN Parameters
In the tests of all datasets with DCNN, the associated training parameters were kept
the same, summarized in Table 4. For each model, the initial learning rate in a range of
0.00001–0.1 was optimized based on the validation accuracy. Table 5 shows the optimized
learning rate for each model. Each model was tested repeatedly ten times with the DCNN
in the same dataset that contains 4000 images. The dataset was randomized and divided
into a training set (50%) and a testing set (50%) in each test. The recognition rate of each
model was evaluated, then, a suitable model was selected for further testing, including
resolution enhancement, multiple handling, and multimodal learning.
Table 4. Training parameters.
Parameters Values
NumEpochs 30
NumBatchSize 16
Momentum 0.9
LearnRateDropFactor 0.1
LearnRateDropPeriod 8
Table 5. The initial learning rate of each DCNN.
Initial Learning Rate 0.00001 0.0001 0.001 0.01
ResNet18
ResNet50
ResNet101
VGGNet16 AlexNet InceptionV3
VGGNet19 GoogLeNet InceptionResNetV2
DCNN Model SqueezeNet
DarkNet19 Place365GoogleNet DensNet201
DarkNet53 EfficienNetB0 XceptionNet
NASNetMobile
ShuffleNet
MobileNetV2
4. Result and Discussion
In this study, the experiment consisted of four parts: (1) test of the recognition rate com-
paring tactile images obtained from object handling of the original resolution and enhanced
resolution; (2) comparison of the recognition rate obtained from nineteen DCNNs; (3) the
recognition rate obtained from the multimodal learning method; (4) object exploration (the
effect of multiple handling of an object on the recognition rate).
4.1. Recognition Rate from Resolution Enhanced
In this test, AlexNet was used with an initial learning rate of 0.001. The test was
performed to demonstrate the effect of image resolution on the mean recognition rate, as
shown in Figure 18. The mean recognition rate was calculated from results obtained from
different classes of objects. The object recognition performance increased when increasing
the resolution of the tactile images. The recognition rate of approximately 77.66% was
obtained with the resolution of 16 × 16. When the test was performed with resolution
enhancement using bicubic interpolation, the resolution became 32 × 32 pixels and the
recognition rate increased to 80.79%. Further expansion of the resolution increased the
recognition rate, and the improvement became marginal when the enhanced resolution
was 128 × 128 pixels. At the resolution of 512 × 512 pixels, the highest recognition rate
was achieved at 84.42%. These results suggested that the efficiency of object recognition
using the DCNN for object handling with the low-resolution tactile sensor can be increased
by the resolution enhancement via the bicubic interpolation method. Hence, the resolution
of 512 × 512 uses for further testing with other DCNN networks.Sensors 2021, 21, 6024 17 of 26
Figure 18. The recognition rate for images obtained with different resolutions.
The obtained recognition results can be presented as confusion matrices. Figure 19
shows the comparison of two confusion matrices with different resolutions. When the
resolution image was enhanced, prediction accuracy improved, such as predicting classes
1, 2, and 20. The prediction of classes 9, 10, and 11 was also slightly improved.
Figure 19. Confusion matrices were obtained using DCNN for 20 classes of objects: (a) Tactile image
resolution 16 × 16 pixels without resolution enhancement; (b) Tactile image with enhanced resolution
of 512 × 512 pixels.
4.2. Recognition Results from DCNNs
In this experiment, the images passing the resolution enhancement process with a
512 × 512 pixels size were tested with nineteen DCNNs to determine the appropriate
DCNN model for maximum efficiency. This DCNN model could then be applied to
robotic hands and AI. Table 6 and Figure 20 compare the recognition rates obtained
from different DCNNs for each tested model with the tactile image dataset. The DCNN
providing the highest performance was InceptionResNetV2, with a recognition rate of
91.86%. Therefore, InceptionResNetV2 was the appropriate DCNN model for applying
a tactile recognition system for humanoid robots in this work. Although SqueezeNet,
EffcienNetB0, and DarkNet19 are commonly used for ImageNet, these model networks
provided a relatively low recognition rate in our application, suggesting that they are not
efficient for tactile images.Sensors 2021, 21, 6024 18 of 26
Table 6. The recognition rate of each DCNN from 16 × 16 pixels and 512 × 512 pixels resolution.
Accuracy of 16 × 16 Pixels Accuracy of 512 × 512 Pixels
Model
Min Max Mean SD Min Max Mean SD
AlexNet 76.40 80.55 77.66 1.27 84 85.2 84.42 0.40
VGG16 79.95 81.85 80.92 0.58 85.7 88.35 86.94 0.78
VGG19 80.10 84.20 81.84 1.11 86.4 88.6 87.62 0.66
GoogLeNet 85.15 86.30 85.57 0.36 89.2 91.01 90.09 0.59
ResNet18 80.05 83.00 81.36 0.99 85.25 87.25 86.5 0.61
ResNet50 81.55 84.60 82.87 0.95 86.1 88.55 87.59 0.82
ResNet101 81.75 85.40 83.61 1.12 86.75 89.65 88.07 0.85
Place365GoogLeNet 74.80 81.00 78.40 1.84 87.2 89.75 88.56 0.80
InceptionNetV3 85.25 87.45 86.47 0.75 90.1 91.8 91.06 0.50
EfficienNetB0 71.25 76.95 74.18 2.01 71.25 76.95 74.18 2.01
SqueezeNet 39.02 41.50 40.21 1.71 45.5 51.6 48.33 1.71
InceptionResNetV2 84.55 87.20 85.15 0.91 90.7 93.05 91.86 0.70
DarkNet19 61.60 68.05 65.01 1.74 75 78.8 77.36 1.17
DarkNet53 77.30 81.55 79.44 1.43 83.85 86.2 85.42 0.90
DenseNet201 82.40 86.10 83.79 1.15 87.9 89.6 88.69 0.56
XceptionNet 82.45 86.15 84.48 1.06 91 91.85 91.4 0.29
NASNetMobile 85.10 87.35 86.36 0.69 84.35 91.6 89.72 2.08
ShuffleNet 81.65 83.80 82.65 0.78 87.25 88.8 88.16 0.55
MobileNetV2 82.30 85.55 83.92 0.92 87.35 89.9 88.23 0.73
Figure 20. The recognition rate of each DCNN from 512 × 512 pixels resolution.
Figure 20 compares recognition rate, training time, and network size obtained from
nineteen DCNNs. All networks were trained using MATLAB R2021a platform with Deep
Learning (DL) Toolbox. In this test, a GPU (Nvidia GTX1707, US) was employed. It can be
seen that AlexNet required the shortest training time (5 s/image) due to its simple archi-
tecture. On the other hand, DensNet201 required the longest training time of 108 s/image
with complicated architecture. When comparing the performance of InceptionResNetV2,
XceptionNet, and InceptionNetV3, InceptionResNetV2 provided the shortest training
time (11.23 s/image) and the highest recognition rate. This DCNN model was then used
for further testing with multiple handling of the object. Note that the network size of
InceptionResNetV2 was slightly larger than that of InceptionV3 and XceptionNet.Sensors 2021, 21, 6024 19 of 26
The first three DCNNs that provided impressive performance (InceptionResNetV2,
XceptionNet, and InceptionNetV3) were compared in the form of confusion matrices,
as shown in Figure 21. All three models provided accurate predictions for most cases
except for classes 5, 15, 16, and 20. This class was owing to the similarity of object ge-
ometry. Classes 5 (coffee cup) and 20 (cream bottle) were both cylindrical, while classes
15 (pen) and 16 (charger) were often mistaken due to the sticklike feature. For these classes,
InceptionNetV2 performed slightly better than XceptionNet and InceptionNetV3.
Figure 21. Confusion matrices obtained from (a) InceptionResNetV2 (b) XceptionNet (c) InceptionNetV3.
A classification vector of InceptionResNetV2 is shown in Figure 22. It is conceivable
that the recognition rate depended on the type of object. Many objects with a certain degree
of similarity in shape and size can be complicated to predict. The objects with the highest
recognition rate, exceeding 98.00%, included a computer mouse, a golf ball, and a fixed
wrench. On the contrary, the object class associated with the recognition rate below 85.00%
had a coffee cup and a cream bottle.
Figure 22. Recognition rate of InceptionResNetV2.
4.3. Recognition Rate from Multimodal DCNNs
In this experiment, multimodal learning [81,82] was applied to increase the effec-
tiveness of the recognition rate. Figure 23 shows the overall experimental procedure to
improve the accuracy of prediction by multimodal learning. Different pairs of models were
created with six DCNNs, including InceptionResNetV2, XceptionNet, InceptionNetV3,
GoogLeNet, NASNetMobile, and DensNet201, based on the performance of the recognitionSensors 2021, 21, 6024 20 of 26
rate as previously presented in Section 4.2. For each pair, the InceptionResNetV2 was used
as a primary model. In sequence, there were five pairs of models (InceptionResNetV2/
XceptionNet, InceptionResNetV2/InceptionNetV3, InceptionRes-NetV2/GoogLeNet,
InceptionResNetV2/NASNetMobile, and InceptionResNetV2/DensNet201). The recog-
nition rate for each pair was compared with the individual network model, as shown in
Table 7 and Figure 24.
Figure 23. Object recognition using multimodal DCNNs.
Table 7. The recognition rate of multimodal DCNNs.
Accuracy
Model
Min Max Mean SD
InceptionResNetV2/XceptionNet 91.85 93.35 92.73 0.51
InceptionResNetV2/InceptionNetV3 91.60 93.05 92.56 0.49
InceptionResNetV2/GoogLeNet 91.35 93.05 92.46 0.47
InceptionResNetV2/NASNetMobile 90.80 93.10 92.29 0.82
InceptionResNetV2/DensNet201 91.35 92.70 91.93 0.43
Figure 24. The recognition rate of single DCNNs and Multimodal DCNNs.Sensors 2021, 21, 6024 21 of 26
Multimodal learning provided superior performance compared to the individual
DCNN model. The combination of InceptionResNetV2 and XceptionNet performed excep-
tionally well with the highest effectiveness of 92.73% among the different bimodal pairs.
This pair was 0.87% greater than that of InceptionResNetV2. The performance of other
bimodal couples showed a marginal increase compared to that of InceptionResNetV2.
4.4. Recognition Rate from Object Exploration
This study proposes using multiple handling (object exploration) to improve the
object recognition rate of the DCNN model to apply tactile object recognition as human-
like. The DCNN used in this experiment was InceptionResNetV2 for the Single model
and InceptionRes-NetV2/XceptionNet for Multimodal. After the system had completed
learning from the training set, the system was tested with another set of images called “test
set.” The output was obtained in the form of probability (P) for each class of object. The
final output of DCNN is known as the softmax function or the normalized exponential
function. This function normalizes a vector of real number logit to obtain a normalized
probability, as shown in Equation (17).
e zi
P ( z )i = zj
(17)
∑Kj=1 e
where P is a softmax, z is an input vector, ezi is a standard exponential function for input
vector, K is a number of classes in the multiclass classifier, and ez j is a standard exponential
function for output vector.
Two methods were applied for object identification. The first method was based on
the “maximum probability”. When the robot handled an object more than once, the output
vector of probability was generated. Equation (18) was used as a decision model.
P = max( P( I1 ), P( I2 ), P( I3 ), . . . , P( In )) (18)
where P(In ) is the probability of each image.
On the contrary, the second method was based on the summation of probability.
Equation (19) was used to identify the object.
P = P( I1 ) + P( I2 ) + P( I3 ) + . . . + P( In ) (19)
Figure 25 shows the overall experimental procedure to improve the accuracy of
prediction by multiple handling.
Figure 25. Object recognition from object exploration.
Results of the recognition rate are shown in Figure 26. The method of summation of
probability yielded a superior performance on the recognition rate. The recognition rate of
inceptionResNetV2 markedly improved from 91.86% to 96.93% when handling increasedSensors 2021, 21, 6024 22 of 26
to two times. Further increasing the number of handlings increased the recognition rate at
a declining rate. The recognition rate approached a plateau at 99.63% for handling greater
than six times. Therefore, using the summation of probability as a criterion for object
exploration for tactile image recognition using DCNN.
Figure 26. The recognition rate for multiple handling using a maximum probability method and
summation of probability method.
Figure 26 was compared in terms of confusion matrices, as shown in Figure 27. It can
be seen that the error was significantly reduced by increased multiple handling. For classes
5 and 8, the method of maximum probability resulted in a slightly inaccurate prediction.
Figure 27. Confusion matrices obtained from multiple handling of the object using a DCNN: (a) once; (b) 10 times based on
the maximum of probability; (c) 10 times based on the summation of probability.
4.5. Discussion
The humanoid robot hand system was designed with a tactile sensor array 16 × 16 pixels,
each pixel of 3.5 mm × 3.5 mm. Therefore, an active sensing area was 56.0 mm × 56.0 mm.
It provided a 16 × 16 pixels tactile image that can be applied for a tactile object recognition
system when handling an object. When testing with 20 object classes using AlexNet-
DCNN as the classifier, it provided a moderate recognition rate of 76.65%. Using bicubic
interpolation for resolution enhancement increased the tactile image size twofold, yielding
32 × 32 pixels tactile images. This provided an increase of 4.14% in the recognition rate.
The resolution enhancement was then performed to resize 32-times. The 512 × 512 pixels
tactile images were obtained, and the recognition rate increased by 7.77%. Thus, resolutionSensors 2021, 21, 6024 23 of 26
enhancement significantly improved the accuracy of the recognition rate in tactile object
recognition. However, the improvement in recognition rate became marginal when the
size of the enhanced image exceeded 16×–32×. Therefore, the improved tactile image
size of 32× resolution is the sufficient resolution used for DCNN and is appropriate for
developing a more advanced DCNN model.
The DCNN providing the best performance was InceptionResNetV2, with a recog-
nition rate of 91.86% and training time of 11.23 s/image, followed by XceptionNet and
InceptionNetV3, which provided recognition rates of 91.40% and 91.06%, respectively. The
results obtained from these networks were better than AlexNet [57,58] and ResNet [59].
To further improve the recognition efficiency of a tactile object recognition system, mul-
timodal learning was applied. The highest performance of object recognition was achieved
when this method was implemented with the InceptionResNetV2 and XceptionNet. The
recognition rate increased by 0.87% compared to using InceptionResNetV2 only. Based on
our experimental results, the tactile sensor array developed in this work can be effective
for future humanoid robot hand applications.
Another method for increasing the recognition efficiency of a tactile image recognition
system by object exploration was performed by the multiple handling of objects. When the
tactile image system using InceptionResNetV2 was exposed to more input information,
the learning rate improved significantly, and the object prediction was more accurate.
For instance, when the number of object handling increased to two times, the recognition
rate increased by 4.91% for the maximum probability method and by 5.07% for the method
of summation of probability. Therefore, the method of summary of possibility is appropriate
for tactile object recognition for a humanoid robot, and the results obtained from DCNN
are better than those for BoW [47,48,52].
Moreover, object recognition using the DCNN method can be improved by either
resolution enhancement, multimodal learning, or object exploration. When these three
methods are applied together, the recognition rate can be markedly increased.
5. Conclusions
This study used a humanoid robot palm equipped with a tactile sensor array with
a 16 × 16 pixels (56.0 mm × 56.0 mm physical size) resolution to measure the pressure
profile upon touching the object. Tactile images of objects were enhanced via bicubic
interpolation and were used as input for the recognition system. The performance of the
recognition system using different DCNN was compared in nineteen models. Inception-
ResNetV2 provided the ultimate 91.82% recognition rate and the maximum efficiency base
on recognition rate and training time. The combined pair of InceptionResNetV2 with
XceptionNet delivered the best performance with 92.73% in a tactile object recognition
rate, which was better than the single InceptionResNetV2. The InceptionResNetV2 model
was applied with object exploration to improve the recognition rate. The summation of
probability for object exploration yielded superior performance compared to that of the
maximum probability. Finally, the multimodal DCNN was employed as the learning model
to improve the recognition rate of our tactile object recognition system. Therefore, the
palm-size tactile sensor array developed could be effectively used to apply to a humanoid
robot hand when using InceptionResNetV2 or the combination of InceptionResNetV2 and
XceptionNet multimodal learning methods.
Author Contributions: Conceptualization, S.P. and J.S.; methodology, S.P. and J.S.; writing—original
draft preparation, S.P. and J.S.; writing—review and editing, S.P. and J.S.; supervision, J.S.; project
administration, J.S.Both authors have read and agreed to the published version of the manuscript.
Funding: This research was funded by grant No. 1245725, National Research Council of Thailand
and signal processing laboratory, Department of Electronics and Telecommunication Engineering,
Rajamangala University of Technology, Thanyaburi.
Institutional Review Board Statement: Not applicable.
Informed Consent Statement: Not applicable.Sensors 2021, 21, 6024 24 of 26
Data Availability Statement: Not applicable.
Conflicts of Interest: The authors declare no conflict of interest.
References
1. Seward, D.W.; Bradshaw, A.; Margrave, F. The anatomy of a humanoid robot. Robotica 1996, 14, 437–443. [CrossRef]
2. Wu, Z.; Song, E.; Shen, F.; Xu, D.; Fang, B. The Biological Inspired Somatic Neuron Design and its. In Proceedings of the 2005
IEEE International Conference on Information Acquisition, Hong Kong, China, 27 June–3 July 2005. [CrossRef]
3. Salisbury, J.K.; Craig, J.J. Articulated hands force control and kinematic issues. Int. J. Robot. Res. 1982, 1, 4–17. [CrossRef]
4. Crisman, J.D.; Kanojia, C.; Zeid, I. Graspar: A flexible, easily controllable robotic hand. IEEE Robot. Autom. Mag. 1996, 3, 32–38.
[CrossRef]
5. Kawasaki, H.; Mouri, T. Humanoid robot hand and its applied research. J. Robot. Mechatron. 2019, 31, 16–26. [CrossRef]
6. Lederman, S.; Klatzky, R. Haptic perception: A tutorial. Atten. Percept. Psychophys. 2009, 71, 1439–1459. [CrossRef]
7. Iskarous, M.; Thakor, N. E-skins: Biomimetic sensing and encoding for upper limb prostheses. Proc. IEEE 2019, 107, 2052–2064.
[CrossRef]
8. Saudabayev, A.; Varol, H.A. Sensors for Robotic Hands: A Survey of State-of-the-Art. IEEE Access 2015, 3, 1765–1782. [CrossRef]
9. Almassri, A.M.; Hasan, W.Z.W.; Ahmad, S.A.; Ishak, A.J.; Ghazali, A.M.; Talib, A.M.; Wada, C. Pressure Sensor: State of the Art,
Design, and Application for Robotic Hand. J. Sens. 2015, 2015, 846487. [CrossRef]
10. Kappassova, Z.; Corralesb, J.A.; Perdereaua, V. Tactile sensing in dexterous robot hands—Review. Robot. Auton. Syst. 2015, 74,
195–220. [CrossRef]
11. Dahiya, R.S.; Metta, G.; Valle, M.; Sandini, G. Tactile sensing—From humans to humanoids. IEEE Trans. Robot. 2021, 26, 1–20.
[CrossRef]
12. Hellman, R.B. Haptic Perception, Decision-making, and Learning for Manipulation with Artificial Hands. Ph.D. Thesis, Arizona
State University, Tempe, AZ, USA, August 2016.
13. Tsutsui, H.; Murashima, Y.; Honma, N.; Akazawa, K. Robot hand with soft tactile sensors and underactuated control. In Proceedings
of the 35th Annual International Conference of the IEEE Engineering in Medicine and Biology Society (EMBC), Osaka, Japan,
3–7 July 2013. [CrossRef]
14. Robertsson, L.; Iliev, B.; Palm, R.H.; Wide, P. Perception modeling for human-like artificial sensor systems. Int. J. Hum.-Comput.
Stud. 2007, 65, 446–459. [CrossRef]
15. Lao, S.; Bimbo, J.; Dahiya, R.; Lui, H. Robotic tactile perception of object properties: A review. Mechatronics 2017, 48, 54–67.
[CrossRef]
16. Zou, L.; Ge, C.; Wang, Z.J.; Certu, E.; Li, X. Novel Tactile Sensor Technology and Smart Tactile Sensing Systems: A Review. Sensors
2017, 17, 2653. [CrossRef]
17. Salim, A.; Lim, S. Review of Recent Inkjet-Printed Capacitive Tactile Sensors. Sensors 2017, 17, 2593. [CrossRef] [PubMed]
18. Seminara, L.; Gastaldo, P.; Watt, S.J.; Valyear, K.F.; Zuher, F.; Mastrogiovanni, F. Active Haptic Perception in Robots: A Review.
Front. Neurorobotics 2019, 13, 1–20. [CrossRef]
19. Shimonomura, K. Tactile Image Sensors Employing Camera: A Review. Sensors 2019, 19, 3933. [CrossRef] [PubMed]
20. Handarish, U.A.; Omisore, O.M.; Igbe, T.; Han, S.; Li, H.; Du, W.; Zhang, J.; Wang, L. A Survey of Tactile-Sensing Systems and
Their Applications in Biomedical Engineering. Adv. Mater. Sci. Eng. 2020, 2020, 4047937. [CrossRef]
21. Weiss, K.; Worn, H. The working principle of resistive tactile sensor cells. In Proceedings of the IEEE International Conference
Mechatronics and Automation, Niagara Falls, ON, Canada, 29 July–1 August 2005. [CrossRef]
22. Stassi, S.; Cauda, V.; Canavese, G.; Pirri, C.F. Flexible Tactile Sensing Based on Piezoresistive Composites: A Review. Sensors 2014,
14, 5296–5332. [CrossRef] [PubMed]
23. Wang, X.; Zhong, Y.; Sun, Y.; Li, X. A flexible capacitive tactile sensing array for pressure measurement. In Proceedings of the
IEEE International Conference on Robotics and Biomimetics, Bali, Indonesia, 5–10 December 2014. [CrossRef]
24. Attar, I.; Altintig, K.S.; Bozyel, I.; Gokcen, D. Design of A Highly Sensitive, Flexible and Stretchable Tactile Sensor for Electronic
Skin Applications. In Proceedings of the IEEE International Conference on Flexible and Printable Sensors and Systems (FLEPS),
Glasgow, UK, 8–10 July 2019. [CrossRef]
25. Chuang, C.; Dong, W.; Lo, W. Flexible Piezoelectric Tactile Sensor with Structural Electrodes Array for Shape Recognition System.
In Proceedings of the 3rd International Conference on Sensing Technology, Tainan, Taiwan, 30 November–3 December 2008.
[CrossRef]
26. Lee, J.; Choi, W.; Yoo, Y.K.; Hwang, K.S.; Lee, S.; Kang, S.; Kim, J.; Lee, J.H. A Micro-Fabricated Force Sensor Using an All Thin
Film Piezoelectric Active Sensor. Sensors 2014, 14, 22199–22207. [CrossRef]
27. Jiang, H.; Yan, Y.; Zhu, X.; Zhang, C. A 3-D Surface Reconstruction with Shadow Processing for Optical Tactile Sensors. Sensors
2018, 18, 2785. [CrossRef]
28. Yussof, H.; Abdullah, S.C.; Ohka, M. Development of Optical Three-Axis Tactile Sensor and its Application to Robotic Hand for
Dexterous Manipulation Tasks. In Proceedings of the 2010 Fourth Asia International Conference on Mathematical/Analytical
Modelling and Computer Simulation, Kota Kinabalu, Malaysia, 26–28 May 2010. [CrossRef]
29. Palli, G.; Pirozzi, S. A Tactile-Based Wire Manipulation System for Manufacturing Applications. Robotics 2019, 8, 46. [CrossRef]You can also read