Unlocking the Door Consultation Project - Real Estate, Property Development and Construction Sector Workshop Report (Workshop Review Draft) ...
←
→
Page content transcription
If your browser does not render page correctly, please read the page content below
Unlocking the Door Consultation Project – Real Estate, Property Development and Construction Sector Workshop Report

      Unlocking the Door Consultation Project
      Real Estate, Property Development and Construction Sector
                        Workshop Report (Workshop Review Draft)
                                                                                                                      April, 2017

               MEMBER OF THE NORTHERN AUSTRALIA ALLIANCE

                                                               1
Unlocking the Door Consultation Project – Real Estate, Property Development and Construction Sector Workshop Report

Disclosure and Disclaimer

This report has been prepared by Australian Venture Consultants Pty Ltd (ACN: 101 195 699) (‘AVC’). AVC has
been commissioned to prepare this report by Broome Future Limited, and has received a fee from Broome Future
Limited for its preparation.

While the information contained in this report has been prepared by AVC with all reasonable care from sources
that AVC believes to be reliable, no responsibility or liability is accepted by AVC for any errors, omissions or
misstatements however caused. Any opinions or recommendations reflect the judgment and assumptions of AVC
as at the date of the document and may change without notice. AVC, its officers, agents and employees exclude
all liability whatsoever, in negligence or otherwise, for any loss or damage relating to this document to the full extent
permitted by law. Any opinion contained in this report is unsolicited general information only. AVC is not aware that
any recipient intends to rely on this report or of the manner in which a recipient intends to use it. In preparing this
information it is not possible to take into consideration the information or opinion needs of any individual recipient.
Recipients should conduct their own research into the issues discussed in this report before acting on any
recommendation.

                                                               2
Unlocking the Door Consultation Project – Real Estate, Property Development and Construction Sector Workshop Report

Contents
1.      Background ......................................................................................................................................... 4
     1.1.      Broome Future and the Unlocking the Door Consultation Project .................................... 4

        1.1.1.        Broome Future Limited ........................................................................................................ 4

        1.1.2.        Unlocking the Door Consultation Project ....................................................................... 4

     1.2. The Unlocking the Door Real Estate, Property Development and Construction
     Workshop ................................................................................................................................................. 4

        1.2.1.        Purpose .................................................................................................................................. 4

        1.2.2.        Workshop Agenda and Materials .................................................................................... 5

        1.2.3.        Workshop Attendees .......................................................................................................... 5

2.      Workshop Deliberations ..................................................................................................................... 7
     2.1. Status and Trends in Real Estate, Property Development and Construction Markets in
     Broome and the Kimberley Region ..................................................................................................... 7

        2.1.1.        A Small But Important Sector ............................................................................................ 7

        2.1.2.        Shire of Broome .................................................................................................................... 9

        2.1.3.        Shire of Derby-West Kimberley ........................................................................................ 13

        2.1.4.        Shire of Halls Creek ............................................................................................................ 17

        2.1.5.        Shire of Wyndham – East Kimberley ............................................................................... 20

        2.1.6.        Market Drivers ..................................................................................................................... 23

     2.2.      Broome Growth Centre Plan .................................................................................................. 32

     2.3.      Nyamba Buru Yawuru .............................................................................................................. 40

     2.4.      Shire of Broome ......................................................................................................................... 41

     2.5.      Workshop Deliberations ........................................................................................................... 41

        2.5.1.        Real-estate market outlook ............................................................................................. 42

        2.5.2.        Property Development ..................................................................................................... 42

        2.5.3.        Construction Sector .......................................................................................................... 42

     2.6.      Priorities for Advocacy ............................................................................................................. 43

Appendix 1: Workshop Agenda ............................................................................................................ 45
Appendix 2: Nyamba Buru Yawuru Property Portfolio ...................................................................... 49

                                                                                3
Unlocking the Door Consultation Project – Real Estate, Property Development and Construction Sector Workshop Report
1. Background
1.1. Broome Future and the Unlocking the Door
Consultation Project
1.1.1. Broome Future Limited
Broome Future Limited (Broome Future) is a not-for-profit organisation, founded and funded by
individuals and organisations with interests in the environmentally sustainable social, cultural
and economic development of Broome, the West Kimberley and the wider Kimberley Region.
More information on Broome Future can be viewed at www.broomefuture.com.
In 2015, Broome Future released its inaugural study, Unlocking the Door: A Study into the
Feasibility of Broome as a Logistics and Commercial Hub for the Kimberley Region. Undertaken
by Australian Venture Consultants, this study is widely recognised as one of the most
comprehensive analyses of development opportunities and challenges facing Broome and
the wider Kimberley Region. This report can be downloaded at
http://broomefuture.com/unlocking-the-door-report.
1.1.2. Unlocking the Door Consultation Project
Rather than making recommendations as to how the Kimberley community might address
these opportunities and challenges, the abovementioned report recommends a
comprehensive and deep consultation process designed to result in:
A clear and detailed articulation of the opportunities and challenges facing specific
aspects of Broome and the Kimberley society and economy;
Agreed priorities for action; and
Ultimately a development plan and development decision framework that underpins
better planning for and prosecution of regional development in the Kimberley Region.
Reports from consultation workshops that have been completed thus far can be downloaded
at http://broomefuture.com/unlocking-the-door-report-consultation-project.
1.2. The Unlocking the Door Real Estate, Property
Development and Construction Workshop
1.2.1. Purpose
As illuminated by the Unlocking the Door Small Business Sector Workshop
(http://broomefuture.com/unlocking-the-door-report-consultation-project), the real estate,
property development and construction sectors accounts for a very significant portion of the
businesses in Broome and the other main population centres of the Kimberley Region. There is
also a significant number of Aboriginal owned and operated businesses, particularly in the
construction sector.
These sectors are critically important to meeting the real estate transaction and management,
as well as construction needs of local residents and businesses. They also face number of
challenges that are common to real estate, property development and construction in other
4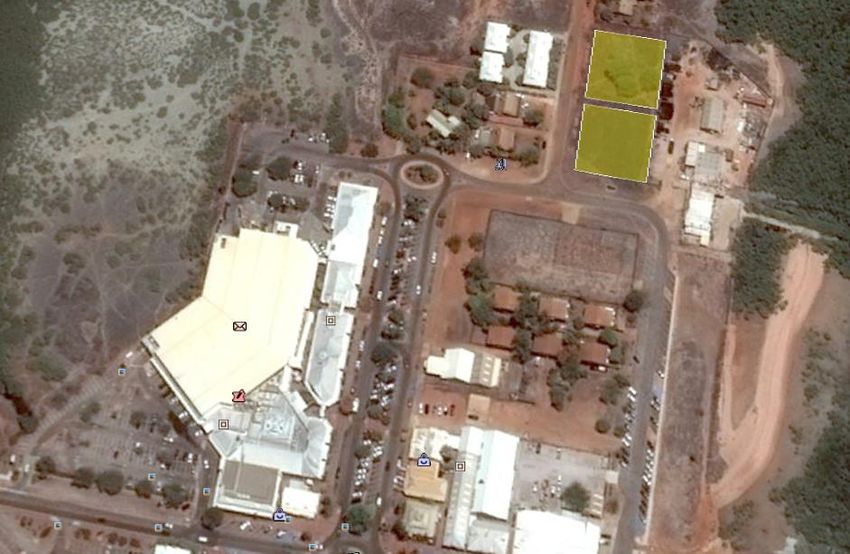
Unlocking the Door Consultation Project – Real Estate, Property Development and Construction Sector Workshop Report
rural and regional areas such as significant market volatility, high cost structures and
competition from non-local contractors and service providers. In the Kimberley, both the real-
estate and construction sectors are particularly sensitive to major new projects (particularly
outside of Broome) and construction sector challenges are exacerbated with operating
constraints imposed by the wet season.
The specific purpose of the Unlocking the Door Real Estate, Property Development and
Construction Workshop is to:
Serve as the principle mechanism through which the opinions and views of operators
of real-estate, property development and construction enterprises in the Kimberley are
integrated into the Unlocking the Door Consultation project;
Identify key issues, challenges and opportunities facing the Kimberley real-estate,
property development and construction sectors; and
Identify key advocacy and investment priorities for the Kimberley real-estate, property
development and construction sectors.
The workshop was held on 6th April 2017 at the Mangrove Hotel, Broome.
1.2.2. Workshop Agenda and Materials
The following materials were provided to participants in the Workshop as background material:
Workshop Agenda, which is contained in Appendix 1; and
Online access to the Unlocking the Door study and Report from the Unlocking the Door
Small Business Workshop.
1.2.3. Workshop Attendees
Table 1 below lists invitees to and participants in the workshop.
Invitee Representation Attended
1. Russell Barnett Broome Future Limited Yes
2. Denis Ryan Broome Future Limited Yes
3. Tim Bray Kimberley Development Corporation Yes
4. Chris Forbes Nyamba Buru Yawuru Yes
5. Ron Johnston Shire of Broome Yes
6. Tony Hutchinson Hutchinson Real Estate Yes
7. Allan Griffiths First National Real Estate Yes
8. Andrew Blackley PRD Nationwide Yes
9. Clare Cowen Ray White Yes
10. Giles Tipping Ray White Yes
11. Robert Sweet Broome Builders Yes
12. Michael Smyth Custom Lifestyle Homes Yes
5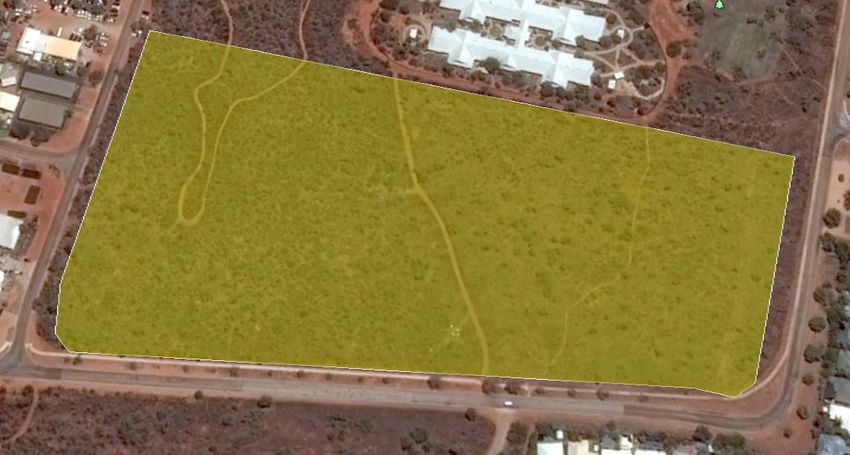
Unlocking the Door Consultation Project – Real Estate, Property Development and Construction Sector Workshop Report

                        Invitee                                       Representation                              Attended

   13.    Patches Fiorenza                   CWD Builders                                                             Yes

   14.    Scott Elson                        IP &ST Elson                                                             Yes

   15.    Joe Giancono                       McKeno Blocks & Pavers                                                   Yes

   16.    Rob Menzies                        Roebuck Estate                                                           Yes

   17.    Mike Carrigg                       Orrcon Steel                                                             Yes

   18.    Darren Cross                       DWA Industrial Resources                                                 Yes

   19.    Glenn Schluter                     Ricon                                                                    Yes

   20.    Christian Joder                    Acor Consultants                                                         Yes

   21.    Peter Burns                        Hutchinson Real Estate                                                   No

   22.    Andrew Black                       Andrew Black Construction                                                No

   23.    Meagan Black                       Andrew Black Construction                                                No

   24.    Steven Lydeamore                   Buildmore Constructions                                                  No

   25.    Harold Tracey                      H&M Tracey Construction                                                  No

   26.    Jeffrey White                      Kullarri Building                                                        No

   27.    Paul White                         Tjallara Building Company                                                No

   28.    Karl Plunkett                      Eco Constructions                                                        No

TABLE 1 – UNLOCKING THE DOOR REAL ESTATE , PROPERTY D EVELOPMENT AND C ONSTRUCTION S ECTOR
F ORUM A TTENDEES

                                                                 6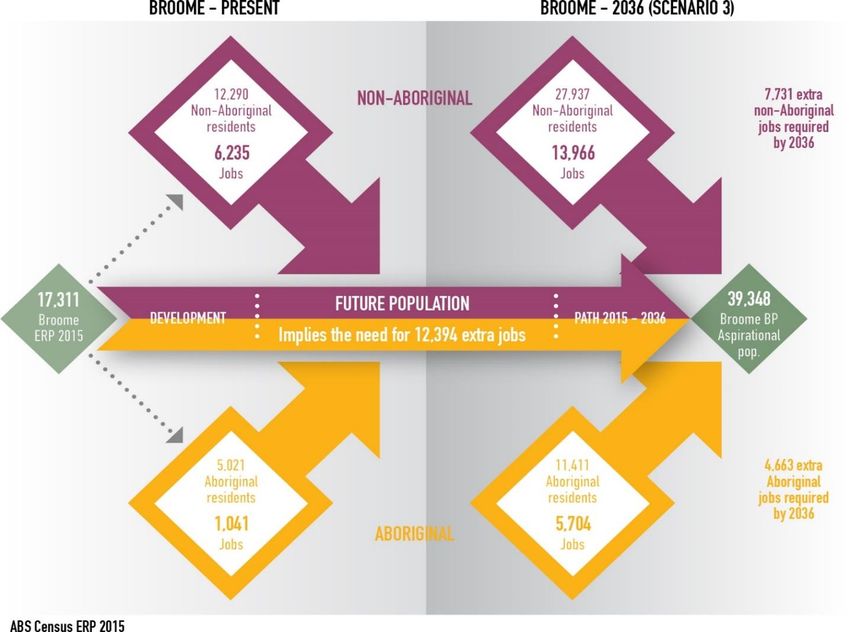
Unlocking the Door Consultation Project – Real Estate, Property Development and Construction Sector Workshop Report

2.            Workshop Deliberations

2.1.          Status and Trends in Real Estate, Property
              Development and Construction Markets in Broome
              and the Kimberley Region
The Workshop Facilitator commenced the workshop by delivering a presentation that, based
on high-level statistics, demonstrated recent trends in the real estate, property development
and construction sectors in the Kimberley and the key local markets that they serve. This
presentation is summarised in the following subsections.

Additional data pertaining to the Kimberley real-estate and rental markets is presented in
Section 2.2.

2.1.1.        A Small But Important Sector
Since 2002-03, the Kimberley Region has accounted for approximately 1.5 percent of all new
dwelling and other residential approvals in Western Australia. Just under half of the 5,169
approvals that were granted in in the Kimberley during that period have been in the Shire of
Broome, with the Shires of Derby-West Kimberley and Wyndham-East Kimberley each
accounting for approximately 20 percent and the Shire of Halls Creek accounting for 13
percent. This is illustrated in Figure 11 below.

                                                                                                 Kimberley (1.5%)

                 Rest of Western Australia (98.5%)
                                                                                                  Broome (0.7%)

                                                                                                   Derby-West
                                                                                                 Kimberley (0.3%)

                                                                                                 Wyndham-East
                                                                                                 Kimberley (0.3%)

                                                                                                 Halls Creek (0.2%)

                            352,248 Approvals                                                   5,169 Approvals

F IGURE 1- NEW D WELLING AND OTHER R ESIDENTIAL APPROVALS (2002-03 TO 2015-16)

1   Australian Bureau of Statistics (2017), Building Approvals, Australian Government, Canberra

                                                               7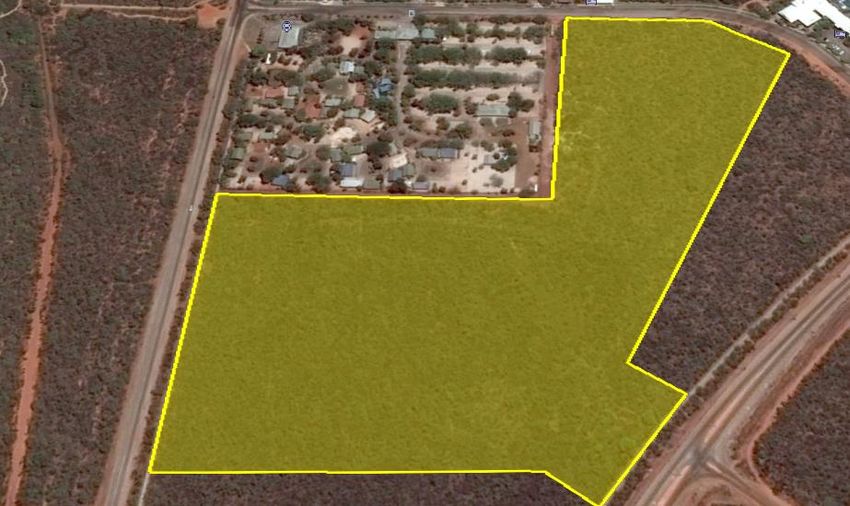
Unlocking the Door Consultation Project – Real Estate, Property Development and Construction Sector Workshop Report

In the building construction sector, the Kimberley Region accounted for 2.0 percent of the
value of all building construction2 in the State over the same time period. Of the $2.9 billion of
building construction expenditure that took place in the Kimberley over that time period, just
under half occurred in the Shire of Broome, 20 percent in each of the Shire of Derby-West
Kimberley and Wyndham-East Kimberley and 10 percent in the Shire of Halls Creek. This is
illustrated in Figure 23 below.

                                                                                             Kimberley (2.0%)

                 Rest of Western Australia (98.0%)
                                                                                                 Broome (0.9%)

                                                                                                Derby-West
                                                                                              Kimberley (0.5%)

                                                                                               Wyndham-East
                                                                                               Kimberley (0.5%)

                                                                                              Halls Creek (0.2%)

                              $132.2 billion                                                   $2.9 billion

F IGURE 2 – TOTAL BUILDING C ONSTRUCTION (2002 TO 2015-16)

Despite only accounting for a small portion of the State market, real-estate, property
development and construction businesses comprise a very significant portion of the business
community in the Region. As an indication, in recent times businesses operating in the
Kimberley Region in the construction, rental, hiring and real-estate4 sectors have accounted
for 34 percent of all small businesses5 in the Region. This is illustrated in Figure 36 below.

2 Building construction includes all residential, commercial and industrial buildings, but
excludes infrastructure.
3 Australian Bureau of Statistics (2017), Building Approvals, Australian Government, Canberra
4 This classification includes businesses in operating in all aspects of hiring and rental.
5 The vast majority of businesses in the region are categorised as small businesses.
6 Australian Bureau of Statistics (2016), Counts of Australian Businesses, Australian Government

Canberra

                                                               8
Unlocking the Door Consultation Project – Real Estate, Property Development and Construction Sector Workshop Report

    2,500

    2,000

    1,500

    1,000

     500                                                                                                                                         34 percent of
                                                                                                                                                 small
       -
                                    2,013                                 2014                                            2015
                                                                                                                                                 businesses in
            Construction                          Rental, Hiring and Real Estate Services           Retail Trade
                                                                                                                                                 the Region
            Agriculture, Forestry and Fishing     Professional, Scientific and Technical Services   Transport, Postal and Warehousing

            Other Services                        Financial and Insurance Services                  Accommodation and Food Services

            Administrative and Support Services   Manufacturing                                     Health Care and Social Assistance

            Currently Unknown                     Wholesale Trade                                   Information Media and Telecommunications

            Arts and Recreation Services          Education and Training                            Electricity, Gas, Water and Waste Services

            Public Administration and Safety      Mining

F IGURE 3 – N UMBER OF SMALL BUSINESSES IN THE KIMBERLEY REGION

2.1.2.                     Shire of Broome
Businesses operating in the construction, rental, hiring and real-estate services sectors account
for 38 percent of all small businesses operating in the Shire of Broome. As illustrated in Figure 4
7below, these businesses range in size from small owner-operator businesses turning over less

than $50,000 to businesses generating in excess of $2.0 million per annum.

7Australian Bureau of Statistics (2016), Counts of Australian Businesses, Australian Government
Canberra

                                                                                            9
Unlocking the Door Consultation Project – Real Estate, Property Development and Construction Sector Workshop Report

                             Construction

    Rental, Hiring and Real Estate Services

                                              0           50           100          150         200         250      300   350

                               Zero to $50k                    $50k to less than $100k    $100k to less than $200K
                               $200k to less than $500k        $500k to less than $2m     $2m or more

F IGURE 4 – B ROOME BASED C ONSTRUCTION AND REAL -ESTATE S MALL BUSINESSES (2015)

As illustrated in Figure 58 below, new dwelling approvals in the Shire of Broome have been
relatively volatile over the past 15 years, with a significant spike in activity in 2012-13, which was
likely associated with sentiment associated with the potential progress of the James Price Point
onshore LNG project.

8   Australian Bureau of Statistics (2017), Building Approvals, Australian Government, Canberra

                                                                        10
Unlocking the Door Consultation Project – Real Estate, Property Development and Construction Sector Workshop Report
400
350
300
No. of Dwellings
250
200
150
100
50
0
Houses Other residential
F IGURE 5 – N EW D WELLING A PPROVALS – SHIRE OF B ROOME
As illustrated in Figure 69 below, this volatility has been reflected in the value of building
construction in the Shire over the same period. Compared to the rest of the Kimberley Region,
commercial and industrial building construction expenditure comprises a significant portion of
total building construction expenditure in most years.
$200
$180
$160
$140
A$ million
$120
$100
$80
$60
$40
$20
$0
Housing Other Residential Commercial & Industrial
F IGURE 6 – VALUE OF B UILDING CONSTRUCTION – SHIRE OF BROOME
9 Australian Bureau of Statistics (2017), Building Approvals, Australian Government, Canberra
11Unlocking the Door Consultation Project – Real Estate, Property Development and Construction Sector Workshop Report
There has been a general decline in housing prices in the Shire of Broome since 2012. This is
illustrated in Figure 710 below. This is consistent with property markets across most of the State.
$800,000
$700,000
$600,000
$500,000
Median Price
$400,000
$300,000
$200,000
$100,000
$0
CY2012 CY2013 CY2014 CY2015 CY2016
Broome Cable Beach - median Djugan Bilingurr
F IGURE 7 – MEDIAN H OUSE PRICES – SHIRE OF BROOME
However, as illustrated in Figure 811 below, turnover in key suburbs of Broome has been
reasonably consistent.
10Landgate (2017, Suburb Sales Report & Real Estate Institute of Western Australia (2017)
Suburb Profiles.
11Landgate (2017, Suburb Sales Report & Real Estate Institute of Western Australia (2017)
Suburb Profiles.
12Unlocking the Door Consultation Project – Real Estate, Property Development and Construction Sector Workshop Report
70
60
50
40
30
20
10
0
CY2012 CY2013 CY2014 CY2015 CY2016
Broome Cable Beach Djugan Bilingurr
F IGURE 8 – R EAL -ESTATE TURNOVER – SHIRE OF BROOME
2.1.3. Shire of Derby-West Kimberley
Businesses operating in the construction, rental, hiring and real-estate services sectors account
for 33 percent of all small businesses operating in the Shire of Derby-West Kimberley. Businesses
operating in the construction sector range in size from small owner-operator businesses turning
over less than $50,000, to businesses generating revenue in excess of $2.0 million per annum.
There are no real-estate businesses in the Shire of Derby-West Kimberley turning over more than
$2.0 million per annum. This is illustrated in Figure 912 below
Australian Bureau of Statistics (2016), Counts of Australian Businesses, Australian
12
Government Canberra
13Unlocking the Door Consultation Project – Real Estate, Property Development and Construction Sector Workshop Report
Construction
Rental, Hiring and Real Estate Services
0 10 20 30 40 50 60
Zero to $50k $50k to less than $100k $100k to less than $200K
$200k to less than $500k $500k to less than $2m $2m or more
F IGURE 9 – CONSTRUCTION AND REAL ESTATE SMALL BUSINESS – SHIRE OF DERBY -WEST KIMBERLEY (2015)
New dwelling approvals in the Shire of Derby-West Kimberley have been volatile over the
course of the past 15 years, with a major increase during the period 2010-11 to 2012-13 which
was the result of housing demand associated with the establishment of a new prison and
detention centre. This is illustrated in Figure 1013 below.
13 Australian Bureau of Statistics (2017), Building Approvals, Australian Government, Canberra
14Unlocking the Door Consultation Project – Real Estate, Property Development and Construction Sector Workshop Report
250
200
No. of New Dwellings
150
100
50
0
Houses Other residential
F IGURE 10 – NEW D WELLING A PPROVALS – SHIRE OF D ERBY-WEST KIMBERLEY
Similar volatility is evident in the value of building construction over the same period, with
significant increases, particularly in commercial and industrial buildings, associated with the
prison and detention centre over the period 2009-10 to 2012-13. This is illustrated in Figure 1114
below.
$140
$120
$100
A$ million
$80
$60
$40
$20
$0
Housing Residential Commerical and Industrial
F IGURE 11 – VALUE OF BUILDING C ONSTRUCTION – SHIRE OF DERBY -W EST K IMBERLEY
14 Australian Bureau of Statistics (2017), Building Approvals, Australian Government, Canberra
15Unlocking the Door Consultation Project – Real Estate, Property Development and Construction Sector Workshop Report
While there is limited data on which to establish trends in Fitzroy Crossing and Camballin,
median house prices in the Shire of Derby-West Kimberley have declined dramatically over the
past four years. This is illustrated in Figure 1215 below.
$600,000
$500,000
$400,000
Median Price
$300,000
$200,000
$100,000
$0
CY2012 CY2013 CY2014 CY2015 CY2016
Derby
F IGURE 12 – MEDIAN HOUSE P RICES – T OWN OF DERBY
Furthermore, any turnover in the real-estate market in the Shire of Derby-West Kimberley has
been almost exclusively restricted to the town of Derby. This is illustrated in Figure 1316 below.
15 Landgate (2017, Suburb Sales Report & Real Estate Institute of Western Australia (2017)
Suburb Profiles.
16 Landgate (2017, Suburb Sales Report & Real Estate Institute of Western Australia (2017)
Suburb Profiles.
16Unlocking the Door Consultation Project – Real Estate, Property Development and Construction Sector Workshop Report
70
60
50
40
30
20
10
0
CY2012 CY2013 CY2014 CY2015 CY2016
Camballin Derby Fitzroy Crossing
F IGURE 13 - REAL-ESTATE TURNOVER – SHIRE OF DERBY -WEST KIMBERLEY
2.1.4. Shire of Halls Creek
Compared to the rest of the Kimberley, at 22 percent, the portion of all businesses operating
in the construction, rental, hiring and real-estate services sector operating in the Shire of Halls
Creek is much smaller than is the case for the rest of the Kimberley. There is also comparatively
a much smaller number of, typically smaller construction and real-estate operations in the Shire
of Halls Creek. This is illustrated in Figure 1417 below.
Australian Bureau of Statistics (2016), Counts of Australian Businesses, Australian
17
Government Canberra
17Unlocking the Door Consultation Project – Real Estate, Property Development and Construction Sector Workshop Report
Construction
Rental, Hiring and Real Estate Services
0 2 4 6 8 10
Zero to $50k $50k to less than $100k $100k to less than $200K
$200k to less than $500k $500k to less than $2m $2m or more
F IGURE 14 – C ONSTRUCTION AND REAL-ESTATE S MALL B USINESS – SHIRE OF HALLS CREEK (2015)
As illustrated in Figure 1518 below, new dwelling approvals have, like the rest of the Kimberley,
been volatile in Halls Creek over the past 15 years, with a spike of activity in 2011-12 and 2012-
13.
18 Australian Bureau of Statistics (2017), Building Approvals, Australian Government, Canberra
18Unlocking the Door Consultation Project – Real Estate, Property Development and Construction Sector Workshop Report
80
70
No. of New Dwellings
60
50
40
30
20
10
0
Houses Other residential
F IGURE 15 – NEW D WELLING A PPROVALS – SHIRE OF HALLS CREEK
This volatility has been reflected in the value of building construction over the same period.
This is illustrated in Figure 1619 below, with relatively significant activity in the period 2009-1 to
2014-15 and a dramatic decline in 2015-16.
$35
$30
$25
A$ million
$20
$15
$10
$5
$0
Housing Other Residential Commerical and Industrial
F IGURE 16 – VALUE OF BUILDING C ONSTRUCTION – SHIRE OF HALLS CREEK
This analysis was unable to source any data pertaining to real-estate market trends in the Shire
of Halls Creek.
19 Australian Bureau of Statistics (2017), Building Approvals, Australian Government, Canberra
19Unlocking the Door Consultation Project – Real Estate, Property Development and Construction Sector Workshop Report
2.1.5. Shire of Wyndham – East Kimberley
The Shire of Wyndham-East Kimberley hosts the second largest number of businesses operating
in the construction, rental, hiring and real-estate sectors in the Kimberley, but does not host
any real-estate businesses turning over more than $2.0 million. This is illustrated in Figure 1720
below. The businesses operating in these sectors account for 30 percent of all small businesses
in the Shire.
Construction
Rental, Hiring and Real Estate Services
0 20 40 60 80 100 120 140
Zero to $50k $50k to less than $100k $100k to less than $200K
$200k to less than $500k $500k to less than $2m $2m or more
F IGURE 17 – C ONSTRUCTION AND REAL-ESTATE S MALL B USINESSES – SHIRE OF WYNDHAM -EAST K IMBERLEY
Other than a specific spike of activity during the period 2009-10 to 2010-11, new dwelling
approvals in Wyndham-East Kimberley have been slightly less volatile than they are in the other
shires. This is illustrated in Figure 1821 below.
20 Australian Bureau of Statistics (2016), Counts of Australian Businesses, Australian
Government Canberra
21 Australian Bureau of Statistics (2017), Building Approvals, Australian Government, Canberra
20Unlocking the Door Consultation Project – Real Estate, Property Development and Construction Sector Workshop Report
180
160
140
No. of Dwellings
120
100
80
60
40
20
0
Houses Other residential
F IGURE 18 – NEW D WELLING A PPROVALS – WYNDHAM – EAST KIMBERLEY
As illustrated in Figure 1922 below, this general stability is reflected in the value of building
construction in the Shire. The spike in 2010-11 is associated with the construction of a new Court
House in Kununurra.
$200
$180
$160
$140
A$ million
$120
$100
$80
$60
$40
$20
$0
Housing Other Residential Commercial and Industrial
F IGURE 19 – VALUE OF BUILDING C ONSTRUCTION – SHIRE OF WYNDHAM-EAST KIMBERLEY
Generally speaking, real-estate values have also been more stable in the Shire of Wyndham-
East Kimberley. This is illustrated in Figure 2023 below.
22Australian Bureau of Statistics (2017), Building Approvals, Australian Government, Canberra
23Landgate (2017, Suburb Sales Report & Real Estate Institute of Western Australia (2017)
Suburb Profiles.
21Unlocking the Door Consultation Project – Real Estate, Property Development and Construction Sector Workshop Report
$500,000
$450,000
$400,000
$350,000
Median Price
$300,000
$250,000
$200,000
$150,000
$100,000
$50,000
$0
CY2012 CY2013 CY2014 CY2015 CY2016
Kununurra Wyndham
F IGURE 20 – MEDIAN HOUSE P RICES – SHIRE OF WYNDHAM -EAST K IMBERLEY
While real-estate turnover has been lower in more recent years, it is also relatively stable. This
is illustrated in Figure 2124 below.
24Landgate (2017, Suburb Sales Report & Real Estate Institute of Western Australia (2017)
Suburb Profiles.
22Unlocking the Door Consultation Project – Real Estate, Property Development and Construction Sector Workshop Report
50
45
40
35
30
25
20
15
10
5
0
CY2012 CY2013 CY2014 CY2015 CY2016
Kununurra Wyndham
F IGURE 21 – REAL -ESTATE TURNOVER – SHIRE OF WYNDHAM -EAST K IMBERLEY
2.1.6. Market Drivers
As illustrated in Figure 2225 below, all of the Shires that comprise the Kimberley Region have
enjoyed strong population growth over the past decade that has, to varying degrees,
underpinned activity in the real-estate, property development and construction sectors.
However in recent years populations have stabilised in the Shires of Broome and Wyndham-
East Kimberley and begun to decline in the Shires of Derby-West Kimberley and Halls Creek.
25Australian Bureau of Statistics (2016), Regional Population Growth, Australia: Estimated
Resident Population, Local Government Area, Western Australia, Australian Government,
Canberra
23Unlocking the Door Consultation Project – Real Estate, Property Development and Construction Sector Workshop Report
Shire of Broome Shire of Derby-West Kimberley
20,000 12,000
18,000
10,000
16,000
14,000
Number of Persons
Number of Persons
8,000
12,000
10,000 6,000
8,000
4,000
6,000
4,000
2,000
2,000
- -
2005 2006 2007 2008 2009 2010 2011 2012r 2013r 2014r 2015p 2005 2006 2007 2008 2009 2010 2011 2012r 2013r 2014r 2015p
Shire of Halls Creek Shire of Wyndham-East Kimberley
4,000 8,800
3,950 8,600
3,900 8,400
Number of Persons
Number of Persons
3,850 8,200
3,800 8,000
3,750 7,800
3,700 7,600
3,650 7,400
3,600 7,200
2005 2006 2007 2008 2009 2010 2011 2012r 2013r 2014r 2015p 2005 2006 2007 2008 2009 2010 2011 2012r 2013r 2014r 2015p
F IGURE 22 – TRENDS IN RESIDENTIAL P OPULATION IN THE KIMBERLEY REGION
Figure 23 below illustrates the contribution that the main sectors of the Kimberley economy
made to Gross Regional Product (GRP) and employment in 2013. While the mining sector was
a major driver of GRP, its contribution to employment was substantially less. The main drivers of
employment in the region are government services and tourism, which in this data set includes
all aspects of accommodation, catering and retail. Given that since 2013, the three iron ore
projects that were operating in the Kimberley at the time have ceased production, it is highly
likely that the mining sectors contribution is less.
24Unlocking the Door Consultation Project – Real Estate, Property Development and Construction Sector Workshop Report
40.0%
? 2013 40.0%
35.0% 35.0%
Contribution to Kimberley Employment
30.0% 30.0%
Contribution to Kimberley GRP
25.0% 25.0%
20.0% 20.0%
15.0% 15.0%
10.0% 10.0%
5.0% 5.0%
0.0% 0.0%
Mining Government Other services Construction Logistics Tourism Agriculture, Other sectors
service and Forestry and
delivery ownership of Fishing
dwellings
Percentage of GRP Percentage of Employment
What does it look like now?
F IGURE 23 – C OMPOSITION OF THE KIMBERLEY E CONOMY (2013)
Resources Industry Project Drivers
As summarised in Table 2 below, the Nicholson’s Find, Central Tanami and Argyle mines will
likely continue to provide employment, with immediate opportunities for growth associated
with the commissioning and ongoing operations of the Ichthys and Prelude offshore petroleum
projects and potential development of the Brown’s Range and Thunderbird minerals projects.
25Unlocking the Door Consultation Project – Real Estate, Property Development and Construction Sector Workshop Report
Minerals Project Status Petroleum Project Status
Ridges (KMG) Care & Browse (Woodside Pre-development
Maintenance
Savannah (Panorama Care & Ungani, Valhalla, Asgaard & Exploration &
Resources) Maintenance Yulleroo (Buru Energy Development
Cockatoo Island (Pluton Care & Ichthys (INPEX) Development
Resources) Maintenance
Koolan Island (Mt Gibson) Suspended Prelude (Shell) Development
Browns Range (Northern Pre-development
Minerals)
Thunderbird (Sheffield Pre-development
Resources)
Irvine Island (Pluton Pre-development
Resources)
Nicholson’s Find (Niugini) Operational
Central Tanami (Tanami Operational
Gold)
Argyle (Rio Tinto) Operational
TABLE 2 – CURRENT STATUS OF M AJOR K IMBERLEY RESOURCES PROJECTS
For more information on the status and potential of the resources industries in the Kimberley
see the Unlocking the Door Resources Industry Workshop Report
(http://broomefuture.com/unlocking-the-door-report-consultation-project)
Agricultural Industry Development Drivers
There has been a strong push by government and industry over the past decade for the
progressive development of irrigated agriculture in the Kimberley Region. Combined, the
Western Australian and Commonwealth Government have invested approximately $700
million in agricultural initiatives in the Kimberley since 2010. The focus of this investment has
primarily been in studies and infrastructure to support the development of horticulture,
cropping and pastoral operations based on irrigation. As summarised in Table 3 below, the
main focus of this investment has been the Ord River Irrigation Area (ORIA) with most additional
capacity expected to come on stream by 2025 being associated with ORIA. However, there
is also some growth expected in the West Kimberley.
26Unlocking the Door Consultation Project – Real Estate, Property Development and Construction Sector Workshop Report
Area (ha) Operational Potentially Potentially Operational Potential Potential
Operational by 2025 beyond 2025 Unscheduled Total
La Grange 800 3,000 5,000 Up to an additional 13,800
5,000
Broome 480 1,000 1,480
Derby outskirts 110 350 460
Knowsely/Curtin Up to 22,000 22,000
Airbase
Fitzroy Valley Up to 23,000 23,000
WEST KIMBERLEY 1,390 4,350 5,000 Up to 50,000 60,740
ORD RIVER 17,000 46,250 41,000 104,250
PRECINCT
NORTHERN 14,000 14,000
TERRITORY
TOTAL 18,390 64,600 46,000 Up to 50,000 178,990
TABLE 3 – EXPECTED D EVELOPMENT OF IRRIGATED AGRICULTURE IN THE KIMBERLEY
Figure 24 below illustrates the expected roll-out of additional irrigated agriculture capacity in
the ORIA.
70,000
60,000
50,000
40,000
30,000
20,000
10,000
0
2016 2017 2018 2019 2020 2021 2022 2023 2024 2025 2026 2027
Ord Stage 1 Gooimg Carlton Hill
Mantinea West Bank East Bank
Packsaddle Knox Plain NT stage 3b (Weaber)
NT stage 3a (Knox South) Cockatoo Sands - Vic Hwy Cockatoo Sands - Carlton
NT stage 3c (Keep)
F IGURE 24 – EXPECTED EXPANSION OF AREA (HA ) UNDER IRRIGATION – ORD RIVER IRRIGATION S CHEME
27Unlocking the Door Consultation Project – Real Estate, Property Development and Construction Sector Workshop Report
Figure 25 below, illustrates areas in which irrigated agriculture could take place in the West
Kimberley.
F IGURE 25– EXPECTED AREAS OF IRRIGATED A GRICULTURE – WEST KIMBERLEY
Agricultural development will create opportunities for the construction sector in establishing
irrigated agriculture operations, as well as the development downstream infrastructure such
as feedlots and cold chain logistics systems.
For more information on the status and prospects of irrigated agriculture in the Kimberley see
the Unlocking the Door Pastoral and Agriculture Sector Workshop Report
(http://broomefuture.com/unlocking-the-door-report-consultation-project)
Aquaculture Industry Development Drivers
Western Australia has the second largest seafood industry in Australia. However, the State’s
ratio of aquaculture to wild-catch production is the lowest in the Nation. Western Australia’s
aquaculture industry is dominated by the $60 million per annum Pinctada maxima (South Sea
Pearl) industry, which is located almost entirely in the Kimberley Region. Of the remaining
approximate $20 million of GVP produced by the Western Australian aquaculture industry, 50
percent is attributable to Marine Produce Australia’s Cone Bay Barramundi operation, also
located in the Kimberley Region. This is illustrated in Figure 2626 below.
Department of Agriculture and Water Resources (2015), Australian Fisheries and
26
Aquaculture Statistics, Australian Government, Canberra
28Unlocking the Door Consultation Project – Real Estate, Property Development and Construction Sector Workshop Report
800,000
Australian wild-catch and aquaculture Total Aquaculture
value of production 2013-14 Total Wild-catch
700,000
600,000
Other aquaculture ~50% Kimberley
500,000
Pearl Aquaculture 95+% Kimberley
(A$'000)
400,000
Other wild-catch
300,000
200,000
Western Rock Lobster
Wild-catch
100,000
-
Tasmania South Australia Queensland New South Wales Victoria Northern Western
Territory Australia
F IGURE 26 – WESTERN A USTRALIAN AQUACULTURE IN THE N ATIONAL C ONTEXT
Furthermore, a specific aquaculture development zone has been declared in the Buccaneer
Archipelago designed to de-risk further development of a marine finfish aquaculture industry
in the Kimberley. The location of the Kimberley Aquaculture Development Zone is illustrated
in Figure 27 below.
F IGURE 27 – KIMBERLEY A QUACULTURE D EVELOPMENT Z ONE
Tourism Industry Development Drivers
Tourism is a cornerstone industry and major employer in the Kimberley Region with
considerable opportunity for growth, albeit the sector faces some significant challenges (see
the Unlocking the Door Tourism Workshop Report - http://broomefuture.com/unlocking-the-
door-report-consultation-project).
29Unlocking the Door Consultation Project – Real Estate, Property Development and Construction Sector Workshop Report
As illustrated in Figure 2827 below, compared to other icon tourism destinations in Western
Australia Broome and the Kimberley suffers from a lack of density of tourism assets. This implies
that if Broome and the Kimberley are to prosper as tourism destinations, investment in
additional tourism infrastructure will be required. This implies opportunity for the construction
sector.
Broome
Margaret
River Region
Albany Region
Kimberley
Perth
Ningaloo Region
Density Diversity Uniqueness
F IGURE 28 – BROOME AND THE K IMBERLEY C OMPARED TO OTHER I CON WESTERN AUSTRALIAN T OURISM
D ESTINATIONS
Aboriginal Community Development Drivers
There are over 200 discrete Aboriginal communities in the Kimberley. As illustrated in Figure 29
below, many of these are located in the West Kimberley.
: TNS Global Market Research (2015), Broome Tourism Leadership Group and Tourism
27
Western Australia
30Unlocking the Door Consultation Project – Real Estate, Property Development and Construction Sector Workshop Report
F IGURE 29 – KIMBERLEY ABORIGINAL C OMMUNITIES
As a result of an evolving policy landscape with respect to the resourcing of remote Aboriginal
communities, the future of some of these communities is currently uncertain. Nevertheless,
there will continue to be demand for construction services that is associated with
maintenance, asset renewal and new capital creation in larger sustainable communities.
Importantly, and is discussed in greater detail in subsequent sections of this study, the
economic empowerment of the residents of these communities is the greatest opportunity to
substantially grow real-estate, property development and construction markets in the
Kimberley Region.
Government Service Delivery
As illustrated in Figure 23 above, government agencies are the main employer in the Kimberley
Region. As illustrated in Figure 30 below, there are 26 Western Australian and 21
Commonwealth government agencies delivering services into the Kimberley Region, most of
which have offices in Broome. While any substantial growth in this sector is unlikely, it will remain
a major underwrite of current demand and derived demand for real-estate and construction
services.
31Unlocking the Door Consultation Project – Real Estate, Property Development and Construction Sector Workshop Report
Civic Services & Economic Development & Environmental and Scientific Health Services Education Services National Security
Amenities Regulation Services
Department of Aboriginal Affairs Disability Services Commission Department of Education Department of Defence
Department of Agriculture and Food Department of Training & Workforce Immigration and Australian Customs
Department of the Attorney General Department of Health and Border Protection
Development
Department of Child Protection Department of Commerce Department of Parks & Wildlife Education Department
Department of Corrective Services Australian Institute of Marine Science
Department of Culture & the Arts Bureau of Meteorology
Department of Fire and Emergency Department of Finance, Building
CSIRO
Services Management and Works
Department of Housing Department of Fisheries
Department of Lands Department of Mines & Petroleum
Department of Local Government &
Department of Agriculture
Communities
Cotton Research and Development
Department of Planning
Corporation
Western Australian Police Service Tourism Western Australia
Department of Regional Development Department of the Environment
Department of Sport and Recreation Indigenous Business Australia
Department of Industry (Geoscience
Department of Transport
Australia and NOPSEMA)
Department of Water Meat and Livestock Australia
Attorney General’s Department Indigenous Land Corporation
CommCare Tourism Australia
Department of Communications
Department of Employment
Department of Human Services -
Centrelink
Department of Infrastructure and
Regional Development
Department of Prime Minister and
Cabinet
State Government Departments and Agencies
Commonwealth Government Departments and Agencies
F IGURE 30 – WESTERN A USTRALIAN AND C OMMONWEALTH G OVERNMENT OFFICES IN THE K IMBERLEY
Infrastructure
Plateauing or decreasing residential populations, combined by normalising industrial activity
suggests that major investments in new infrastructure in the Kimberley Region is likely to be
limited in the immediate future, most likely confined to some incremental improvements to
logistics infrastructure such as:
Some road upgrade projects such as the sealing of the Cape Leveque Road, upgrade
of the Tanami Highway between Halls Creek and Alice Springs, and various
improvements to the Great Northern Highway;
Incremental improvements to some port infrastructure; and
Incremental improvements to some airport infrastructure.
2.2. Broome Growth Centre Plan
Tim Bray, Director – Regional Planning and Project Delivery, Kimberley Development
Commission, delivered a presentation outlining the Broome Growth Centre Plan and its current
status.
The Broome Growth Centre Plan is a component of the Western Australian Government’s
Regional Growth Centre Program. As illustrated in Figure 31 below, this program has identified
a series of population centres of Western Australia that will perform a major role in facilitating
regional growth.
32Unlocking the Door Consultation Project – Real Estate, Property Development and Construction Sector Workshop Report
F IGURE 31 – REGIONAL GROWTH C ENTRES
The partners in the Broome Growth Centre Plan are Shire of Broome, Nyama Buru Yawuru,
Landcorp, Kimberley Development Commission and Department of Planning, with Creating
Communities acting as the lead consultant in the program. A range of other organisations
provide ongoing specialist input to the process in areas such as agriculture (AgKnowledge),
arts & culture (Fulsky Consulting), economic cluster analysis (Pracsys Consulting), economics
(Urbis), Environmental Impact (RPS), health and wellbeing (Marella Health Consulting),
investment analysis (Ernst & Young), infrastructure assessment (GHD), migrations and
perception survey (Painted Dog), scenario modelling (Curtin University Integrated Futures) and
scenario planning (AEC Consulting).
33Unlocking the Door Consultation Project – Real Estate, Property Development and Construction Sector Workshop Report
The Growth Plan is designed to achieve the following:
A Vision – set shared goals, strategies and actions to drive long term economic
development;
A Plan – set agile business strategy and action plan for the partnership
Communicate – the strategies/conditions for business development and investment
attraction
Align – investment and effort at all levels especially in government
The Broome Growth Centre Plan brings together a range of planning exercises including the
Yawuru Cultural Management Plan, Shire of Broome Strategic Community Plan, Western
Australian State Planning Strategy, Kimberley Regional Investment Blueprint, Kimberley
Infrastructure and Investment Framework and the Broome Future Unlocking the Door Project.
In the context of being a Growth Centre, Broome has the following characteristics:
A role and responsibility as a major service centre for the Region;
A modern thriving services sector;
A diverse economy with all sectors represented;
All sectors are very small in the State, national and global context;
The climate, distance and basic infrastructure remain challenging;
Fundamentals are strong with functional health, housing and education services;
determined Native Title; and good liveability; and
Is ready for sustainable, planned and steady growth.
So far the Growth Plan process in Broome has highlighted strong commonality of basic
community values and aspirations across the community. For example, Figure 32 below
illustrates the alignment of the organisational values of the Shire of Broome and Yawuru.
F IGURE 32 – A LIGNMENT OF C OMMUNITY VALUES
Analysis of the local and global economy conducted by the Broome Growth Plan identifies a
number of comparative and competitive advantages attributable to Broome:
Proximity to Asia;
Sound logistics and infrastructure;
Diverse community and industry base;
Abundant natural and cultural resources;
Determined native title in much of the Shire and over all key town areas; and
Strong global markets in agriculture and tourism product that match out unrealised
potential for employment and economic growth.
A major focus of the Broome Growth Plan is economic growth that creates jobs. The current
‘trend’ economy cannot deliver enough jobs or the right jobs to enable full employment. The
34Unlocking the Door Consultation Project – Real Estate, Property Development and Construction Sector Workshop Report
aspirational population target of 39,348 residents by 2026 requires the creation of 19,670 new
jobs. This is illustrated in Figure 33 below.
F IGURE 33 – NEW J OB C REATION REQUIRED TO SUPPORT A SPIRATIONAL P OPULATION TARGET
The Broome Growth Plan’s strategy for driving this growth revolves around the activation of
opportunity in agriculture, tourism and Aboriginal participation in the mainstream economy.
Of these activation targets, the fact that over 40 percent of the population of the Kimberley
are Aboriginal people and that significant areas of land are the subject of determination
(including large areas of land in and around Broome) or claims under the Native Title Act,
means that advancing the economic prosperity of Aboriginal people in the region will likely
have the largest impact of all the activation targets.
To achieve the population, employment and GRP targets of the Growth Plan, the population
of Broome must grow at 4 percent per annum, new jobs at 5 percent per annum and GRP at
7 percent per annum. This is illustrated in Figure 34 below.
35Unlocking the Door Consultation Project – Real Estate, Property Development and Construction Sector Workshop Report
F IGURE 34 – BROOME GROWTH P LAN A SPIRATIONAL TARGET
The main function of the Broome Growth Plan is to achieve the alignment of regional
development strategies and private sector investment with the community endorsed direction
of development. In doing this activity will focus on four key areas:
Building Small Enterprise – small to medium enterprise and start-ups are the drivers of
investment, diversity and innovation;
Connecting to the Enablers – health, education, environmental, cultural, training and
employment enhancers and enablers capture the local benefit and support the
community;
Infrastructure – clearly understanding the requirements of industry to help manage the
long lead of critical infrastructure; and
Government and policy – disciplined approaches to common problems and shared
challenges to support long-lived growth.
Initiatives and activation strategies that are making early progress are:
Activating the Dampier Peninsula – an entire tourism sub-region on Broome’s doorstep
to drive a support tourism growth with careful and foresighted investment;
Activating the Traded Economy – providing the linkages and opportunities for private
sector investment and trade, especially import and export;
Activating the Precincts of Broome – supporting and developing the precincts that
support tourism and community activity and function;
Activating the Economic Fundamentals – Broome’s broad and diverse economy
supports and sustains the above trend growth of other sectors;
Activating Broome’s Human Capital – Local capacity drives and captures the
maximum local benefit from growth and development.
36Unlocking the Door Consultation Project – Real Estate, Property Development and Construction Sector Workshop Report
Table 4 below lists some specific projects that have either attracted investment, or are at
advanced stages of planning.
Project Investment
China Town Revitalisation $12.6 million
North West Aboriginal Housing $200 million
Kimberley Schools $25 million
Aboriginal Short Stay Hostel $26 million
Broome Wharf Extension of Life $25 million
Broome Hospital Upgrade $14 million
West Kimberley Transition Housing $33 million
Broome North Industrial Estate
Kimberley Meats Abattoir
Roebuck Plains Irrigated Agriculture
Yawuru Shared Equity Housing
Broome Urban Renewal
Cape Leveque Activation
Precincts
Schools
TABLE 4 – A DVANCED P ROJECTS
This presentation also presented some additional information pertaining to the status of the
real-estate and rental markets in the Kimberley Region. Table 5 below compares the current
average days that a house is on the market in major Kimberley population centres with Perth
and a selection of other regional centres in Western Australia.
37Unlocking the Door Consultation Project – Real Estate, Property Development and Construction Sector Workshop Report
Town Average Days on the
Market
Broome 70
Derby 77
Kununurra 123
Karratha 81
Margaret River 135
Perth 75
TABLE 5 – A VERAGE DAYS ON THE MARKET
Table 6 below summarises the current median house price in major Kimberley towns according
to house type.
Town 1 Bedroom 2 Bedroom 3 Bedroom 4 Bedroom 5+ Bedroom
Broome $250,000 $340,000 $499,000 $600,000 $1,025,000
Derby $129,500 $259,000 $350,000 $475,000 $575,000
Kununurra $559,500 $350,000 $344,500 $449,500 $875,000
TABLE 6 – MEDIAN H OUSE P RICE
Figure 35Table 7 below summarises the recent trend in real-estate markets in Broome, Derby
and Kununurra.
38Unlocking the Door Consultation Project – Real Estate, Property Development and Construction Sector Workshop Report
$800,000 250
$700,000
200
Number of Houses for Sale
$600,000
Asking Prices
$500,000
150
$400,000
100
$300,000
$200,000
50
$100,000
$- 0
2013 2014 2015 2016 2017
Broome Number for Sale, RHS Derby Number for Sale, RHS
Kununurra Number for Sale, RHS Broome Asking Price, LHS
Derby Asking Price, LHS Kununurra Asking Price, LHS
F IGURE 35 – RECENT REAL E STATE MARKET TRENDS – BROOME , DERBY AND KUNUNURRA
Figure 36 below illustrates the recent trend in the rental market in Broome, Derby and
Kununurra.
$900 180
$800 160
Rental Properties Available
$700 140
$600 120
Rental Price
$500 100
$400 80
$300 60
$200 40
$100 20
$- 0
2013 2014 2015 2016 2017
Broome Rental Availability, RHS Derby Rental Availability, RHS
Kununurra Rental Availability, RHS Broome Rental Price, LHS
Derby Rental Price, LHS Kununurra Rental Price, LHS
F IGURE 36 – RECENT RENTAL M ARKET TRENDS – BROOME , D ERBY AND K UNUNURRA
39Unlocking the Door Consultation Project – Real Estate, Property Development and Construction Sector Workshop Report
2.3. Nyamba Buru Yawuru
Chris Forbes, Manager – Economic Development with Nyamba Buru Yawuru (NBY) delivered
a presentation outlining NBY’s property development portfolio and aspirations.
By virtue of the global agreement on Native Title settlement and Indigenous Land Use
Agreement (ILUA) between the Yawuru Traditional Owners, the State of Western Australia and
the Shire of Broome, NBY is the single largest land-holder in Broome.
The vision of NBY is ‘to create and grow Yawuru assets and investments to ensure the Yawuru
community has sustainable sources of income for future generations.’ In achieving this, NBY
supports heritage and language so culture is maintained, builds on its economic assets for
strong economic growth, and manages country so that cultural connections are maintained
and the environment is preserved.
This vision and purpose governs decisions made with respect to NBY’s land holdings. The NBY
board is governed by a board of six directors, including two independent directors. The Yawuru
Prescribed Body Corporate Board, to which NBY is ultimately accountable has 12 directors,
including six Lore Bosses and ensures that land manage decisions are aligned with NBY’s vision
and purpose.
The NBY property portfolio includes:
Over 130 hectares of industrial development land;
Over 168 hectares of residential development land, with 45 housing lots;
Over 275,000 hectares of agricultural and grazing land;
Over 8.5 hectares of commercial/town centre land;
Over 830 hectares of rural development land; and
A portfolio of natural and cultural assets for tourism development.
A major focus in developing this portfolio is creating economic opportunity and empowerment
of Aboriginal people. Not only is this fundamental to NBY’s vision and purpose, but transforming
Aboriginal people to an average level of economic wealth will create demand and build
value into NBY’s property portfolio.
The portfolio is comprised of properties that have been transferred to NBY and properties that
have not as yet been transferred from the ILUSA or the Rubibi Settlement as a result of a dispute
as to the local government ratings that will apply to those properties. The various properties
that comprise the NBY portfolio are listed in Table 7 below and described in more detail in
Appendix 2. While the portfolio includes significant in-town properties, a reasonable portion of
the portfolio is located in rural areas without services and is therefore dependent on Regional
growth for value creation.
40Unlocking the Door Consultation Project – Real Estate, Property Development and Construction Sector Workshop Report
Properties currently under NBY Lot 2082 Cable Beach Road East
ownership and management Lots 100 & 484 Chapple Street
Lot 586 Broome Road
Part Lot 587 Crab Creek Road
12 Bernard Way
Birragun Buru Residential Subdivision
Lots 71 & 72 Frederick Street
Lot 3144 Clementson Street
Properties yet to be transferred under Lot 300 Port Drive
the ILUA Lot 703 Cable Beach Road
Lots 610 & 620 Fairway Drive
Lots 522 & 526 Fairway Drive
Lots 555 & 557 Crab Creek Road
Lot 502 Cable Beach Road
Lot 604 Cementson Street
Lot 350 Gubinge Road
Lots 400 & 401 Gantheaume Point Road
Lots 2790 & 2791 Cable Beach Road
Lots 611 & 612 Lawrence Road (Coconut Wells)
Properties yet to be transferred under 20 Dickinson Drive (Bran Nu Dae)
the Rubibi settlement 2 & 4 Haas Street, 30, 34, 36 & 45 Carnarvon Street
15 Chapple Street (Morgan’s Camp)
Lot 462 Broome Road (Skuthorpe)
Lot 300 Reid Road
TABLE 7 – NYAMBA BURU YAWURU P ROPERTY PORTFOLIO
2.4. Shire of Broome
Ron Johnston, Shire of Broome President, delivered a brief address supporting the sentiments
of the previous presentations and highlighting the main development focus of the Shire of
Broome.
The Shire of Broome is focused on facilitating the following three key urban renewal and
development projects in the town of Broome:
Town Beach Redevelopment, which will involve a redevelopment and reactivation of
the entire Town Beach Area
China Town Redevelopment, which currently has $12 million allocated, including $2.0
million from the Shire of Broome.
Safe Boat Harbour, which is planned to be located between Redell and Entrance
Point and designed so that it can service cruise-liners with platform technology,
accommodate fishing, Customs and Border Protection and RAN patrol vessels, and
eventually be expanded to a locked marina.
2.5. Workshop Deliberations
Russell Barnett facilitated a workshop discussion exploring opportunities and challenges facing
the real-estate, property development and construction sectors in Broome and the Kimberley
Region.
41You can also read