WP/15/84 Understanding Residential Real Estate in China - by Mali Chivakul, W. Raphael Lam, Xiaoguang Liu, Wojciech Maliszewski, and Alfred Schipke

Page created by Derek Hogan
 
CONTINUE READING
WP/15/84 Understanding Residential Real Estate in China - by Mali Chivakul, W. Raphael Lam, Xiaoguang Liu, Wojciech Maliszewski, and Alfred Schipke
WP/15/84

Understanding Residential Real Estate in China

       by Mali Chivakul, W. Raphael Lam, Xiaoguang Liu,
       Wojciech Maliszewski, and Alfred Schipke
WP/15/84 Understanding Residential Real Estate in China - by Mali Chivakul, W. Raphael Lam, Xiaoguang Liu, Wojciech Maliszewski, and Alfred Schipke
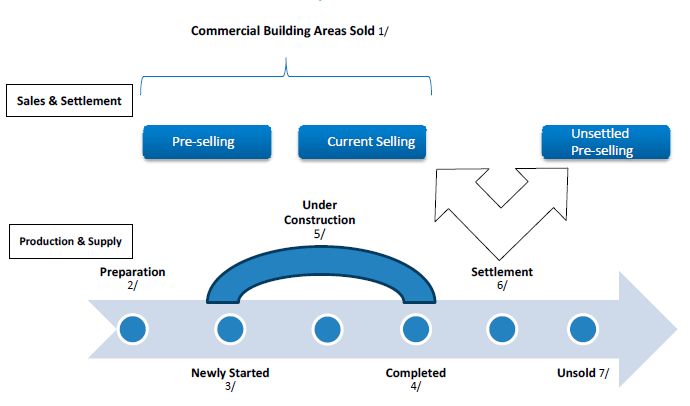
© 2015 International Monetary Fund                                                                   WP/15/84

                                              IMF Working Paper
                            Understanding Residential Real Estate in China
                     Prepared by Mali Chivakul, W. Raphael Lam, Xiaoguang Liu,
                             Wojciech Maliszewski, and Alfred Schipke1

                    Authorized for distribution by Steve Barnett and Alfred Schipke

                                                    April 2015

 This Working Paper should not be reported as representing the views of the IMF.
 The views expressed in this Working Paper are those of the author(s) and do not necessarily
 represent those of the IMF or IMF policy. Working Papers describe research in progress by the
 author(s) and are published to elicit comments and to further debate.

                                                     Abstract

 China’s residential real estate sector plays an important role in the economy and has been a key
driver of growth. Since 2014 the sector has softened visibly, reflecting overbuilding across many
cities. An orderly adjustment of the sector is welcome. The key questions are how severe the
adjustment will be and how long it will last. This paper uses various datasets, an analytical
framework to estimate demand and supply conditions, and develops a number of scenarios to
determine the oversupply both at the national level and by city tiers. It highlights that the adjustment
will be a multiyear process with adverse implications for investment and growth. Smaller cities, as
well as those in the Northeast region, face more challenging demand-supply dynamics. The key
will be to allow the adjustment to take place, while avoiding a too sharp of an economic
slowdown.

 JEL Classification Numbers: C3, E3, R2

 Keywords: China, Real estate, Property, Growth, Investment

 Authors’ E-Mail Address: mchivakul@imf.org; wlam@imf.org; xliu3@imf.org;
 wmaliszewski@imf.org; aschipke@imf.org
 1
  We thank Soufun for excellent data provision and assistance. We are grateful for Rodney Jones and Wigram
 Capital Advisors for their inputs on data classification and the construction of indicies based on FangGuanJu data.
 We are also grateful for comments from Steven Barnett, Jun Ma, Peichu Xie, Murtaza Syed, Bin Zhang, Zhongli
 Yin, and seminar participants at the International Monetary Fund, People’s Bank of China, Chinese Academy of
 Social Sciences, and Shanghai Economics and Finance University
2

                                                             Contents                                                                 Page

I. Introduction..............................................................................................................................3

II. Recent Developments: What Are Various Datasets Saying?.....................................................4

III. Demand and Supply Dynamics ..............................................................................................9
     A. Real Estate Demand..........................................................................................................9
     B. Measuring Oversupply ..................................................................................................11

IV. Real Estate Adjustment—A Scenario Analysis ....................................................................12
    A. Scenario Analysis of Gradual Adjustments ......................................................................12
    B. Growth Impact across Scenarios ......................................................................................13
    C. Scenario Analysis and Growth Impact at the Provincial Level..........................................16

V. Conclusion ..........................................................................................................................16

References ................................................................................................................................23

Figures
1. Property Prices are Moderating .............................................................................................5
2. Residential Real Estate Sales Have Slowed...........................................................................6
3. Real Estate: A Buildup of Inventory ......................................................................................8
4. Baseline Scenario Analysis on Real Estate Adjustment ......................................................15

Tables
1. Regression Estimates of Residential Real Estate Demand ..................................................11
2. Regression of Real Estate Investment .....................................................................................14
3. Impact on Real Estate GFCF and Economic Growth ..........................................................14

Annex
Background on China’s Residential Real Estate Statistics ......................................................18
3

                                                                                 I. INTRODUCTION

Real estate has been a key engine of China’s rapid growth in the past decade. Real estate
investment grew rapidly from about 4 percent of GDP in 1997 to 15 percent of GDP in 2014.2
Residential investment, in particular, has been high compared with that in other countries. Today,
it accounts for both about 15 percent of fixed asset investment and 15 percent of total urban
employment. Bank lending to the sector accounts 20 percent of total loans. Real estate has strong
linkages to several upstream and downstream industries (Liang, Gao, and He, 2006) and sales are
also a key source of local public finance. Properties are extensively used as collateral for corporate
borrowing.

        Real Estate Investment                                                                            Peak Residential Construction Investment
        (In percent of GDP)                                                                               (Percent of GDP)
16
                     Real estate investment                                                               12.5
                                                                                                   12
                     Residential real estate investment                                                                   10.4
                                                                                                                                          9.9
12                                                                                                                                                          9.2
                                                                                                                                                                            8.7 8.4 8.3
                                                                                                                                                                                                                          7.8 7.5 7.5
                                                                                                    8                                                                                                                                 7.2 6.9
                                                                                                                                                                                                                                              6.6 6.5 6.5

    8                                                                                                                                                                                                                                                                                                                                                                4.2 3.9
                                                                                                    4
                                                                                                                                                                                                                                                                                                                                                                                                                         2.5

    4                                                                                               0

                                                                                                                                                                                                                                                                                                                                                                     Taiwan (1980)
                                                                                                                                                                                                                                                            Italy (1981)

                                                                                                                                                                                                                                                                                                                                                                                                   South Africa (1971)
                                                                                                           Spain (2006)

                                                                                                                          China* (2013)

                                                                                                                                          Thailand (1991)

                                                                                                                                                            Cyprus (2008)

                                                                                                                                                                            Japan (1973)

                                                                                                                                                                                           Korea (1991)

                                                                                                                                                                                                          France (1980)

                                                                                                                                                                                                                          Germany (1994)

                                                                                                                                                                                                                                           Finland (1990)

                                                                                                                                                                                                                                                                                           Iceland (2007)

                                                                                                                                                                                                                                                                                                            Denmark (2006)
                                                                                                                                                                                                                                                                           Mexico (2008)

                                                                                                                                                                                                                                                                                                                             United States (2005)

                                                                                                                                                                                                                                                                                                                                                    Belgium (1980)

                                                                                                                                                                                                                                                                                                                                                                                                                         India (2000)
                                                                                                                                                                                                                                                                                                                                                                               Province of China
    0
                                                                                                        *Residential real estate investment for China.
        1996       1998       2000       2002        2004   2006   2008   2010   2012   2014            Sources: CEIC; Haver Analytics; and IMF staff calculations.
        Sources: CEIC; and IMF staff calculations.

Real estate activity has softened starting in 2014. Available data suggest a nationwide slowdown
in residential price growth, a contraction in transactions and new starts, and falling investment.
While the previous downturn in 2012 was policy driven in response to concerns about overheating
prices, the current weakness has been without any direct tightening of property market policies.

Distortions make the property market in China susceptible to both price misalignment and
overbuilding. On the supply side, the market is distorted by local governments’ reliance on land
sales to finance spending.3 On the demand side, the market is prone to misalignment—housing is
attractive as a financial investment instrument given a history of robust capital gains, real deposit
interest rates that tended to be negative, a lack of alternative financial assets, as well as capital
account restrictions.4

This paper addresses important questions about the ongoing adjustments in the residential real
estate sector in China. First, it navigates through China’s numerous real estate datasets, from both
official and private sources, to understand the current situation from demand and supply

2
  Real estate investment here is based on real estate investment published by the National Bureau of Statistics. See the
annex for a description. Authors’ estimates of real estate gross fixed capital formation (GFCF) are also described in the
annex. Hung, Wu, and Du (2008) also estimate that the growth contribution of real estate investment is more than
10 percent.
3
  See Yang (2010), Zheng and Shi (2011), Wu, Gyourko, and Deng (2012), Lv and Liu (2012), and Li, Hong, and
Huang (2013).
4
  See Jiang (2005), Kuang (2010), Gao, Wang, and Li (2013).
4

perspectives. The use of different datasets helps shed light on developments in prices, transactions,
and starts at the national level as well as across city tiers and geographic areas. Most important, the
paper investigates the fundamental determinants of residential real estate demand and supply and
gauges the plausible size and duration of future adjustments. The paper proceeds as follows: The
next section briefly explains the datasets and gives an overview of recent developments. Section
III then investigates residential real estate demand and supply. The econometric results from
Section III are used in Section IV to gauge plausible future scenarios of the adjustment. Section V
concludes.

                 II. RECENT DEVELOPMENTS: WHAT ARE VARIOUS DATASETS SAYING?

A number of residential real estate datasets are available in China, from both official sources and
private data providers.5 The two main official sources—the National Bureau of Statistics (NBS)
and the local housing bureaus (FangGuanJu)—collect data on prices (commodity building
average selling prices and 70 large and medium-sized price index by NBS; and price indices for
134 cities by FangGuanJu), demand indicators           Residential Real Estate: Price, Floor Space Sold and Unsold
                                                       (In percent, YOY, SA)
(floor space sold), and inventory (floor space        100                                                                                     250
                                                                   Price
unsold). The NBS also publishes residential real        80         Floor  Space Unsold                                                        200
                                                                   Floor Space Sold (Right)
estate fixed asset investment and supply                60                                                                                    150

indicators (floor space starts, floor space under       40                                                                                    100

construction, and floor space completed). The           20                                                                                    50

National Development Research Center (NDRC)              0                                                                                    0

publishes residential real estate price indices       -20                                                                                     -50

                                                      -40                                                                                     -100
(a price index for each of 36 main cities). In
                                                                                             Jan-07
                                                                                             Apr-07
                                                                                              Jul-07

                                                                                             Jan-08
                                                                                             Apr-08
                                                                                              Jul-08

                                                                                             Jan-09
                                                                                             Apr-09
                                                                                              Jul-09

                                                                                             Jan-10
                                                                                             Apr-10
                                                                                              Jul-10

                                                                                             Jan-11
                                                                                             Apr-11
                                                                                              Jul-11

                                                                                             Jan-12
                                                                                             Apr-12
                                                                                              Jul-12

                                                                                             Jan-13
                                                                                             Apr-13
                                                                                              Jul-13

                                                                                             Jan-14
                                                                                             Apr-14
                                                                                              Jul-14
                                                                                             Oct-07

                                                                                             Oct-08

                                                                                             Oct-09

                                                                                             Oct-10

                                                                                             Oct-11

                                                                                             Oct-12

                                                                                             Oct-13

                                                                                             Oct-14
addition, private entities such as SouFun also
                                                           Sources: Local Housing Administrative Bureau (Fangguanju), IMF staff calculations.
compile proprietary real estate indicators on
prices (price indices for 100 cities).                  House Price-to-income Ratio
                                                                                  (100 square meters' house price of annual disposable income per capita)
                                                                             60

While national level data could sketch an                                    50

overall trend, city-level dynamics are key to
                                                                                                                                                                                                                                                                                                                                                                     2013

                                                                                                                                                                                                                                                                                                                                                                     2010
                                                                             40

understanding the conditions in a large country                                                                                                                                                                                                                                                                                                                      2004

like China. In China, the four largest cities
                                                                             30

(known as Tier I cities) only account for                                    20

10 percent of floor space sold. 6 Tier II cities,                            10

usually provincial capitals, account for nearly                              0
                                                                                             Tianjin

                                                                                                                                                                                                                                                                                               Hainan
                                                                                                                                                                                                                            Jiangxi

                                                                                                                                                                                                                                                 Henan
                                                                                                                                                    Jilin
                                                                                                                                                            Heilongjiang

                                                                                                                                                                                      Jiangsu
                                                                                                                                                                                                Zhejiang

                                                                                                                                                                                                                                                                 Hunan

                                                                                                                                                                                                                                                                                                                    Sichuan

                                                                                                                                                                                                                                                                                                                                                                   Gansu
                                                                                                                                                                                                                                                                                                                                                 Tibet
                                                                                   Beijing

                                                                                                       Hebei

                                                                                                                                                                                                                   Fujian

                                                                                                                                                                                                                                                                                                                                                         Shaanxi

                                                                                                                                                                                                                                                                                                                                                                           Qinghai

                                                                                                                                                                                                                                                                                                                                                                                               Xinjiang
                                                                                                                                                                                                                                                                                                                                                                                     Ningxia

                                                                                                                                                                                                                                                                                                                                                                                                          Nationawide
                                                                                                               Shanxi

                                                                                                                                                                                                                                                         Hubei

                                                                                                                                                                                                                                                                                     Guangxi

                                                                                                                                                                                                                                                                                                                              Guizhou
                                                                                                                                         Liaoning

                                                                                                                                                                           Shanghai

                                                                                                                                                                                                                                                                         Guangdong

                                                                                                                                                                                                                                                                                                                                        Yunnan
                                                                                                                        Inner Mongolia

                                                                                                                                                                                                                                                                                                        Chongqing
                                                                                                                                                                                                           Anhui

                                                                                                                                                                                                                                      Shandong

50 percent, and smaller cities (Tier III/IV)
account for more than 40 percent of the floor                                     Sources: NBS, IMF staff calculations.

5
 See detailed data source descriptions in the annex.
6
 Chinese cities are generally grouped into four categories: Tier I cities include Beijing, Shanghai, Guangzhou, and
Shenzhen; Tier II cities include Beihai, Changchun, Changsha, Chengdu, Chongqing, Dalian, Fuzhou, Guiyang,
Haikou, Hangzhou, Harbin, Hefei, Huhhot, Jinan, Kunming, Lanzhou, Nanchang, Nanjing, Nanning, Ningbo,
Qingdao, Sanya, Shenyang, Shijiazhuang, Suzhou, Taiyuan, Tianjin, Urumqi, Wenzhou, Wuhan, Wuxi, Xiamen,
Xi'an, Yinchuan, and Zhengzhou; other small and medium cities are grouped into Tier III or IV cities.
5

space sold in 2013.7 While the NBS provides national and provincial level data, there are
advantages to using FangGuanJu data given that they are available at the city level, thus providing
additional coverage, helping to depict differences, and serving as a cross check among city tiers
and regions.

Based on all price indices in 2014, including the most widely used NBS and SouFun data,
property prices have been moderating. The NBS 70-cities index (Figure 1) shows the most severe
decline. Prices have been moderating at both the national level and across all city tiers. On
average, Tier II and Tier III/IV cities have performed the weakest, with prices in the latter group
falling on a sequential basis. Across geographical areas, the industrial Northeast and the Coast are
experiencing the weakest price development. More recently, prices in large metropolitan areas
have also been weak. Prices in some datasets, such as the NBS average selling price and
FangGuanJu, have seen some signs of stabilization on a sequential basis since November 2014.
Average nationwide house price has remained high at about 22 times average annual disposable
income in 2013 (with Tier I cities reaching a multiple of more than 30), though the ratio has
declined from its peak in 2010.

                                                        Figure 1. Property Prices are Moderating
     China Residential House Price                                                                         China Residential House Price Index
     (yoy, in percent, 3mma)                                                                               (Jan-2012=100, 3mma)
      40                                                                                         40        130                                                                                        130
                                                                         NDRC: 36 cities
                                                                         NBS: selling price                             NDRC: 36 cities
     30                                                                  NBS: 70 cities          30                     NBS: selling price
                                                                         Fangguanju                                     NBS: 70 cities
                                                                                                           105                                                                                        105
                                                                         CREIS: 100 Cities                              Fangguanju
     20                                                                                          20
                                                                                                                        CREIS: 100 Cities

     10                                                                                          10         80                                                                                        80

      0                                                                                          0
                                                                                                            55                                                                                        55
    -10                                                                                          -10

    -20                                                                                          -20        30                                                                                        30
          2007     2008       2009      2010      2011        2012      2013      2014                           2006     2007    2008       2009   2010     2011     2012      2013     2014
     Sources: CEIC; Local Housing Administrative Bureau (Fangguanju); and IMF staff calculations.          Sources: CEIC; Local Housing Administrative Bureau (Fangguanju); and IMF staff calculations.

      Fangguanju: Residential Real Estate Price Index by Tier                                              Fangguanju: Residential Real Estate Price Index by Area
      (Jan-2006=100, SA)
                     SA, 3mma)                                                                             (Jan-2006=100, SA)
     400                                                                                        400        400                                                                                       400
                  Tier I                                                                                                    Industrial Northeast
                  Tier II
                                                                                                                            Coastal
                  Tier III or IV
                                                                                                           300              Metropolitan                                                             300
     300                                                                                        300
                                                                                                                            Less Developed

     200                                                                                        200        200                                                                                       200

                                                                                                           100                                                                                       100
     100                                                                                        100
                                                                                                                 2006     2007    2008       2009   2010    2011      2012     2013     2014
           2006   2007      2008     2009      2010    2011     2012     2013     2014
      Sources: Local Housing Administrative Bureau (Fangguanju), Wigram Capital Advisors, IMF              Sources: Local Housing Administrative Bureau (Fangguanju), Wigram Capital Advisors, IMF
      staff calculations.                                                                                  staff calculations.

7
    Based on FangGuanJu data, which contain all Tier I cities, most Tier II cities, but only 50 to 60 Tier III/IV cities.
6

Both NBS data and local housing bureau data show a decline in sales volume in 2014 (Figure 2).
Floor space sold, a good indicator of demand for residential real estate, has declined on a
year-over-year basis since mid-2013. Data on floor space sold are available from NBS and
FangGuanJu. Transaction activity has weakened across the board, including in Tier I cities and in
more well-off regions. Toward the end of 2014, sales volume picked up slightly on a sequential
basis, following the relaxation of home purchase restrictions and the easing of mortgage financing
conditions, though to what extent the recovery is more “one off” a unique event or more sustained
remains uncertain.

Sales volume contracted most in smaller cities. These Tier III/IV cities had experienced more
rapid increases of floor space sold during the boom period. The industrial Northeast region
continues to face a sharp contraction in floor space sold and still has not seen any sign of the
recovery that began to emerge in other regions (Figure 2).

                                       Figure 2. Residential Real Estate Sales Have Slowed
 Residential Real Estate Transactions: Floor Space Sold                                          Residential Real Estate Transactions: Floor Space Sold
 (In percent, yoy, 3mma, SA)                                                                     (Jan-2006=100, SA, 3mma)
 140                                                                                   140       250                                                                                      250
 120          Fangguanju                                                               120                    NBS
 100          NBS                                                                      100                    Fangguanju
                                                                                                 200                                                                                      200
  80                                                                                   80
  60                                                                                   60
  40                                                                                   40        150                                                                                      150
  20                                                                                   20
   0                                                                                   0
                                                                                                 100                                                                                      100
 -20                                                                                   -20
 -40                                                                                   -40
 -60                                                                                   -60        50                                                                                      50
    2007      2008       2009      2010    2011     2012      2013     2014                            2006    2007     2008    2009      2010    2011     2012         2013   2014
   Sources: Local Housing Administrative Bureau (Fangguanju), NBS, Wigram Capital                  Sources: Local Housing Administrative Bureau (Fangguanju), NBS, Wigram Capital
   Advisors, IMF staff calculations.                                                               Advisors, and IMF staff calculations.

 Fangguanju Residential Bldg: Floor Space Sold by Area                                           Fangguanju Residential Bldg: Floor Space Sold by Tier
 (Jan-2006=100, SA, 3mma)                                                                         (Jan-2006=100, SA, 3mma)
 300                                                                                   300       250                                                                                      700
              Industrial Northeast
                                                                                                              Tier I (LHS)     Tier II (LHS)     Tier III or IV (RHS)
              Coastal                                                                                                                                                                     600
              Metropolitan                                                                       200
              Less Developed                                                                                                                                                              500
 200                                                                                   200
                                                                                                 150
                                                                                                                                                                                          400

                                                                                                                                                                                          300
                                                                                                 100
 100                                                                                   100                                                                                                200
                                                                                                  50
                                                                                                                                                                                          100

   0                                                                                   0           0                                                                                      0
       2006   2007     2008     2009     2010     2011     2012     2013     2014                      2006   2007     2008     2009     2010     2011      2012        2013   2014
 Sources: Local Housing Administrative Bureau (Fangguanju), Wigram Capital Advisors,             Sources: Local Housing Administrative Bureau (Fangguanju), Wigram Capital Advisors IMF
 and IMF staff calculations.                                                                     staff calculations.

Supply-side indicators also suggest that market conditions are weak. There is a close relationship
between floor space sold, floor space starts, and residential real estate fixed investment (see text
chart). According to NBS data, real estate fixed asset investment has slowed from growth of about
20 percent in 2013 to 9.2 percent in 2014. In addition, housing floor space starts contracted by
14.4 percent in 2014, compared with 11.6 percent growth in 2013. Land sales revenues, another
real estate market indicator, also showed a slowdown for 2014 (accounting for 6½ percent of
GDP), after reaching a peak in late 2013.
7

     Residential Real Estate Sector                                                           Government Land Sales Revenues
     (in percent, yoy)                                                                        (year-one-year percentage change)
    60                                                                                        60
    50
                                                                                              50
    40

    30                                                                                        40

    20
                                                                                              30
    10
                                                                                              20
     0
                         Residential real estate investment
    -10                                                                                       10
                         Residential floor space starts
    -20
                         Residential floor space sold                                         0
    -30

                                                                                                        Jan-13

                                                                                                                                              Oct-13

                                                                                                                                                              Jan-14
                                                                                                                     Apr-13

                                                                                                                                Jul-13

                                                                                                                                                                       Apr-14

                                                                                                                                                                                   Jul-14
          1996   1998      2000    2002     2004    2006      2008   2010   2012   2014
                                                                                              Source: CEIC.
     Sources: NBS.

Housing inventory indicators from the NBS and FangGuanJu show a buildup of inventory in
2014, the sizes of the inventory in the two datasets are significantly different (Figure 3). Inventory
can be measured by the ratio of floor space unsold to floor space sold during the period. Both NBS
and FangGuanJu data showed a rapid buildup of inventory since 2013. According to NBS data,
the nationwide inventory ratio is only about four months of sales, while FangGuanJu data suggest
that the nationwide ratio might have been as high as 24 months in mid-2014. The differences may
be attributable to different data collection methodologies. The NBS data rely on developers’
self-reporting and are likely subject to underreporting of unsold units and overreporting of sales;
FangGuanJu data record all real estate registrations including buildings that have obtained permits
to sell.8

 These inventory indicators point to a risk that construction has run ahead of demand in some
regions. Overbuilding appears to be widespread across cities, though to varying degrees, leaving
the adjustment challenging. Some cities have also experienced a rapid rise in the inventory ratio
due to a sharp contraction in sales since the beginning of 2014.

The ratcheting up of unsold residential housing                                                            Real Estate Inventory Development Across Cycles
units in 2014 also appears to be more severe than                                              230
                                                                                                           (Build-up of inventory (unsold floor space), index with Jan2007=100)
                                                                                                                                                                       Peak inventory
in previous downturns. Based on previous                                                       210
                                                                                                                                                                            (206)

episodes of real estate downturns, such as those                                               190

during 2008–09 and 2011–12, the real estate                                                    170
                                                                                               150
                                                                                                            Peak inventory
                                                                                                                                         Peak inventory
                                                                                                                                               (145)
                                                                                                                (135)
downturn in 2014 appears to have started from a                                                130                                                                        Trough inventory
                                                                                                                                                                           (140)
relatively high inventory level (text chart).                                                  110

Housing inventories did not normalize before                                                       90
                                                                                                             Trough                       Trough inventory
                                                                                                   70        inventory (84)
ratcheting up again during 2014, particularly in                                                   50
                                                                                                                                                (84)

Tier III/IV cites and in the industrial Northeast                                                                  2008-09 Cycle
                                                                                                                    (15 months)
                                                                                                                                                       2011-12 Cycle
                                                                                                                                                        (23 months)
                                                                                                                                                                                2013-14 Cycle
                                                                                                                                                                                 (11 months)

region, adding to an even higher buildup of                                                        Sources: FangGuanJu; and IMF staff calculations.

inventory.

8
  FangGuanJu data in general are better indicators but have some shortcomings as well. Developers need to
register first at FangGuanJu for property sale. Developers may have incentives to arrange registrations to
suggest higher sales to boost property price.
8

                                                         Figure 3. Real Estate: A Buildup of Inventory
    Residential Real Estate Inventory: A Lower Bound Estimation                                                     Residential Real Estate Inventory Ratio
    (In millions of square meters)                                                                                  (In months, 3mma)
      1000                                                                                                           40                                                                                                5.0
       900                                                                                                                            Fangguanju (LHS)
                          Tier I                                                                                     35                                                                                                4.5
       800                Tier II                                                                                                     NBS (RHS)                                                                        4.0
                          Tier III                                                                                   30
       700                                                                                                                                                                                                             3.5
                          All
       600                                                                                                           25                                                                                                3.0
       500                                                                                                           20                                                                                                2.5
       400                                                                                                                                                                                                             2.0
                                                                                                                     15
       300                                                                                                                                                                                                             1.5
       200                                                                                                           10
                                                                                                                                                                                                                       1.0
       100                                                                                                               5                                                                                             0.5
          0
                                                                                                                         0                                                                                             0.0
                2007        2008      2009    2010     2011       2012     2013                                              2007     2008      2009       2010      2011       2012       2013        2014
    Sources: Local Housing Administrative Bureau (FangGuanJu), Wigram Capital
                                                                                                                    Sources: CEIC; Local Housing Administrative Bureau (Fangguanju); and IMF staff calculations.
    Advisors, IMF staff calculations.                                                                               1/ Inventory is measured as floor space unsold; inventory ratio is measured as floor space unsold/sold.

      Residential Real Estate Inventory Ratio by Tiers                                                             Residential Real Estate Inventory Ratio by Areas
      (In years)                                                                                                   (In years)
       3.0                                                                                              3.0        5.0                                                                                                 5.0
                    Tier I                                                                                         4.5              Coastal                                                                            4.5
       2.5          Tier II                                                                             2.5        4.0              Metropolitan                                                                       4.0
                    Tier III or IV                                                                                 3.5              Less Developed                                                                     3.5
       2.0          All                                                                                 2.0        3.0                                                                                                 3.0
                                                                                                                                    Industrial Northeast
                                                                                                                   2.5                                                                                                 2.5
       1.5                                                                                              1.5
                                                                                                                   2.0                                                                                                 2.0
                                                                                                                   1.5                                                                                                 1.5
       1.0                                                                                              1.0
                                                                                                                   1.0                                                                                                 1.0
       0.5                                                                                              0.5        0.5                                                                                                 0.5
                                                                                                                   0.0                                                                                                 0.0
       0.0                                                                                              0.0                    2006      2007      2008      2009        2010       2011        2012       2013
               2006          2007    2008        2009       2010       2011       2012       2013                   Sources: Local Housing Administrative Bureau (Fangguanju), Wigram Capital Advisors, IMF staff
      Sources: Local Housing Administrative Bureau (Fangguanju), Wigram Capital Advisors, IMF staff                 calculations.
      calculations.                                                                                                 1/Inventory is measured as floor space unsold; inventory ratio is measured as floor space
      1/Inventory is measured as floor space unsold; inventory ratio is measured as floor space unsold/sold.        unsold/sold.

In addition to the inventory level, the stock of residential real estate (measured in per capita terms)
may serve as a complementary indicator. Floor space per capita in many cities in China appears to
be well above international averages.9 Floor space per capita rose in 2009 when real estate
investment accelerated as part of the stimulus measures to counter the economic pressures from
the global financial crisis. Floor space per capita continued to rise for Tier III/IV cities but
remained flat for large cities. Floor space now under construction could contribute further to future
oversupply (text charts). International evidence suggests that per capita residential floor space is in
the range of 40‒50 square meters in advanced economies, with a notable exception in the United
States, and between 20 and 30 square meters in emerging economies. For China, Tier I cities are
close to the average levels in advanced economies, while smaller cities already see a much higher
level, suggesting possible signs of oversupply.10

9
  An estimate of the per capita housing stock across cities is constructed using the stock data available from NBS and
the flow of floor space sold from SouFun for the past few years after NBS data were discontinued.
10
   A caveat is in order. The denominator represents the population holding a household residency (hukou), such that the
ratio is likely to be overestimated for larger coastal cities (that attract migrants) and underestimated for the rest (from
which migrants typically originate). Therefore, the actual oversupply in some Tier III and IV cities may be even more
severe than the results suggest.
9

 Residential Real Estate Floor Space per Capita in Major Countries                                                            Residential Real Estate Floor Space Per Capita
 (Sqm/per capita)
   70                                                                                                                         (Sqm/per capita, 2013, prefecturel city level)
                                                                                                                             70

     60                                                                                                                      60                   Current level
                                                                                                                                                  Implied level after absorbing inventory
     50                                                                                                                      50
                                                                                                                                                                                                                                                                                                                                  44.2; 45.0

     40                                                                                                                      40                                                                                    35.1; 37.9

                                                                                                                             30
     30
                                                                                                                                                28.0; 29.1

                                                                                                                             20
     20
                                                                                                                             10
     10
                                                                                                                              0

                                                                                                                                                                                                                                                                                          Nanchang

                                                                                                                                                                                                                                                                                                                                             Dandong

                                                                                                                                                                                                                                                                                                                                                                             Zhoushan
                                                                                                                                                                       Tianjin

                                                                                                                                                                                                                                                                                                                       Yangzhou
                                                                                                                                                                                                                                                                                                                                   Huizhou
                                                                                                                                                Shenzhen
                                                                                                                                      Beijing

                                                                                                                                                                                                                                                            Changsha
                                                                                                                                                                                 Chongqing

                                                                                                                                                                                                                                                                                Qingdao

                                                                                                                                                                                                                                                                                                                                                                                        Datong
                                                                                                                                                                                                                         Suzhou

                                                                                                                                                                                                                                                                       Wuzhou

                                                                                                                                                                                                                                                                                                     Hohhot

                                                                                                                                                                                                                                                                                                                                                       Jingzhou
                                                                                                                                                                                             Nanjing

                                                                                                                                                                                                                                                                                                                                                                  Jiujiang
                                                                                                                                                                                                       Wuhan

                                                                                                                                                                                                                                           Xiamen

                                                                                                                                                                                                                                                                                                              Beihai
                                                                                                                                                           Guangzhou

                                                                                                                                                                                                               Chengdu

                                                                                                                                                                                                                                  Dalian

                                                                                                                                                                                                                                                    Xi'an
     0
               USA       Italy   Holland Germany        UK      France     China     Spain     China     South   Japan
                                                                           2012                2003      Korea
         Sources: CEIC, Individual authorities, National Bureau of Statistics (NBS), IMF staff calculations.                 * Figures refer to tier-average level of floor space per capita, in current and implied level, respectively.
                                                                                                                             Sources: NBS, Fangguanju, IMF staff calculations.

                                                                                      III. DEMAND AND SUPPLY DYNAMICS

Available inventory indicators in section II suggest that oversupply could be a problem. These
indicators offer a snapshot of the stock of unsold properties and the approximate time it would
take to run down the inventory given average annual sales. An analysis of the demand and supply
dynamics will help provide a better understanding of how the oversupply comes about and how
the real estate market may get back to an equilibrium level.11 This section first estimates real estate
demand conditions based on fundamentals, then derives an estimate of oversupply. The analysis
begins with data starting from 1998, when China’s housing market began to develop following a
series of reforms that clarified property rights.

                                                                                                          A. Real Estate Demand

On the demand side, the analysis uses the variable floor space per capita to capture the demand
for residential real estate. The estimates start by an equilibrium (long-run) relationship between
floor space per capita and fundamental determinants of demand. International evidence suggests
that floor space per capita usually increases along with income as the economy grows
(Berkelmans and Wang 2012), and the elasticity of floor space per capita to income is of primary
interest. We estimate the following equilibrium relationship:

                                                                                                                                  ,                         ,                    ,                             ,                                                                                                                                                                                 (1)

in which , , , ,                represent household income per capita, residential property prices,
urbanization rate, nonagricultural population scale (population density), and city tier dummy
variables, respectively. The sample period in the regression spans from 2000 to 2013, where a
relatively balanced panel set of data are available during 2005–12. The specification intends to
illustrate the long-run relationship on the housing demand without any policy response. Policy
variables such as mortgage rates and purchases restrictions are not included.12

11
  Grenadier (1996) provides a model framework for analyzing the overbuilding of real estate.
12
  Only national mortgage rates are available without city-level data. We have used it as an explanatory variable
and do not find the coefficient statistically significant in the demand equation.
10

This relationship allows us to project the equilibrium floor space stock, by converting per capita
values to absolute levels using projections for urban population growth:

                                                                                                                     (2)
The convergence to equilibrium is assumed to be gradual and the demolition in floor space is
taken into account.

                                                                         1
                                                    ,                                                                (3)

Regression results for the equilibrium demand for housing are consistent with expectations
(Table 1).13 Floor space per capita is determined by key fundamentals with expected signs,
including per capita household income, residential property prices, urbanization rate,
nonagricultural population in cities (reflecting the urban population density); it varies across city
tiers. A 1 percentage point increase in per capita household income will increase floor space per
capita by 0.2–0.3 percent (estimates are very close across specifications). Higher residential prices,
urbanization rate, and nonagricultural population tend to reduce floor space per capita in cities,
while the elasticity of residential prices is not as large as generally expected. This is in line with
previous research that analyzes the key determinants of housing demand (Shen and Liu, 2004;
Zou and Niu 2010; Gao, Wang, and Li, 2013).14 In addition, the city-tier dummy variable also
confirms the results that Tier III/IV cities tend to have more floor space per capita, mainly because
land is more abundant in smaller cities than in metropolitan areas.15

Given the relatively strong fit of the first regression specification, the analysis projects equilibrium
floor space per capita by linking it to per capita urban household income, which is assumed to
grow at a gradually declining rate (beginning at 9.7 percent in 2013 and falling by ½-percentage
point per year, reaching 6.2 percent in 2020). 16 This is largely in line with the growth forecast
for the medium term (IMF, 2014b). The growth rate of nonagricultural population is forecast to be
at levels of five-year moving average, which would imply an increase of urbanization rate by
about 7–8 percentage points from now to 2020, consistent with the government’s urbanization
strategy. Our projection assumes no policy response, such as future changes in mortgage rate and

13
   Data consist of 255 prefecture-level cities with close to 2,000 observations from both Tier I and Tier III/IV cities.
14
   Potential endogeneity may arise given that property prices are included as an explanatory variable, which itself may
be driven by the per capita measure of the housing stock. However, estimates will still be consistent as long as the
regression represents a long-term equilibrium relationship among nonstationary series. We do not formally test for
stationarity and cointegration among the series given short time series and small power of the tests.
15
   Other specifications (not shown in Table 1) include interaction terms of city-tier dummy with residential prices and
urbanization rate. Relative to Tier II cities, smaller cities tend to have a greater negative impact on demand from
higher residential prices, while higher prices tend to increase demand in Tier I cities, largely reflecting an expectation
that future residential prices will increase. The effects of the urbanization rate on housing are less monotonic, but fall
within the expectation that the effects vary across city tiers. Higher urbanization rates tend to depress demand in
smaller cities, while increasing demand in larger ones.
16
   A robustness check was also performed to forecast demand using a regression with the floor space sold indicator as
the dependent variable. Though the indicator is more volatile, the regression based on floor space sold directly
provides a flow measure that is comparable with floor space starts. It is also a general specification. Results are fairly
similar given the common use of explanatory variables such as household income.
11

restrictions on property purchases.17 The adjustment parameter a in equation 3 varies by province,
but is 0.5 at the national level. The demolition rate is assumed to be about 3 percent annually of
the floor space stock.18 Under these assumptions, the average annual growth rate of floor space
sold is about 4.3 percent in the medium term, a continuation of the trend observed in the data.

              Table 1. Regression Estimates of Residential Real Estate Demand 1/
                                                                       Dependent Variable:
                                                                    Log Floor Space Per Capita
         Explanatory Variables                         (1)               (2)                        (3)                        (4)
         Log per capita household
         income                                     0.170***         0.269***                     0.296***                 0.299***
                                                    (0.0236)         (0.0353)                      (0.0409)                (0.0397)
         Log residential property prices                            -0.0794***                   -0.0603***              -0.0568***
                                                                     (0.0191)                      (0.0228)                (0.0213)
         Urbanization rate                                                                        -0.497***               -0.454***
                                                                                                   (0.0393)                (0.0389)
         Log nonagricultural population                                                                                  -0.0417***
                                                                                                                           (0.0115)
         Dummy_tier 1                              -0.109***         -0.0804**                   -0.0768*                  -0.0502
                                                    (0.0289)          (0.0319)                    (0.0428)                 (0.0474)
         Dummy_tier 3                              0.166***           0.136***                   0.0746***                 0.0373*
                                                    (0.0116)          (0.0131)                    (0.0166)                 (0.0201)
         Constant                                  1.366***           1.076***                    0.906***                1.169***
                                                     (0.223)           (0.242)                     (0.268)                  (0.266)
         Year effect                                   Yes               Yes                         Yes                      Yes
         Observations                                 1,800             1,748                       1,175                    1,175
         R squared                                    0.471             0.476                       0.508                    0.516
         1/ Robust standard errors in parentheses; “***”, “**”, and “*” refer to 1 percent, 5 percent, and 10 percent
         statistical significant levels.

             B. Measuring Oversupply

Excess supply, or “oversupply,” is measured by the                           Annual Growth of Residential Investment and
                                                                             Floor Space Started, Completed
cumulative gap between floor space starts and floor                          (yoy, in percent)
                                                                        60
space sold (one to two years ahead). The latter is                      50
                                                                                           Real estate gross fixed capital formation (GFCF)
                                                                                           Floor space started
derived from NBS data for historical values and                         40                 Floor space completed

from floor space sold projections. Floor space                          30

                                                                        20
starts instead of floor space completions is used to
                                                                        10
approximate supply. In part, this is because floor                       0

space completed tended to be much higher before                        -10

2005–06 and floor place starts are usually better                      -20
                                                                             1997   1999     2001     2003       2005   2007   2009     2011   2013
indicators of future supply. The two series are                              Sources: NBS; and IMF staff estimates.

17
   The scenario analysis in the following section provides an illustrative scenario of stronger real estate demand,
which could also be interpreted as more accommodative policies.
18
   The demolition rate is similar to depreciation. The forecast of excess supply is not sensitive to a moderate change in
the assumption. Considering the current housing stock, the demolition pace could decelerate in the future, which will
reduce the upgrading housing demand.
12

closely correlated in levels of floor space in square meters (text chart), but data suggest that floor
space starts are strongly correlated with real estate investment, a variable of ultimate interest.19

 The gap is determined on the basis of floor space sold as the average flow one to two years ahead,
given that it usually takes one to two years after a housing start to have the floor space ready to be
sold. The calculated excess supply in 2014 was about 1.2 times annual floor space sold at the
national level. The interpretation of the gap is straightforward: in equilibrium, developers should
correctly anticipate demand conditions at the time when buildings will be ready for sale. Hence,
the gap should be close to zero. If developers overpredict, housing starts are greater than future
demand (floor space to be sold in one to two years) and the gap is positive.

There are a number of caveats to this measure of oversupply. First, not all floor space starts are
listed for sale because starts include areas designated for communal facilities and infrastructure.
Some developers suggest that this could be up to 15 percent of floor space starts. Second, floor
space starts data likely overstate true supply because the data include projects in the planning
phase or with permits even though not all floor space is built at the same time (developers may
delay or stop the projects).

                     IV. REAL ESTATE ADJUSTMENT—A SCENARIO ANALYSIS

In the face of the current oversupply, it will be important to understand how the adjustment will
take place. The analysis uses several scenarios to illustrate possible adjustment paths.

                            A. Scenario Analysis of Gradual Adjustments

The key assumption is how the excess supply will be eliminated over time. The floor space sold
projections derived above is taken as given, implying a continuation of the historical demand
trend. Floor space starts are assumed to adjust such that excess supply gradually winds down. A
scenario of a stronger demand path is also considered. Various scenarios illustrate how the
overbuilding gap adjusts and its impact on real estate investment (Figure 5):

    Baseline scenario. This scenario assumes that the excess supply gap will close gradually by
     2020, broadly in a linear fashion. Excess supply will be absorbed through both a moderate
     contraction in floor space starts and a recovery of projected real estate demand in the medium
     term. The adjustment scenario yields the path of the year-over-year growth rate of floor space
     starts and floor space sold, providing an indication of real estate investment in the medium
     term, as considered below. We can also trace the effects on the inventory ratio of closing the
     excess supply gap considered in section II (based on FangGuanJu data): it would fall from
     2.2 in 2013 to about 1 (a normal historical level) by 2020.

    Gradual adjustment scenario. This scenario assumes a more gradual reduction in the excess

19
  The cumulative floor space completed was higher than floor space sold before the global financial crisis,
partly reflecting the opening up of residential real estate markets. Discussion with real estate developers suggest
that the measure of floor space completed does not fully reflect supply conditions.
13

    supply gap. Excess supply will be reduced by half from its 2013 level. Under a slower
    adjustment scenario, the inventory ratio adjusts modestly in the medium term and returns to its
    normal level only by 2025. While it may stabilize real estate markets as measured by floor
    space starts (a proxy for real estate investment), the overbuilding may persist.

   Stronger real estate demand scenario. This          Inventory Ratios under Adjustment Scenarios
                                                        (inventory ratio refers to cumulative floor space starts net of sold to the floor space
    could help narrow the excess supply gap             sold; in years)
                                                           2.5
                                                                      Baseline scenario
    marginally, but it is unlikely to fully offset a                  Gradual adjustment scenario

    potential contraction of floor space starts. In          2        Stronger demand scenario
                                                                      Adjustment terminal level
    the scenario of stronger real estate demand,           1.5

    growth in floor space sold would increase to
                                                             1
    8.6 percent (similar to levels during
    2010‒13 when growth was 7.8 percent)                   0.5

    relative to 4.3 percent in the baseline (similar         0
                                                                1996    1999      2002      2005     2008     2011      2014      2017     2020
    to levels during 2010‒12 when growth was
                                                             Sources: NBS, IMF staff calculations.
    4.6 percent). But the closure of the excess
    supply gap is just slightly quicker, while the year-over-year contraction in floor space starts is
    still inevitable.

The projection of floor space sold (a measure of the demand side) is based on regression
coefficients on floor space per capita, with projected household income per capita, residential
property prices, urban population rate, and nonagricultural population share by 2020 (Table 1).
Growth in national per capita urban household income is projected to decline by ½-percentage
points per year, beginning at 9.7 percent in 2013 and reaching 6.2 percent in 2020, largely in line
with the growth forecast for the medium term. Nationwide nonagricultural population is projected
to grow at a level equal to the five-year moving average. These assumptions would suggest that
the average annual growth rate of floor space sold is about 4.3 percent in the medium term, a
continuation of the trend observed in the data.

                                         B. Growth Impact across Scenarios

All scenarios indicate that growth in floor space starts would need to slow and contract in the near
term (Figure 4 and Table 2). Based on data from 2001 to 2013, the relationship between growth in
floor space starts and real estate gross fixed capital formation (GFCF) growth is then estimated
(Table 2). The real estate GFCF series estimated using NBS data (see annex for an explanation) is
used to keep the investment concept compatible with the national account (GDP) data. The growth
of real estate GFCF is estimated with its own lag terms and the growth in floor space starts. Both
coefficients are significant and the growth in floor space starts has the expected signs. The two
coefficients are constrained to sum up to one (which is not statistically rejected). This implies that
on average growth rates of the two series are the same.

                                                                                                                                          (4)
14

                              Table 2. Regression of Real Estate Investment
                     Coefficients          Standard Error         t Stat      P-value       Lower 95%         Upper 95%
                        0.413                   0.068             6.081        0.000            0.270             0.557
                        0.587

Applying the estimated coefficients and the oversupply indicators in various scenarios, real estate
GFCF could slow down by about 1.9–4.2 percentage points in 2015 (Table 3). In the baseline
scenario in which the oversupply gap closes by 2020, the slowdown in real estate GFCF falls by
nearly 4.2 percentage points in 2015. Given that residential real estate GFCF accounts for about
9 percent of GDP, that would imply a drop of GDP growth of about 0.4 percentage points for
2015 (Table 3). The growth impact over the medium term is more difficult to assess and will
depend on the authorities’ policy response. These different scenarios help illustrate possibility
of policy actions or developments not explicitly captured in projections. This abstracts from
the indirect effect arising from real estate linkages to upstream or downstream sectors. Some of
these sectors suffer from an oversupply, and a slowdown in construction activity could bring
losses to the surface, exposing vulnerabilities and posing risks (IMF, 2014a).

                   Table 3. Impact on Real Estate GFCF and Economic Growth
                                                            Duration of                    Floor Space Starts
                 Adjustment Scenario 1/                     Adjustment                  (y/y growth in percent)
                                                            Total years                  2015            2020
      Baseline scenario                                           6.0                   -15.0             11.3
      More gradual adjustment                                    10.0                    -9.6              5.5
      Stronger demand                                             6.0                   -10.9             13.7
                                                        Implied real estate                Impact on GDP
                                                        GFCF growth (%) 2/                   (in ppt) 3/
                                                                 2015                            2015
      Baseline scenario                                           -4.2                           -0.38
      More gradual adjustment                                     -1.9                           -0.18
      Stronger demand                                             -2.5                           -0.22

      Sources: NBS; FangGuanJu; and authors' estimation.
      1/ Average grwoth in floor space sold is projected to be 4.3 percent per year between 2014 and 2020 in the
      baseline and gradual adjustment scenarios. In the stronger demand scenario, the growth increased to 8.6
      percent per year, similar to average growth rates after the global financial crisis.
      2/ The implied real estate GFCF growth is estimated as in Table 2. Growth of real estate GFCG(t)=0.413*Growth
      of floor space starts(t)+0.587*Growth of real estate GFCF(t-1).
      3/ The GDP growth impact is calculated based on the fact that real estate GFCF accounts for about 9 percent of
      GDP.
15

                                              Figure 4. Scenarios Analysis on Real Estate Adjustment
                                                       Baseline Scenario—Excess Supply Gap Closes by 2020
Residential Market Overbuilding and Adjustment Scenario                                                               Annual Growth of Residential Floor Space Newly Started and Sold
(In millions of square meters)                                                                                        (yoy, in percent)
  1,600                                                                                                                  60
                       Excess supply                                                                                                      Floor space started          Floor space sold (2 years lead)
  1,400                                                                                                                  50

  1,200                Floor space started                                                                               40

  1,000                Floor space sold (2 years lead)                                                                   30

    800                                                                                                                  20

    600                                                                                                                  10

    400                                                                                                                   0

    200                                                                                                                 -10

        0                                                                                                               -20

   -200                                                                                                                 -30
            1996       1999       2002        2005        2008       2011        2014       2017          2020                1996        1999     2002     2005       2008     2011      2014    2017     2020
Sources: NBS, IMF staff calculations.
Note: Excess supply ratio is measured as the ratio of excess supply to floor space sold (2 years lead.)                  Sources: NBS, IMF staff calculations.

                                  Gradual Adjustment Scenario—Excess Supply Gap Closes Half by 2020
Residential Market Overbuilding and Adjustment Scenarios                                                              Annual Growth of Residential Floor Space Newly Started and Sold
(In millions of square meters)                                                                                        (yoy, in percent)
  1,600                                                                                                                  60                        Floor space sold (2 years lead)
                      Excess supply (more gradual adjustment)
  1,400               Floor space sold (2 years lead)                                                                    50
                      Floor Space started (baseline adjustment)                                                                                    Floor space started (baseline adjustment)
  1,200               Floor space started (more gradual adjustment)                                                      40

  1,000                                                                                                                  30

    800                                                                                                                  20

    600                                                                                                                  10

    400                                                                                                                   0

    200                                                                                                                 -10

       0                                                                                                                -20

   -200                                                                                                                 -30
            1996      1999        2002        2005       2008        2011       2014        2017          2020                1996        1999     2002     2005       2008     2011      2014    2017     2020
Sources: NBS, IMF staff calculations.
Note: Excess supply ratio is measured as the ratio of excess supply to floor space sold (2 years lead.)                  Sources: NBS, IMF staff calculations.

                                                                                       Stronger Demand Scenario
                                                                                                                       Annual Growth of Residential Floor Space Newly Started and Sold
Residential Market Overbuilding and Adjustment Scenarios                                                               (yoy, in percent)
(In millions of square meters)
                                                                                                                          60
  2,000
                      Excess supply (demand pickup)
  1,800                                                                                                                   50
                      Floor space sold (baseline, 2 years lead)
  1,600               Floor space sold (demand pickup, 2 years lead)                                                      40
                      Floor Space started (baseline adjustment)
  1,400
                      Floor space started (demand pickup)                                                                 30
  1,200
                                                                                                                          20
  1,000
    800                                                                                                                   10

    600                                                                                                                       0
    400                                                                                                                  -10             Floor space sold (baseline, 2 years lead)
    200                                                                                                                                  Floor space sold (demand pickup, 2 years lead)
                                                                                                                         -20             Floor space started (baseline adjustment)
       0                                                                                                                                 Floor space started (demand pickup)
                                                                                                                         -30
   -200
                                                                                                                                  1996      1999     2002       2005    2008     2011      2014     2017    2020
            1996      1999        2002       2005        2008        2011       2014        2017          2020
Sources: NBS, IMF staff calculations.
                                                                                                                           Sources: NBS, IMF staff calculations.
Note: Excess supply ratio is measured as the ratio of excess supply to floor space sold (2 years lead.)
16

                                                                         C. Scenario Analysis and Growth Impact at the Provincial Level

Based on historical data, higher excess supply is usually associated with lower real GDP
growth across provinces (text charts). The transmission channel is likely through a slowdown
in real estate investment, which was a key driver of growth as excess supply built up. Given
sizable overbuilding of residential real estate, growth in new housing starts would need to
slow (or even contract), which reduces real estate investment, and in turn, growth.

                                          Excess Supply and Real GDP Growth by Provinces                                                                                        Impacts on GDP Growth from Overbuilding Adjustment by Provinces
                                          12                                                                                                                                                                                           3
 Real GDP growth in 2014Q4 (YoY %, ytd)

                                                                                                                                                                                 Estimated Impact on GDP growth in 2015 (YoY %, ytd)
                                                     Chongqing
                                                                       Tibet
                                                                                                                                                                                                                                                  Chongqing
                                                                                   Guizhou
                                                                                                                                                                                                                                       2
                                                                               Xinjiang
                                          10               Jiangxi                           Tianjin
                                                                                                        Fujian
                                                                                                                                                                                                                                                 Shanghai
                                                                                                                                                                                                                                                                                  Jiangsu
                                                                         Shaanxi               Hubei

                                                                               Qinghai
                                                                                             Hunan
                                                                                                                  Anhui                                                                                                                1            Sichuan
                                                                                                                                                                                                                                                              Jiangxi
                                                                                                                                                                                                                                                                            Shaanxi

                                                          Guangxi               Gansu                                                  Henan
                                                                                                                   Shandong
                                               Sichuan                         Hainan                   Jiangsu                                                                                                                                                                                Gansu
                                                                                                                                                                                                                                                               Guangdong
                                          8                                 Yunnan
                                                                    Guangdong
                                                                                           Ningxia
                                                                                                                                  Inner Mongolia
                                                                                                                                                                                                                                       0                                        Shandong

                                                                                                                                                   Zhejiang                                                                                                        Guangxi
                                                                                                                                                                                                                                                    Tibet
                                                                                          Beijing                                                                                                                                                                                                                  Heilongjiang
                                                         Shanghai                                                                                                                                                                                                               Yunnan

                                                                                                                          Jilin           Hebei                                                                                        -1                                                    Henan      Xinjiang
                                                                                                                                                                                                                                                                                                                           Beijing              Qinghai
                                                                                                                                                                                                                                                                                 Hunan                  Fujian     Hebei                                  Shanxi
                                          6                                                                                                                   Liaoning                                                                                                                                  Anhui
                                                                                                                                                                                                                                                                                                                                     Zhejiang              Liaoning
                                                                                                       Heilongjiang                                                                                                                                                                                                   Tianjin
                                                                                                                                                                                                                                       -2                                                     Guizhou
                                                                                                                                                                                                                                                                                                Hubei
                                                                                                                                                                                                                                                                                                                                                          Jilin

                                                                                                                          Shanxi                                                                                                                                                                                    Hainan
                                                                                                                                                                                                                                                                                                                                                    Ningxia           Inner Mongolia

                                          4                                                                                                                                                                                            -3
                                          -50,000                0           50,000        100,000       150,000                                                 200,000                                                                    -1      0                   1                2                 3                    4                   5                 6                7
                                                              Excess supply in 2014 (thousands of square meters)                                                                                                                                                                         Inventory ratio in 2014
Sources: NBS, IMF staff calculations.                                                                                                                                                                                 Sources: NBS, IMF staff calculations.

Applying the baseline scenario using provincial excess supply conditions helps illustrate the
overbuilding problem (right text chart). Given the current excess supply gap or high
inventory ratio, most provinces would see a lower new housings starts in 2015–16, before
gradually recovering over the medium term. This would be even more severe and prolonged
in selected provinces because of their high inventory ratios. Even as housing starts recover,
the growth in floor space sold (a demand measure) is likely to slow by about 3½ percentage
points from the average between 2010 and 2013, in the medium term. Fewer new housing
starts would, in turn, slow real estate investment and growth. While nationwide real estate
investment would decline by an average of -4.2 percent on a national level in 2015, a few
provinces could see sharper contractions, weighing heavily on GDP growth. The results,
however, are likely to overstate the growth impact as policy responses are not taken into
account and the adjustment pace of the excess-supply gap is uniformly applied at the same
horizon. In reality, some provinces with higher excess supply are likely to adjust more
gradually.

                                                                                                                                                              V. CONCLUSION

China’s residential real estate market plays an important role in the economy and has been an
important driver of growth. Since 2014, the sector has softened visibly, driven in part by
previous overbuilding across most cities. An orderly adjustment is welcome leading to an
unwinding of the excess supply. It will also free resources that can be used more efficiently
in other parts of the economy, hence facilitating China’s goal of moving toward a new and
sustainable growth model.

On the bases of an analytical framework and the usage of comprehensive real estate datasets,
the paper confirms that the oversupply problem is nationwide and particularly pronounced in
17

smaller cities (Tier III and IV cities) and in the northeast region. Using different adjustment
scenarios, the paper highlights that the adjustment is likely to be a multiyear process with
implications for investment and growth. Under reasonable assumptions, real estate
investment growth in 2015, could, for example, be negative. The key will be to allow the
adjustment to take place, while avoiding a too sharp of an economic slowdown. Hence
macroeconomic policies need to be calibrated carefully.
18

         ANNEX: BACKGROUND ON CHINA’S RESIDENTIAL REAL ESTATE STATISTICS

China produces a wide range of data on the residential real estate sector, both from government
sources—such as the NBS, the National Development Research Center (NDRC), and local
housing bureaus (FangGuanJu)—and private entities such as SouFun that conduct surveys or
collect data themselves.20

                                                 A. Price Data

There are five sources of price data. Among the five datasets, the NBS and SouFun data are the
most widely used in analyzing the real estate markets.

    The NBS: Average Selling Prices (Commodity Building Residential Selling Price) and
     70 cities (Large and Medium-sized) Price Index

    The NDRC’s price index for a smaller set of cities (36 Main Cities Price)

    FangGuanJu’s price indices for 134 cities

    SouFun’s price index (CREIS: 100 Cities Price).

The common house price indices in China are            China Residential House Price
based on observed selling prices, often only for       (yoy, in percent, 3mma)
                                                        40                                                                                                  40
                                                                                                 NDRC: 36 cities
new construction sales (primary market) without                                                  NBS: selling price
                                                        30                                       NBS: 70 cities                                             30
adjusting for property features. Most price datasets                                             Fangguanju
                                                                                                 CREIS: 100 Cities
                                                        20                                                                                                  20
do not cover smaller cities (Tiers III/IV). The
NBS’s Average Selling Price is at the national and      10                                                                                                  10

province level without city information. In some         0                                                                                                  0

indicators, seasonal and other statistical            -10                                                                                                   -10

adjustments are sometimes applied to the raw data
                                                      -20                                                                                                   -20
to smooth out volatility. Because of regional              2007      2008   2009 2010 2011 2012 2013     2014
                                                                 Sources: CEIC; Local Housing Administrative Bureau (Fangguanju); and IMF staff calculations.
differences, developers’ selling strategies, and
expansion of city boundaries, the NBS’s price indices tend to understate the increase in house
prices (Goldman Sachs, 2014).

The FangGuanJu dataset covers 134 cities: four Tier I cities, 36 Tier II cities, and 94 Tier III/IV
cities. It covers four metropolitan cities, 25 cities in the Industrial Northeast area, 43 in coastal
areas, and 62 in less-developed areas. Data from FangGuanJu at the city level are scattered, with
missing data in some months for some cities. Given the data gap, a balanced panel on prices, sales
transactions, and inventory is not directly available. The paper benefited from discussions with
Wigram Capital Advisors on how to address data gaps to construct various indices. It first

20
  The local housing administrative bureaus (Fangguanju) are city-level government agencies in charge of the
real estate market in the city, under the Ministry of Housing and Urban-Rural Development. The bureaus
execute and take charge of the registration of all real estate sales, leases, mortgages, and transfers.
19

calculates the annual and monthly growth rates for prices, sales, floor space sold, and floor space
unsold for cities that have available data and then takes a weighted average (based on city size) to
create a corresponding index. Inventory ratio is based on the ratio of the indices of floor space
unsold to floor space sold. For the annual inventory ratio, the paper adds the floor space unsold
across available cities during the year, then divides it by the sum of annual floor space sold across
cities to reach the average duration (in years). This indicates the time (in years) it would take to
absorb the existing unsold space.

                  B. Volume Data (floor space sold, starts, and completed)

Assessing real estate demand and supply conditions is often hampered by challenging data
issues. China’s NBS provides data on floor space sold, starts, under construction,
completions, and available for sale at a national level on a monthly basis (see below).

a. Floor space sold refers to the total floor area    Fangguanju Residential Bldg: Floor Space Sold
                                                      (In percent, YOY, SA)
   sold for buildings listed in the contract during    250                                                                       250

   any reporting period. It is the area of floor       200          YOY        3M Average of YOY                                 200

   space stated in the formal contract signed by       150                                                                       150

   both parties. It includes both the sale of          100                                                                       100

                                                        50
   currently completed units (not yet sold) as                                                                                   50

                                                        0                                                                        0
   well as presale units offered by real estate
                                                       -50                                                                       -50
   developers. The secondary market between           -100                                                                       -100
   private individuals is not included in NBS
                                                             Jan-07

                                                             Jan-08

                                                             Jan-09

                                                             Jan-10

                                                             Jan-11

                                                             Jan-12

                                                             Jan-13

                                                             Jan-14
                                                              Jul-07
                                                             Oct-07

                                                              Jul-08
                                                             Oct-08

                                                              Jul-09
                                                             Oct-09

                                                              Jul-10
                                                             Oct-10

                                                              Jul-11
                                                             Oct-11

                                                              Jul-12
                                                             Oct-12

                                                              Jul-13
                                                             Oct-13

                                                              Jul-14
                                                             Oct-14
                                                             Apr-07

                                                             Apr-08

                                                             Apr-09

                                                             Apr-10

                                                             Apr-11

                                                             Apr-12

                                                             Apr-13

                                                             Apr-14
   coverage.                                            Sources: Fangguanju, Wigram Capital Advisors, and IMF staff estimates.

b. Commodity (Private) housing sales refers to total sales of commodity housing (that is, private
   housing allowed to be resold in markets) listed in the formal contract signed by both parties
   during the reporting period. Again, it includes both the sale of currently completed (not yet
   sold) units and presale units. The secondary market between private individuals is not
   included in NBS coverage. The NBS released a province-level real estate price index in the
   Yearbook; this index is the ratio of Commodity housing sales to area sold of buildings for
   reselling purpose.

c. Floor space starts indicates residential floor space newly started by real estate development
   enterprises during the reference period. The accounting measure uses all construction floor
   space of a building. To avoid double counting, all housing construction begun in previous
   periods is excluded. Similarly, construction that has previously been started, but restarted
   again because of some postponement or stoppage in earlier periods (for example, obtaining
   financing in the interim) is excluded. The floor space of houses newly started refers to the
   entire floor space of the whole building. Newly started counts from the day the real estate
   developer breaks ground (work undertaken at the foundation site). Clearing the land is not
   sufficient. It must be accompanied by permits, actual construction, and the like.

d. Floor space under construction (or floor space of buildings under construction) refers to the
   total floor space of all residential buildings under construction by real estate enterprises during
20

the reference period. It would imply that the indicator includes (1) “floor space newly started”
(item c above) in current period; (2) floor space of continued construction carried over from
previous periods; (3) floor space restarted for construction for the current period that was
stopped or postponed in the previous period; (4) floor space completed during the current year,
and newly started floor space in current year but postponed.

This indicator is a very broad concept by definition, referring to all buildings that are in the
construction phase during the reference period (regardless of whether construction is
physically taking place). As a result, it includes “floor space completed” at the current period
because that remains under the construction phase at the same period. However, floor space
completed in the current period will not count toward the “floor space under construction”
next period because it will no longer be in the construction phase. The same applies to floor
space “started but postponed” because even if construction activity is stopped, those buildings
are still in the “construction phase.” The NBS recognizes the difficulties in breaking these
statistics down to individual components.

                                 Process of Real Estate Developments

 1/ Commercial building areas sold include both current selling and pre-selling.
 2/ “Preparation” including achieving permits, buying land, clearing the land and other necessary procedure.
 3/ “Newly started” counts from when the day begin ground-breaking gouge (ground treatment or permanent piles).
 4/ “Completed” means reaching design requirements, achieved to living and conditions of use, acceptance of
 accreditation standards or to the final acceptance, and could formally be handed over to be used.
 5/ “Under construction” refers to the total floor space of all buildings by the real estate development enterprises
 during the reference time, including floor space newly started in current year, floor space of continued construction of
 the building from the former period, floor space of stopped or postponed in the previous period but recovered in
 current year, floor space completed during current year, and newly started floor space in current year but postponed.
 6/ “Settlement” including completed commercial building areas that are currently sold, rented out, or handed over to
 pre-selling.
 7/ “Unsold” means completed commercial building areas that have not been sold.
21

e. Floor space completed (Floor space of buildings completed) refers to housing construction
   that has been completed in accordance with the design and approval requirements, including
   fulfilling the conditions of use and other accreditation standards to certify the buildings can be
   formally handed over to buyers to use. The real estate developer needs to obtain certification
   from various agencies (local government, fire station, and the like). If the certification was not
   completed for any reason, the floor space will not be counted toward “completed” and will
   stay in the construction phase. Real estate developers directly report this to the NBS through
   an online system.

f. Floor space waiting for sales (vacant) refers to completed floor space of housing that is
   available for sale or rent but that has not yet been sold or rented. The indicator includes
   unsold floor space of completed buildings (in completion phase) but excludes buildings not yet
   built or under construction to avoid double-counting.

                                   C. Real Estate Investment

The NBS publishes data on investment in real estate development. The definition of the series
(from CEIC) is investment by real estate development companies, commercialized buildings
construction companies, and other real estate development units of various types of ownership in
the construction of buildings, such as residential buildings, factory buildings, warehouses, hotels,
guesthouses, holiday villages, office buildings, and the complementary service facilities and land
development projects, such as roads, water supply, water drainage, power supply, heating supply,
telecommunications, land leveling, and other infrastructural projects. It does not include activities
in pure land transactions.

Residential real estate investment refers to real estate investment in residential buildings only.

IMF staff estimates its real estate gross fixed capital formation (GFCF) series based on the
national account concept. It takes a share of real estate investment in total fixed asset investment
(both series from NBS) and applies it to the measure of GFCF in the national accounts.

                                        D. Inventory Data

Data on inventory consist of NBS and local housing bureau properties available for sale.
The NBS data on inventory consist of floor space unsold, and floor space sold adjusted by
the inventory ratio to measure how long it would take existing unsold units to be absorbed
by average sales. The FangGuanJu also provides the transaction volume of floor space
sold and unsold (in square meters). Data are based on transaction records for purchases
and sales of newly built residential units. The sample in general covers larger cities, about
20–25 percent of China’s urban landscape.

The difference between the change in housing stock and new construction can be
attributed to demolitions and reclassification of rural to urban areas under the urbanization
process.
You can also read