Modelling a new broadcasting distribution
←
→
Page content transcription
If your browser does not render page correctly, please read the page content below
www.pwc.com/ca

                Modelling a new
                broadcasting distribution
                system financial
                contribution framework
                for Canadian audiovisual
                content
December 2018   Prepared for the Canadian Media Producers Association (CMPA) in
                partnership with: Alliance of Canadian Cinema, Television and Radio
                Artists (ACTRA); Association québécoise de la production médiatique
                (AQPM); and Directors
                Guild of Canada (DGC).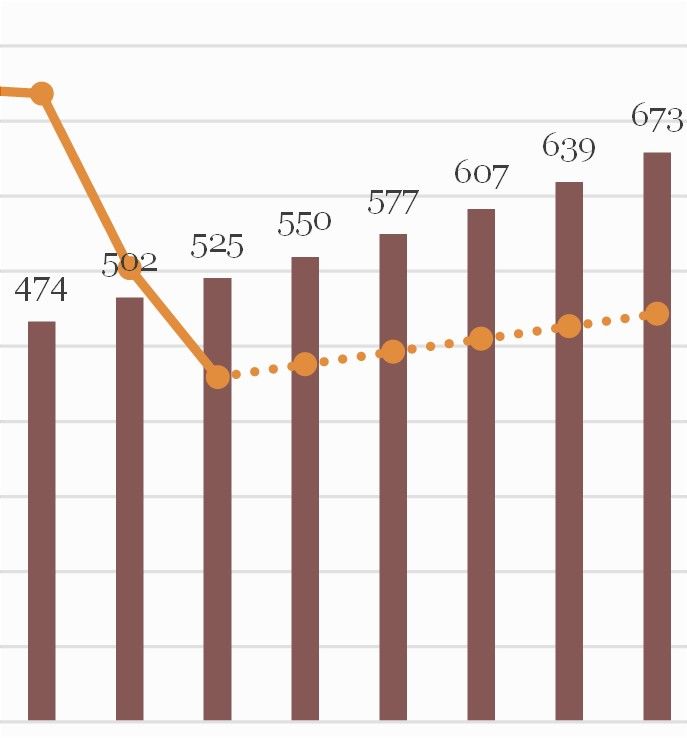
Table of contents
Executive summary                                                                                                                                                     1
1. Introduction                                                                                                                                                       3

1.1.     Study background                                                                                                                                             3
1.2.     Study objective                                                                                                                                              3
1.3.     Approach overview                                                                                                                                            4
1.4.     Authors                                                                                                                                                      5

2. Current state overview                                                                                                                                             6

2.1.     Media content industry overview                                                                                                                              6
2.2.     Media content distribution segments                                                                                                                          9
2.3.     Existing contribution framework                                                                                                                             12

3. Modelling a new contribution framework                                                                                                                            15

3.1.     Model development process                                                                                                                                   15
3.2.     Expanding the revenue base                                                                                                                                  15
3.3.     Funding targets                                                                                                                                             17
3.4.     Allocation schemes within model types                                                                                                                      20

4. Model option evaluation                                                                                                                                          27

4.1.     Fairness and sector contributions                                                                                                                          27
4.2.     Small and medium enterprises                                                                                                                               30
4.3.     Consumers and pricing                                                                                                                                       31

Appendices                                                                                                                                                          35
Appendix A: Limitations                                                                                                                                             36
Appendix B: References                                                                                                                                              37

This publication has been prepared for general guidance on matters of interest only, and does not constitute professional advice. You should not act upon the
information contained in this publication without obtaining specific professional advice. No representation or warranty (express or implied) is given as to the accuracy
or completeness of the information contained in this publication, and, to the extent permitted by law, PricewaterhouseCoopers LLP, its members, employees and
agents do not accept or assume any liability, responsibility or duty of care for any consequences of you or anyone else acting, or refraining to act, in reliance on the
information contained in this publication or for any decision based on it.

Canadian Media Producers Association
PwC
Executive summary
Current regulations in the Canadian broadcasting system require Broadcasting Distribution Undertakings (BDUs)
to contribute a fixed share of revenue to the creation of Canadian programming. As part of a digital shift in
Canadian media consumption, media content is increasingly being distributed over Internet and wireless network
platforms. These service platforms are not currently required to contribute to Canadian programming despite
becoming significant elements of Canada’s broadcasting system.

As revenues in the BDU sector are now in decline and BDUs are the sole funding contributor within the existing
framework, this decline is having a direct negative impact on the level of private-sector funding contributions
available to support the production of Canadian content. Given its overarching objective of supporting the vitality
of Canada’s production sector, the CMPA is seeking to develop a platform agnostic approach to redesigning the
existing contribution framework.

In this context, PricewaterhouseCoopers, LLP (PwC, we or us) has been commissioned by the CMPA to develop
model options for a new financial contribution framework at the distribution level of the industry that reflects
current industry dynamics and is consistent with the CMPA’s objectives. In developing these models, PwC has been
guided by certain principles provided to us by the CMPA (the Guiding Principles).

In this context, our contribution framework models were developed with reference to the Guiding Principles set by
the CMPA, as follows:

    1.   Comprehensiveness: models should broaden the contribution base to include new domestic content
         distribution industry segments provided through retail Wireless Service Providers (WSPs) and Internet
         Service Providers (ISPs). We refer to BDUs and the relevant media content distribution portions of WSPs
         and ISPs collectively as “Funding Segments”;

    2. Minimum funding level: the future funding levels achieved are, at a minimum, equal to the historical
       levels achieved in the existing framework in order to continue supporting Canadian content production in a
       sustainable manner. Based on an assessment of historic funding levels, a minimum target of funding
       (corresponding to the historical peak funding year) was set for the purpose of this report;

    3. Dynamism: models allow for adjustments in market shares over time such that cumulative funding level
       and growth remains in line with the overall revenue level and growth of the Funding Segments;

    4. Fairness: models should reflect the contribution shares in an equitable manner across Funding Segments;

    5.   Minimum growth impediment: a Funding Segments’ contribution share will be determined such that
         it does not lead to an increased obligation for the distribution sector as a whole;

    6. Pro-SME (small and medium enterprises): consideration should be given to the viability of smaller
       companies; and

    7.   Minimum consumer impact: models should minimize as much as possible any direct cost increases to
         Canadian consumers, in particular low income households.

In developing new model options in accordance with the above Guiding Principles, we broadened the revenue base
of the existing contribution framework to include revenue from the Residential Internet and Wireless data
segments, in addition to the BDU revenue currently factored into the existing contribution framework.

Using historical data, 2013-14 was identified as the peak funding contribution year. Consistent with Guiding
Principle 2, the 2013-14 funding level, was therefore set as the minimum magnitude of contribution funds (annual
target) to be achieved during all forecast period under a new contribution framework. We have set these annual

Canadian Media Producers Association                                                                                  1
PwC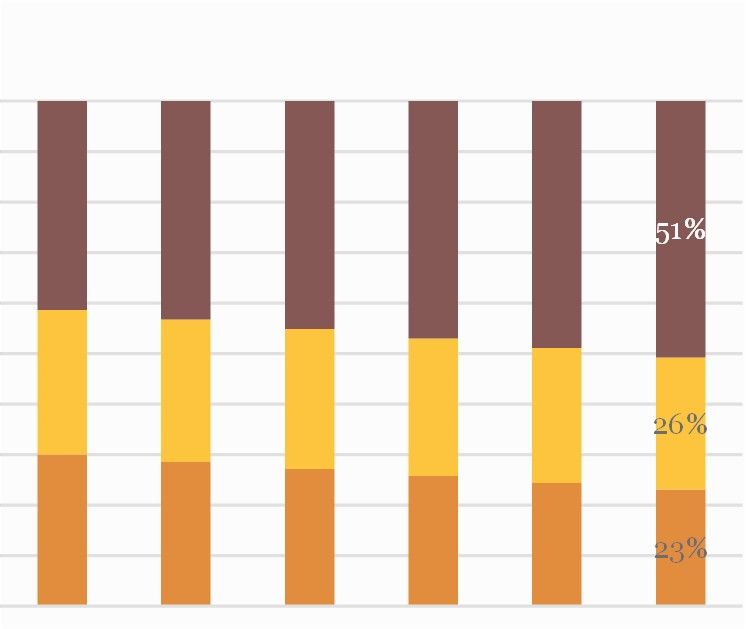
targets using two potential extreme possibilities, which represent our lower bound (minimum target/Model Type L)
and upper bound (maximum target/Model Type U) funding targets, as follows:
Inflation-based targets - lower bound/minimum targets (Model Type L): Increases the annual
funding target to account for the increases in cost of living (i.e. the inflation rate).
Segment growth-based targets - upper bound/maximum targets (Model Type U): Increases
the annual funding target in line with the nominal growth rate of the three Funding Segments. We note
that the nominal growth rate is the sum of real growth (all growth excluding inflation) and inflation
growth.
To this end, we developed the following three allocation schemes to be incorporated into each of the above two
model types, creating a total of six models (i.e. 2x3):
1. Scheme 1: Gap reallocation - BDUs contribute 5% of their revenues 1. Under this scheme, the gap from
the target funding level is met by contributions from the other Funding Segments
2. Scheme 2: Gradual reallocation - An intermediary scheme between Scheme 1 and Scheme 3 with
Funding Segment contributions commencing at Scheme 1 levels before gradually achieving Scheme 3
contribution levels
3. Scheme 3: Market share-based reallocation - Funding contributions are allocated between the
three Funding Segments in proportion to their relative market share of revenue
Based on the above two funding model types and three allocation schemes, the following six models were developed
as part of this study
Funding target:
Inflation-based Segment growth-based
(Model Type L) (Model Type U)
Scheme 1 Model Type L, Scheme 1 Model Type U, Scheme 1
Allocation Scheme Scheme 2 Model Type L, Scheme 2 Model Type U, Scheme 2
Scheme 3 Model Type L, Scheme 3 Model Type U, Scheme 3
By design, each model adheres to the first three Guiding Principles. Models options do not adhere to all the
remaining Guiding Principles and there are a number of trade-offs and potential adaptations to particular models
to be considered when assessing their respective adherence to Guiding Principles 4-7.
1 Including the inflationary component.
Canadian Media Producers Association 2
PwC
1. Introduction
1.1. Study background
The Canadian Media Producers Association (CMPA) is Canada’s national trade association for independent
English-language media producers. The CMPA’s membership base includes hundreds of companies engaged in the
development, production and distribution of English-language content made for television, cinema and digital
media. The CMPA works on behalf of these members to ensure a bright future for domestic media production and
Canadian content. In doing so, the CMPA plays a key role in promoting the value of the industry and shaping
federal government policy on critical industry issues including broadcasting, funding, copyright, taxation, trade and
industrial relations.

Current regulations in the Canadian broadcasting system require Broadcasting Distribution Undertakings (“BDUs”)
to contribute to the creation of Canadian programming. These financial contributions support the creation of
Canadian content and help further the objectives outlined in the Broadcasting Act (1991), which states that “each
element of the broadcasting system shall contribute in an appropriate manner to the creation and presentation of
Canadian programming.”2 Given industry dynamics at the time the Broadcasting Act (1991) was drafted, the
regulatory framework was centred on contributions solely from the legacy television system. The existing financial
contribution framework requires traditional television distributors (i.e. BDUs) to contribute 5% of their previous
year’s revenues towards Canadian programming, a portion of which (about 50%) is directed towards the Canada
Media Fund (CMF).

As part of a digital shift in Canadian media consumption, media content is increasingly being distributed over
Internet and wireless network platforms. These service platforms are not currently required to contribute to
Canadian programming despite becoming increasingly significant elements of Canada’s broadcasting system.
Revenues in the BDU sector are now on a declining trajectory, which, given the existing framework’s sole focus on
BDU contributions, is having a direct negative impact on the level of private-sector funding contributions available
to support the production of Canadian content.

In April 2018 the Canadian Radio-television and Telecommunications Commission (CRTC) released a study titled
Harnessing Change: The Future of Programming Distribution in Canada, which observed a decline in the share of
public funding on culture and broadcasting from 0.32% of the GDP in 1992 to 0.16% in 2016. Given this decline, the
CRTC’s study recommends a redesign of the existing contribution framework in order to continue supporting
Canadian content production in a sustainable manner. 3 As of June 2018, in acknowledgment of the impacts of the
digital shift in the manner in which media is consumed in Canada, the Government of Canada launched a review of
the Broadcasting Act and the Telecommunication Act. This review will examine issues including
telecommunications and content creation in the digital age, and mechanisms to strengthen the future of Canadian
media and Canadian content creation.

Given its overarching objective of supporting the vitality of the industry, the CMPA is seeking to develop a content-
centric / platform agnostic approach to redesigning the existing contribution framework.

1.2. Study objective
PricewaterhouseCoopers, LLP (PwC, we or us) has been commissioned by the CMPA to develop possible model
options for a new financial contribution framework at the distribution level of the industry that reflects current
industry dynamics and is consistent with the CMPA’s objectives.

2Broadcasting Act (1991) Paragraph 3(1)(e)
3Harnessing Change: The Future of Programming Distribution in Canada, Canadian Radio-television and Telecommunications Commission,
2018. Accessed at https://crtc.gc.ca/eng/publications/s15/

Canadian Media Producers Association                                                                                                 3
PwC
1.2.1. Guiding Principles
In developing these models, PwC has been guided by certain principles provided to us by the CMPA (the Guiding
Principles). Therefore, the models presented in this report should not be interpreted as a recommendation by PwC
to adopt such models and/or an opinion by PwC as to their net economic benefit to Canada. In this context, our
contribution framework models were developed with reference to the Guiding Principles set by the CMPA, as
follows:
1. Comprehensiveness: models should broaden the contribution base to include new domestic content
distribution industry segments provided through retail Wireless Service Providers (WSPs) and Internet
Service Providers (ISPs). We refer to BDUs and the relevant media content distribution portions of WSPs
and ISPs collectively as “Funding Segments”;
2. Minimum funding level: the future funding levels achieved are, at a minimum, equal to the historical
levels achieved in the existing framework in order to continue supporting Canadian content production in a
sustainable manner. Based on an assessment of historic funding levels, a minimum target of funding
(corresponding to the historical peak funding year) was set for the purpose of this report;
3. Dynamism: models allow for adjustments in market shares over time such that cumulative funding level
and growth remains in line with the overall revenue level and growth of the Funding Segments;
4. Fairness: models should reflect the contribution shares in an equitable manner across Funding Segments;
5. Minimum growth impediment: a Funding Segments’ contribution share will be determined such that
it does not lead to an increased obligation for the distribution sector as a whole;
6. Pro-SME (small and medium enterprises): consideration should be given to the viability of smaller
companies; and
7. Minimum consumer impact: models should minimize as much as possible any direct cost increases to
Canadian consumers, in particular low income households.
1.3. Approach overview
The following four elements summarize the overall approach of our study:
Current state analysis: We collected and analyzed information on Canada’s media content distribution
industry to understand the existing industry contribution framework, identify relevant industry segments,
and depict past and expected future trends within these segments.
Contribution framework development: Based on our understanding of current industry dynamics,
the existing contribution framework, and the Guiding Principles outlined in 1.2, we specify a number of
potential contribution framework model options.
Contribution framework evaluation: After developing a number of potential contribution framework
models, we evaluated the potential impacts of each of them with respect to the Guiding Principles, as
outlined by the CMPA.
Reporting: A report was prepared, which outlines the background, approach, and findings of our study 4.
4 Throughout this report, the “$” sign refers to the Canadian Dollar. Wherever US dollars are used, they are referred to as USD.
Canadian Media Producers Association 4
PwC1.4. Authors
This study has been prepared by members of PricewaterhouseCoopers LLP (PwC) Canada’s Economics Practice.
The key authors of the study are:
Michael Dobner, National Leader, Economics Practice
Alex Francis, Senior Economist
Manpreet Kaur Juneja, Economist
Canadian Media Producers Association 5
PwC2. Current state overview
In this section we provide an overview of Canada’s media content distribution industry and the existing
contribution framework.
2.1. Media content industry overview
Canada’s media content distribution industry is not defined as a discrete industry sector per the North American
Industry Classification System (NAICS) or the Standard Industrial Classification (SIC), as utilized by Statistics
Canada, the CRTC and other government organizations for the purposes of classifying and reporting industry
statistics. Canada’s communication sector does however include a number of relevant industries involved in the
distribution of media content. The communications sector is regulated by the CRTC and can be divided into two
broad constituent industries: broadcasting and telecommunications. The current revenue levels and growth of this
sector, expressed in Compound Annual Growth Rate (CAGR) terms, are shown in the figure below.
Figure 1: Communications sector structure and revenue growth (2012-2016)
2% CAGR
70
Communications sector 60
18 17.9
18 18.2
17.9
- Revenue (2016): $67 billion 50
- Growth (2012-16): 2%
$ billions
40
30
Telecommunications 47.8 48.7
Broadcasting industry industry 43.9 44.8 45.9
20
- Revenue (2016):$18 billion - Revenue (2016): $49 billion
- Sector share: 23% 10
- Sector share: 73%
- Growth (2012-16): -0.04% - Growth (2012-16): 2.6% 0
2012 2013 2014 2015 2016
Telecommunications Broadcasting
Source: CRTC’s Communications Monitoring Report 2017
According to the Canadian Industry Statistics (2018) database compiled by the department of Innovation, Science
and Economic Development (ISED), the communications sector has more than 6,489 establishments. However, it
is dominated by a small number of large, vertically and horizontally integrated companies. The ‘Big 5’ companies in
the communications sector – Bell, Quebecor/Videotron, Rogers, Telus, and Shaw/Corus - accounted for 83% of
communications sector revenue in 2016. The next five largest companies by revenue accounted for 9% of sector
revenue while all remaining companies together accounted for 8% of communications sector revenues in 2016.
Figure 2: Communication sector: Market share of revenue, by company size (2016)
'Big 5'
companies
Next five
83%
largest
companies
9%
All other companies 8%
Source: CRTC’s Communications Monitoring Report 2017
Canadian Media Producers Association 6
PwC2.1.1. Broadcasting industry
Canada’s broadcasting industry recorded $17.8 billion in revenue in 2016, accounting for 23% of communications
sector revenue. Canada’s broadcasting industry can be divided into the following three industry segments:
Conventional TV services: comprised of free TV services operating “over the air”. In Canada, there are
120 conventional TV services with 93 being private and 27 public. Conventional TV transmitters are
typically now only available in urban markets with most of the audience (over 80%) coming from
redistribution on cable, satellite and fibre TV services. Conventional TVs share of the total TV audience has
gotten smaller as niche discretionary TV services have emerged.
Discretionary and on-demand services:
o Discretionary services: covers all licensed individual pay TV and specialty services
o On-demand services: covers all licensed pay-per-view and video-on-demand services.
Broadcasting Distribution Undertakings (BDUs): The BDU segment is the portion of the
broadcasting industry involved in media content distribution. BDUs provide subscription television
services to Canadians. They redistribute programming from conventional over-the-air television and radio
stations. BDUs also distribute pay audio and discretionary services (i.e. pay, specialty, pay-per-view (PPV)
and video-on-demand (VOD) services). As shown in the figure below, the BDUs sector is made up of cable,
national direct-to-home (DTH) satellite, or Internet Protocol television (IPTV) service providers.
Figure 3: Broadcasting industry structure and revenue shares by segment (2016)
Conventional TV Conventional TV
$2.9 billion
(18%)
Broadcasting Discretionary &
industry on-demand TV Cable
BDUs Satellite
Discretionary
IPTV
BDUs and on-demand
$8.7 billion $4.4 billion
(55%) (28%)
Source: CRTC’s Communications Monitoring Report 2017
As shown in the figure below, broadcasting industry revenue has been stable (in nominal terms and contracting in
real terms), with a -0.04% CAGR from 2012 to 2016. Discretionary and on-demand television, however, comprise a
larger share of broadcasting industry revenue while conventional television shares of the industry are declining.
Canadian Media Producers Association 7
PwCFigure 4: Broadcasting industry revenue, by major segment (2012 -2016) 5
18 -0.04% CAGR
16
14
12 8.6 8.8 8.9 8.9 8.7
$ billion
10
8
6
4.0 4.1 4.2 4.3 4.4
4
2 3.4 3.2 3.1 2.9 2.9
0
2012 2013 2014 2015 2016
Conventional Television Discretionary and on demand television BDU
Source: CRTC’s Communications Monitoring Report 2017
2.1.2. Telecommunications industry
Canada’s telecommunications industry recorded $49 billion in revenue from retail and wholesale activities in 2016,
accounting for 73% of communications sector revenue. As at 2016, retail activities accounted for 92% of
telecommunications industry revenue ($44 billion). The telecommunications industry provides four types of
services (i.e. wireline voice (local/long distance), Internet, wireless, data and private line), which in turn can be
broken down into a number of discrete service offerings.
Figure 5: Telecommunications industry segments and revenue share (of retail revenue), by segment
Other
services,
Wireline applications,
voice equipment
Wholesale
Internet
Internet Data and private
Retail access line
Internet
Internet $3.1 billion (7%)
Telecommunications
100% Wireless
data Wireline
Retail voice
wireless $8.0 billion
Wireless Basic voice, (18%)
long
Wholesale distance,
wireless roaming &
others Wireless
Data and Internet
private line Paging, $23.2 billion
$10.2 billion
terminal (52%)
(23%)
equipment
Source: CRTC’s Communications Monitoring Report 2017
Portions of the Internet and wireless (retail) segment are involved in the distribution of media content as outlined
below. In International Data Corporation’s (IDC) Canadian Consumer Indicators Survey conducted in 2018 (IDC’s
5 Excludes the radio segment of the broadcasting industry
Canadian Media Producers Association 8
PwCConsumer survey), Wireless, Internet, TV and over the top (OTT) video services, 57% of consumers reported
subscribing to monthly OTT services and 38% rented or purchased transactional VOD.
2.2. Media content distribution segments
The following three segments identified within broadcasting and telecommunications industries are predominantly
engaged in distributing media content to consumers:
BDUs
Retail Internet
Wireless data
The structure, revenue and growth prospects of each of these three media content distribution segments are
outlined below.
2.2.1. BDUs
In 2016, BDU revenue was $8.7 billion and accounted for 54.4% of total revenues in the broadcasting industry. The
BDU segment comprises three sub-segments that differ by the network used for media distribution: cable TV,
DTH/satellite, and IPTV. IPTV is distributed over an Internet platform while the other two sub-segments use cable
and satellite platforms.
As shown in the figure below, overall revenues produced by the BDU sector have grown by a modest 0.5% CAGR in
2012-16. The distribution network for traditional platforms (i.e. cable and DTH/satellite) is well-established with
these two sectors currently accounting for a large portion of total BDU revenue.
Figure 6: BDU segment: revenue share (2016) and growth (2012 -2016), by sub-segment
IPTV
21% 10 0.5% CAGR
9
0.6 0.9 1.3
8 1.6
1.8
7
6 2.5 2.5 2.4
$ billion
2.3 2.2
Cable 5
55% 4
3
2
DTH/satellite 1
5.5 5.4 5.2 5.1 4.8
24% 0
2012 2013 2014 2015 2016
Cable DTH IPTV
Source: CRTC’s Communications Monitoring Report 2017
As reported in CRTC’s Communications Monitoring Report 2017, overall earnings before interest, tax, depreciation
and amortization (EBIDTA) for the BDU segment was 16% in 2016. Over the same period, EBIDTA for BDU sub-
segments was 22% for cable, 31% for DTH/satellite and -18% for IPTV in 2016.
Approximately 80% of respondents to IDC’s Consumer Survey reported possessing a TV subscription. As shown in
the figure below, the ‘Big 5’ companies in the communications sector account for 90% of all TV subscriptions in
Canada.
Canadian Media Producers Association 9
PwCFigure 7: TV subscriptions by company
Shaw, 19%
Rogers, 18%
Bell, 26%
TELUS, 14%
Others, 10%
Vidéotron,
13%
Source: IDC consumer Survey, 2018
Growth prospects: PwC’s Entertainment and Media Outlook 2018-22 forecasts that TV
subscriptions in Canada will decline by 0.3% (CAGR) between 2017 and 2022.
2.2.2. Retail Internet
In 2016, retail Internet services recorded a total revenue of $10.2 billion. Of this, over 90% or $9.5 billion was
earned by providing Internet access to consumers while the remaining 10% of the revenue was earned from
applications, equipment and other services. The residential sector accounts for the majority of the Internet access
revenue at $8.0 billion and the business sector accounts for the remaining $1.5 billion.
Figure 8: Retail Internet access revenue (2012 - 2016)
9 8.0
8 7.2 Growth prospects:
7 6.6
5.9
6 5.4 PwC’s Entertainment and Media
Outlook 2018-22 forecasts that
% billion
5
4
revenue from Internet access
services in Canada will increase
3
1.5
by 3.2% (CAGR) between 2017
2 1.2 1.2 1.3 1.4
and 2022.
1
0
2012 2013 2014 2015 2016
Residential Access Business Access
Source: CRTC’s Communications Monitoring Report 2017
In the IDC’s Consumer Survey 2018, over 96% of respondents to the survey reported to possess an Internet
subscription with the ‘Big 5’ communications companies, accounting for 77% of total market share.
Canadian Media Producers Association 10
PwCFigure 9: Internet subscription – consumer choices and market share
Big 5 communications companies
25% 77%
23%
20%
Market share (%)
15%
15% 14%
13%
12%
11%
10%
5%
5%
3%
2% 2%
0%
Source: IDC Consumer Survey, 2018
Video consumption trends
Traditionally, the business of Internet Service Providers (ISPs) was based on delivering text-based communication.
Over time, the proliferation of broadband networks and new compression technologies stimulated the consumption
of video and broadcasting-type content. In 2008, a Cisco study estimated that 68% of North American Internet
traffic is attributed to video. Within less than a decade, the share of video traffic consumption of total broadband
consumption has increased to 77%6.
Growth prospects: PwC’s Entertainment and Media Outlook 2018-22 forecasts that video
consumption in fixed broadband data is expected to grow by 21% (CAGR) between 2017 and 2022.
2.2.3. Wireless data
The retail wireless segment is divided into six types of services - basic voice, long distance voice, paging, terminal
equipment, wireless data and roaming. The core business of Wireless Service Providers (WSPs) was originally
based on delivering communication services through voice services. With the advent of smartphones, the
capabilities of wireless/mobile services has transformed dramatically.
As shown in the figure below, total retail wireless revenue was $23.2 billion with 47% ($11.0 billion) attributed to
wireless data. According to IDC’s Consumer Survey, 98% of respondents in Canada report to possess wireless
service connections. According to BMI Research, Bell, Telus and Rogers accounted for 91% of all mobile
subscriptions. Other key providers of wireless services include Koodo, Fido, SaskTel, Videotron, Freedom/WIND
Mobile, Terre Star, etc.
6As estimated by Data Consumption Canada in PwC’s Global Entertainment and Media Outlook 2018-22. Note this consumption also includes
user-generated content.
Canadian Media Producers Association 11
PwCFigure 10: Retail wireless revenue, by sub-segment (2012 -2016) and retail wireless market share, by firm (2018, Q1)
25 23.2
22.5
20.2 20.9
19.5
20 Rogers,
33.3% Bell,
29.1%
15
$billion
11.0
10.0
10 8.7
7.5
6.2
5
0 Others,
2012 2013 2014 2015 2016 9.3%
Total Wireless Wireless Data Telus,
28.3%
Source: CRTC’s Communications Monitoring Report 2017 Source: BMI Research
Growth prospects: PwC’s Entertainment and Media Outlook 2018-22 forecasts that revenue from
mobile Internet access services or wireless data services in Canada will increase by 9.5% (CAGR)
between 2017 and 2022.
Video consumption trends
As screen size is becoming less important for consumers, smartphones and other Internet-enabled devices are
increasingly being used for video content consumption. Video consumption accounts for 85% of total data
consumption in smartphones. PwC’s Entertainment and Media Outlook Survey 2018-22 forecasts that video
consumption in smartphone data is expected to grow at 32.3% (CAGR) between 2017 and 2022. 7 At the same time,
Internet-based video services like Netflix have recently announced plans for a standalone wireless app version of
their popular streaming video platform 8.
2.3. Existing contribution framework
Under the existing financial contribution framework, BDUs are required to contribute 5% of their previous year’s
gross revenues from broadcasting activities towards Canadian programming each year 9. This contribution applies
to terrestrial BDUs (Cable, Internet Protocol Television), DTH/satellite BDUs (DTH BDUs) and other smaller
BDUs10.
Given that companies in the BDU sector are the sole industry participants making financial contributions within
the existing contribution framework, the amount of funding towards Canadian programming is wholly tied to the
revenue growth of this sector. In line with BDU revenue peaking in 2014, BDU contribution towards Canadian
programming also peaked in 2014 (refer to the figure below).
7 As estimated by Data Consumption Canada in PwC’s Global Entertainment and Media Outlook 2018-22. Note this consumption also includes
user-generated content.
8 https://variety.com/2018/digital/news/netflix-mobile-only-streaming-pricing-test-1203030443/
9 Less their required contribution to the Independent Local News Fund (ILNF) and any allowable contribution to local expression over the
current broadcast year.
10 BDUs with fewer than 2,000 subscribers are fully exempted from a contribution to content production.
Canadian Media Producers Association 12
PwCFigure 11: BDU revenue and contributions to the Canadian programming funds (2012-2016)
Peak Peak
revenue $450 contribution
9.0
$8.9 $8.9 $437 $437
$440
8.9 $428
$430
$8.8 $420
8.8 $420 $416
$8.7
$410
$ million
8.7
$ billion
$400
8.6 $8.6 $390
8.5 $380
$370
8.4
$360
8.3 $350
2012 2013 2014 2015 2016 2012 2013 2014 2015 2016
Source: CRTC’s Communications Monitoring Report 2017
BDU contributions to Canadian programming are channeled through the following 11:
Canada Media Fund (CMF)
Expenditures on community channels
Other independent funds
The BDU contribution to the CMF accounted for around 50% of BDUs’ total annual financial contributions in
support of Canadian programming over the past five years. CMF receives funds from both BDUs and the
Government of Canada.
Figure 12: CMF revenues from BDUs (2011-12 to 2015-16) 12
$300
Peak
$250 $234 $228 $229
$218 $217
$200
$ million
$150
$100
$50
$-
2011-12 2012-13 2013-14 2014-15 2015-16
Source: CMF
11 BDUs were also required to contribute towards the Local Program Improvement Fund (LPIF) up until this fund was discontinued in 2014.
12 CMF revenues were adjusted for one-time payments of BDUs non-compliant with the CRTC contribution requirements.
Canadian Media Producers Association 13
PwC2.3.1. Future funding contributions Despite the increasingly significant role played by Internet and wireless data segments of the communications sector in providing consumers with video content, the existing contribution framework requires financial contributions solely from BDUs. Revenues in the BDU segment are now on a declining trajectory, which, given the existing framework’s sole focus on BDU contributions, is having a direct negative impact on the level of private- sector funding contributions available to support the production of Canadian content. The decline in BDU revenue is not expected to be reversed in the near future, with forecasts of TV subscriptions in Canada set to decline by CAGR -0.3% between 2017 and 202213. Internet and wireless service platforms are not currently required to contribute to Canadian programming, despite becoming increasingly significant elements of Canada’s media content distribution system. The role played by these segments is expected to intensify over the next five to ten years in line with forecasts of growth in media content consumption within these segments. The current trajectories of each of the segments involved in the distribution of media content are not uniform. BDUs are the sole contributors under the existing contribution framework. They are currently, and are expected to continue, experiencing declining revenues. In contrast, the Internet and wireless segments of the broadcasting sector, which are on a growth trajectory, are not required to contribute under the existing framework. This misalignment in revenue trajectory and contribution requirements of these three segments has, and will continue to have, a direct negative impact on the level of private-sector funding available to support the production of Canadian content. 13 PwC Global Entertainment and Media Outlook 2018-22. Canadian Media Producers Association 14 PwC
3. Modelling a new contribution
framework
In this section, we develop a number of options for a new contribution framework. As indicated previously, we
developed model options with consideration to the Guiding Principles (see Section 1.2.1).
3.1. Model development process
There can be a number of contribution framework models that each adhere to the Guiding Principles. We note that
the models presented in this section all adhere to the first three Guiding Principles (i.e. comprehensiveness,
minimum funding level and dynamism) and differ in the degree of adherence to the remaining Guiding Principles.
We present these model options in terms of minimum and maximum funding targets, which create a range of
possible models for consideration. In developing the models, we took the following general steps:
Step 1: Broaden the revenue base for media content funding beyond the BDU segment, in line with
Guiding Principle 1, comprehensiveness;
Step 2: Develop forecasts of the revenues and respective revenue market shares of the segments included
in step 1. This allows us to meet Guiding Principle 3, dynamism;
Step 3: Identify the funding target range in line with Guiding Principle 2, minimum funding level;
Step 4: Develop models that adhere to the first three Guiding Principles noted in steps 1 to 3; and
Step 5: Assess how each model option adheres to the remaining Guiding Principles (4-7) (refer to section
4).
3.2. Expanding the revenue base
The first step in our model development addresses Guiding Principle 1, comprehensiveness (i.e. broadening the
revenue base to include relevant media content distribution industry segments). To broaden the revenue base of the
existing contribution framework, we have included revenue from the Residential Internet and Wireless data
segments, in addition to the BDU revenue currently factored into the existing contribution framework.
We therefore refer to the following media content distribution segments as contribution framework “Funding
Segments” for the remainder of this report:
1. BDUs
2. Residential Internet
3. Wireless data
3.2.1. Inclusion of Residential Internet
We note that in our modelling, we consider the retail Internet access revenue earned from the residential sector and
not the total revenue earned by ISPs. The revenues of this Funding Segment was established through excluding the
following items from the total revenues earned from Internet services:
wholesale revenue earned by ISPs because wholesale access is purchased with the intent of reselling the
purchased capacity on the retail market to businesses and consumers;
Canadian Media Producers Association 15
PwC revenue earned from applications, equipment and other Internet-related services; and
retail Internet access revenue earned from the business sector, as it is typically not used to consume media
content.
3.2.2. Inclusion of Wireless data
Similarly, for WSPs’ revenue, we have included only the revenue attributable to wireless data services and as such
have excluded the following items:
wholesale revenue that generally consists of roaming revenues a company receives for processing calls from
wireless subscribers of other companies roaming within its territories. Consumers typically do not consume
media content during roaming; and
revenue from the sale of wireless services to Mobile Virtual Network Operators (MVNOs). Media is
consumed when wireless data services are sold to final consumers and not resellers.
The current revenue levels and growth forecasts for these segments is presented in the figure below.
Figure 13: Current (2016) and forecast revenue (2017-22 CAGR), by Funding Segment
30,000 9.5%
25,000
10,981 2017-22 CAGR
20,000
$ million
15,000
3.2%
8,045 2017-22 CAGR
10,000
2017-22 CAGR -0.3%
5,000 8,734
BDU Residential Internet Wireless data
0
Source: CRTC Communications Monitoring Report 2017 & PwC Global Entertainment and Media Survey 2018-22
Based on each of the three segments’ 2016 revenue levels, we have applied PwC’s 2017-22 growth forecasts to
calculate revenue levels for each segment from 2017 to 2022.
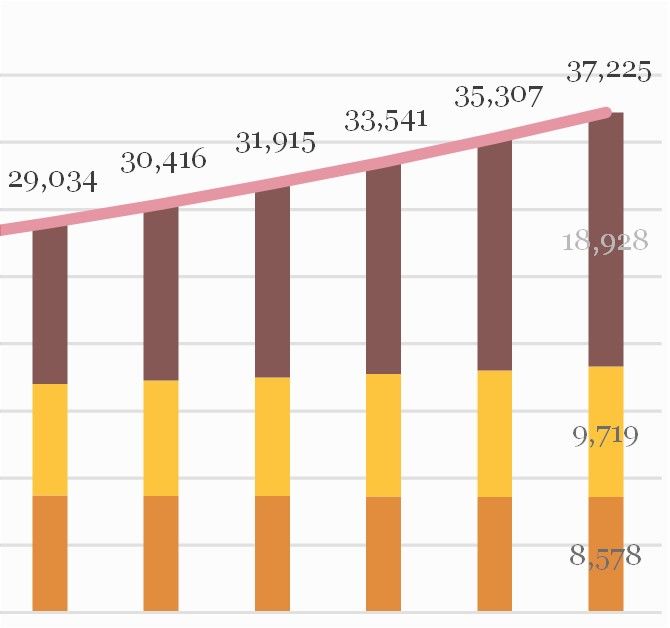
As shown in the figure below, as the wireless data segment is projected to grow the fastest over the forecast period,
this segment is expected to increases its share of the total revenue of the three Funding Segments, largely at the
expense of BDUs and, to a lesser extent, residential Internet.
Canadian Media Producers Association 16
PwCFigure 14: Forecasts of revenue & market share of revenue, by segment (2017-22)
Current Forecast Forecast
Current
40,000 37,225
35,307
33,541 100%
35,000 30,416
31,915
90%
29,034
27,760
30,000 80% 40%
Share or total revenue (%)
18,928 51%
70%
25,000
$ Million
10,981 60%
20,000
50%
29%
15,000 40%
8,045 9,719 26%
10,000 30%
20%
5,000 31%
8,734 8,578 10% 23%
0 0%
2016 2017 2018 2019 2020 2021 2022 2016 2017 2018 2019 2020 2021 2022
BDU Residential Internet
Wireless data Total for 3 segments
Source: Calculations based on CRTC Communications Monitoring Report 2017 & PwC Global Entertainment and Media Survey 2018-22
We designed our models in consideration of these projected trends as they relate to the relative market shares (i.e.
revenue share) in order to incorporate Guiding Principle 3, dynamism, into the model development process.
We note that we have selected revenue as the key metric in developing financial contribution models, as it is
relatively easy to monitor and less susceptible to misreporting relative to other financial metrics such as profits and
costs. It is also least prone to inaccuracies and manipulation when differentiated between various services at the
firm levels. In contrast, profits and costs are more difficult to accurately attribute to individual service offerings.
3.3. Funding targets
Our second step addresses Guiding Principle 2, minimum funding level, which was set, as a starting point, at the
historical peak of the contributions under the existing framework. This is consistent with the objective of
maintaining the sustainability of funding contributions in support of the production of Canadian content.
As outlined in section 2.3, Canadian programming funds reached a peak contribution level of $437 million in 2013-
14 and has since been declining in line with the trajectory of BDU revenues (which peaked at $8.93 billion in
revenue in 2013-14). As this was the peak funding contribution year, we have set, for the purpose of our analysis,
the 2013-14 funding contribution levels as the target to be the minimum magnitude of contribution funds achieved
during all forecast periods (annual target) under a new contribution framework.
A target of $437 million in 2013-14 prices is then used to define annual targets for new financial contribution
framework models. In this modelling exercise, we set these annual targets using the two potential extreme
possibilities, which represent our lower bound (minimum target/Model Type L) and upper bound (maximum
target/Model Type U) funding targets, as follows:
Inflation-based targets - lower bound/minimum targets (Model Type L): Increases the annual
funding target to account for increases in the cost of living (i.e. the inflation rate).
Segment growth-based targets - upper bound/maximum targets (Model Type U): Increases
the annual funding target in line with the nominal growth rate of the three Funding Segments. We note
that the nominal growth rate is the sum of real growth (all growth excluding inflation) and inflation
growth.
Canadian Media Producers Association 17
PwC3.3.1. Rationale for target selection
We have defined the above targets in view of the overarching objectives of the financial contribution framework and
the Guiding Principles. The objective is to ensure that the level of funding to producers for the production of
Canadian content is maintained on a sustainable basis.
Inflation-based targets ensure that the purchasing power of the funds is maintained at all times, regardless of
fluctuations in growth within the communications sector. As the Funding Segments are collectively forecasted to
grow at a rate greater than the inflation rate, we incorporate inflation-based targets as a lower-bound target, which
can be viewed as a mitigation strategy for growth fluctuations within the Funding Segments.
We have selected Segment growth-based targets as upper bound targets to link the funding made available for the
production of Canadian content to the revenue growth of the Funding Segments. The rationale being that revenues
generated by the Funding Segments is generally correlated with the demand for film and video content. Segment
growth-based targets are also consistent with Guiding Principle 5, minimum growth impediment, as the increase in
funding contribution is proportional to the expected growth in the sector.
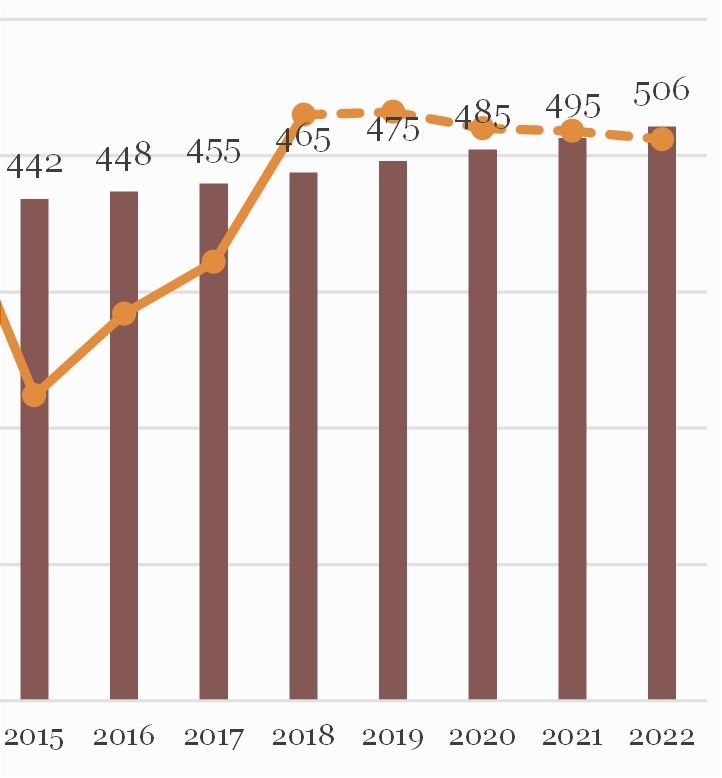
3.3.2. Inflation-based funding targets (Model Type L)
As noted previously, this represents the lower bound or minimum level of funding targeted.
Annual inflation-based targets have been set through applying actual inflation rates (up to 2017) and forecast
inflation rates (2018 onwards) to the minimum funding target in 2014 ($437 million). As a share of Funding
Segments’ revenue, the funding contribution required to meet the inflation-based funding target declines over time.
Annual inflation-based targets throughout the forecast period, and the share of Funding Segments’ revenue they
represent, are shown in the figure below.
Figure 15: Inflation-based targets and funding target as a share of Funding Segments’ revenue (2014-22)
2.5% Forecast inflation 600
Peak Inflation-based funding target
1.8%
funding 485 495 506
465 475 500 1.7%
2.0% 442 448 455 1.6% 1.6%
437 1.5% 1.5%
1.4% 1.4%
400 1.4%
Inflation rate (%)
Funding Targets ($ million)
1.5%
300
1.0%
200
0.5%
100
0.0% 0
2014 2015 2016 2017 2018 2019 2020 2021 2022 2014 2015 2016 2017 2018 2019 2020 2021 2022
Inflation-based funding target Inflation rate % of total Funding Segments' Revenue
Source: Calculations based on CRTC Communications Monitoring Report 2017 & PwC Global Entertainment and Media Survey
2018-22 Note: Inflation rate sourced from IMF World Economic Outlook Database October 2018, accessed through Statista14
14 https://www.statista.com/statistics/271247/inflation-rate-in-canada/
Canadian Media Producers Association 18
PwC3.3.3. Segment growth-based funding targets (Model Type U)
As noted previously, Segment growth-based funding targets represent the upper bound or maximum level of
funding in our model development process.
Segment growth-based funding targets have been set by applying actual nominal revenue growth rates of the
Funding Segments’ (up to 2017) and forecast nominal revenue growth rates (2018 onwards) to the minimum
funding target in 2014 ($437 million).
From 2017 onwards, we have used the 2017-22 CAGR forecasts generated in PwC’s Global Entertainment and
Media Survey 2018-22. We note the aggregate forecast revenue growth rate for Funding Segments is greater than
forecast inflation throughout the forecast period. Due to declines in the BDU sector from 2014, the actual growth in
Funding Segments’ revenues slowed from 2015 to 2017. As the funding contribution is directly linked to Funding
Segments’ revenue growth, the resulting funding contribution as a share of revenue is constant over the forecast
period.
Annual Segment growth-based targets throughout the forecast period, and the share of Funding Segments’ revenue
they represent, are shown in the figure below.
Figure 16: Segment growth-based targets and funding target as a share of Funding Segments’ revenue (2014-22)
9.0% Segment growth-based target 800
Forecast 673 1.8% 1.8% 1.8% 1.8% 1.8% 1.8% 1.8% 1.8% 1.8%
8.0% 700
Nominal growth rate for 3 segments
639
Peak 607
7.0% 577
Funding Targets ($ million)
funding 550 600
525
6.0% 502
474 500
437
5.0%
400
4.0%
300
3.0%
200
2.0%
1.0% 100
0.0% 0
2014 2015 2016 2017 2018 2019 2020 2021 2022 2014 2015 2016 2017 2018 2019 2020 2021 2022
Segment growth-based target Nominal growth rate for 3 segments % of total Funding Segments' Revenue
Source: Calculations based on CRTC Communications Monitoring Report 2017 & PwC Global Entertainment and Media Survey 2018-22
Canadian Media Producers Association 19
PwC3.4. Allocation schemes within model types
Model Type L and Model Type U provided a framework for calculating the percentage of the Funding Segments’
total revenues required to be contributed in order to achieve the lower and upper bounds funding targets set in
each of these model types. However, there also exists the question of how the required funding contribution will be
apportioned between Funding Segments in order to meet the funding target. To this end, we developed the
following three allocation schemes that can be incorporated into each of the two model types, creating a total of six
models (i.e. 2x3):
1. Scheme 1: Gap reallocation - BDUs contribute 5% of their revenues. The gap from the target funding
level15 is met by contributions from the other Funding Segments.
2. Scheme 2: Gradual reallocation –An intermediary scheme that commences with Scheme 1
contribution levels before gradually achieving Scheme 3 contribution levels. Once Scheme 3 levels are
achieved, Funding Segments’ contributions becomes identical to Scheme 3.
3. Scheme 3: Market share-based reallocation – Funding contributions are allocated between the three
Funding Segments based on their relative market shares in terms of revenue.
Based on the allocation scheme and model types, the models options developed as part of this study are
summarized as follows:
Table 1: Model options, based on funding target and allocation scheme
Funding target:
Inflation-based Segment growth-based
(Model Type L) (Model Type U)
Scheme 1 Model Type L, Scheme 1 Model Type U, Scheme 1
Allocation scheme Scheme 2 Model Type L, Scheme 2 Model Type U, Scheme 2
Scheme 3 Model Type L, Scheme 3 Model Type U, Scheme 3
Below we provide a description of these three schemes and discuss these model options in turn.
15 The difference between the defined annual funding target and BDUs’ funding contribution
Canadian Media Producers Association 20
PwC3.4.1. Gap reallocation (Scheme 1)
Under the Scheme 1 i.e. ‘Gap reallocation’, BDUs continue to contribute 5% from their revenue while the remainder
of the target funding level (the funding gap), is met by the other two Funding Segments, in proportion to their
relative market shares in revenues.
Model Type L with Scheme 1
Under this model, there is a funding gap of $2 million in 2016 growing to $75 million in 2022. The size of this gap,
relative to BDUs’ contribution and its reallocation under this model, is shown in the figure below.
Figure 17: Model Type L with Scheme 1: Contribution by Funding Segment (2016 - 2022)
$600
75 80
64 Gap Reallocation
$500 30 41 52
2 19 70
Target, BDU contribution and Gap
60
$400
50 50
$ million
($ million)
41
$300 40
33
446 437 435 434 433 431 430 30 25
$200
20 18
11 26
$100 10 19 23
16
12
8
11
0
$- 2016 2017 2018 2019 2020 2021 2022
2016 2017 2018 2019 2020 2021 2022
BDU Contribution - Nominal Growth Rate Gap Residential Internet Wireless data
Under this model, the contribution share of revenue for both the residential Internet and wireless data Funding
Segments would be 0.1% in 2018, increasing to 0.3% in 2022 while the BDU contribution share of revenue is
constant at 5% over this period.
Table 2: Model Type L with Scheme 1: Contribution shares of Funding Segments’ revenue
2016 2017 2018 2019 2020 2021 2022
BDUs 5.0% 5.0% 5.0% 5.0% 5.0% 5.0% 5.0%
Residential Internet 0.0% 0.1% 0.1% 0.2% 0.2% 0.2% 0.3%
Wireless data 0.0% 0.1% 0.1% 0.2% 0.2% 0.2% 0.3%
Canadian Media Producers Association 21
PwCModel Type U with Scheme 1
Under this model, there is a funding gap of $56 million in 2016 growing to $243 million in 2022. The size of this
gap, relative to BDUs’ contributions and their reallocation under this model, is shown in the figure below.
Figure 18: Model Type U with Scheme 1: Contribution by Funding Segment (2016 - 2022)
800
$300
700 243
Target, BDU contribution and Gap
207
600 143 174 $250
89 115
56 Gap Reallocation
500
$200
($ million)
$ million
400 161
$150
134
300
110
446 437 435 434 433 431 430 $100 89
200
70
52
100 $50
32 73 83
54 64
36 45
0 24
2016 2017 2018 2019 2020 2021 2022 $-
2016 2017 2018 2019 2020 2021 2022
BDU Contribution - Gap reallocation Gap Residential Internet Wireless data
Under this model, the contribution share of residential Internet and wireless data revenue is greater than the Model
Type L with gap reallocation, increasing from 0.5% in 2018 to 0.8% in 2022 while the BDU contribution share of
revenue is constant at 5% over this period.
Table 3: Model U with Scheme 1: Contribution shares of Funding Segments’ revenue
2016 2017 2018 2019 2020 2021 2022
BDUs 5.0% 5.0% 5.0% 5.0% 5.0% 5.0% 5.0%
Residential Internet 0.3% 0.4% 0.5% 0.6% 0.7% 0.8% 0.8%
Wireless data 0.3% 0.4% 0.5% 0.6% 0.7% 0.8% 0.8%
Canadian Media Producers Association 22
PwC3.4.2. Gradual reallocation (Scheme 2)
Scheme 2 i.e. ‘Gradual reallocation’ is an intermediary scheme between Scheme 1 and Scheme 3. Scheme 2 starts
with Scheme 1 i.e. ‘Gap reallocation’ contribution levels before taking a gradual approach to achieving Scheme 3
contribution levels i.e. ‘Market share-based reallocation’. Once Scheme 3 contribution levels are achieved, the
contribution levels in Scheme 2 become identical to Scheme 3.
Model Type L with Scheme 2
Under this model, there is a funding gap of $2 million in 2016 growing to $389 million in 2022. The size of this
gap, relative to BDUs’ contribution and its reallocation under this model, is shown in the figure below.
Figure 19: Model L with Scheme 2: Contribution by Funding Segment (2016 - 2022)
$600
450
389
$500 2 350 400
Target, BDU comtribution and Gap
99 180 247 303
350 Gap Reallocation
$400
300
257
250
($ million)
$300 226
200 192
446 153
$200 150
357 109
285 100
$100 228 58 123 132
182 50 94 111
146 116 71
40
0 1
$- 2016 2017 2018 2019 2020 2021 2022
2016 2017 2018 2019 2020 2021 2022
BDU Contribution - Gradual reallocation Gap Residential Internet Wireless data
Under this model, the contribution share of residential Internet and wireless data revenue increases from 1.1% in
2018 to 1.4% in 2022 while the BDU contribution share of revenue declines from 5% to 1.4% over this period.
Table 4: Model L with Scheme 2: Contribution shares of Funding Segments’ revenue
2016 2017 2018 2019 2020 2021 2022
BDUs 5.0% 4.1% 3.3% 2.6% 2.1% 1.7% 1.4%
Residential Internet 0.0% 0.5% 0.8% 1.1% 1.2% 1.3% 1.4%
Wireless data 0.0% 0.5% 0.8% 1.1% 1.2% 1.3% 1.4%
Canadian Media Producers Association 23
PwCModel Type U with Scheme 2
Under this model, there is a funding gap of $56 million in 2016 growing to $518 million in 2022. The size of this
gap, relative to BDUs’ contributions and their reallocation under this model, is shown in the figure below.
Figure 20: Model Type U with Scheme 2: Contribution by Funding Segment (2016 - 2022)
$800
$700
Target, BDU contribution and Gap
518
314 386 454 600
$600 237
151
56 500
$500 Gap Reallocation
($ million)
400
$400
342
300 294
$300 245
195
446 200
$200 374 143
314
263
$100 221 185 100 89
176
155 141 160
93 119
32 62
$- 24
0
2016 2017 2018 2019 2020 2021 2022 2016 2017 2018 2019 2020 2021 2022
BDU Contribution - Gradual reallocation Gap Residential Internet Wireless data
Under this model, the contribution share of residential Internet and wireless data revenue increases from 1.1% in
2018 to 1.8% in 2022 while the BDU contribution share of revenue declines from 5% to 1.8% over this period.
Table 5: Model Type U with Scheme 2: Contribution shares of Funding Segments’ revenue
2016 2017 2018 2019 2020 2021 2022
BDUs 5.0% 4.3% 3.6% 3.0% 2.6% 2.2% 1.8%
Residential Internet 0.3% 0.7% 1.1% 1.4% 1.6% 1.7% 1.8%
Wireless data 0.3% 0.7% 1.1% 1.4% 1.6% 1.7% 1.8%
Canadian Media Producers Association 24
PwC3.4.3. Market share-based reallocation (scheme 3)
In the market share-based allocation scheme, funding targets are allocated between the three Funding Segments in
proportion to their relative market share of revenue. Note that the relative market shares change over time
materially due to a very different growth trajectory of the three Funding Segments. 16
Model Type L with scheme 3
Figure 21: Model Type L with Scheme 3: Contribution by Funding Segment (2016 - 2022)
$600
$500
$400
201 215 228 243 257
177 189
$ million
$300
$200 130 130 131 132 132 132 132
$100
141 137 133 129 125 121 116
$-
2016 2017 2018 2019 2020 2021 2022
BDU Residential Internet Wireless data
Under this model, the contribution share of revenues is the same for all Funding Segments and declines in the same
proportion for all Funding Segments with the growth in total revenue throughout the modelled period.
Table 6: Model Type L with Scheme 3: Contribution shares of Funding Segments’ revenue
2016 2017 2018 2019 2020 2021 2022
BDUs 1.6% 1.6% 1.5% 1.5% 1.4% 1.4% 1.4%
Residential Internet 1.6% 1.6% 1.5% 1.5% 1.4% 1.4% 1.4%
Wireless data 1.6% 1.6% 1.5% 1.5% 1.4% 1.4% 1.4%
16 We note that revenue levels calculated at the nominal and real growth rates lead to the same market shares as the inflation rate subtracted
from the nominal growth rate is the same across the economy for all the sectors.
Canadian Media Producers Association 25
PwCModel Type U with scheme 3
Figure 22: Model Type U with Scheme 3: Contribution by Funding Segment (2016 - 2022):
$800
$700
$600
$500 342
313
286
$ million
238 261
$400 199 218
$300
146 150 155 160 165 170 176
$200
$100
158 158 157 157 156 156 155
$-
2016 2017 2018 2019 2020 2021 2022
BDU Residential Internet Wireless data
Under this model, the contribution share of revenue is the same for all Funding Segments and remains constant
throughout the modelled period.
Table 7: Model Type U with Scheme 3: Contribution shares of Funding Segments’ revenue
2016 2017 2018 2019 2020 2021 2022
BDUs 1.8% 1.8% 1.8% 1.8% 1.8% 1.8% 1.8%
Residential Internet 1.8% 1.8% 1.8% 1.8% 1.8% 1.8% 1.8%
Wireless data 1.8% 1.8% 1.8% 1.8% 1.8% 1.8% 1.8%
In this section we have presented three allocation schemes i.e. (i) gap reallocation (ii) gradual reallocation and (iii)
market share-based reallocation, each with a lower and upper bound target (Model Type L and Model Type U
respectively). All of these models adhere to the first three Guiding Principles (i.e. comprehensiveness, minimum
funding level and dynamism). In the next section, we assess and compare the degree of their adherence to the
remaining four guiding principles.
Canadian Media Producers Association 26
PwC4. Model option evaluation
In this section, we assess the relative adherence of the models developed in previous section on the latter four
Guiding Principles (note that by definition each option adheres to the first three Guiding Principles) as
demonstrated in the table below.
Table 8: Summary model option evaluation
Funding target: Inflation-based (Model Type L) Segment growth-based (Model Type U)
Gap Gradual Market share Gap Gradual Market share
Allocation
reallocation reallocation reallocation reallocation reallocation reallocation
scheme:
(Scheme 1) (Scheme 2) (Scheme 3) (Scheme 1) (Scheme 2) (Scheme 3)
1. Comprehensiveness By design, all models are comprehensive. Refer to 3.2
2. Minimum funding
By design, all models achieve minimum target funding. Refer to 3.3
level
3. Dynamism By design, all models allocate funds based on relative market shares. Refer to 3.4
Guiding
4. Fairness No No Yes No Somewhat Yes
principle
5. Minimum growth
Yes Yes Yes Somewhat Somewhat Somewhat
impediment
6. Pro-SME All models can be adapted to be pro-SME. Refer to section 4.2
7. Impact on Driven by business decisions of firms operating in Funding Segments. Potential mitigation
consumers strategies discussed in section 4.3
4.1. Fairness and sector contributions
Models with Scheme 3 (i.e. prepared under the market share-based reallocation modelling approach) best meet
Guiding Principle 4, fairness. Under the gap reallocation modelling approach, the lower bound models that target
inflation-based funding levels apply a disproportionately larger contribution requirement on BDUs, the segment of
the distribution sector that is now in decline. The gradual reallocation of the Funding Segments’ contribution
requirement from BDUs to the other Funding Segments as reflected in the Scheme 2 allocation is also more
consistent with the fairness principle.
Refer to the table below for a comparison of contribution requirements (shares of total Funding Segments’
contribution) between Funding Segments on an annual basis, by model.
Canadian Media Producers Association 27
PwCYou can also read