Campaspe Shire Council Port of Echuca Precinct Economic Study - February 2021
←
→
Page content transcription
If your browser does not render page correctly, please read the page content below

Campaspe Shire Council
Port of Echuca Precinct Economic Study
February 2021

Port of Echuca Precinct Economic Study

Contents

EXECUTIVE SUMMARY ........................................................................................................................... 6
1. INTRODUCTION and BACKGROUND ............................................................................................... 12
  1.1 Background ....................................................................................................................................... 12
  1.2 Port of Echuca Precinct and Key Attractions .................................................................................... 12
  1.3 Report Scope and Structure .............................................................................................................. 14
2. APPROACH .................................................................................................................................... 15
  2.1 Define Key Measures ........................................................................................................................ 15
  2.2 Define the industry and ‘in scope’ expenditure................................................................................ 16
  2.3 Define the key assumptions and collect data ................................................................................... 16
  2.4 Estimate the Economic Contribution to Echuca-Moama and Victoria ............................................. 17
  2.5 Define and present broader Social and Culture benefits.................................................................. 18
3. ECONOMIC CONTRIBUTION and EMPLOYMENT.............................................................................. 19
  3.1 Visitation and Direct Contribution .................................................................................................... 19
  3.2 Indirect and Total Contribution to Echuca-Moama and Victoria...................................................... 22
  3.3 Split between Echuca and Moama ................................................................................................... 24
  3.4 Sensitivity to change in Port Visitor Driver ....................................................................................... 25
4. INDICATIVE COST BENEFIT ANALYSIS .............................................................................................. 27
5. BROADER SOCIAL AND CULTURAL VALUES ..................................................................................... 29
  5.1 Education .......................................................................................................................................... 29
  5.2 Community Cohesion and Development .......................................................................................... 30
  5.3 Cultural Heritage Preservation.......................................................................................................... 31
  5.4 Regional Tourism Leadership ............................................................................................................ 32
  5.5 Investment and Business Attraction ................................................................................................. 32
ACRONYMS .......................................................................................................................................... 34
GLOSSARY............................................................................................................................................ 34
Appendix A: Detailed Estimation Methodology ..................................................................................... 36
Appendix B: Tourism and other Key Assumptions ................................................................................. 38

Port of Echuca Precinct Economic Report
Version 1.0 – February 2021                                                                                                                   Page 2

Table of Figures
Figure 1: PoEP Management Areas ................................................................................................................. 13
Figure 2: Methodology .................................................................................................................................... 15
Figure 3: Campaspe and Murray River LGAs ................................................................................................... 17
Figure 4: Direct Spend Quantification Methodology ...................................................................................... 36

Table of Tables
Table 1: PoEP Management Areas .................................................................................................................. 13
Table 2: Tourism Visitation .............................................................................................................................. 20
Table 3: PoEP Direct Spend (Output)............................................................................................................... 21
Table 4: PoEP Value-add for Echuca-Moama (GRP) and Victoria (GSP) .......................................................... 21
Table 5: Direct Employment for Echuca-Moama and Victoria ........................................................................ 22
Table 6: Total Economic Output ...................................................................................................................... 23
Table 7: Total Economic Value Add ................................................................................................................. 23
Table 8: Total Employment.............................................................................................................................. 24
Table 9: Echuca-Moama Profile Criteria .......................................................................................................... 24
Table 10: Economic Outputs based on Echuca/Moama split of 70%/30% ..................................................... 25
Table 11: Economic Outputs based on Echuca/Moama split of 50%/50% ..................................................... 25
Table 12: Assumptions on the role fo the PoEP in driving visitation .............................................................. 26
Table 12: Sensitivity Analysis of Economic Contribution ................................................................................ 26
Table 13: Indicative Cost Benefit Analysis ....................................................................................................... 27
Table 14: Indicative Cost Benefit Analysis using Economic Value Add ........................................................... 28
Table 15: PoEP tourism related partnerships .................................................................................................. 32
Table 16: Total Echuca-Moama Visitation ....................................................................................................... 38
Table 17: Echuca-Moama Visitor Length of Stay and Spend per Day ............................................................. 39
Table 18: Specific and Extended Stay Visitors ................................................................................................. 40
Table 18: Door Counter Visitor Reconciliation ................................................................................................ 40
Table 19: Specific Event Visitation Direct Spend ............................................................................................. 41
Table 20: Surveyed Event Key Inputs .............................................................................................................. 42
Table 21: Car Club Event Key Inputs ................................................................................................................ 43
Table 22: Weddings and Social Events Key inputs .......................................................................................... 43

Port of Echuca Precinct Economic Report
Version 1.0 – February 2021                                                                                                                   Page 3

Port of Echuca Precinct Economic Study

Version Control
   Version #               Date                                       Comment
 1.0                26 February 2021       Initial Draft
 1.1                2 Marc h 2021          Final Report
This digital file name:

Report Author Contacts
          Person                          Role
 David A Cochrane              Adviser                     Cloudstreet Economics Pty Ltd

Disclaimer:
This economic report has been prepared based on information current as of 15 February 2021 (being the
date of completion of the economic modelling), and which has been provided by Campaspe Shire Council
and other stakeholders. Since this date, material events may have occurred which are not reflected in the
report.
This report may be relied upon by Campaspe Shire Council for the purpose of understanding the indicative
economic contribution of the Port of Echuca Precinct. It should not be relied upon for any other purpose.
Other persons accessing this report should do so for their general information only as Cloudstreet
Economics has only acted for, and advised Campaspe Shire Council and has not acted for or advised
anyone else in respect of the contents of this report. Cloudstreet Economics disclaims all liability to any
party for all costs, loss, damage and liability that the third party may suffer or incur arising from or relating
to or in any way connected with the provision of the deliverables to the third party without our prior
written consent. Any commercial decisions taken by Campaspe Shire Council are not within the scope of
our duty of care and in making such decisions you should take into account the limitations of the scope of
our work and other factors, commercial and otherwise, of which you should be aware of from sources
other than our work.
Cloudstreet Economics has prepared this indicative economic analysis having relied on information
provided by Campaspe Shire Council and other stakeholders. We do not imply, and it should not be
construed that we have performed audit or due diligence procedures on any of the information provided to
us. We have not independently verified, or accept any responsibility or liability for independently verifying,
any such information nor do we make any representation as to the accuracy or completeness of the
information. We accept no liability for any loss or damage, which may result from your reliance on any
research, analyses or information so supplied.
It should also be noted that this work does not constitute a formal Cost Benefit Analysis. Further, it is
important to note that the identification of economic impact and contribution is not a precise science.

(Dr) David A Cochrane
Director
Cloudstreet Economics Pty Ltd

Port of Echuca Precinct Economic Report
Version 1.0 – February 2021                                                                             Page 4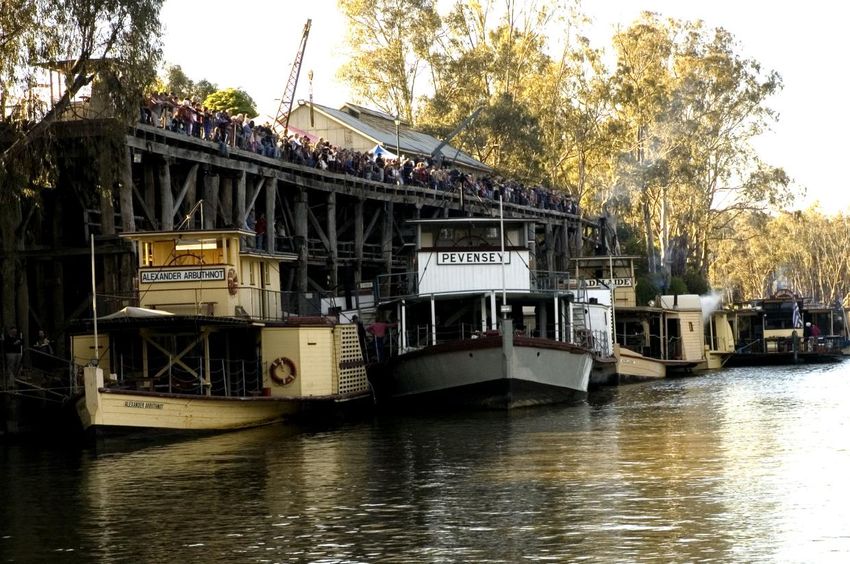
GLOSSARY
 Broader social and        Additional value not captured in the economic contribution estimate (e.g.
 culture value             recreational, conservation and educational value).

 Cost Benefit Analysis     CBA is an assessment tool used in determining whether a project or initiative is
 (CBA)                     net beneficial to the community. The key principle of CBA is to convert the
                           initiative’s costs and benefits into dollar terms and decisions over whether the
                           initiative is desirable can be informed by whether the project delivers benefits that
                           are over and above its costs.
                           An economic CBA is an economic efficiency analysis performed from the view
                           point of society (that is, Australia or a designated State or region) which includes
                           both market and non-market impacts.

 Direct contribution       The direct economic activity in Echuca-Moama and Victoria associated with PoEP’s
                           operations, including PoEP generated tourism contribution as a direct result of the
                           initiative.

 Economic contribution     Economic contribution is a measure comprising all market-related expenditure
 study                     generated by a specified industry or an activity. Economic contribution studies
                           differ from economic impact studies as they do not consider the substitution
                           impacts to other industries.

 Employment/Jobs           Number of jobs generated by an industry or attraction, expressed in terms of full
                           time equivalent (FTE) employees.

 Gross output              Market value of goods and services produced, often measured by
                           turnover/revenue. Gross output is also referred to as ‘gross economic
                           contribution’. Gross output consists of the direct impacts (or direct contribution)
                           along with the wider impacts

 Indirect or wider         Associated indirect or flow-on impacts for the rest of the economy resulting from
 contribution              the direct contribution. For instance, injections in tourism expenditures in the
                           accommodation sector will have downstream impacts through an increase in
                           expenditure in industries connected with the accommodation sector, and so on.

 Regional contribution     Economic contribution retained in particular region. Regional contribution is a
                           subset of the total economic contribution to Victoria

 REMPLAN economic          REMPLAN is an economic model that models the economic impacts of projects
 model                     and investments, large and small, to understand the likely direct and flow-on
                           implications for the economy of your area, the wider region and the state.
                           Economic impacts are presented in terms of employment, output, wages &
                           salaries and gross regional product.
                           This study adopts an input output approach to the calculation of indirect (wider)
                           economic impacts using the REMPLAN model, which provided the input/output
                           multipliers (used to calculation the indirect (wider) economic impacts) that reflect
                           the characteristics of the Echuca-Moama LGA area and Victorian economies.

 Value add                 Market value of goods and services produced, after deducting the cost of goods
                           and services used. This represents the sum of all wages, income and profits
                           generated.

Port of Echuca Precinct Economic Report
Version 1.0 – February 2021                                                                                 Page 5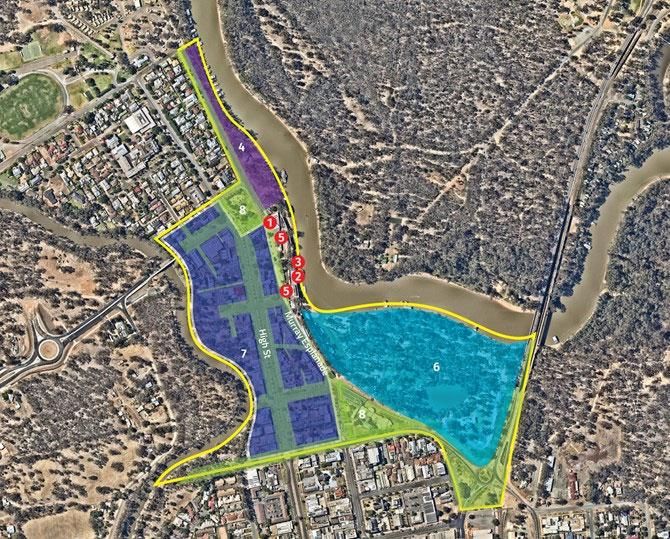
EXECUTIVE SUMMARY
This study considers and, where appropriate, quantifies the economic importance of the Port of Echuca
Precinct (“the PoEP”) to the Echuca and Moama LGAs (being Campaspe Shire Council and Murray River
Council respectively) and Victoria, by estimating its economic contribution to each of these regions, as well
as the broader social and culture value of the PoEP.

▪   The Port of Echuca Precinct
Echuca, the closest settlement on the Murray River to Melbourne, is an important part of the Shire of
Campaspe (the Council), which is set within an irrigated pastoral and agricultural district on the Murray
River, with agriculture and tourism now being Echuca's main industries. A key focus of the tourism offering
is the heritage wharf and paddlesteamer history of Echuca with the Port of Echuca being a major tourist
attraction. As well as the original wharf, this river port recreation area also features the Campaspe Shire
Council operated Discovery Centre, a museum, historic buildings, equipment displays, demonstrations and
cruises on authentic paddlesteamers, with Echuca now being known as Australia’s Paddlesteamer Capital.
A visit to the wharf and a cruise on a paddlesteamer is now one of the iconic experiences when visiting
Echuca with a number of Echuca events also centering around the Port of Echuca and the paddlesteamer
experience.
The Council involvement in the Port of Echuca began from the need to encourage economic activity
(tourism) and to ensure the preservation of nationally significant heritage. The Council is responsible for
the management and operation of these major community and tourism assets, with this precinct
encompassing the areas outlined in the following diagram and table.
Figure: PoEP Management Areas

Port of Echuca Precinct Economic Report
Version 1.0 – February 2021                                                                         Page 6
Table: PoEP Management Areas

        No          Asset/Attraction                                      Description

                                           Interpretive centre that provides ticketed access to the Wharf area
    1         Discovery Centre
                                           and open-air museum.
              Echuca Paddlesteamers        Operation of the three Council owned paddle steamers being PS
    2
              (EPS)                        Pevensey, PS Adelaide, and PS Alexander Arbuthnot.
                                           The historic timber wharf (accessible via the Discovery Centre). This
    3         Echuca Wharf
                                           includes the Cargo Shed Museum & Strathmerton Carriage.
                                           Docking and mooring area where paddlesteamers/riverboats arrive
    4         Riverboat Dock and Kiosk
                                           and depart.

                                           Heritage assets across the Precinct, including the steam engine display
    5         Heritage Assets
                                           and sawmill within the Wharf area and other Port artefacts.

    6         Aquatic Reserve              A public open space and bushland reserve area along the river.
                                           Except Council owned buildings on the western side of Murray
    7         Freehold Assets
                                           Esplanade.
              Streets/Open Spaces/Public   All public spaces, including streets, gardens/parks, retail precincts (e.g.
    8
              Infrastructure               Murray Esp, High Street).

▪       The Key Measures and Approach
This study represents an economic contribution study. Economic contribution studies generally involve two
broad steps:
▪       Calculation of direct impacts or contribution – this step involves the measurement of all direct
        (incremental) expenditures to a region as a direct result of the initiative.
▪       Calculation of wider impacts – Direct economic impacts will have associated indirect or flow-on impacts
        for the rest of the economy.
Three common indicators of an industry or economic size or value are:
▪       Gross output –Market value of goods and services produced, often measured by turnover/revenue.
        Gross output is also referred to as ‘gross economic contribution’. Gross output consists of the direct
        impacts (or direct contribution) along with the wider impacts
▪       Value added – Market value of goods and services produced, after deducting the cost of goods and
        services used
▪       Employment/Jobs – Number of jobs generated by an industry or attraction.
For the purposes of this economic contribution study, in determining the economic contribution we have
included in determining Gross Output:
▪       Expenditure of PoEP visitors who come to Echuca specifically to visit the PoEP or extend their stay to
        enable a visit to the PoEP (i.e. PoEP related tourism). This expenditure includes admission fees for the
        PoEP tourism services and, therefore, indirectly includes operational expenditure incurred by Council in
        managing the PoEP.
▪       Expenditure of visitors who come to Echuca specifically to attend an event held at the PoEP, where that
        event would not have occurred in Echuca if not for the PoEP assets (ie PoEP related event tourism).
▪       Capital expenditure incurred by Council in maintaining and developing the PoEP assets.

Port of Echuca Precinct Economic Report
Version 1.0 – February 2021                                                                                   Page 7
▪   Capital expenditure incurred by the private sector in providing direct tourism services to visitors to the
    PoEP (ie leveraged capital expenditure).
▪   People directly employed by Council in managing the PoEP assets.
The resultant direct and indirect economic contribution has then been determined for the Echuca-Moama
region and Victoria.

▪   Economic Contribution
As is demonstrated in the tables following, the key economic outputs are:
    Visitation to the Port
    ▪ The PoEP played a role in attracting (on average over the 3 years from 2017 to 2019) approximately
        140,000 visitors to Echuca-Moama or 8.5% of all visitors, with approximately 50% of these visitors
        coming specifically because of the PoEP, 20% coming specifically to attend an event at the PoEP
        and the remaining 30% extending their stay to visit the Port.
    ▪ Over 85% of visitors came from Melbourne or regional Victoria with approximately 11% being
        interstate visitors (predominantly New South Wales and South Australia). International visitation
        (at 2%) is minimal and not a key source of visitors.
    Direct Economic contribution
    The direct economic contribution of PoEP’s generated tourism to Echuca-Moama for the 2018/19 year
    is estimated at:
    ▪ $31.8 million with a value add of $14 million at a regional level (direct Gross Regional Product), and
    ▪ a value add of $14.1 million at a Victorian level (direct Gross State Product).
    This output represents around 7% of Echuca-Moama’s total Tourism Output.
    Total Economic Contribution
    The total gross economic contribution to the Echuca-Moama economy resulting from PoEP’s 2018/19
    operations (including tourism contribution) is estimated at :
    ▪ $54.1 million ($31.8 million in direct contribution and $22.3 million in indirect contribution) to
        Echuca-Moama, including a total value added contribution of $24.7 million
    ▪ $78.7 million ($31.8 million in direct contribution and $46.9 million in indirect contribution) to
        Victoria, including a total value added contribution of $36.1 million.
    Employment
    ▪ For the 2018/19 year the PoEP supported a total of 230 FTEs in Echuca Moama (158 directly and a
       further 72 indirectly).
    ▪ From a Victorian perspective, the total positions supported is estimated at 293 FTEs (159 directly
       and a further 131 indirectly).

The table below summaries the Precinct’s economic contribution by each area for the year ended 30 June
2019.

Port of Echuca Precinct Economic Report
Version 1.0 – February 2021                                                                          Page 8
Table: Economic Contribution of the Port of Echuca Precinct

                 Echuca-Moama                                               Victoria
                                     Direct                                                 Direct
          Output                     $31.8m                     Output                     $31.8m
          $54.1m                     Indirect                   $78.7m                     Indirect
                                     $22.3m                                                $46.9m
                                     Direct                                                 Direct
         Value add                   $14.0m                    Value add                   $14.1m
          $24.8m                     Indirect                   $36.1m                     Indirect
                                     $10.8m                                                $22.0m
                                     Direct                                                 Direct
        Employment                     158                    Employment                     162
           230                       Indirect                    293                       Indirect
                                       72                                                    131

The estimated economic contribution has been developed based on a number of key assumptions and
variables and, in particular, the assumption on the extent to which the existence of the PoEP is a driver to
visitation from both the perspective of being the primary reason for visiting (i.e. the total visit is because of
the PoEP) and, for other visitors, a key (but not primary) driver which results in them extending their stay.
A sensitivity analysis has therefore been completed based on a 1% increase in this key assumption across all
visitor categories (e.g. the number of overnight visitors who have the PoEP as the primary reason for their
visit increases from 10% of identified holiday visitors to 11%).
This sensitivity analysis indicated that this increase would result in Total Economic Output for Echuca-
Moama in 2019 increasing by $4.25 million or 8% from $54.1 million to $58.34 million. Therefore, while the
economic benefits are sensitive to this assumption, it would require a substantial change in the assumption
to result in a significant change in the final outputs.
Given the lack of research available on which to base this key assumption, it is recommended that Council
consider the completion of future research to more definitely determine the role of the PoEP in driving
visitation.

▪   Indicative Cost Benefit Analysis
Cost-benefit analysis (CBA) is an economic efficiency analysis that, unlike economic activity or contribution
analysis, is concerned with overall economic efficiency and social welfare measures.
Detailed below is an indicative CBA for the PoEP based on:
    ▪    the identified direct economic Gross Output of the PoEP (i.e. the identified Direct Spend),
    ▪    with this then expressed as a ratio against the total spend incurred by Council (being operating and
         capital expenditure excluding depreciation).
This ratio, therefore, represents the ratio from a Council perspective (i.e. the Direct Spend in the
community resulting from the Council support of the PoEP) rather than from a total Community
perspective.

Port of Echuca Precinct Economic Report
Version 1.0 – February 2021                                                                            Page 9
Table: Indicative Cost Benefit Analysis
Port of Echuca Precinct Economic Assessment
Indicative Cost Benefit Analysis
Year ending 30 June Echuca Only - 2019
2016 2017 2018 70%/30% Split 50%/50% Split
BENEFITS
Impacts on Visitation
- Intrastate Visitors $'000 13,135 17,672 13,928 9,749 6,964
- Interstate Visitors $'000 2,618 2,976 3,321 2,325 1,661
- International Visitors $'000 558 404 308 216 154
- Specific Event Visitation $'000 9,374 8,430 12,832 8,982 6,416
Total Visitor Economy Impact $'000 25,686 29,483 30,389 21,273 15,195
Leveraged Capital Expenditure $'000 205 - 25 18 13
TOTAL BENEFITS $'000 $ 25,891 $ 29,483 $ 30,414 $ 21,290 $ 15,207
COSTS
Port Capital Costs $'000 995 1,455 1,346 1,346 1,346
Port Operating Costs $'000 2,717 2,520 2,961 2,961 2,961
TOTAL COSTS $'000 $ 3,712 $ 3,975 $ 4,307 $ 4,307 $ 4,307
NET BENEFITS $'000 $ 22,179 $ 25,508 $ 26,108 $ 16,983 $ 10,900
INDICATIVE COST BENEFIT RATIO No. 7.0 7.4 7.1 4.9 3.5
This output indicates that, from a Council perspective, the PoEP provides a gross return of approximately 7
times the Council investment in the operations across Echuca- Moama. It also suggests that, from an
Echuca perspective, this ratio ranges between 3.5 – 4.9, depending on the allocation of contribution across
the two regions of Echuca and Moama.
▪ Broader Social and Cultural Values
The economic contribution estimate above does not fully capture the value that Victoria receives from the
PoEP. The Precinct generates addition social and cultural values. While it is possible to value a number of
these additional social and community values, such quantification would require extensive additional
research which is beyond the scope of this project. However, such values are equally important and have,
therefore, been considered at a qualitative level. These additional benefits include:
▪ Education - the Precinct provides a range of education programs that are strongly aligned to the
objectives of Victorian school curriculum with the Museum also educating the wider visitor group. The
Discovery Centre hosted a number of school groups in the 2018/19 year with it hosting over 7,300 fee
paying school students. These students also had the opportunity, through a School Paddlesteamer
Cruise, to experience the story of Australia's pioneering spirit and learn how Australia's inland river
system connected a fledgling colony to its growing cities and the outside world through.
▪ Cultural heritage preservation – the PoEP and the Paddlesteamers plays a critical role in conserving the
important heritage of the region with a number of the Precinct assets having received various awards
of heritage significance (eg National Heritage Listing, listing on the Victorian heritage Register).
▪ Community cohesion and development - the PoEP plays an important role in building community
cohesion through the use of volunteers to support the operations along with the support provided to a
number of community groups and the number of community events held in the PoEP.
Port of Echuca Precinct Economic Report
Version 1.0 – February 2021 Page 10▪ Regional tourism leadership - as the region’s most iconic tourist attraction, the PoEP plays a significant
role in driving total tourism. In support of this, the Port of Echuca (through Campaspe Shire Council)
maintains a number of partnerships with other tourism providers and associations.
▪ Investment and business attraction - the PoEP provides a major attraction for tourists who utilise the
accommodation, food and beverage services of private sector providers while also visiting other tourist
attractions and the retail precinct. As such, the PoEP plays a significant role in attracting further
investment in the region.
Port of Echuca Precinct Economic Report
Version 1.0 – February 2021 Page 111. INTRODUCTION and BACKGROUND 1.1 Background This study considers and, where appropriate, quantifies the economic importance of the Port of Echuca Precinct (“the PoEP”) to the Echuca and Moama LGAs (being Campaspe Shire Council and Murray River Council respectively) and Victoria, by estimating its economic contribution to each of these regions, as well as the broader social and culture value of the PoEP. 1.2 Port of Echuca Precinct and Key Attractions Echuca, the closest settlement on the Murray River to Melbourne, is an important part of the Shire of Campaspe, which is set within an irrigated pastoral and agricultural district on the Murray River. Echuca was surveyed in 1854 and quickly became one of Australia's busiest inland ports, with paddlesteamers ferrying supplies throughout Australia's interior via the river network. Improving road and rail transport eventually took over, with cargo transport on the river through the Port of Echuca ceasing in the very early 1900s. Since then, agriculture and tourism have developed as Echuca's main industries. The heyday of paddlesteamers and river trade has left a historic legacy to Echuca around which much of today’s tourism is built. The original red gum wharf was constructed in stages from 1865 as a three-level structure to allow for the rise and fall of the river, ultimately reaching a length of 1200 metres. Only a small section of the wharf remains today, preserved as part of the recreated Port of Echuca tourist attraction, and serving as a great viewing deck of the Murray River and surrounding bush. As well as the wharf, this river port recreation area also features the Campaspe Shire Council operated Discovery Centre, a museum, historic buildings, equipment displays, demonstrations and cruises on authentic paddlesteamers, with Echuca now being known as Australia’s Paddlesteamer Capital. A visit to the wharf area and a cruise on a paddlesteamer is now one of the iconic experiences when visiting Echuca with a number of Echuca events also centering around the Port of Echuca and the paddlesteamer experience. Campaspe Shire Council’s (the Council) involvement in the Port of Echuca began from the need to encourage economic activity (tourism) and to ensure the preservation of nationally significant heritage. The Council is responsible for the management and operation of these major community and tourism assets and operations of the Port of Echuca Precinct (PoEP), with this precinct encompassing the areas outlined in the following diagram and table. Port of Echuca Precinct Economic Report Version 1.0 – February 2021 Page 12
Figure 1: PoEP Management Areas

Table 1: PoEP Management Areas

     No         Asset/Attraction                                         Description

                                          Interpretive centre that provides ticketed access to the Wharf area
 1        Discovery Centre
                                          and open-air museum.
          Echuca Paddlesteamers           Operation of the three Council owned paddle steamers being PS
 2
          (EPS)                           Pevensey, PS Adelaide, and PS Alexander Arbuthnot.
                                          The historic timber wharf (accessible via the Discovery Centre). This
 3        Echuca Wharf
                                          includes the Cargo Shed Museum & Strathmerton Carriage.
                                          Docking and mooring area where paddlesteamers/riverboats arrive
 4        Riverboat Dock and Kiosk
                                          and depart.

                                          Heritage assets across the Precinct, including the steam engine display
 5        Heritage Assets
                                          and sawmill within the Wharf area and other Port artefacts.

 6        Aquatic Reserve                 A public open space and bushland reserve area along the river.
                                          Except Council owned buildings on the western side of Murray
 7        Freehold Assets
                                          Esplanade.
          Streets/Open Spaces/Public      All public spaces, including streets, gardens/parks, retail precincts (e.g.
 8
          Infrastructure                  Murray Esp, High Street).

These in total represent all the assets (and associated services) within the total Precinct.

Port of Echuca Precinct Economic Report
Version 1.0 – February 2021                                                                                  Page 13
1.3 Report Scope and Structure
The PoEP is important to the growth of Echuca and Moama with a range of world class facilities. These
facilities attract visitors from across Victoria, interstate and overseas and include cultural and historically
significant assets, strong connections into the Echuca historical retail precinct and large amounts of open
green space for events and recreation.
To capture and articulate the economic, social and community benefits from the PoEP Precinct, this report
is structured in the following manner.
▪ Section 2 – outlines the approach in capturing and assessing the economic, social and community
benefits
▪ Section 3 – details the economic contribution and employment from visitation and business activities in
the region and Victoria from the PoEP activities
▪ Section 4 – provides an indicative Cost Benefit Analysis from the Council perspective
▪ Section 5 – outlines at a quantitative level the broader social and culture benefits of the Precinct.
Port of Echuca Precinct Economic Report
Version 1.0 – February 2021 Page 142. APPROACH
The approach for this economic contribution study is presented below.
Figure 2: Methodology
PHASE ONE PHASE TWO PHASE THREE PHASE FOUR PHASE FIVE
Define key measures Define the industry Define assumptions Estimate economic Define and present
and collect data contribution to VIC broader value
Economic contribution Broader value
2.1 Define Key Measures
Economic contribution is a measure comprising all market-related expenditure generated by a specified
industry or an activity. Economic contribution studies differ from economic impact studies as they do not
consider the substitution impacts to other industries (i.e. what might happen to expenditures if the specific
industry or activity were lost). As noted by Watson, Wilson, Thilmany and Winter (2007):
Contribution analysis is a descriptive analysis that simply tracks the gross economic activity of the
given event, policy, or industry as the dollars cycle through the region’s economy. Policies or events
can be analysed for the extent to which they support the gross economic activity of a given industry
in a given region. An economic contribution analysis says nothing about how spending on one
industry may crowd out spending in another industry.1
As such economic contribution is a gross measure rather than a net measure.
Economic contribution studies generally involve two broad steps:
▪ Calculation of direct impacts or contribution – this step involves the measurement of all direct
(incremental) expenditures to a region as a direct result of the initiative.
▪ Calculation of wider impacts – Direct economic impacts will have associated indirect or flow-on impacts
for the rest of the economy. For instance, injections in tourism expenditures in the accommodation
sector will have downstream impacts through an increase in expenditure in industries connected with
the accommodation sector, and so on.
Three common indicators of an industry or economic size or value are:
▪ Gross output –Market value of goods and services produced, often measured by turnover/revenue.
Gross output is also referred to as ‘gross economic contribution’. Gross output consists of the direct
impacts (or direct contribution) along with the wider impacts
▪ Value added – Market value of goods and services produced, after deducting the cost of goods and
services used
▪ Employment/Jobs – Number of jobs generated by an industry or attraction.
All three measures are valuable in their own right. Industry output is a measure of production, value add is
a measure of wealth generation, and arguably, employment is a measure of the distribution of income.
In comparing an industry’s size against others, it is generally accepted to discuss this in terms of its industry
value add. Industry value add measures economic activities net of the costs of production (that is, inputs
sourced from other sectors), from the industry’s outputs. This avoids the inclusion of revenues to other
industries and any associated double counting. In practice, industry value add largely comprises wages,
1
Watson, Wilson, Thilmany and Winter (2007) Determining Economic Contributions and Impacts: What is the
difference and why do we care? Journal of Regional Analysis and Policy 37 (2):140-146
Port of Echuca Precinct Economic Report
Version 1.0 – February 2021 Page 15salaries and the operating surplus of an industry (i.e. the industry’s income). The Study looks at all three
measures, but attention should be placed on industry value add measures when making comparisons to
other industries. The value add measure is commonly put forward as the most appropriate measure of an
industry’s contribution to the national economy.
2.2 Define the industry and ‘in scope’ expenditure
The majority of the economic contribution for the PoEP represent tourism services. The Australian Bureau
of Statistics (ABS) records output and expenditure by ANZSIC (Australia and New Zealand Standard Industry
Classifications). ANZSIC does not formally have a specific tourism industry classification. However, ABS has
developed Tourism Satellite Accounts which represent the estimated typical distribution of a dollar spent
by a tourist across 20 industry groupings. The classification within these Tourism Satellite Accounts will be
used to represent the Tourism Industry impacts in this study.
As noted below, the study will also consider the associated capital expenditure on PoEP and related assets,
with the standard construction industry classification being adopted to represent this capital expenditure.
An issue regarding economic contribution studies is the definition of study boundaries. That is, what are the
in-scope expenditures? For the purposes of this economic contribution study, we have included:
▪ Expenditure of PoEP visitors who come to Echuca specifically to visit the PoEP or extend their stay to
enable a visit to the PoEP (i.e. PoEP related tourism). This expenditure includes admission fees for the
PoEP tourism services and, therefore, indirectly includes operational expenditure incurred by Council in
managing the PoEP.
▪ Expenditure of visitors who come to Echuca specifically to attend an event held at the PoEP, where that
event would not have occurred in Echuca if not for the PoEP assets (ie PoEP related event tourism).
▪ Capital expenditure incurred by Council in maintaining and developing the PoEP assets.
▪ Capital expenditure incurred by the private sector in providing direct tourism services to visitors to the
PoEP (ie leveraged capital expenditure).
▪ People directly employed by Council in managing the PoEP assets.
2.3 Define the key assumptions and collect data
Our assessment of the economic contribution of the PoEP is primarily based on:
▪ Information provided by the Council, including information provided for previous studies completed by
Cloudstreet Economics encompassing financial statements, attendance information at the Discovery
Centre and for EPS, Discovery Centre door counter information and visitation history
▪ Domestic and international tourism data on Victoria and the Echuca- Moama district sourced from
Murray Regional Tourism quarterly reports (which, in turn, is based on Tourism Research Australia
surveying and reports)
▪ Council event assessments
▪ Council summary of developer applications for the PoEP and the associated retail precinct
▪ Supplementary desktop research of publicly available information
▪ Existing studies and research on the broader social and culture value associated with regional tourism
and heritage assets
▪ Cloudstreet Economic’s existing industry knowledge and experience.
The approach adopted in this Study, including assumptions, is presented in Appendix A to B. This approach
has been developed based on the available information.
Port of Echuca Precinct Economic Report
Version 1.0 – February 2021 Page 162.4 Estimate the Economic Contribution to Echuca-Moama and Victoria
The direct and indirect economic contribution (defined in Section 2.1) of the PoEP to the Echuca-Moama
and the Victorian economy has been calculated by estimating the direct contribution associated with:
▪ PoEP related tourism expenditure
▪ PoEP related event tourism expenditure
▪ Council capital expenditure
▪ Leveraged capital expenditure
For the purposes of this study, two regions have been defined for which the economic contribution of the
Precinct will be calculated, namely the Echuca-Moama Region and Victoria.
The Echuca-Moama Region refers to the Campaspe Shire Council and Murray River Council LGAs
respectively, which cover the areas outlined in the maps below.
Figure 3: Campaspe and Murray River LGAs
Campaspe Shire LGA
Murray River Council
Port of Echuca Precinct Economic Report
Version 1.0 – February 2021 Page 17The relevant direct expenditure for the Echuca-Moama region has been determined, with the indirect or
flow-on effect being estimated for the rest of the economy resulting from the direct expenditure.
This study adopts an input output approach to the calculation of indirect (wider) economic impacts. The
REMPLAN model was used to source input/output multipliers that reflect the characteristics of the Echuca-
Moama LGA area and Victorian economies. The REMPLAN model does not specifically determine economic
impacts for the combined Echuca-Moama LGAs. While these can be developed, the cost associated with
this was not considered warranted. Rather, as the economy of Echuca and the wider Campaspe Shire is
similar to that of Moama, the economic impacts and multipliers for Campaspe Shire have been used as a
substitute for the Echuca-Moama region.
The REMPLAN model accounts for ‘leakage’ of direct expenditure from the economy in its multipliers.
Input output models are often criticised when used in economic impact assessments as they do not
consider capacity constraints in the economy (e.g. full employment). Such constraints limit the extent to
which economic impacts can increase in a linear fashion with changes in demand. The alternative
Computable General Equilibrium (CGE) approach addresses some of these issues, although the nature and
scale of this project did not warrant the use a detailed CGE analysis at this time.
2.5 Define and present broader Social and Culture benefits
The economic contribution estimate does not fully capture the value that Victoria receives from the PoEP.
The Precinct generates addition value associated with:
▪ Use value – Value, in addition to the value represented by the price paid for admission to attractions
within the Precinct, obtained from the direct use of Precinct
▪ Non-use values – Value that the Victorian community assigns to the Precinct, even if they are not
regular visitors
with these representing the social and community values resulting from the PoEP.
While it is possible to value a number of these additional social and community values, such quantification
would require extensive additional research which is beyond the scope of this project. However, such
values are equally important and have, therefore, been considered at a qualitative level. These additional
benefits include:
▪ Education - the Precinct provides a range of education programs that are strongly aligned to the
objectives of Victorian school curriculum with the Museum also educating the wider visitor group.
▪ Cultural heritage preservation – the PoEP and the Paddlesteamers plays a critical role in conserving the
important heritage of the region.
▪ Community cohesion and development - the PoEP plays an important role in building community
cohesion through the use of volunteers to support the operations along with the support provided to a
number of community groups.
▪ Regional tourism leadership - as the region’s most iconic tourist attraction, the PoEP plays a significant
role in driving total tourism. In support of this, the Port of Echuca (through Campaspe Shire Council)
maintains a number of partnerships with other tourism providers and associations.
▪ Investment and business attraction - the PoEP provides a major attraction for tourists who utilise the
accommodation, food and beverage services of private sector providers while also visiting other tourist
attractions and the retail precinct. As such, the PoEP plays a significant role in attracting further
investment in the region.
Port of Echuca Precinct Economic Report
Version 1.0 – February 2021 Page 183. ECONOMIC CONTRIBUTION and EMPLOYMENT
Visitation to the Port
▪ The PoEP played a role in attracting (on average over the 3 years from 2017 to 2019)
approximately 140,000 visitors to Echuca-Moama or 8.5% of all visitors, with approximately
50% of these visitors coming specifically because of the PoEP, 20% coming specifically to attend
an event at the PoEP and the remaining 30% extending their stay to visit the Port.
▪ Over 85% of visitors came from Melbourne or regional Victoria with approximately 11% being
interstate visitors (predominantly New South Wales and South Australia). International
visitation (at 2%) is minimal and not a key source of visitors.
Direct Economic contribution
The direct economic contribution of PoEP’s generated tourism to Echuca-Moama for the 2018/19
year is estimated at:
▪ $31.8 million with a value add of $14 million at a regional level (direct GRP), and
▪ a value add of $14.1 million at a Victorian level (direct GSP).
This output represents around 7% of Echuca-Moama’s total Tourism Output.
Total Economic Contribution
The total gross economic contribution to the Echuca-Moama economy resulting from PoEP’s
2018/19 operations (including tourism contribution) is estimated at :
▪ $54.1 million ($31.8 million in direct contribution and $22.3 million in indirect contribution) to
Echuca-Moama, including a total value added contribution of $24.7 million
▪ $78.7 million ($31.8 million in direct contribution and $46.9 million in indirect contribution to
Victoria, including a total value added contribution of $36.1 million.
Employment
▪ For the 2018/19 year the PoEP supported a total of 230 FTEs in Echuca Moama (158 directly
and a further 72 indirectly).
▪ From a Victorian perspective, the total positions supported is estimated at 293 FTEs (159
directly and a further 131 indirectly).
3.1 Visitation and Direct Contribution
This section presents the direct economic contribution to the Echuca and Moama LGAs associated with:
▪ Tourism - Tourism contribution from the PoEP’s key attractions disaggregated by origin of visitor and
the role of the Port in driving the visitation
▪ Capital Spend – the contribution of capital projects completed by Council in the PoEP along with
additional private sector capital spend on identified specific projects completed to support the PoEP
and visitors to the Port.
The identified direct economic contribution does not include:
▪ Operational spend – the net operational spend of Council in managing the PoEP i.e. the cost to Council
of operations less revenue received (which is included in the Tourism Spend) and depreciation (which is
replaced by the inclusion of the Council capital spend).
▪ Additional private sector capital expenditure – while the estimate includes specifically identified private
sector projects, this is a conservative estimate which does not take into account unidentified additional
private sector business spends (as discussed further in Section 5).
Port of Echuca Precinct Economic Report
Version 1.0 – February 2021 Page 19Visitation Levels to the Port
The estimate of tourism visitation resulting from the PoEP is summarised in the table below, with the
approach adopted in estimating this visitation level and the associated information sources and key
assumptions detailed in Appendices A and B respectively.
Table 2: Tourism Visitation
Port of Echuca Precinct Economic Assessment
Tourism Visitor Numbers
2017 2018 2019
Day trip O/night Total Day trip O/night Total Day trip O/night Total
Total Visitor Numbers
- Interstate '000 95.3 142.7 238.0 88.3 142.9 231.2 70.8 151.4 222.2
- Intrastate '000 857.7 580.3 1,438.0 794.7 692.0 1,486.7 637.2 638.2 1,275.4
- International '000 - 12.0 12.0 - 12.0 12.0 - 13.0 13.0
Total Visitor Numbers '000 953.0 735.0 1,688.0 883.0 846.9 1,729.9 708.0 802.6 1,510.6
Port Visitor Numbers by Origin
- Intrastate '000 44.0 49.5 93.4 47.9 63.9 111.9 37.3 51.0 88.3
- Interstate '000 1.2 14.0 15.2 1.3 14.2 15.5 1.1 14.2 15.3
- International '000 - 3.3 3.3 - 2.3 2.3 - 1.7 1.7
'000 45.1 66.7 111.9 49.3 80.4 129.7 38.4 66.9 105.3
- Specific Event Visitation '000 6.1 18.1 24.2 5.1 16.3 21.4 4.2 20.4 24.7
Total Direct Spend '000 51.2 84.9 136.1 54.4 96.7 151.1 42.6 87.3 129.9
Visitor Number by PoEP role in driving visitation
- Port is the primary driver for visiting '000 45.1 26.0 71.1 49.3 33.3 82.5 38.4 24.1 62.5
- Extended stay to visit Port '000 - 40.8 40.8 - 47.2 47.2 - 42.8 42.8
- Specific Event visitation '000 6.1 18.1 24.2 5.1 16.3 21.4 4.2 20.4 24.7
Total Visitors as a result of the PoEP '000 51.2 84.9 136.1 54.4 96.7 151.1 42.6 87.3 129.9
% of Total Visitors attributable to Port % 5% 12% 8% 6% 11% 9% 6% 11% 9%
This report estimates that:
▪ the PoEP played a role in attracting (on average over the 3 years from 2017 to 2019) approximately
140,000 visitors to Echuca-Moama or 8.5% of all visitors, with approximately 50% of these visitors
coming specifically because of the PoEP, 20% coming specifically to attend an event at the PoEP and the
remaining 30% extending their stay to visit the Port.
▪ over 85% of visitors came from Melbourne or regional Victoria with approximately 11% being interstate
visitors (predominantly New South Wales and South Australia). International visitation (at 2%) is
minimal and not a key source of visitors.
Direct Spend (Output) and Direct Value -add (GRP and GSP)
In addition to the economic contribution generated by operations and construction expenditure, the PoEP
also contributes to the Echuca-Moama economy via the expenditure of PoEP visitors either before and/or
after visiting the Precinct.
Tourism generates an economic contribution to the region and the state through, for example, expenditure
on tourism related product and services such as visitor admission fees, accommodation, meals, retail and
recreation.
Port of Echuca Precinct Economic Report
Version 1.0 – February 2021 Page 20Table 3: PoEP Direct Spend (Output)
Port of Echuca Precinct Economic Assessment
Direct Spend (Output)
2017 2018 2019
Day trip O/night Total Day trip O/night Total Day trip O/night Total
Direct Tourism Spend by Visitor Origin
- Intrastate $'000 5,583 7,552 13,135 5,753 11,919 17,672 4,252 9,676 13,928
- Interstate $'000 149 2,469 2,618 159 2,816 2,976 123 3,198 3,321
- International $'000 - 558 558 - 404 404 - 308 308
$'000 5,732 10,579 16,312 5,913 15,140 21,052 4,375 13,182 17,557
- Specific Event Visitation $'000 172 9,203 9,374 696 7,734 8,430 586 12,247 12,832
Total Direct Spend $'000 5,904 19,782 25,686 6,609 22,874 29,483 4,961 25,429 30,389
Direct Tourism Spend by PoEP role in driving visitation
$'000
- Port is the primary driver for visiting 5,732 8,092 13,824 5,913 11,696 17,609 4,375 9,908 14,283
- Extended stay to visit Port $'000 - 2,488 2,488 - 3,444 3,444 - 3,274 3,274
- Specific Event visitation $'000 172 9,203 9,374 696 7,734 8,430 586 12,247 12,832
Total Tourism Direct Spend $'000 5,904 19,782 25,686 6,609 22,874 29,483 4,961 25,429 30,389
Direct Capital Spend
- Council Capital Expenditure $'000 995 1,455 1,346
- Leveraged Capital Expenditure$'000 205 - 25
Total Direct Capital Expenditure
$'000 1,200 1,455 1,371
Total Direct Spend $'000 $ 26,886 $ 30,937 $ 31,760
PoEP’s direct gross output over the 3 years from 2017 to 2019 was an average of $29.9 million, consisting
of:
• Tourism contribution of $28.5 million, including $12.7 million value added (GRP)
• Capital contribution of $1.4 million, including $0.4 million value added (GRP).
The direct economic contribution of PoEP’s generated tourism to Echuca-Moama for the 2018/19 year is
estimated at $31.8 million with a value add of $14 million at a regional level (GRP) and $14.1 million at a
Victorian level (GSP). This output represents around 7% of Echuca-Moama’s total Tourism Output2.
Table 4: PoEP Value-add for Echuca-Moama (GRP) and Victoria (GSP)
Port of Echuca Precinct Economic Assessment
Direct Economic Value-add for Echuca-Moama (GRP) and Victoria (GSP)
Year ended 30 June
2017 2018 2019
Direct Value-add to Echuca-Moama Region (GRP)
Tourism Spend $'000 11,448.3 13,140.5 13,544.6
Capital Spend $'000 374.3 453.8 427.7
Total Value-add $'000 $ 11,823 $ 13,594 $ 13,972
Direct Value-add to Victoria (GSP)
Tourism Spend $'000 11,571.3 13,281.7 13,690.1
Capital Spend $'000 353.9 429.0 404.3
Total Value-add $'000 $ 11,925 $ 13,711 $ 14,094
2
Murray River Tourism’s quarterly ‘Travel to the Murray Region’ report estimates the total Tourism Spend for Echuca Moama for
30 June 2019 to be $432 million.
Port of Echuca Precinct Economic Report
Version 1.0 – February 2021 Page 21Direct Employment
The average employment (FTE) generated from the PoEP from the tourism expenditure of visitors along
with the Precinct capital expenditure is 148 FTEs at a regional level and 152 FTEs at a Victorian level. These
are in addition to the approximate 20 Council FTE jobs used to manage the operations of the PoEP including
the Paddlesteamers.
Table 5: Direct Employment for Echuca-Moama and Victoria
Port of Echuca Precinct Economic Assessment
Employment for Echuca-Moama and Victoria
Year ended 30 June
2017 2018 2019
Direct Employment to Echuca-Moama Region
Tourism Spend No. 131 150 155
Capital Spend No. 3 3 3
Total Value-add No. 134 154 158
Direct Employment to Victoria (GSP)
Tourism Spend No. 134 154 159
Capital Spend No. 3 3 3
Total Direct Employment No. 137 157 162
3.2 Indirect and Total Contribution to Echuca-Moama and Victoria
Indirect or wider economic contribution estimates the associated flow-on impacts for the rest of the
economy from the direct expenditure.
The total gross contribution to the Echuca-Moama economy resulting from PoEP’s 2018/19 operations
(including tourism contribution) was $54.1 million ($31.8 million in direct contribution and $22.3 million in
indirect contribution), based on the assumed direct contribution (see section 3.1) and REMPLAN analysis.
This includes a total value added contribution of $24.7 million (see below).
The total gross contribution to Victoria resulting from PoEP’s 2018/19 operations (including tourism
contribution) was $78.7 million ($31.8 million in direct contribution and $46.9 million in indirect
contribution), based on the assumed direct contribution (see section 3.1) and REMPLAN analysis. This
includes a total value added contribution of $36.1 million (see below).
Port of Echuca Precinct Economic Report
Version 1.0 – February 2021 Page 22Table 6: Total Economic Output
Port of Echuca Precinct Economic Assessment
Total Economic Output
Echuca-Moama Victoria
2017 2018 2019 2017 2018 2019
Direct Impacts
Tourism Expenditure $'000 25,686 29,483 30,389 25,686 29,483 30,389
Capital Expenditure $'000 1,200 1,455 1,371 1,200 1,455 1,371
Total Direct Impact $'000 26,886 30,937 31,760 26,886 30,937 31,760
Indirect Impacts
Tourism Expenditure $'000 17,723 20,343 20,969 37,373 42,897 44,217
Capital Expenditure $'000 1,191 1,444 1,361 2,389 2,896 2,729
Total Indirect Impact $'000 18,915 21,787 22,330 39,762 45,793 46,946
Total Impacts
Tourism Expenditure $'000 43,409 49,826 51,358 63,059 72,380 74,606
Capital Expenditure $'000 2,391 2,899 2,732 3,589 4,350 4,100
Total Impact $'000 45,801 52,725 54,090 66,648 76,731 78,706
Table 7: Total Economic Value Add
Port of Echuca Precinct Economic Assessment
Total Economic Value Add
Echuca-Moama (GRP) Victoria (GSP)
2017 2018 2019 2017 2018 2019
Direct Impacts
Tourism Expenditure $'000 11,448 13,140 13,545 11,571 13,282 13,690
Capital Expenditure $'000 374 454 428 354 429 404
Total Direct Impact $'000 11,823 13,594 13,972 11,925 13,711 14,094
Indirect Impacts
Tourism Expenditure $'000 8,643 9,921 10,226 17,646 20,255 20,877
Capital Expenditure $'000 503 609 574 1,017 1,233 1,162
Total Indirect Impact $'000 9,146 10,531 10,801 18,663 21,487 22,039
Total Impacts
Tourism Expenditure $'000 20,092 23,062 23,771 29,218 33,536 34,568
Capital Expenditure $'000 877 1,063 1,002 1,371 1,662 1,566
Total Impact $'000 20,969 24,125 24,773 30,588 35,198 36,134
The PoEP is also an important provider of employment opportunities for the region and for Victoria. For the
2018/19 year the PoEP supported a total of 230 FTEs in Echuca Moama (158 directly and a further 72
indirectly). From a Victorian perspective, the total positions supported is estimated at 293 FTEs (159
directly and a further 131 indirectly).
Port of Echuca Precinct Economic Report
Version 1.0 – February 2021 Page 23You can also read