Puhoi to Wellsford Toll Modelling Assessment - NZTA
←
→
Page content transcription
If your browser does not render page correctly, please read the page content below
Puhoi to Wellsford Toll Modelling Assessment

Prepared for NZ Transport Agency - Wellington
Prepared by Beca Limited

30 April 2020

                                                Puhoi to Wellsford Toll Modelling Assessment | 3821064 | NZ1-16560364-31 0.31 | 29 April 2020 | 1

                         Creative people together transforming our world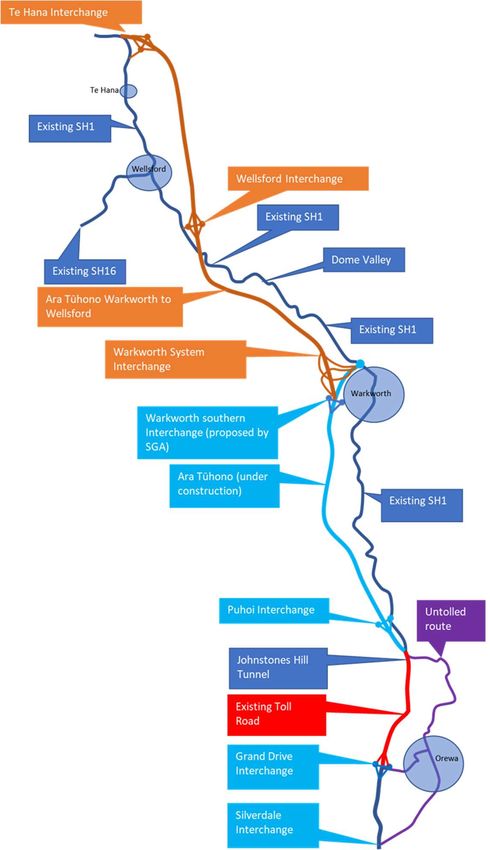
| Puhoi to Wellsford Toll Modelling Assessment|

Contents

Executive Summary ................................................................................................ 1
1    Introduction ........................................................................................................ 4
     1.1    Purpose............................................................................................................................................ 4
     1.2    Scope and Limitations ..................................................................................................................... 4
     1.3    Ara Tūhono Corridor ........................................................................................................................ 4
     1.4    Other Projects .................................................................................................................................. 6
     1.5    Study Approach ............................................................................................................................... 6
     1.6    Report Structure .............................................................................................................................. 6

2    Modelling Methodology..................................................................................... 7
     2.1    Approach.......................................................................................................................................... 7
     2.2    Regional Demand Model ................................................................................................................. 7
     2.3    Saturn Corridor Traffic Model .......................................................................................................... 7
     2.4    Toll Diversion Model ........................................................................................................................ 8
     2.5    Demand Response ........................................................................................................................ 10
     2.6    Annualization Factors .................................................................................................................... 11
     2.7    Revenue Calculation ...................................................................................................................... 12
     2.8    Risk Analysis Process ................................................................................................................... 12

3    Outcome Measures.......................................................................................... 13
     3.1    Approach........................................................................................................................................ 13
     3.2    Safety Measures ............................................................................................................................ 13
     3.3    Accessibility Measures .................................................................................................................. 13
     3.4    Environment ................................................................................................................................... 13
     3.5    Value for Money ............................................................................................................................. 14
     3.6    Equity ............................................................................................................................................. 14
     3.7    Influencing Demand ....................................................................................................................... 14

4    Tolling Strategies............................................................................................. 14
     4.1    Existing Orewa-Puhoi Toll Road .................................................................................................... 14
     4.2    Puhoi-Warkworth ........................................................................................................................... 14
     4.3    Warkworth-Wellsford ..................................................................................................................... 15
     4.4    Toll Strategy Elements ................................................................................................................... 16
     4.5    Approach to Corridor Assessment ................................................................................................. 18
     4.6    Toll Gantry Location Strategies ..................................................................................................... 18

5    Preliminary Toll Outcomes - Puhoi to Warkworth (2038) ............................ 24
     5.1    Corridor Traffic Flows .................................................................................................................... 24
     5.2    Safety ............................................................................................................................................. 25
     5.3    Accessibility ................................................................................................................................... 27
     5.4    Environment ................................................................................................................................... 30
     5.5    Value for Money ............................................................................................................................. 33
     5.6    Equity ............................................................................................................................................. 35

                                                                    Puhoi to Wellsford Toll Modelling Assessment | 3821064 | NZ1-16560364-31 0.31 | 29 April 2020 | i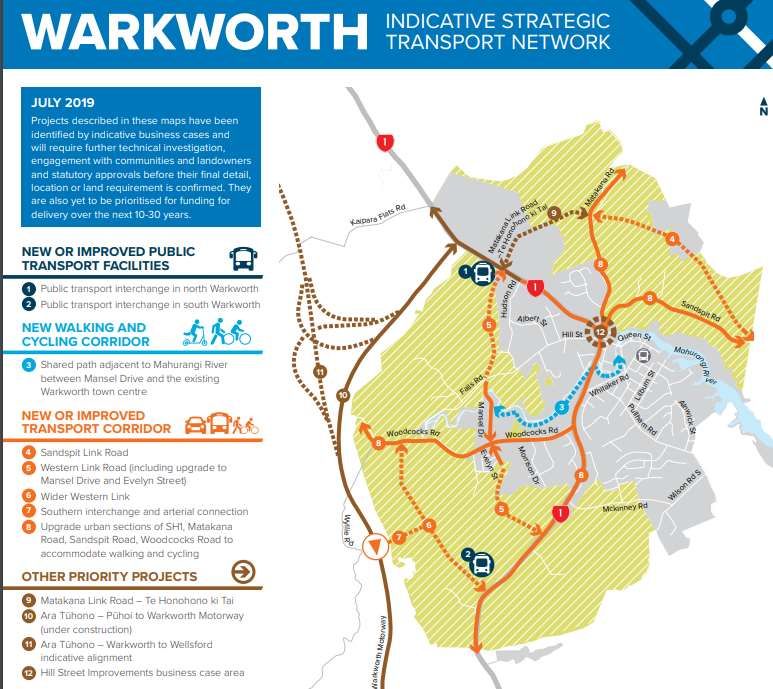
| Puhoi to Wellsford Toll Modelling Assessment|

    5.7     Influencing Demand ....................................................................................................................... 35
    5.8     Summary of Outcomes .................................................................................................................. 35
    5.9     Consideration of Vehicle Differentials ............................................................................................ 36
    5.10 Consideration of Time-Varying Tolls ............................................................................................. 36
    5.11 Consideration of Alternative Toll Gantry Location ......................................................................... 37
    5.12 Recommended Short-Term Strategy ............................................................................................. 37

6   Modelling of Longer-Term Scenario – Warkworth to Wellsford.................. 38
    6.1     Corridor Traffic Flows .................................................................................................................... 41
    6.2     Safety ............................................................................................................................................. 42
    6.3     Accessibility ................................................................................................................................... 42
    6.4     Environment ................................................................................................................................... 44
    6.5     Value for Money ............................................................................................................................. 45
    6.6     Equity ............................................................................................................................................. 46
    6.7     Influencing Demand ....................................................................................................................... 46
    6.8     Summary of Outcomes .................................................................................................................. 47
    6.9     Consideration of Vehicle Differentials ............................................................................................ 47
    6.10 Consideration of Time-Varying Tolls ............................................................................................. 47
    6.11 Recommended Long-Term Strategy ............................................................................................. 47

7   Assessment of Preferred Strategy ................................................................. 48
    7.1     Approach........................................................................................................................................ 48
    7.2     Modelled Scenarios ....................................................................................................................... 48
    7.3     Growth Analysis ............................................................................................................................. 48
    7.4     Puhoi to Warkworth Preferred Toll Strategy .................................................................................. 49
    7.5     Opening year Traffic Estimates (P2W) .......................................................................................... 50
    7.6     Risk Analysis (P2W) ...................................................................................................................... 50
    7.7     Forecast Traffic Volumes (P2W).................................................................................................... 54
    7.8     Estimated Revenue (P2W) ............................................................................................................ 55
    7.9     Effect of Alternative Gantry Strategy ............................................................................................. 58
    7.10 Warkworth to Wellsford .................................................................................................................. 58

8   Summary and Conclusions ............................................................................ 60

Appendices
No table of contents entries found.

                                                                    Puhoi to Wellsford Toll Modelling Assessment | 3821064 | NZ1-16560364-31 0.31 | 29 April 2020 | ii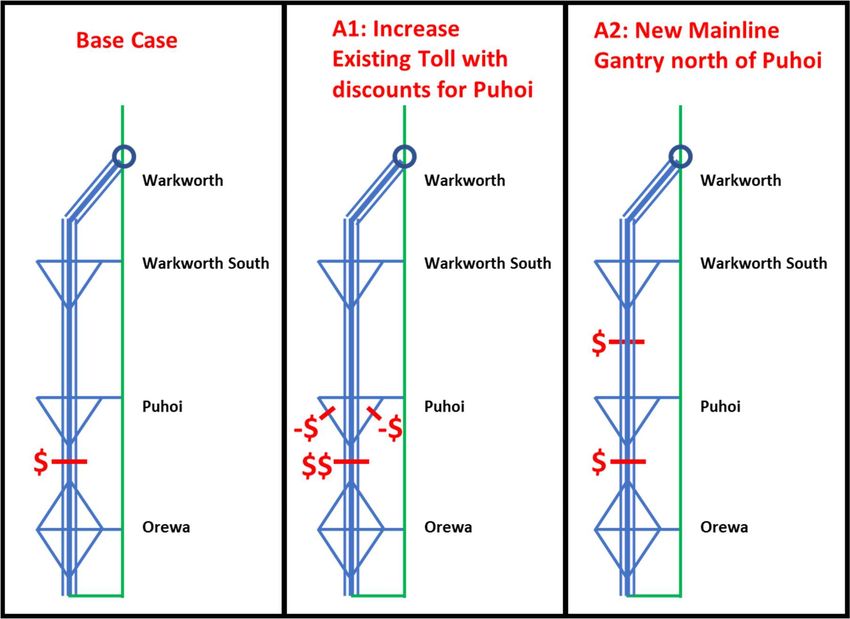
| Puhoi to Wellsford Toll Modelling Assessment|

Table of Abbreviations
AADT   Annual Average Daily Traffic
ADT    Average Daily Traffic
AFC    Auckland Forecasting Centre
ART3   Auckland Regional Transport Model 3
ATAP   Auckland Transport Alignment Project
CPI    Consumer Price Index
DBC    Detailed Business Case
DSI    Death Serious Injury
GPS    Government Policy Statement
HCV    Heavy Commercial Vehicle
IBC    Indicative Business Case
km     kilometres
m      million
min    minute
MSM    Auckland Macro Strategic Model
NGTR   Northern Gateway Toll Road
NZ     New Zealand
NZTA   New Zealand Transport Agency
OIC    Order in Council
P2W    Puhoi to Warworth
PPP    Private Public Partnership
       Supporting Growth Alliance, also known as Te Tupu
SGA    Ngatahi
SH     State Highway
TDM    Travel Demand Management
TTSM   Tauranga Transport Strategic Model
VEPM   Vehicle Emissions Prediction Model
VoT    Value of Time
VKT    Vehicle Kilometres Travelled
vpd    vehicle per day
WtP    Willingness to Pay
WW2W   Warkworth to Wellsford

                                        Puhoi to Wellsford Toll Modelling Assessment | 3821064 | NZ1-16560364-31 0.31 | 29 April 2020 | iii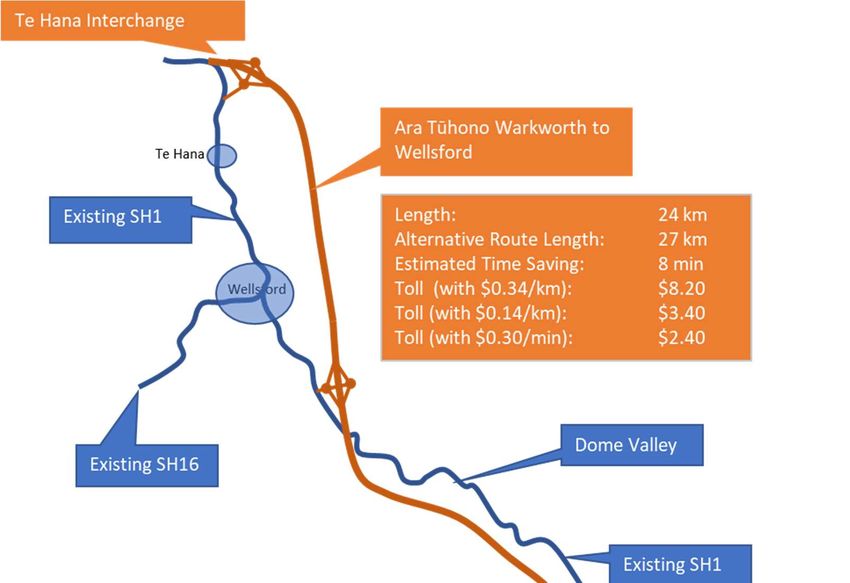
| Puhoi to Wellsford Toll Modelling Assessment|

Revision History
 Revision Nº              Prepared By                                      Description                                                              Date
 1.0                      Caleb Deverell / Andrew                          Working Draft                                                            29/11/2019
                          Murray / Mark Man
 1.1                      Caleb Deverell / Andrew                          Working Draft for Review                                                11/12/2019
                          Murray / Mark Man
 1.2                      Caleb Deverell / Andrew                          Draft for Peer Review                                                   13/12/2019
                          Murray / Mark Man
 1.3                      Caleb Deverell / Andrew                          Draft for Review                                                         30/01/2019
                          Murray / Mark Man
 1.4                      Caleb Deverell / Andrew                          Final Report                                                            30/04/2020
                          Murray / Mark Man

Document Acceptance
 Action                   Name                                             Signed                                                                   Date
 Prepared by              Caleb Deverell / Andrew                                                                                                   30/04/2020
                          Murray / Mark Man

 Reviewed by              Nyan Aung Lin                                                                                                             30/04/2020

 Approved by              Andrew Murray                                                                                                             30/04/2020

 on behalf of             Beca Limited

© Beca 2020 (unless Beca has expressly agreed otherwise with the Client in writing).
This report has been prepared by Beca on the specific instructions of our Client. It is solely for our Client’s use for the purpose for which it is intended in accordance
with the agreed scope of work. Any use or reliance by any person contrary to the above, to which Beca has not given its prior written consent, is at that person's own
risk.

                                                                           Puhoi to Wellsford Toll Modelling Assessment | 3821064 | NZ1-16560364-31 0.31 | 29 April 2020 | iv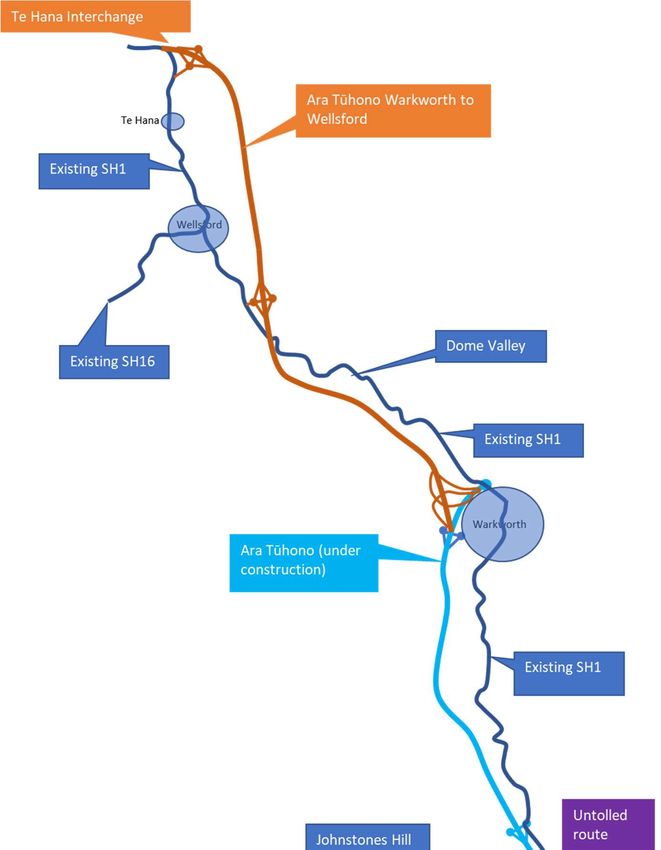
| Executive Summary |

Executive Summary

Purpose and Scope
This report describes an analysis of the effects of tolling on the Ara Tūhono corridor north of Auckland. The
purpose of this work is to provide information to NZTA to support their decision making on whether to
proceed to public consultation of tolling. This analysis is based on existing traffic models (albeit updated to
current conditions) and driver willingness to pay (WtP) parameters from other studies and those implied from
other toll roads. Detailed market research into WtP has not been undertaken specifically for this work
however the effects of key uncertainties in inputs and assumptions have been estimated via sensitivity tests
and risk-profiling. While this work provides estimates of network demands and revenue suitable for network
planning, the revenue estimates are not considered ‘investment grade’ such as might be required for private-
sector investment.

The first part of the corridor between Puhoi and Warkworth is currently under construction with completion
expected in late 2021. As such, decisions on tolling need to be made in early 2020 to allow sufficient time for
public consultation, and Order in Council to be completed before opening of the new road. A detailed
business case for the northern section between Warkworth and Te Hana has been completed, however the
implementation timing for that element remains uncertain. The DBC suggested traffic flow and safety triggers
for implementation, however a decision on proceeding to route protection has yet to be made. Funding was
identified as a key issue for that project. Because of the differing levels of certainty and urgency for the two
sections, greater analysis was applied to the Puhoi-Warkworth section, including estimates of opening-year
traffic flows should it be tolled. Longer-term and more conceptual analysis was applied to the section north
of Warkworth.

Approach and Methodology
The analysis focused on the revenue potential and network impacts of tolling of the corridor. The measured
network impacts were derived from the specific project objectives, key transport priorities (such as from the
GPS) and items specific to tolling. These included:

●   Road safety, specifically any additional crash costs of diverting traffic from the new motorway back to the
    existing highways
●   Accessibility, measured via estimated travel times between key locations through the corridor
●   Environmental impacts such as estimated changes in CO2 emissions
●   Amenity impacts from traffic increases in sensitive areas such as central Orewa and Warkworth
●   Travel demand impacts, such as reduced amount of vehicle travel from higher travel costs
●   Equity of pricing different users

The traffic flow and network outcomes were primarily derived from an updated version of the traffic model
owned by the Auckland Forecasting Centre (AFC), and used for development of key projects in this area
such as the P2W, WW2W, Matakana Link Road, Hill Street and Supporting Growth Alliance projects. Key
updates to that model included an extension south to include the existing Northern Gateway toll road, a
switch to the new regional demand model for forecast traffic flows (rather than the now superseded ART3
model), rebasing and calibrating the model to 2018 conditions and adding a toll response element.

An initial assessment of alternative toll strategies was considered for both the short-term and longer-term (full
corridor) scenarios, resulting in a short-list of scenarios for testing. More detailed testing for the P2W project
was then undertaken for the forecast year 2038 to identify a preferred range of toll tariffs. This preferred
range was determined balancing between the increasing revenue potential of higher tolls against the
worsening network outcomes. A similar approach was then undertaken for the WW2W

                                                 Puhoi to Wellsford Toll Modelling Assessment | 3821064 | NZ1-16560364-31 0.31 | 29 April 2020 | 1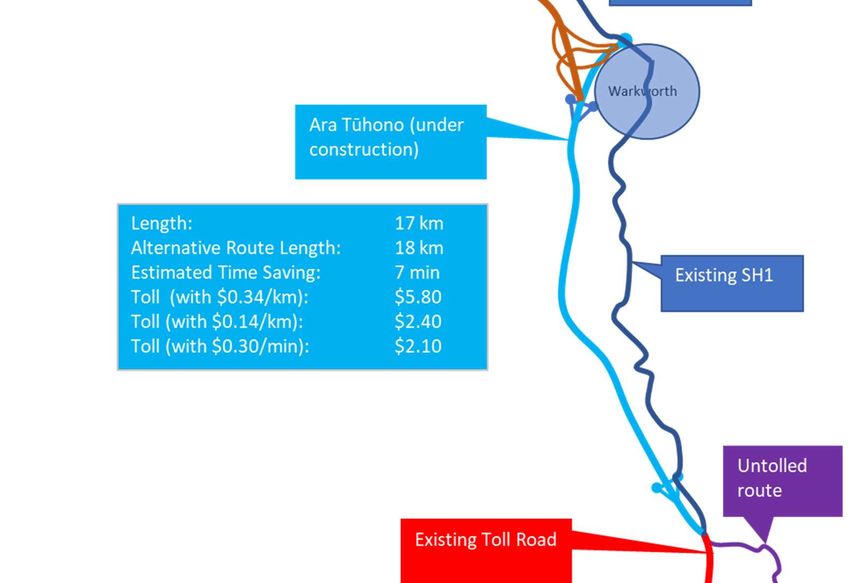
| Executive Summary |
project. Representative revenue estimates were then developed for the P2W project from opening year to
2048, including risk-adjusted factors to provide 5%, 50% and 95%ile estimates.
Puhoi-Warkworth Toll Strategy
Two toll location strategies were identified for this project:
A1: Increasing the toll at the existing Northern Gateway toll gantry at Orewa but adding ramp toll gantries
on the Puhoi Ramps to allow discounting of the tolls for those users
A2: A new mainline gantry located north of Puhoi
Strategy A1 has the advantage of lower transaction costs as it utilizes the existing gantry. The discounting of
tolls for those exiting at Puhoi is considered necessary as they would accrue the higher toll charge at the
Northern Gateway gantry without using the new toll road. Therefore, the two strategies are effectively the
same in terms of traveler’s payment and use of the toll road but differ in terms of toll system operation. This
strategy does require a change to the national toll processing system to identify and invoice the linked trips
and potentially requires a more complex Order in Council (OIC) process1.
The potentially more efficient A1 strategy is recommended if it can be confirmed that the processing system
can efficiently accommodate linked and discounted trips.
The modelling and analysis identified the following key outcomes:
● Revenue increased with increasing tolls, up to a maximum at about $9, after which the revenue reduces
● Travel times on both routes were not significantly changed with tolls below $5
● Crash costs increase with tolls as traffic is diverted to the lower-standard existing highway
● Tolling marginally reduces the amount of travel through the corridor
● Only minor changes in vehicle CO2 emissions is expected, with the demand suppression effects of tolls
being offset by increased trip lengths on the alternative routes
● The corridor includes both local and inter-regional travel, resulting in hourly traffic flow profiles more
consistent throughout the day with less dominant commuter peaks than is experienced within major urban
areas. This would make time-varying tolls difficult to implement with clear transition points. Therefore, a
uniform 24/7 toll rate is recommended, as per the other peri-urban toll roads in NZ.
● Truck tolls are recommended to be 2 times that for light vehicles, consistent with the adjacent northern
Gateway toll road.
From the assessment an optimal toll tariff between $2 and $3 is suggested, being a balance between the
increasing revenue potential and worsening network outcomes of higher tolls.
A mid-point toll of $2.40 would provide the same per-km toll rate as the Tauranga Eastern Motorway and a
similar per-minute time saving as the Northern Gateway.
Puhoi-Warkworth Revenue Potential
A representative toll of $2.40 was used to estimate the traffic flows and revenue potential. Opening year
annual average daily flows of some 18,200 vpd are expected in 2022, increasing to 36,300 in 2048. This is
estimated to generate gross revenue of some $16.3m from the new gantry in 2022, increasing to $32.3m in
2048. However, the toll transaction cost is assumed to remain at 70c per vehicle, while tolling the new
project does result in a small reduction in traffic on the existing Northern Gateway toll (relative to an untolled
scenario). Therefore, tolling the P2W project is expected to increase the combined net revenue of the two
toll gantries by between $8.2m (5%il) and $15.6m (95%ile), with an expected value of $11.4m in 2028.
1
As it would involve altering the toll applied on the Northern Gateway toll road
Puhoi to Wellsford Toll Modelling Assessment | 3821064 | NZ1-16560364-31 0.31 | 29 April 2020 | 2
| Executive Summary |
This analysis suggests the 35-year net revenue estimate is between $304m (5%il) and $794m (95%ile), with
an expected value of $569m. The equivalent net present value at 6% discount rate would be $184m
The potentially more cost-efficient A1 toll strategy could potentially save $100m (2018$) over 35 years. This
would take the total 35-year expected net revenue estimate from $404m to $894m.
Warkworth to Wellsford Toll Strategy
Unlike other toll roads in NZ, this corridor could potentially have multiple adjacent toll points resulting in a
significant cost of travellers of the full corridor. This has a number of implications including:
● A potential impact on an objective of the corridor to enable economic growth in Northland by imposing
high travel costs
● An equity or ‘fairness’ concern about treatment of this corridor versus other inter-regional corridors in NZ
● Uncertainty about traveller’s willingness to pay for the cumulative effect of multiple adjacent toll
roads. Most toll road assessments rely on WtP assessments based on single stand-alone toll roads
Toll models are used attempt to reflect the trade-off between travel times and costs for each of the individual
sections of toll roads, and don’t consider the cumulative effect on travel budgets from multiple toll
sites. There is a sparsity of research into the scale of effect on driver’s willingness-to-pay from cumulative
tolls, so this effect remains somewhat uncertain. Advice from international experts suggests this is a real
effect and that slightly more conservative willingness to pay parameters should be adopted than for stand-
alone toll sites. As such, these cumulative and equity effects have been considered mostly qualitatively
rather than determined from the models.
Analysis of various toll strategies identified the following:
● Tolling the two sections of the WW2W project is likely to lead to very high toll costs for using the full
corridor so is not recommended
● Tolling only the section between Warkworth and Wayby Valley interchanges results in limited diversion of
through traffic but higher diversion of trips between Warkworth and the north via Dome Valley
● This local diversion could be partially mitigated by also tolling the north-facing ramps at Wayby Valley,
however that results in such low usage of those ramps that tolling would not be worthwhile
● Tolling of just north-facing ramps at Warkworth and Wayby Valley would not increase through-traffic tolls
but would not be worthwhile due to low usage of those ramps.
It is therefore recommended that any tolling of this project be via a new mainline gantry north of Warkworth
with a toll in the range of $1.20 and $2.00.
Due to the uncertain timeframe for implementation of this part of the corridor, only annual revenue estimates
for 2038 and 2048 have been assessed. This suggests potential annual net revenue from a $1.20 toll north
of Warkworth of:
an expected 2038 net revenue of $7.7m with 5% and 95%ile values of $5.5m and $10.7m respectively
an expected 2048 net revenue of $9.3m with 5% and 95%ile values of $6.4m and $14.0m respectively
Conclusion
This analysis has identified potential of significant revenue from tolling on both the P2W and WW2W
projects. However, increasing tolls will reduce the expected outcomes of the projects, especially in terms of
allowing travel on safer roads. Relatively modest tolls of between $2-$3 on P2W are considered to represent
a balance between revenue generation and network outcomes. A single additional toll point north of
Warkworth is also the preferred strategy, with a more modest tariff of between $1.20 and $2.00.
Puhoi to Wellsford Toll Modelling Assessment | 3821064 | NZ1-16560364-31 0.31 | 29 April 2020 | 3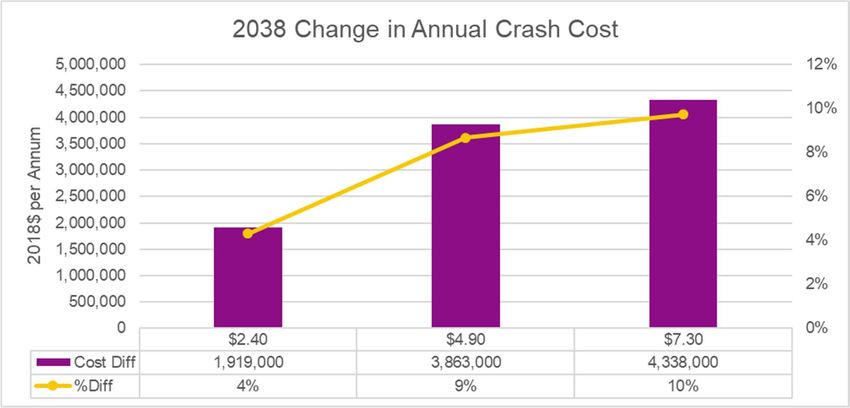
| Introduction |
As well as potential revenue generation, tolling offers some level of demand management (albeit quite
modest) and also signals a transition to pricing for road usage as indicated as being needed for Auckland
through ATAP.
Unlike other toll roads, this corridor needs to consider the effects of up to three adjacent toll roads, with
cumulative impacts on inter-regional travel costs, equity with other inter-regional corridors and the
uncertainties of motorist’s cumulative willingness to pay.
1 Introduction
1.1 Purpose
Beca Ltd was commissioned by New Zealand Transport Agency (NZTA) to investigate the effect of tolling on
the Ara Tūhono project (Puhoi to Wellsford motorway extensions), to inform decisions whether to proceed
with tolling. This work considered the types of tolling strategy and expected outcomes in terms of toll revenue
and impacts on the transport network.
The work focussed more on the first part of the corridor (Puhoi to Warkworth) which is currently under
construction and due for completion in late 2021. Planning of the next section (Warkworth to Wellsford) is
progressing, however the timing for implementation remains uncertain. As such, the northern section was
considered at a more conceptual level, focussing on potential toll strategies and outcomes with less
extensive modelling.
1.2 Scope and Limitations
The purpose of our advice will be to support a decision by NZTA to progress consideration of tolling or not,
including undertaking public consultation, in accordance with the parameters of our agreed scope as set out
in our proposal. Further analysis may be required in order to support more detailed financial analysis.
Specifically, this work does not provide ‘investment-grade’ revenue estimates.
Although in this report, Beca offers professional advice and may express opinions on likely or possible
outcomes, we cannot guarantee any particular outcome and any decision to proceed with the next phase of
investigation is a commercial decision for NZTA.
It should be noted that the toll revenue estimates provided as part of the Services are not a statement of
absolute revenue suitable for detailed investment decisions, rather they will have an accuracy range
commensurate with various factors such as the extent of relevant information provided, the certainty of data
and the level of detail available at the time of preparation.
The Puhoi to Warkworth project is being constructed and operated via a Private Public Partnership. This
report does not explore the commercial implications in regard to the PPP, nor jurisdictional issues in regard
to any revocation of the current State Highway Status (with assumed transfer to an Auckland Transport
asset).
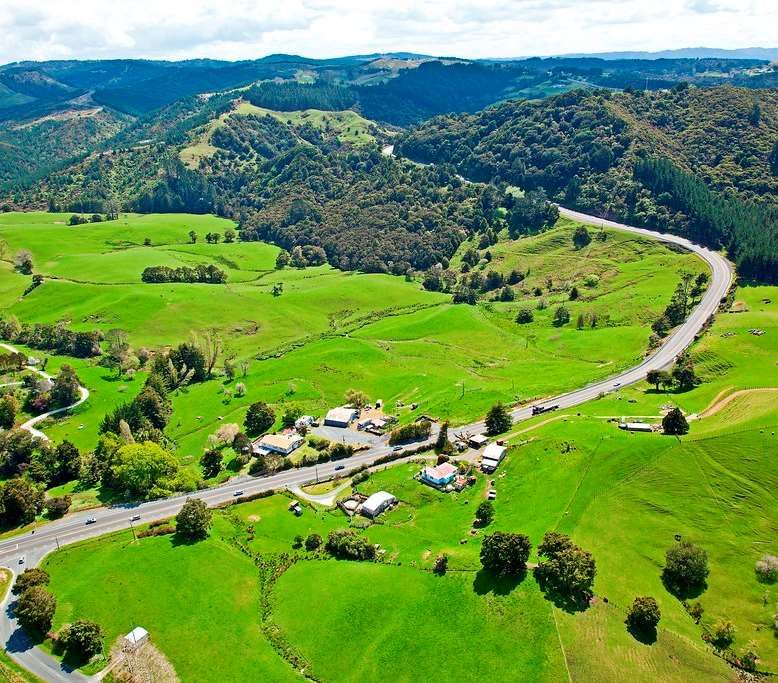
1.3 Ara Tūhono Corridor
The project study area is shown in Figure 1-1. The Puhoi to Warkworth (P2W) project is under construction
and involves an extension of the northern motorway corridor, immediately north of the existing Northern
Gateway toll road. The northern Gateway toll road has been operational since 2009 and currently has a
$2.40 toll for light vehicles and $4.80 for heavy vehicles. The expected completion of this element within the
next 2 years means a decision on tolling must be made in 2020 if any tolling system is to be installed before
operation commences.
Puhoi to Wellsford Toll Modelling Assessment | 3821064 | NZ1-16560364-31 0.31 | 29 April 2020 | 4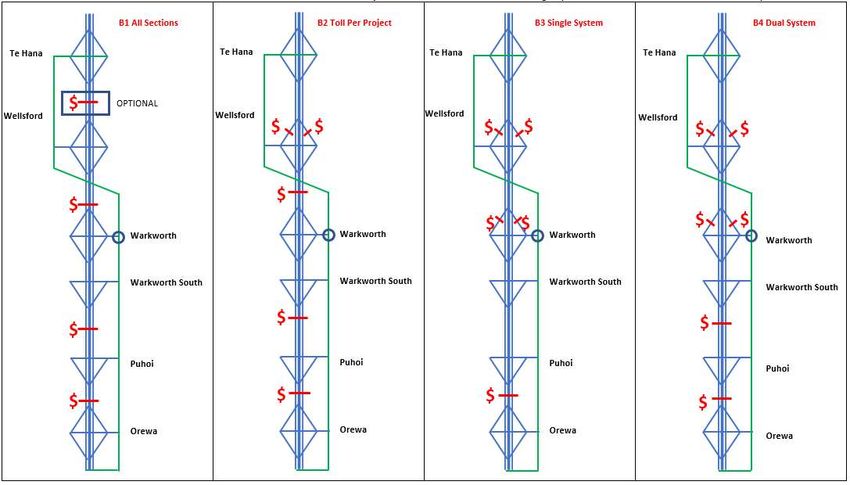
| Introduction |

The Warkworth to Wellsford (WW2W) part of the corridor has a completed business case, with the next steps
being route protection. The Business Case did not recommend a specific implementation date, rather
recommending triggers on traffic growth and safety be used to guide decisions in implementation. The
business case identified funding as a constraint on implementation. Although the business case has
developed a proposed design, subsequent route protection, consenting and detailed design processes could
result in changes to the form of project. As such, there is significant uncertainty about the timing of this part
of the corridor.

Figure 1-1: Project Study Area

                                                 Puhoi to Wellsford Toll Modelling Assessment | 3821064 | NZ1-16560364-31 0.31 | 29 April 2020 | 5
| Introduction |
1.4 Other Projects
The Matakana Link Road project in Warkworth is planned to be operational concurrently with the Puhoi to
Warkworth project. Matakana Link Road is a local arterial road to be implemented by Auckland Transport as
part of the longer-term network proposed for Warkworth.
The Hill Street project in Warkworth has considered upgrades to this complex intersection. Short-listed
options have been identified but the final version is yet to be confirmed. The intersection is very complex
requiring more detailed models than the SATURN models used here, so a simple representation of the likely
increased capacity has been used.
Significant urban growth is planned for Warkworth, with an approximate 20,000 increase in resident
population. The planning for the future transport network to support this growth is being undertaken by Te
Tupu Ngatahi (the Supporting Growth Alliance). An Indicative Business Case (IBC) has been completed for
Warkworth that identified the preferred long-term network. Detailed business cases and route protection is
planned for that network over the next few years. Of significance to the state highway network is the
recommendation of an additional interchange in south Warkworth.
1.5 Study Approach
The broad approach adopted for the assessment was as follows:
● Undertake preliminary testing of a range of toll levels on the Puhoi-Warkworth project for a single forecast
year (2038) to understand the impact of tolling and a suggested toll range
● Consider the longer-term full corridor scenario, focussed on issues and options with limited modelling
● Select a preferred toll strategy for Puhoi-Warkworth project and provide a fuller set of forecasts based on
the preferred strategy, including more detailed risk analysis of forecasting uncertainties
1.6 Report Structure
The remainder of this report is structured as follows:
Chapter 2 Describes the assessment methodology used in this assessment
Chapter 3 Describes the outcome measures used to assess each toll strategy
Chapter 4 Describes the elements of a toll strategy and a preliminary assessment of options
Chapter 5 Describes the Preliminary modelling and analysis of the toll strategies on the Puhoi-
Warkworth project
Chapter 6 Assess the longer-term considerations for tolling on WW2W with the full corridor in place
Chapter 7 Details the refined outcomes from the agreed preferred strategy for P2W
Chapter 8 Summary and Conclusions
Puhoi to Wellsford Toll Modelling Assessment | 3821064 | NZ1-16560364-31 0.31 | 29 April 2020 | 6| Modelling Methodology |
2 Modelling Methodology
2.1 Approach
The assessment of traffic flows, revenue and network performance is based on a series of models and
assessments, comprising:
● A regional multi-modal demand model to estimate future travel demands from land use and network
inputs
● A detailed corridor traffic model that predicts traffic flows and network performance in detail
● A toll diversion model, added to the corridor model to predict diversion between available tolled and
untolled routes based on the Willingness-to-pay (WTP) for a range of demand segments
● A demand response element, that predicts change in travel pattern within the corridor (such as mode
shift, change in destination etc) as well as diversion to the wider SH16 corridor
● An annualization process to expand weekday, peak period model predictions into daily then annual
flows
● A revenue model, that estimates potential toll revenue from the traffic flows, allowing for revenue
leakage and transaction costs
● A risk-analysis process, that considers the key forecasting uncertainties to provide range of forecasts
that reflect those uncertainties
These elements are described in the following sections.
2.2 Regional Demand Model
The Auckland Macro Strategic Model (MSM) is owned and operated by the Auckland Forecasting Centre
(AFC), and estimates future travel patterns (via origin-destination trip patterns by period, purpose year and
mode). Key inputs to that model are future land use and demographic forecasts, future network assumptions
and policy and economic inputs. For this study those key inputs have been adopted from recent models
developed by the AFC for the update of the Auckland Transport Alignment Project (ATAP). These include:
● Land use forecasts based on Scenario I-11.4 (as used in SGA)
● Project assumptions from ATAP in the wider network, revised as needed for use in this study (such as
addition of the Warkworth-Wellsford project and testing of toll responses)
● Future year networks in Warkworth based on the SGA Indicative Business Case
The regional model covers both this corridor as well as the wider SH16 corridor and alters the travel patterns
in response to travel costs such as tolls. The model was run for un-tolled and tolled scenarios to inform the
demand response, which includes changes in trip distribution, mode shift and route choice to SH16.
Auckland wide network assumptions have been described in a separate note “P2W Technical Note 4 – MSM
Forecast Network Assumptions”.
2.3 Saturn Corridor Traffic Model
The corridor traffic model was developed from the SGA SATURN traffic model of the corridor between Puhoi
and Te Hana (versions of which were also used for the planning of the Warkworth to Wellsford and
Matakana Link Road projects). The base year Saturn model has been developed and is discussed in a
separate document “P2W Technical Note 5 – Base Year Model Development”.
For this work the model was extended to Orewa and re-based to 2018 conditions based directly on the MSM
demands, rather than demands from the now superseded ART regional model. The model reflects average
Monday-Thursday AM, interpeak and PM peak periods. Analysis of Friday data indicated slightly different
traffic flow levels than for Monday-Thursday. The effect of Friday and holiday flows were then reflected in
Puhoi to Wellsford Toll Modelling Assessment | 3821064 | NZ1-16560364-31 0.31 | 29 April 2020 | 7| Modelling Methodology |
the annualization factors. Friday and holiday periods currently have much more significant congestion in the
corridor than weekdays, not just higher flows. However, with the committed completion of the Puhoi-
Warkworth and Matakana Link Road in all future scenarios, that congestion in the SH1 corridor is expected
to significantly reduce. As such, it is considered suitable to reflect the higher-flow periods via annualization
factors rather than via specific models for such periods.
The standard traffic model only had two demand segments, being light and heavy vehicles. This was
expanded as part of the toll diversion model described below.
Model demands have been sourced from the MSM for the years 2028, 2038 and 2048. The demands are
adjusted based on the calibration and matrix estimation process described in the base year model
development report; “P2W Technical Note 5 – Base Year Model Development”.
2.4 Toll Diversion Model
This study adopted a multi-class route choice form of toll response model. This involves segmenting the
traffic demand matrices into different segments, which is assigned a WTP value. The toll is then included in
the route choice model, where the model seeks to find the least-cost paths through the network.
The toll diversion model therefore comprises the following elements:
● Segmentation of the travel demands into 12 user classes2. These classes reflect the same classes used
in the WTP module available in MSM.
● Allocation of WTP parameters to each user class
● Modification of the route choice cost functions to include tolls
● Development of a 12-class assignment model (rather than the previous 2-class model)
2.4.1 Willingness to Pay
In this model, WTP comprises three elements:
● The Value of Time (VoT) in $/hour. This parameter converts the monetary toll into equivalent minutes of
travel. User classes with higher VoT will have a high WtP.
● Road perception factors, that reflect perceptions of the relative safety, convenience, amenity or reliability
of the competing routes. To suit the SATURN model software, these were included as penalties on links
with poorer characteristics. No penalties were applied to the tolled motorways.
● Escalation of VoT. This accounts for a change in value of time based on income growth.
Development of the model is detailed in Appendix A.
A key uncertainty in toll modelling are the VoT values. Two key sources were used for this study:
1. The values included for the same 12 user classes in the MSM3
2. The values used in the Tauranga demand models
Stated Preference surveys were undertaken in Tauranga in 2005 to assess VoT values for the proposed
eastern motorway toll road. However progressive modelling of the existing Takitimu Drive toll road in
Tauranga found those values underestimated usage of the toll road. They were also found to over-predict
reductions in traffic with successive increases in tolls. The VoT values were therefore progressively
increased over various model updates to better reflect observed behaviour. Those revised values were found
to provide good prediction of usage when the Eastern Motorway toll road opened in 2015.
2
Refer to P2W Technical Note 5 – Base Model Development Report for detail on user class segmentation
3
The MSM VoT is based on the Economic Evaluation Manual VoTs and adjusted for the Auckland region
Puhoi to Wellsford Toll Modelling Assessment | 3821064 | NZ1-16560364-31 0.31 | 29 April 2020 | 8| Modelling Methodology |
The data collection carried out for this project demonstrated that the through traffic diversion was
approximately 5%. With an uncongested travel time saving of approximately 8 minutes; 95% of drivers have
a value of time equal to or greater than $18/hr. The model willingness to pay segmentation and VoT was
validated against this.
For this study the VoT was adopted as follows:
● A ‘central’ estimate that was a simple average of the Auckland (MSM) and Tauranga (TTSM) values
● Sensitivity testing with the lower MSM values and the higher full Tauranga values
The VoT adopted is shown in Figure 2-1.
Comparison - Value of Time MSM, TTSM and Adopted
120
103.0
100
80.8
80 75.5
58.5 60.2
60
48.2
43.3 41.9 44.9
40.4
40 38.5
33.3 35.7
30.8 26.7 29.5 29.4
28.2
22.5 22.1
21.6 22.1
17.3 19.4 18.4 18.7
20 13.3 15.4
8.2 12.1 11.7
8.9 10.1
7.8 7.4 7.8
0
HBWL EBL OTHL HCVL HBWM EBM OTHM HCVM HBWH EBH OTHH HCVH
$/hr (MSM 2016) $/hr (TTSM 2013) $/hr (Adopted Currently)
Figure 2-1: Value of Time
2.4.2 Escalation of VoT
Previous tolling studies have assumed the following:
● Tolls will be escalated, on average at the rate of inflation (CPI)
● VoT is likely to escalate based on income growth
● Average weekly earnings have historically been found to growth at some 1%-1.1% faster than CPI
● This means that the WtP is expected to increase over time in real terms
Figure 2-2 below shows the indexed growth in CPI versus average weekly earnings, which suggested
earnings growing at 1.1% faster than CPI.
Puhoi to Wellsford Toll Modelling Assessment | 3821064 | NZ1-16560364-31 0.31 | 29 April 2020 | 9| Modelling Methodology |
Figure 2-2: Indexed Growth in Weekly Earnings and CPI
Within the models all tolls were applied in $2018 terms and the 2018 VoT values retained 4. To account for
the difference in CPI growth and VoT growth a 1% WtP escalation effect was applied to the representation of
toll costs in the models.
2.5 Demand Response
Tolling is expected to alter both the travel routes (diversion) as well as the travel patterns (mode share,
destination choice etc). The diversion is the primary response however the demand response is also
important. In this corridor, the potential for longer-distance trips to divert from the SH1 corridor to the SH16
corridor further west is not captured in the local corridor model. As such, while that effect is technically a
diversion effect, in this corridor it is included as a ‘demand response’ as such trips are removed from the SH1
corridor.
The key source of demand response was the MSM, from which the effect on corridor flows with differing toll
levels was determined. Testing in the 2038 regional model suggested corridor flows reduced by some 5%
with a $2.30 toll north of Puhoi and 8% with a $5 toll. The regional model extends to the Auckland Boundary,
north of Te Hana. Trips entering the model at this point have a fixed travel pattern that does not respond to
travel costs. As such, it is expected that the demand response may be slightly higher than estimated by
MSM. Additionally, the MSM responds to increases in travel times determined by its simpler representation
of the network. These changes in delays and speeds may differ from the more detailed SATURN corridor
model. Therefore, the revised tolled travel demands from MSM were not used directly in the SATURN
model, rather a mechanism was added to the SATURN model to represent the likely demand response
directly form the travel times. This involved use of a ‘shadow network’, that allowed trips to travel between
Orewa and Warkworth (or Wellsford) as travel costs on the real network increae. The speeds on the shadow
network were set to have no usage in an untolled scenario but had increasing traffic as tolls increased. The
4
2018 was used as this is the base calibrated model.
Puhoi to Wellsford Toll Modelling Assessment | 3821064 | NZ1-16560364-31 0.31 | 29 April 2020 | 10| Modelling Methodology |
reduction in travel on the real network was set to reflect the MSM testing, albeit targeted at a slightly higher
level to reflect the lack of MSM response in the external trips 5.
2.6 Annualization Factors
Annualization factors are required to convert the modelled traffic volumes for each modelled peak (AM, IP,
PM) into average daily traffic (ADT) and annual average daily traffic (AADT).
The factors have been determined by following the steps described below. TMS data on the State Highway
corridor have been used in the calculations.
● For each hour in a day assign the most appropriate model peak
– For four scenarios: Mon-Thu average weekday, Friday, Saturday and Sunday
– Modelled peak assigned based on total flows and north-south directional split
● Determine peak flow factor for each hour
– Flow factor to convert model peak flow to observed hour flow
● Sum the peak flow factor for each scenario and modelled peak
– This gives the factor for each modelled peak to determine the total daily flow for each scenario
● Determine the number of days in the year each scenario occurs
● Determine the weighted average modelled peak factors to give the AADT factors
The AADT Factors are shown in Table 2-1:
5
At higher tolls the MSM demand model had no users of the toll road, so the demand was not fully reflecting
increasing tolls. The final assignment in MSM has a more detailed toll response which does capture the
wider diversion to SH16.
Puhoi to Wellsford Toll Modelling Assessment | 3821064 | NZ1-16560364-31 0.31 | 29 April 2020 | 11| Modelling Methodology |
Table 2-1: AADT Factors
Modelled Peak (1-hr) AADT Factor
AM 1.70
IP 11.07
PM 2.23
2.7 Revenue Calculation
The following steps are taken in order to calculate the annual net toll revenue for each toll tariff level tested:
● Multiply the toll tariff by the annual traffic using the toll road to get gross revenue
● Deduct the revenue leakage, i.e. users of the toll road that either do not pay the toll or are exempt from
paying
● Deduct the transaction cost for each vehicle, set at $0.70 per transaction to get net revenue
2.7.1 Annual Traffic
The annual traffic on the toll road is determined by running the SATURN model for each modelled peak,
extracting the volume on the toll road for each peak and then using the annualization factors to convert this
to an annual traffic volume.
2.7.2 Transaction Cost
The transaction cost of $0.70 per transaction has been provided by NZTA. This has been assumed to be an
average transaction cost that covers all transaction types and circumstances, for example toll payment
notices for non-payers. It is possible the transaction cost reduces over time as more toll roads are added to
the national system and other reasons. No information on this is available, however this has been addressed
in the risk analysis.
2.7.3 Revenue Leakage
The revenue leakage has been determined by analysing the Northern Gateway Toll Road (NGTR) gantry
data. This represents the percentage of traffic that does not pay for the toll road, either through non-
compliance or are exempt from paying the toll. The revenue leakage is summarised in Table 2-2:
Table 2-2: Revenue Leakage
Vehicle Class Percent of Vehicles Not Paying
Motorcycle 10%
Car / Light Truck 3%
Heavy Truck / Bus 2%
The percent of vehicles not paying was calculated using data from 2018 and 2017.
2.8 Risk Analysis Process
This process is detailed more fully in later chapters for the preferred toll strategy. It involves the following
key steps:
● Prepare model forecasts using agreed inputs
● Identify key areas of uncertainty that influence the forecasts
● Test or assess the potential scale of the uncertainty
● Set potential probability functions for the uncertainty
Puhoi to Wellsford Toll Modelling Assessment | 3821064 | NZ1-16560364-31 0.31 | 29 April 2020 | 12| Outcome Measures |
● Run Monte-Carlo type simulation that combines the effects of all the uncertainties to give adjustment
factors to apply to model results at differing levels of certainty (e.g. 5th, 50th and 95th percentile
adjustments)
● Apply factors to the model results to provide ranges in forecasts
3 Outcome Measures
3.1 Approach
This section describes the key outcome measures used to assess the impact of tolling on the network. The
source of these measures are outlined in Technical Note #2 contained in Appendix B.
The outcome measures include the following:
● Safety
● Accessibility
● Environmental
● Value for Money (including revenue)
● Equity
● Influencing Demand
These outcome measures have considered both the Government Policy Statement (GPS 2018), outcomes
used in similar studies and the various project objectives in the study area, which includes; Puhoi-Warkworth,
Warkworth-Wellsford and Matakana Link Road.
3.2 Safety Measures
Improving road safety is a key outcome sought by the Ara Tūhono projects, as the high traffic flows result in
high crash rates on the existing 2-lane, curvilinear terrain, including the well-known crash risk areas of
Schedeways Hill and Dome Valley.
As well as a measure of traffic flows on these existing sections of State Highway, estimates of the potential
social costs of crashes was used, based on simple crash rates calculated from existing crash history. For
example, scenarios with a high toll will encourage more use of the existing State Highway which in turn will
produce a higher number of DSIs and therefore a higher social cost.
3.3 Accessibility Measures
Four measures are proposed for accessibility:
● Point-to-point travel time through the corridor
● Impact on travel costs between communities (a simple summary of additional costs imposed on key
movements)
● Changes in mode share (as a measure of travel choice)
● Travel consistency, based on any variability between the modelled travel time over the three modelled
peaks; AM, IP and PM.
● Notable changes in predicted delay/congestion in Warkworth as a result of tolling Ara Tūhono
3.4 Environment
Three measures are proposed for environmental impacts:
● Estimated vehicle emissions using the Vehicle Emissions Prediction Model (VEPM), and measured over
the extent of the corridor project model
Puhoi to Wellsford Toll Modelling Assessment | 3821064 | NZ1-16560364-31 0.31 | 29 April 2020 | 13| Tolling Strategies |
● Changes in traffic volumes in sensitive urban environments including Grand Drive (Orewa), Hibiscus
Coast Highway at the Orewa Town Centre, Hill Street intersection in Warkworth and SH1 in the Wellsford
Town Centre
3.5 Value for Money
The ‘value for money’ is measured by:
● the potential annual toll revenue and associated transaction costs
● The potential capital costs, based on a simple estimate per toll gantry
● A simple Internal Rate of Return for the toll system
3.6 Equity
Equity is proposed to be a measure of the ‘fairness’ of the proposed toll system. This will be assessed
subjectively based on two simple indicators:
● Whether users of each section of Ara Tūhono have similar paid/free access (i.e. can some users use
parts for free)
● Whether payment is similar on a per-km basis
● Whether tolling is consistent with similar toll road corridors in NZ
3.7 Influencing Demand
This was assessed by how the toll influences demand through:
● Mode shift
● Change in travel (VKT)
4 Tolling Strategies
The corridor comprises the following three elements as indicated in Figure 4-1:
● The existing toll road between Orewa and Puhoi
● The Ara Tūhono project currently under construction between Puhoi and Warkworth (P2W)
● The proposed future Ara Tūhono extension from Warkworth to Wellsford (WW2W)
The configuration of the access points to each part of the corridor are critical to development of the toll
strategy, and are assumed as follows:
4.1 Existing Orewa-Puhoi Toll Road
The toll gantry is located between the Grand Drive interchange in Orewa and the Johnstone’s Hill Tunnels at
Puhoi. Access to the toll road is therefore via SH1 south or from Grand Drive in Orewa and from SH1 at
Puhoi. At Puhoi there are currently no direct movements possible between the toll road and the Hibiscus
Coast Highway, although indirect movement is possible via a u-turn on Puhoi Road.
4.2 Puhoi-Warkworth
The project currently under construction removes the connection between the toll road and the alternative
route at the northern tunnel abutment but provides south-facing ramps to Puhoi Road. No north-facing
ramps are proposed.
An interim termination of the road is being constructed on SH1 immediately north of Warkworth via a
roundabout allowing all movement access north (towards Dome Valley) or south into Warkworth town centre.
Puhoi to Wellsford Toll Modelling Assessment | 3821064 | NZ1-16560364-31 0.31 | 29 April 2020 | 14| Tolling Strategies |
Although not currently being constructed, The Supporting Growth Alliance (SGA) project has identified an
additional interchange to the south of the (future) urban area of Warkworth, via south-facing ramps.
4.3 Warkworth-Wellsford
This project proposes a new SH corridor from Warkworth to north of Te Hana. The currently proposed
connections are:
● Warkworth: full system interchange
● Wellsford: an all-movement interchange on Wayby Valley Road, some 4 km south of the Wellsford town
centre
● Te Hana: an all-movement interchange on Mangawhai Road, some 2.5 km north of the Te Hana village
● Northern tie-in: the new road will connect directly into the existing road approximately 1.5km north of the
Te Hana interchange, with no local road access
Figure 4-1: SH1 Ara Tūhono Corridor and Interchanges
Puhoi to Wellsford Toll Modelling Assessment | 3821064 | NZ1-16560364-31 0.31 | 29 April 2020 | 15| Tolling Strategies |
4.4 Toll Strategy Elements
The key elements considered with the toll strategy include:
● The toll collection and payment methods
● The location of toll points/gantries
● The toll tariff
● Any discounting or capping
● Any differentials by vehicle type
● Any differentials by time of day
● How toll tariffs are escalated over time
4.4.1 Existing Toll Roads
The attributes of the three existing NZ toll roads are shown in Table 4-1. Given those are also State
Highways, it is assumed that similar attributes would be expected.
Table 4-1: Attributes of Existing Toll Roads
Attribute SH1 Northern SH2 Eastern SH2 Takitimu
Gateway Link Tauranga Drive
Auckland Tauranga
Toll Collection Free-flow electronic toll gantry
Payment Methods NZTA automated Toll account
Pay on-line
Cash (at selected service stations)
Toll Tariff (as at October 2019)
Light Vehicle $2.40 $2.10 $1.90
Heavy Vehicle (over 3.5t) $4.80 $5.20 $5.00
Trailer $0 $0 $0
Heavy Vehicle toll relative to light vehicle 2 times 2.5 times 2.6 times
Length of toll road 7km 15km 5.4km
Distance saving relative to alternative route 5km 2.8km 1-2km
Typical time saving (uncongested) 8 min 7 min 4 min
Equivalent light vehicle toll/km of toll road $0.34/km $0.14/km $0.35/km
Equivalent light vehicle toll/minute saved $0.3/min $0.3/min $0.95/min
Collection points One mainline gantry per project
Discounting or capping none
Escalation Generally CPI, but to nearest 10c
Figure 4-2 demonstrates the toll pricing for each corridor section when following the equivalent light vehicle
toll / km and light vehicle toll / minutes saved:
Puhoi to Wellsford Toll Modelling Assessment | 3821064 | NZ1-16560364-31 0.31 | 29 April 2020 | 16| Tolling Strategies |
Figure 4-2: Toll Pricing Equivalence
Puhoi to Wellsford Toll Modelling Assessment | 3821064 | NZ1-16560364-31 0.31 | 29 April 2020 | 17| Tolling Strategies |
4.4.2 Assumptions and Options
For the purposes of this analysis it is assumed that a consistent approach to existing toll roads would be
adopted in this corridor, including:
● All toll collection will use the same kind of free-flow electronic toll gantries
● All toll payment methods will be as per the existing toll roads
● Escalation of tolls will be as per the existing toll roads
This means that the following attributes need to be considered in this corridor:
● The toll collection points
● Any associated discounts or caps where there are multiple collections
● Heavy vehicle differential (although it is assumed it would be in the similar ratio of 2-3 times the light
vehicle toll)
● Any time of day differential
4.5 Approach to Corridor Assessment
4.5.1 Corridor Segments
Given the different status of the two section of Ara Tūhono, the assessment has been undertaken in two
parts:
● Part A: Assuming only the Puhoi – Warkworth section is in place
● Part B: Assuming the full corridor between Puhoi and Te Hana is operational
Alternative toll strategies for Part A have been assessed initially for a medium-term horizon (2038).
4.5.2 Toll Tariffs
Various levels of tolls have been explicitly tested.
4.5.3 Vehicle and Time of Day Differentials
For consistency with existing toll roads, the following assumptions have been used for initial modelling:
● Consistent 24/7 tolls
● A heavy vehicle differential of 2 times the light vehicle toll
The inter-regional nature of this corridor indicates that time-varying tolls may not be applicable for longer-
distance strategic trips, however there could be potential Travel Demand Management (TDM) benefits for
tolling some potential commuter movements, such as from Warkworth. This has been considered further in
Section 5.10.
The HCV toll ratio is likely to be driven more by policy decision that technical analysis. While HCVs are likely
to have high willingness-to-pay for tolling, they might also be movements that influence other objectives like
economic growth in Northland.
4.6 Toll Gantry Location Strategies
4.6.1 Access Points and Movements
The key access points and potential movements using the full corridor are indicated in Figure 4-3. In the
short term with Ara Tūhono only extended to Warkworth, the location options are simple as there are only
three 2-way movements in the corridor. With the full corridor in place, there are 12 possible 2-way
movements, making for many more possible combinations of toll collection points.
The following sections consider the potential location strategies for each project.
Puhoi to Wellsford Toll Modelling Assessment | 3821064 | NZ1-16560364-31 0.31 | 29 April 2020 | 18| Tolling Strategies |
Project No Location to/from Location
1 AB C
Puhoi- 2 AB D
Warkworth 3 AB E
4 AB F
5 AB G
6 AB H
7 E F
8 E G
9 E H
10 F G
Warkworth- 11 F H
Te Hana 12 G H
Figure 4-3: Corridor Access Movements
4.6.2 Puhoi-Warkworth
The limited number of corridor access points and movements with only this part of the corridor in place allow
a preliminary assessment of each possible gantry location, as undertaken below in Table 4-2.
Table 4-2: Filtering of Collection Locations (Puhoi-Warkworth)
Potential Discussion Recommended
Collection Point for
Assessment
Existing Toll
gantry at Orewa
All users of the new road must also pass through the existing toll
gantry. Hence an increased toll at this location could be used as
a ‘payment’ for the new section. This could be very cost-effective (only in
and would not impact through traffic, however it would impose an conjunction
additional cost for users going to the Puhoi area, without any with gantries at
significant benefit. This inequity issue is such that this simple Puhoi ramps)
strategy is not recommended. The equity issue could be
addressed by including gantries at Puhoi and applying discounts
to those using the Puhoi Ramps.
Ramp gantries
at Puhoi
On its own this option would duplicate the function of the existing
Orewa gantry. However, it could be used in conjunction with an
increased toll at the existing Orewa gantry to apply discounting to (only in
Puhoi trips. conjunction
Functionally this would be similar to simply adding a new mainline with increased
gantry north of Puhoi. However, it requires the need to have an toll at Orewa)
enhanced toll transaction system that can identify linked trips, but
it could have lower capital costs depending on the relative cost of
mainline versus ramp gantries.
Mainline gantry
north of Puhoi
A new mainline gantry could be used to collect tolls on the new
road without penalising those only going to Puhoi. This gantry
would apply to those using either entry to Warkworth.
Puhoi to Wellsford Toll Modelling Assessment | 3821064 | NZ1-16560364-31 0.31 | 29 April 2020 | 19You can also read